lecture notes on production planning and control iv b. tech ii … · – abc analysis – ved...
TRANSCRIPT
Lecture Notes on
Production Planning and Control
IV B. Tech II semester (JNTUH-R15)
Prepared by
Mr. V. Mahidhar Reddy, Assistant Professor, ME
Mr. M V Aditya Nag, Assistant Professor, ME
DEPARTMENT OF MECHANICAL ENGINEERING
INSTITUTE OF AERONAUTICAL ENGINEERING (Autonomous)
Dundigal, Hyderabad, Telangana 500043
PRODUCTION PLANNING AND CONTROL
UNIT-I
INTRODUCTION : Definition – Objectives of production Planning andControl –
Functions of production planning and control – Elements ofproduction control –
Types of production – Organization of productionplanning and control department –
Internal organization of department – Product design factors – Process Planning
sheet.
UNIT-II
FORECASTING – Importance of forecasting – Types of forecasting,their uses – General principles offorecasting – Forecasting techniques– qualitative methods and quantitive methods.
UNIT-III
INVENTORY MANAGEMENT : Functions of inventories – relevantinventory costs
– ABC analysis – VED analysis – EOQ model – Inventorycontrol systems – P–Systems and Q-Systems.
Introduction to MRP & ERP, LOB (Line of Balance), JIT inventory, andJapanese concepts, Introduction to supply chain management.
UNIT-IV
ROUTING : Definition – Routing procedure – Route sheets – Bill ofmaterial – Factors affecting routing procedure. Scheduling – definition –Difference with loading.
SCHEDULING POLICIES : Techniques, Standard scheduling methods. Line
Balancing, Aggregate planning, Chase planning, Expediting, controllingaspects.
UNIT-V
DISPATCHING : Activities of dispatcher – Dispatching procedure –follow up –
definition – Reason for existence of functions – types of followup, applications of
computer in production planning and control.
TEXT BOOKS:
1. Samuel Eilon, ―Elements of Production
Planning and Control‖, 1st Edition, Universal
Publishing Corp., 1999.
2. Baffa&RakeshSarin, ―Modern Production / OperationsManagement‖, 8th Edition,
John Wiley & Sons, 2002.
2
UNIT 1
INTRODUCTION TO PRODUCTION PLANNING AND CONTROL
Introduction
Production function is that part of an organization, which is concerned with the
transformation of a range of inputs into the required outputs (products) having the requisite
quality level. Production may be understood as ―the step-by-step conversion of one form of
material into another form through chemical or mechanical process to create or enhance the
utility of the product to the user. Thus production is a value addition process.
In any manufacturing enterprise, the main objective of production department is to produce
the things in desired quantity at desired time so that they may be made available to end
users when they demand it. Production, being a very complex process is very difficult to
manage for the people. This includes a large number of activities and operations which need
to be planned appropriately and in turn controlled for the effective production of the output.
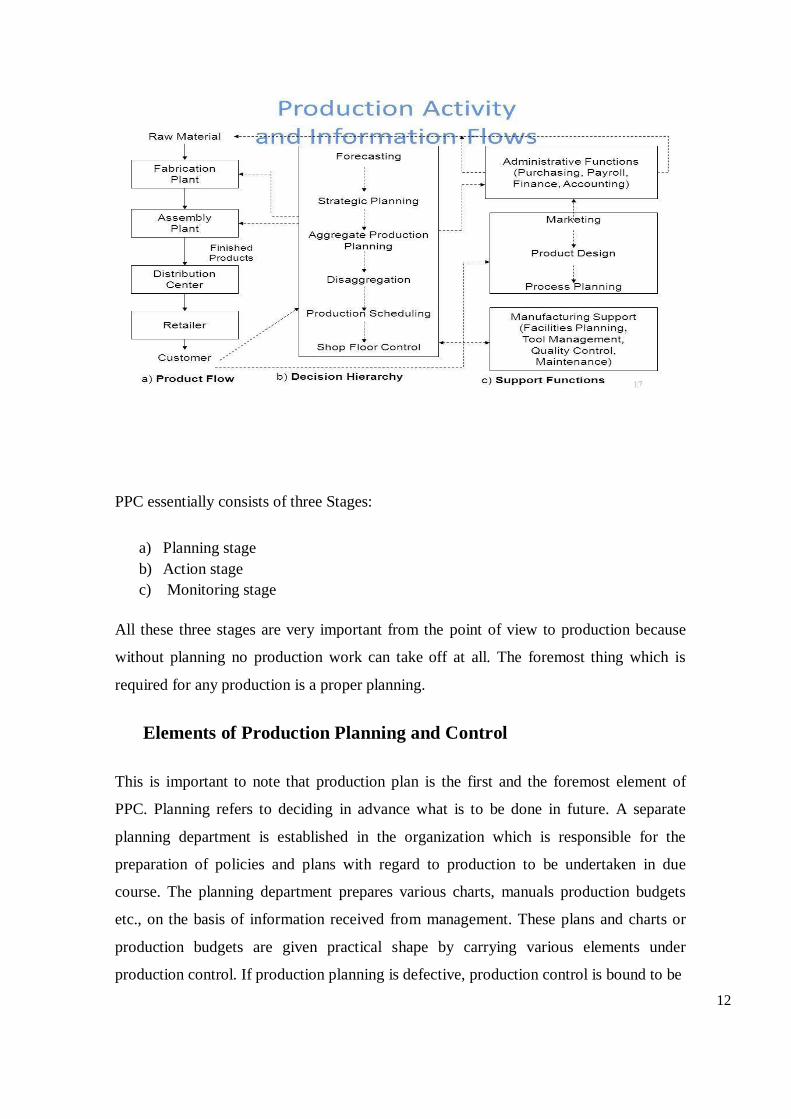
The main purpose of production planning and control (PPC) is to establish routes and
schedules for the work that will ensure the optimum utilization of materials, workers, and
machines and to provide the means for ensuring the operation of the plant in accordance
with these plans.
There are different types of production systems. The choice of production system depends
upon the nature of products, variety of products and volume of products. These production
systems have been discussed in this chapter in detail. Entrepreneurs, after finalizing the
production system to be used are required to go for the production planning and control
(PPC) which essentially depends upon the type of production system.
Production planning and control is necessarily concerned with implementing the plans, i.e.
the detailed scheduling of jobs, assigning of workloads to machines (and people), the
actual flow of work through the system. Production is an organized activity of
converting row materials into useful products. Production system requires the optimal
utilization of natural resources like men, money, machine, materials and time. Production
planning and control coordinate with different departments: such as production,
3
marketing, logistics, warehouse and other departments depending upon the nature of
organization. Production planning and control receives data related to orders from
marketing departments. Production plan based on marketing and production data is prepared
in production planning and control. This production plan provides clear idea about
utilization of manufacturing resources for production. Prepared production plan is delivered
to production department. Production department manufacture products according to that
plan.
The ultimate objective of production planning and control, like that of all other
manufacturing controls, is to contribute to the profits of the enterprise. As with inventory
management and control, this is accomplished by keeping the customers satisfied through
the meeting of delivery schedules.
The main objectives of PPC may be summarized as followings:-
a) It is used to establish target and check the deviations by comparing on some
performance measures.
b) Decides the nature and magnitude of different input factors to produce the output.
c) Coordinates different resources of production system in the most effective and
economic manner and to coordinate among different departments.
d) Elimination of bottleneck
e) Utilization of inventory in the optimal way
f) Smooth flow of material
g) To produce in right quantity and quality at right time
h) Scheduling production activities to meet delivery schedule
i) Expediting the system under production
j) To ensure flexibility in production system to accommodate changes and uncertainty
k) Optimizes the use of resources for minimum overall production cost
l) To ensure the production of right product at right time in right quantity with
specification rightly suited to customers
m) Stable production system, with least chaos, confusion and undue hurry.
This chapter deals in detail with the concept of production planning and control. This will
help the students to understand the PPC to be used for the different types of production
4
systems along with their merits and demerits. This will also make them familiar with
various constraints in PPC.
Meaning of Production As discussed earlier, production refers to the transformation of inputs into finished goods/
or creation of services in order to satisfy the customer needs. This uses different inputs
mainly including 6M‘s namely, man, material, machine, money, method and management.
Production involves application of processes by which the inputs can be transformed into
desired product (output) of potential utility while improving properties and adding
economic values through the best method without compromising on quality.
Different forms of production based on the processes used:
1. Production by extraction or separation: like petrol, kerosene, sugar etc
2. Production by assembly: car, television, furniture
Edwood Buffa defines production as ―a process by which goods and services are created‖
Some examples of production are: manufacturing custom-made products like, boilers with a
specific capacity, constructing flats, some structural fabrication works for selected
customers etc. At each stage of processing, there will be value addition. It is easy to
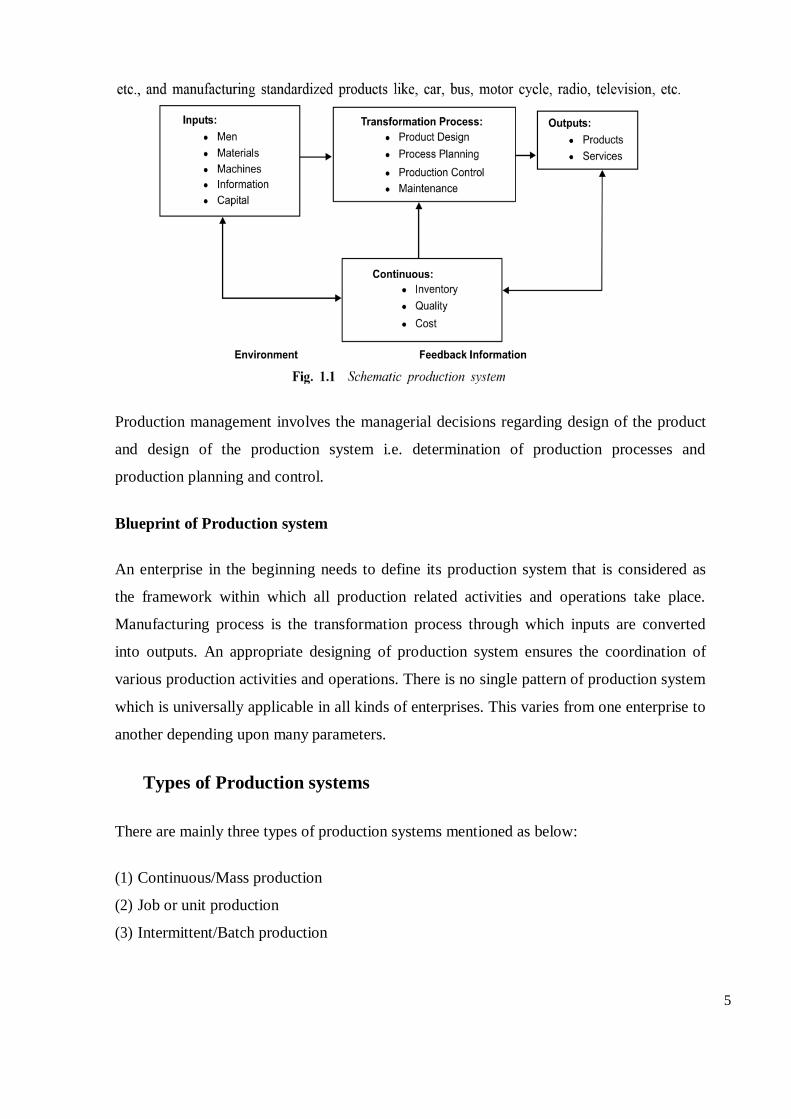
understand a production system from the figure 1.1. There are various inputs which
essentially pass through a transformation/ conversion process and finally converted into
some outputs which have a value for the end users.
The outputs may be in the form of tangible products or services. In nutshell, production
system of an organization is that part, which produces products of an organization. It is that
activity whereby resources, flowing within a defined system, are combined and transformed
in a controlled manner to add value in accordance with the policies communicated by
management. A simplified production system is shown above.
5
Production management involves the managerial decisions regarding design of the product
and design of the production system i.e. determination of production processes and
production planning and control.
Blueprint of Production system
An enterprise in the beginning needs to define its production system that is considered as
the framework within which all production related activities and operations take place.
Manufacturing process is the transformation process through which inputs are converted
into outputs. An appropriate designing of production system ensures the coordination of
various production activities and operations. There is no single pattern of production system
which is universally applicable in all kinds of enterprises. This varies from one enterprise to
another depending upon many parameters.
Types of Production systems
There are mainly three types of production systems mentioned as below:
(1) Continuous/Mass production
(2) Job or unit production
(3) Intermittent/Batch production
6
(1) Continuous/Mass production: It is used when we need to produce standardized
products with a standard set of process and operation sequence in anticipation of
demand. This ensures continuous production of output. It is also termed as mass flow
production or assembly line production. This system results in less work in process
(wip) inventory and high product quality but involves high capital investment in
machinery and equipment. This ensures very high rate of production as we need not to
intervene once the production has begun. The system is appropriate in plants where
large volume of small variety of output is produced. e.g. oil refineries, cement
manufacturing and sugar factory etc.
Characteristics of Continuous/Mass production:
a) As same product is manufactured for sufficiently long time, machines can be laid
down in order of processing sequence.
b) Standard methods and machines are used during part manufacture.
c) Most of the equipment‘s are semi automatic or automatic in nature.
d) Material handling is also automatic (such as conveyors).
e) Semi-skilled workers are normally employed as most of the facilities are automatic.
f) As product flows along a pre-defined line, planning and control of the system is
much easier.
g) Cost of production per unit is very low owing to the high rate of production.
h) In process inventories are low as production scheduling is simple and can be
implemented with ease.
(2) Job or Unit production: It involves production as per customer's specifications. This
ensures the simultaneous production of large number of batches/orders. Each batch or
order comprises of a small lot of identical products and is different from other batches.
It requires comparatively smaller investment in machines and equipment. It is flexible
and can be adapted to changes in product design and order size without much
inconvenience. This system is most suitable where heterogeneous products are produced
against specific orders. In this system products are made to satisfy a specific order.
7
However that order may be produced- only once or at irregular time intervals as and
when new order arrives or at regular time intervals to satisfy a continuous demand.
Characteristics of Job or Unit Production:
a) Machines and methods employed should be general purpose as product changes
are quite frequent.
b) Man power should be skilled enough to deal with changing work conditions.
c) Schedules are actually nonexistent in this system as no definite data is available on
the product. In process inventory will usually be high as accurate plans and
schedules do not exist.
d) Product cost is normally high because of high material and labor costs.
e) Grouping of machines is done on functional basis (i.e. as lathe section, milling
section etc.) This system is very flexible as management has to manufacture
varying product types. Material handling systems are also flexible to meet changing
product requirements.
(3) Intermittent/Batch Production: This is concerned with the production of different
types of products in small quantities usually termed as batches. A batch contains the
similar products but in small quantity. This is used to meet a specific order or to meet a
continuous demand. Batch can be manufactured either- only once or repeatedly at
irregular time intervals as and when demand arise or repeatedly at regular time intervals
to satisfy a continuous demand. Under this system the goods may be produced partly for
inventory and partly for customer's orders. For example, components are made for
inventory but they are combined differently for different customers. e.g. automobile
plants, printing presses, electrical goods plant are examples of this type of
manufacturing.
Characteristics of Intermittent/ Batch Production:
a) As final product is somewhat standard and manufactured in batches, economy of
scale can be availed to some extent.
b) Machines are grouped on functional basis similar to the job shop manufacturing.
8
c) Semi-automatic, special purpose automatic machines are generally used to take
advantage of the similarity among the products.
d) Labor should be skilled enough to work upon different product batches.
e) In process inventory is usually high owing to the type of layout and material
handling policies adopted.
f) Semi-automatic material handling systems are most appropriate in conjunction with
the semi-automatic machines.
In addition to the above, a large number of manufacturing plants include both intermittent
and continuous processes and are classified as composite or combination operations .Such a
plant may have sub assembly departments making parts in a continuous operation, while the
final assembly department works on an intermittent basis.(as in the furniture and custom
packaging industries)
Types of Manufacturing Processes
The above mentioned production systems require different types of manufacturing process
and require different conditions for their working. Selection of manufacturing process is a
strategic decision as any change in the same is very costly and time consuming affair.
Therefore the manufacturing process is selected at the stage of planning a business venture.
This must be selected keeping in view two important parameters (1) meeting the
specification of the final product and (2) to be cost effective.
The manufacturing process is classified into four types.
(i) Jobbing manufacturing process
(ii) Batch manufacturing process
(iii) Mass or flow manufacturing process
(iv) Process type manufacturing process
(i) Jobbing manufacturing process: This is used to produce one or few units of the
products as per the requirement and specification of the customer. Production is to
meet the delivery schedule and costs are fixed prior to the contract made with the
customer.
9
(ii) Batch manufacturing process: This is used to produce limited quantities of each
of the different types of products in the form of batches. These batches of different
products are manufactured on same set of machines. Different batches/products are
produced separately one after the other.
(iii) Mass or flow manufacturing process: This is used to produce a large quantity of
same product at a time that is stocked for sale. All machines and required
equipments are arranged according to the sequence of operations; termed as line
arrangement/flow. This ensures very high rate of production. One line arrangement
can produce only one type of product, therefore, a different line arrangement is
needed for a different product.
(iv) Process type manufacturing process: This is used to produce the products which
need a particular process/definite sequence of operations. E.g. petroleum. In this,
production run is conducted for an indefinite period.
Factors affecting the Choice of Manufacturing Process
Following factors need to be considered before making a choice of manufacturing process.
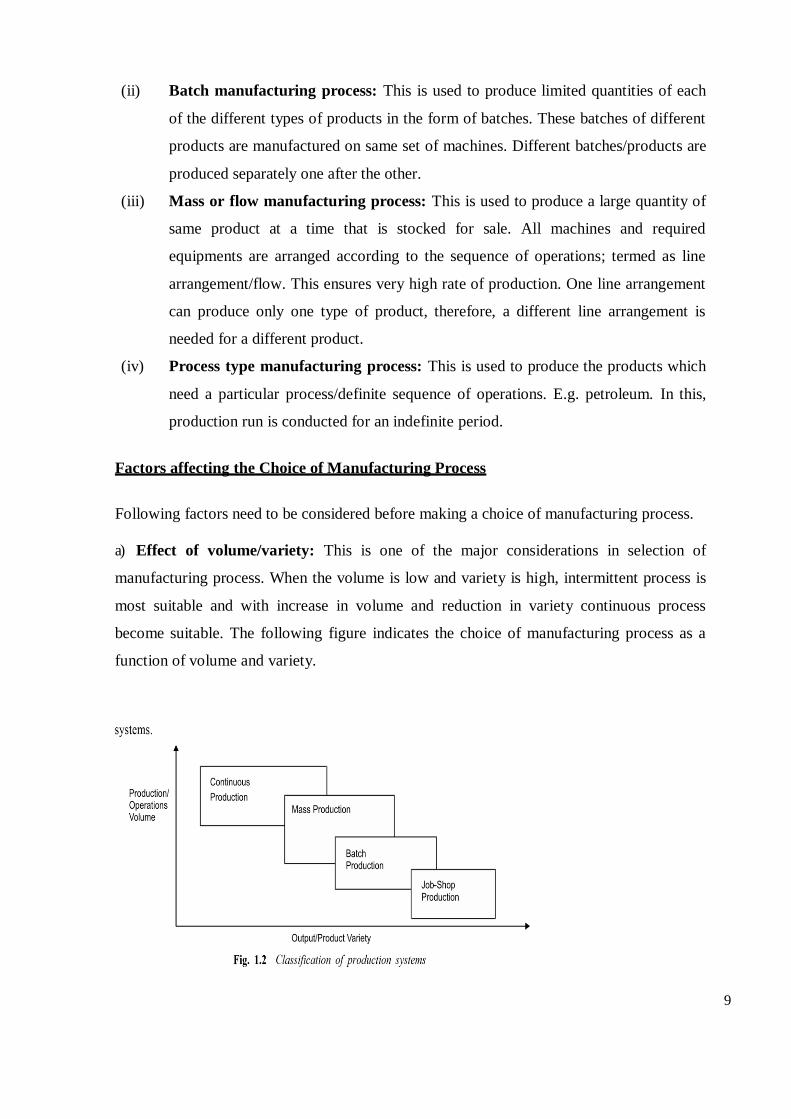
a) Effect of volume/variety: This is one of the major considerations in selection of
manufacturing process. When the volume is low and variety is high, intermittent process is
most suitable and with increase in volume and reduction in variety continuous process
become suitable. The following figure indicates the choice of manufacturing process as a
function of volume and variety.
10
b) Capacity of the plant: Predicted sales volume is the key factor to make a choice
between batch and line process. In case of line process, fixed costs are substantially higher
than variable costs. The reverse is true for batch process thus at low volume it would be
cheaper to install and maintain a batch process and line process becomes economical at
higher volumes.
c) Lead time: The continuous process normally results faster deliveries as compared to
batch process. Therefore lead-time and level of competition certainly influence the choice of
production process.
d) Flexibility and Efficiency: The manufacturing process needs to be flexible enough to
adapt contemplated changes and volume of production should be large enough to lower
costs.
Hence it is very important for entrepreneur to consider all above mentioned factors before
taking a decision pertaining to the type of manufacturing process to be adopted. As far as
Small Scale Enterprises are concerned, they usually adopt batch processes due to less
volume of production and low investment.
Once the entrepreneur has made a final choice pertaining to the product design, production
system and process, his next critical decision is the production and planning control (PPC)
decision.
Meaning of Production Planning and Control:
PPC is a very critical decision which is necessarily required to ensure an efficient and
economical production. Planned production is an important feature of any manufacturing
industry. Production planning and control (PPC) is a tool to coordinate and integrate the
entire manufacturing activities in a production system. This essentially comprises of
planning production before actual production activities start and then exercising control
over those activities sto ensure that the planned production is realized in terms of
quantity, quality, delivery schedule and cost of production.
According to Gorden and Carson, PPC usually involve the organization and planning of
manufacturing process. Principally, it includes entire organization. The various activities
involved in production planning are designing the product, determining the equipment
11
and capacity requirement, designing the layout of physical facilities and material and
material handling system, determining the sequence of operations and the nature of the
operations to be performed along with time requirements and specifying certain
production and quantity and quality levels.
Production planning also includes the plans of routing, scheduling, dispatching
inspection, and coordination, control of materials, methods machines, tools and
operating times. Its ultimate objective is the to plan and control the supply and
movement of materials and labour, machines utilization and related activities, in order to
bring about the desired manufacturing results in terms of quality, quantity, time and
place. This provides a physical system together with a set of operating guidelines for
efficient conversion of raw materials, human skills and other inputs to finished product.
Procedure of Production Planning and Control
The PPC is entirely based on the pre-design format. It attempts to execute and implement
all activities/operations according to the set plan. All operations should be executed in a
proper manner with a close vigil on all facts ensuring that the time period and the
stipulated costs should not go beyond the reach and it should be done under the
excepted/agreed policies. These costs are including the cost of assets, capital cost of the
facility, and labour. The PPC consists of the following steps.
a) Forecasting the demands of the customers for the products and services.
b) In advance preparing the production budget.
c) Design the facility layout.
d) Specify the types of machines and equipment.
e) Appropriate production requirements of the raw materials, labour, and machinery.
f) Drawing the apt schedule of the production.
g) Confirming the shortage or any excess of the end product.
h) Future plans are drawn for any sudden surge in the demand for the product.
i) The rate and scale of production is setup. Which needs to be broken into realistic
time periods and scheduling. The specified job needs to be done in the amount of
time provided so that the production can move to next step.
12
PPC essentially consists of three Stages:
a) Planning stage
b) Action stage
c) Monitoring stage
All these three stages are very important from the point of view to production because
without planning no production work can take off at all. The foremost thing which is
required for any production is a proper planning.
Elements of Production Planning and Control
This is important to note that production plan is the first and the foremost element of
PPC. Planning refers to deciding in advance what is to be done in future. A separate
planning department is established in the organization which is responsible for the
preparation of policies and plans with regard to production to be undertaken in due
course. The planning department prepares various charts, manuals production budgets
etc., on the basis of information received from management. These plans and charts or
production budgets are given practical shape by carrying various elements under
production control. If production planning is defective, production control is bound to be
13
adversely affected. For achieving the production targets, production planning provides
sound basis for production control.
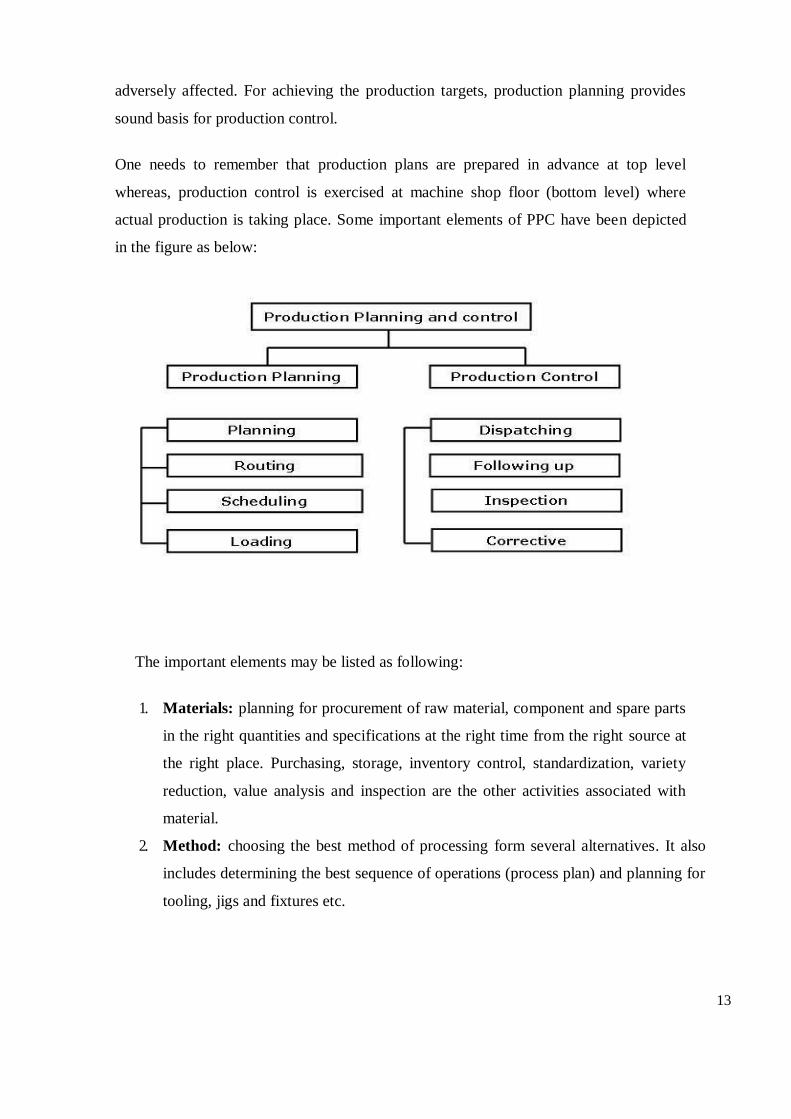
One needs to remember that production plans are prepared in advance at top level
whereas, production control is exercised at machine shop floor (bottom level) where
actual production is taking place. Some important elements of PPC have been depicted
in the figure as below:
The important elements may be listed as following:
1. Materials: planning for procurement of raw material, component and spare parts
in the right quantities and specifications at the right time from the right source at
the right place. Purchasing, storage, inventory control, standardization, variety
reduction, value analysis and inspection are the other activities associated with
material.
2. Method: choosing the best method of processing form several alternatives. It also
includes determining the best sequence of operations (process plan) and planning for
tooling, jigs and fixtures etc.
14
3. Machines and equipment: manufacturing methods are related to production
facilities available in production systems. It involves facilities planning, capacity
planning, allocations, and utilization of plant and equipment, machines etc.
4. Manpower: planning for manpower (labour and managerial levels) having
appropriate skills and expertise.
5. Routing; determining the flow of work material handling in the plant, and sequence
of operations or processing steps. This is related to consideration of appropriate shop
layout plant layout, temporary storage location for raw materials, component and
semi-finished goods, and of materials handling system.
Route Sheet: a route sheet is a document providing information and instructions for
converting the raw material in finished part or product. It defines each step of the
production operations and lay down the precise path or route through which the
product will flow during the conversion process. Route sheet contains following
information:
a) The operation required at their desired sequence
b) Machines or equipment to be used for each operations
c) Estimated set-up time and operation time per piece
d) Tools, jigs, and fixtures required for operations
e) Detailed drawings of the part, sub-assemblies and final assemblies
f) Specification, dimensions, tolerances, surface finishes and quality standard to be
achieved
g) Specification of raw material to be used
h) Speed, feed etc. to be used in machines tools for operations to be carried on.
i) Inspection procedure and metrology tools required for inspection
j) Packing and handling instructions during movement of parts and subassemblies
through the operation stages.
6. Estimating: Establishing operation times leading to fixations of performance
standards both for worker and machines. Estimating involves deciding the quantity
of the product which needs to be produced and cost involved in it on the basis of
sale forecast.
Estimating manpower, machine capacity and material required meeting the
planned production targets are like the key activities before budgeting for resources.
15
7. Loading: machine loading is the process of converting operation schedule into
practices in conjunctions with routing. Machine loading is the process assigning
specific jobs to machines, men, or work centers based on relative priorities and
capacity utilization. Loading ensures maximum possible utilization of productive
facilities and avoid bottleneck in production. It‘s important to either overloading or
under loading the facilities, work centers or machines to ensure maximum utilization
of resources.
8. Scheduling: scheduling ensure that parts and sub-assemblies and finished goods are
completed as per required delivery dates. It provides a timetable for manufacturing
activities.
Purpose of scheduling:
a) To prevent unbalance use of time among work and centers and department.
b) To utilize labour such a way that output is produced within established lead
time or cycle time so as to deliver the products on time and complete
production in minimum total cost.
9. Dispatching: This is concerned with the execution of the planning functions. It
gives necessary authority to start a particular work which has already planned under
routing and scheduling functions. Dispatching is release of orders and instructions
for starting of production in accordance with routing sheet and scheduling charts.
10. Inspection: This function is related to maintenance of quality in production and of
evaluating the efficiency of the processes, methods and labours so that improvement
can be made to achieve the quality standard set by product design.
11. Evaluating: The objective of evaluating is to improve performance. Performance of
machines, processes and labour is evaluated to improve the same.
12. Cost control: Manufacturing cost is controlled by wastage reduction, value analysis,
inventory control and efficient utilization of all resources.
Requirements for an effective Production Planning and Control
16
In an organization, PPC system can be effective only if the following aspects are given
due considerations before implementation:
a) Appropriate organization structure with sufficient delegation of authority and
responsibility at various levels of manpower.
b) Right person should be deputed at right place for right job.
c) Maximum level of standardization of inventory, tooling, manpower, job, workmanship,
equipment, etc.
d) Appropriate management decision for production schedule, materials controls,
inventory and manpower turnover and product mix.
e) Flexible production system to adjust any changes in demand, any problem in
production or availability of materials maintenance requirements, etc
f) Estimation of accurate leads times for both manufacturing and purchase.
g) Management information system should be reliable, efficient and supporting.
h) Capacity to produce should be sufficient to meet the demand.
i) The facility should be responsive enough to produce new products change of products
mix and be able to change the production rates.
The above elements are very important and necessary to make the production planning
system effective and efficient.
Utility of PPC Productions
The implementation of PPC based production system yields various advantages to any
organization for various functional activities, which include the following:
a) Last hour rush is avoided: Production is well planned and controlled as per the
given time schedules. Therefore, production control reduces the number of
emergency order and overtime works on plant and thus reduces the overheads.
b) Problems areas of bottleneck get reduced: The incomplete work or work-in-transit
does not get piled up because production control balances the line and flow of work.
c) Cost reduction: An appropriate production control increases the men-machines
utilization, which maintains in process inventories at a satisfactory level, leads to a
better control on raw material inventories, reduces costs of storage and materials
17
handling, helps in maintaining quality and limits rejections and thus ultimately
reduces the unit cost of production.
d) Optimum utilization of resources: It reduces the time loss of the workers waiting
for materials and makes most effectives use of equipment.
e) Better coordination of plants activities: PPC coordinates the activities of the plant
that leads to control concerted effort by workforce.
f) Benefits to workers: PPC results into better efficiency and productivity, which leads
to adequate wages stable employment, job security, improved working conditions
increased job satisfaction and ultimately high morale.
g) Improved services to customers: PPC leads to better services to the customers as it
ensures production in accordance with the time schedules and therefore, deliveries are
made as per the committed schedules.
Scope of Production Planning and Control
a) Nature of Inputs
To manufacture a product, different types of inputs are used. The quality of the product
depends upon the nature of the inputs are used. Hence the planning is done to
determine the nature of various types of inputs which is a complicated process.
b) Quantity of Inputs
To achieve a level of production, determination of quantity of the inputs and their
composition is very important. A product can be prepared only when there is an
estimate of the required composition of inputs.
c) Proper Coordination
It ensures the proper coordination among the workforce, machines and equipment. This
leads to avoidance of wastages and smooth flow of production.
d) Better Control
18
Production planning is the method of control. For a better control, planning is a
precondition. Only then, one can compare the performance and calculate the deviations
which lead control of the production.
e) Ensure Uninterrupted Production
The planning of materials ensures the regular supply of raw materials and other
components. The regular flow of materials and supplies are helpful in the uninterrupted
production.
f) Capacity Utilization
There is a need to use the available resources effectively. It is helpful in bringing down
various costs of production.
g) Timely Delivered
If there is good production planning and control, there will be timely production and
the finished product will be rushed to the market in time. This also ensures the better
relationship with the customers.
Factors affecting Production Planning and control
a) Use of Computers: Modern factories are using office automation equipment like PC,
punch cards etc. It helps accurate computation of required of men and machine.
b) Seasonal Variations: Demand of certain products is affected by seasons, for instance
umbrellas and raincoats during the monsoons and outputs. Production planning and
control must take such changes into consideration while planning and control
activities of inputs and outputs.
c) Test Marketing: In an aggressive marketing strategy new products are to be test
marketed in order to know the trends. This is a short- cycle operation, intermittent in
nature and often upsets regular production.
d) After Sales Service: This has become an important parameter for success. In after
sales services, many items are returned for repair. These are unscheduled Work and
also overload the production line.
19
e) Losses due to Unpredictable Factors: Losses occur due to accidents, fire and theft of
production inputs, mainly materials and Components. These are unpredictable.
Shortage of input due to such factors upset the planned production schedule in time
and quantity.
f) Losses due to Predictable Factors: There are losses of inputs, due to natural
engineering phenomena like production losses and changes in consumption of
materials and occurrence of defectives.
Summary
Production function in a manufacturing organization is concerned with the transformation
of some inputs into some outputs that have some value for the end users. There are many
types of production systems namely mass, process, batch and job production systems. The
selection of system depends upon mainly two things: i) nature of the product, ii) type of
manufacturing process.
Production planning and control can be viewed as nervous system of the production
operation. This function aims at efficient utilization of material resources, people and
facilities in any undertaking through planning, coordinating and controlling the production
activities that transform the raw material into finished products or components as a most
optimal manner. All the activities in manufacturing or production cycle must be planned,
coordinated, organized and controlling to its objectives. Production planning and control as
a department plays a vital role in manufacturing organizations. It is clear from name that it
is something about planning. Planning is defined as setting goals. Production planning and
control provides different kinds of information to different departments. It provides
information about available manufacturing resources to marketing department. Marketing
department receives orders according to that information. Similarly, it coordinates with
other departments and provides relevant information.
Production planning being a managerial function is mainly concerned with the following
important issues:
a) What production facilities are required?
b) How these production facilities should be laid down in the space available for
production?
20
c) How they should be used to produce the desired products at the desired rate of
production?
Broadly speaking, production planning is concerned with two main aspects: (i) routing or
planning work tasks (ii) layout or spatial relationship between the resources. Production
planning is dynamic in nature and always remains in fluid state as plans may have to be
changed according to the changes in circumstances.
Production control is a mechanism to monitor the execution of the plans. It has several
important functions:
a) Making sure that production operations are started at planned places and planned
times.
b) Observing progress of the operations and recording it properly.
c) Analyzing the recorded data with the plans and measuring the deviations.
d) Taking immediate corrective actions to minimize the negative impact of deviations
from the plans.
e) Feeding back the recorded information to the planning section in order to improve
future plans.
Self assessment Question
a) Discuss the different types of production systems.
b) Explain the parameters that must be considered before finalizing the production
system.
c) ―Effective PPC guarantees better utilization of resources‖. Comment on the
statement with justification.
d) What do you mean by production planning? Discuss its elements.
e) Explain the utility of PPC based production.
2. 0 Key Words
a) Scheduling: is the timetable for manufacturing activities.
b) Estimating: is a process of setting operation times after fixing standards both for
worker and machines
c) Loading: is the process of converting operation schedule into practices
21
d) Routing: is the process of determining the flow of work material handling in the
plant, and sequence of operations
2.1 References
a) Rama Murthy, P., Production and Operations Management, New Age International
Publishers, 2005
b) Chase, R.B., Aquilano, N.J., and Jacobs, F.R., Production and Operations Management:
Manufacturing and Services, Richard D. Irwin, Inc., 1998.
c) Narshimha, S.L., Production Planning and Inventory Control, PHI, 2002
d) Garg, A.K., Production and Operations Management, Mc GrawHill, 2012
e) Chary, S.N., Operations Management, TMH, 1996
f) Baffa and Sarin, R., Modern Production/ Operations Management, John wiley and
Sons,2002
*****
Material Requirements Planning is primarily related to the inventory of raw materials and
components which are required to produce the products in a facility. Their demand is
usually termed as secondary demand that totally depends upon the demand of finished
product. The demand for the finished products is known as primary demand. This primary
demand is ascertained mainly by aggregating the demand from sales orders and forecasted
demand. Then, keeping in view the product structure, secondary demand that is the
demand for the various components and raw materials is ascertained. There are various
techniques which may be used to determine the order lot size for components and raw
materials. MRP is a time phased priority-planning technique that estimates material
requirements and schedules supply to meet demand across all products and parts in one or
more plants. Now- a- days, information technology plays a major role in designing and
implementing Material Requirements Planning systems and processes as it provides
information about manufacturing needs (linked with customer demand) as well as
information about inventory levels. MRP techniques focus on optimizing inventory.
Concept of Material Requirement Planning
Material Requirements Planning is basically concerned with the inventory of raw materials
and components which are required to produce the products in a facility. The demand for
raw materials and components is termed as secondary demand which is essentially
depending upon the demand for the finished products. At current, globalization of the
economy and the liberalization of the trade markets have created new conditions in the
market place which are characterized by turbulence and intensive competition in the
business environment. Competition is continuously growing with respect to price, quality
and selection, service and promptness of delivery. Removal of barriers, international
cooperation, technological innovations naturally cause competition to Intensify. In terms
of manufacturing emphasis is placed on reducing cost while improving quality. In
addition, other factors such as timely delivery of the product become critical (this is
captured by emphasis in Just in Time or JIT in short) techniques.
It is a time phased priority-planning technique that estimates material requirements and
schedules supply to meet demand across all products and parts in one or more plants. MRP
techniques are used to explode bills of material, to compute net material requirements and
plan future production.
Information Technology plays a major role in designing and implementing Material
Requirements Planning systems and processes as it provides information about
manufacturing needs (linked with customer demand) as well as information about
inventory levels. MRP techniques focus on optimizing inventory.
MRP systems mainly use following information to determine what material should be
ordered and when:-
The master production schedule, which describes when each product is scheduled to be
manufactured;
Bill of materials, which lists exactly the parts or materials required to make each
product;
Production cycle times and material needs at each stage of the production cycle time;
Supplier lead -times.
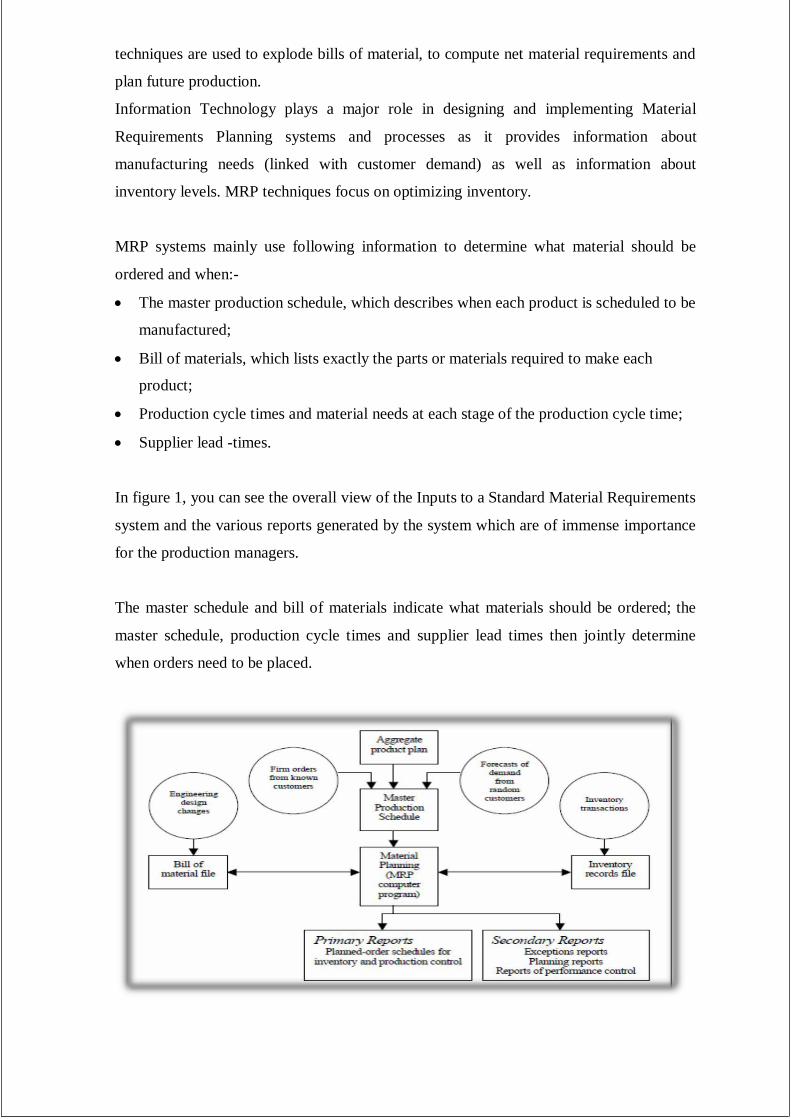
In figure 1, you can see the overall view of the Inputs to a Standard Material Requirements
system and the various reports generated by the system which are of immense importance
for the production managers.
The master schedule and bill of materials indicate what materials should be ordered; the
master schedule, production cycle times and supplier lead times then jointly determine
when orders need to be placed.
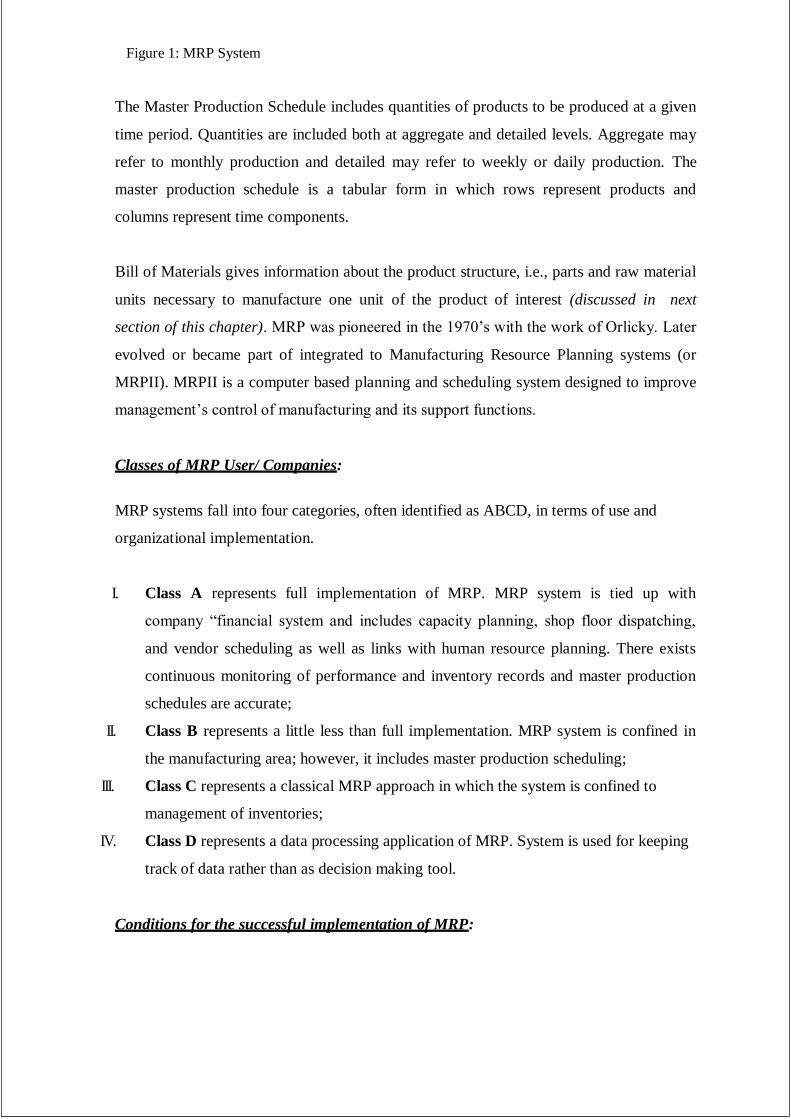
Figure 1: MRP System
The Master Production Schedule includes quantities of products to be produced at a given
time period. Quantities are included both at aggregate and detailed levels. Aggregate may
refer to monthly production and detailed may refer to weekly or daily production. The
master production schedule is a tabular form in which rows represent products and
columns represent time components.
Bill of Materials gives information about the product structure, i.e., parts and raw material
units necessary to manufacture one unit of the product of interest (discussed in next
section of this chapter). MRP was pioneered in the 1970‘s with the work of Orlicky. Later
evolved or became part of integrated to Manufacturing Resource Planning systems (or
MRPII). MRPII is a computer based planning and scheduling system designed to improve
management‘s control of manufacturing and its support functions.
Classes of MRP User/ Companies:
MRP systems fall into four categories, often identified as ABCD, in terms of use and
organizational implementation.
I. Class A represents full implementation of MRP. MRP system is tied up with
company ―financial system and includes capacity planning, shop floor dispatching,
and vendor scheduling as well as links with human resource planning. There exists
continuous monitoring of performance and inventory records and master production
schedules are accurate;
II. Class B represents a little less than full implementation. MRP system is confined in
the manufacturing area; however, it includes master production scheduling;
III. Class C represents a classical MRP approach in which the system is confined to
management of inventories;
IV. Class D represents a data processing application of MRP. System is used for keeping
track of data rather than as decision making tool.
Conditions for the successful implementation of MRP:
MRP is most valuable to companies involved in assembly operations and least valuable to
those in fabrication. For the success of MRP in an organization, some conditions need to
be fulfilled as followings:
Availability of a computer based manufacturing system is a must. Although it is
possible to obtain material requirements plan manually, it would be impossible to keep
it up to date because of the highly dynamic nature of manufacturing environments;
A feasible master production schedule must be drawn up, or else the accumulated
planned orders of components might ―bump‖ into the resource restrictions and become
infeasible;
The bills of material should be accurate. It is essential to update them promptly to
reflect any engineering changes brought to the product. If a component part is omitted
from the bill of material it will never be ordered by the system;
Inventory records should be a precise representation of reality, or else the netting
process and the generation of planned orders become meaningless;
Lead times for all inventory items should be known and given to the MRP system;
Shop floor discipline is necessary to ensure that orders are processed in conformity
with the established priorities. Otherwise, the lead times passed to MRP will not
materialize.
Inputs and outputs in MRP System
Inputs to MRP Programme:
Product Demand- Product demand for end items stems from two main reasons. The first
is known customers who have placed specific orders, such as those generated by sales
personnel, or from interdepartmental transactions. The second source is forecast demand.
Demand from known customers and demand forecast are combined and become the input
to the master production schedule.
Bill of Materials (BOM) File- BOM file is a document which tells us about an items
product structure and also it tells us about the sequence in which components are
assembled and their required number. It also tells us about the workstations in which it is
assembled. Bill of Materials gives information about the product structure, i.e., parts and
raw material units necessary to manufacture one unit of the product of interest
p
A
C (2) B (1)
X
g. 41
C (2)
B (1)
Y (1)
A (2)
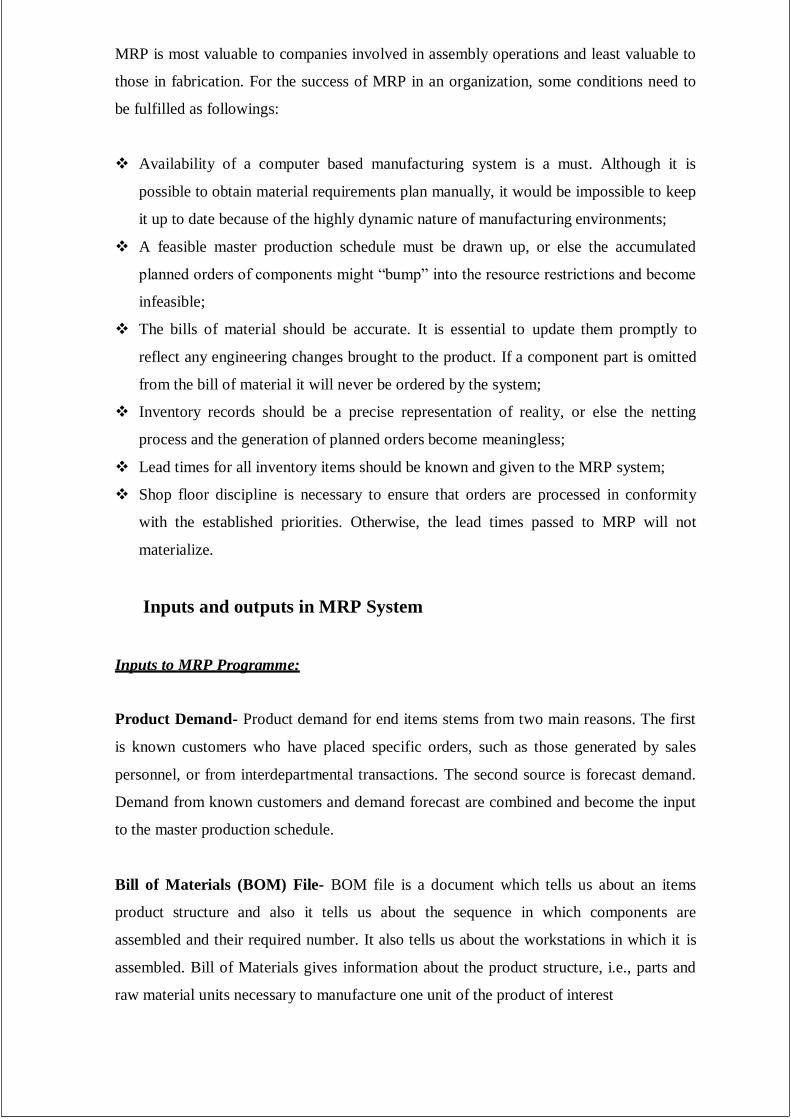
Product structure
Product structure shows a product build up. Its shows diagrammatically the components
required to assemble it, their numbers, and the sequence of assembly. Example: A sub
assembly A is made by joining one unit of components B and two units of components C
(shown below). Therefore, if 100 units of sub assembly A are to be manufactured 100
units of component B and 200 units of components of C are required.
Sub assembly
Components
Product structure of sub-assembly A
From the above figure, we see that the requirement of components B and C depends on the
requirements of sub assembly A. The requirement of sub assembly A, in turn may depends
on the requirement of the finished products X.
Product Structure of Product X
Finished product Level 0
Sub assembly
Components Level 1
pg. 42
Q (2)
P (1)
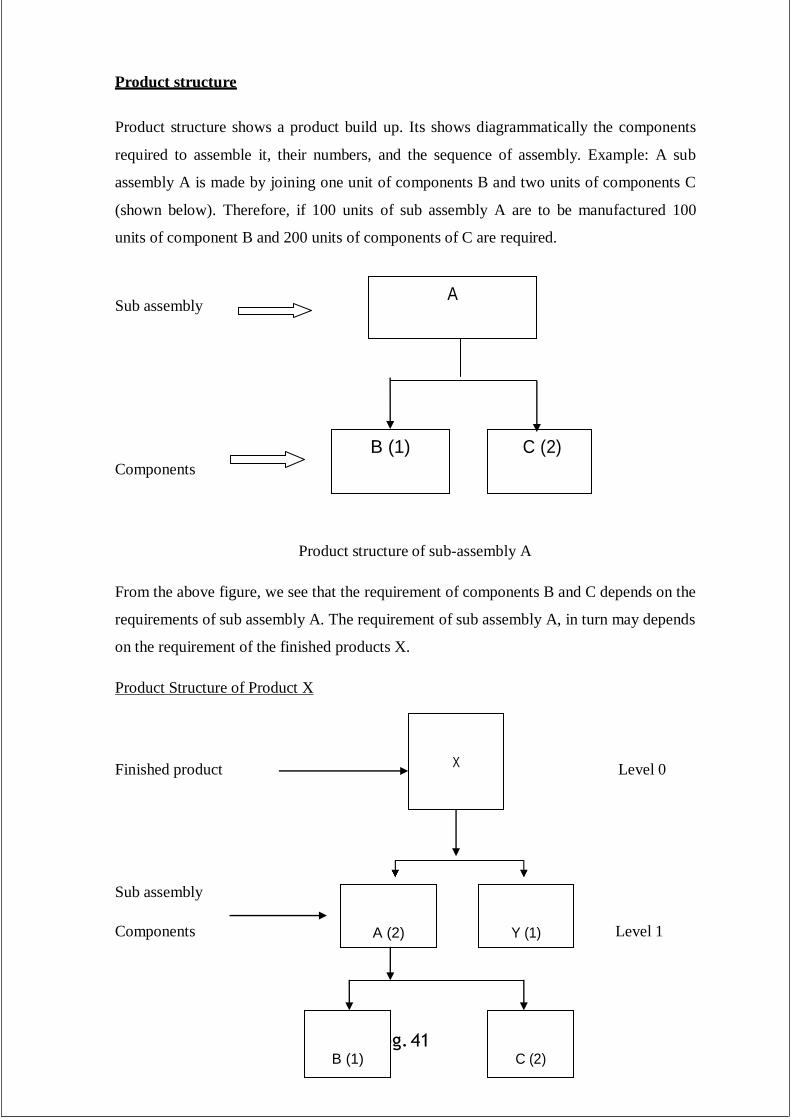
Components Level 2
Now if 100 units of products X are to be manufactured, the following would be required
Sub assemblies/components Number of units
Y 1 x no. of units of X =1x100=100
A 2x no. of units of X =2x100 =200
B 1x no. of units of A =1x200 =200
C 2x no. of units of A = 2x200=400
The BOM file is often called the product structure file or product tree because it shows
how a product is put together. It contains the information to identify each item and the
quantity used per unit of the item of which it is a part.
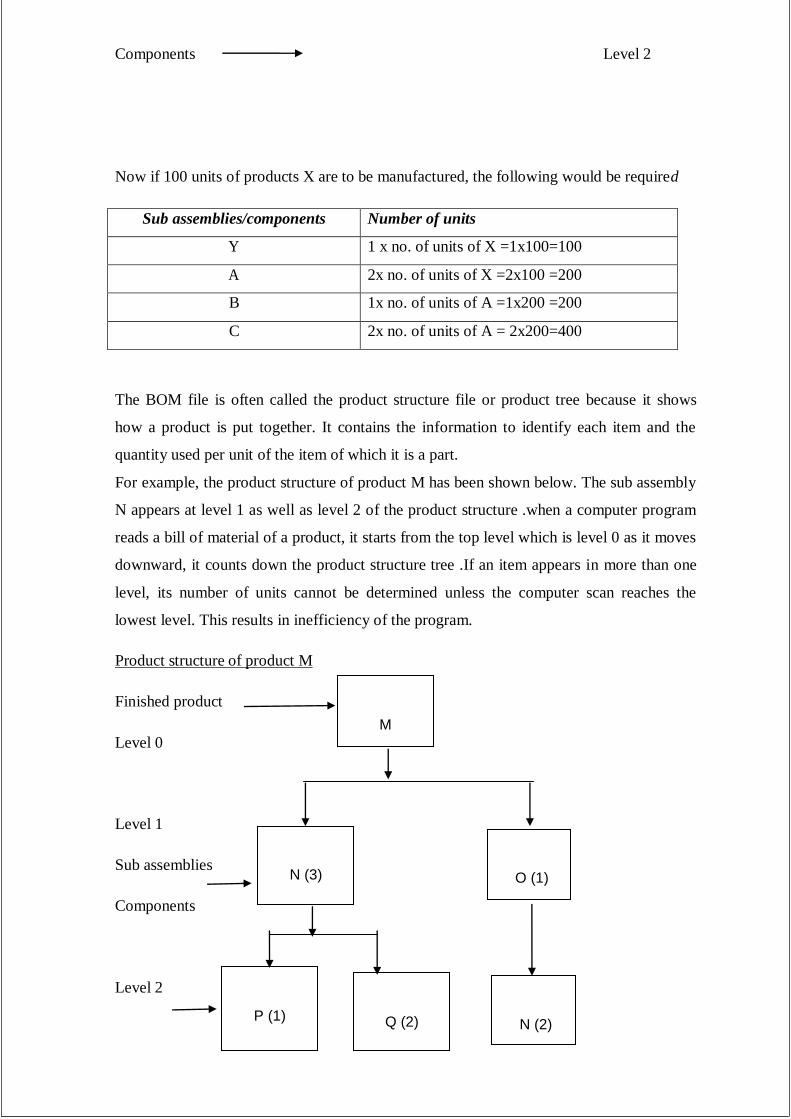
For example, the product structure of product M has been shown below. The sub assembly
N appears at level 1 as well as level 2 of the product structure .when a computer program
reads a bill of material of a product, it starts from the top level which is level 0 as it moves
downward, it counts down the product structure tree .If an item appears in more than one
level, its number of units cannot be determined unless the computer scan reaches the
lowest level. This results in inefficiency of the program.
Product structure of product M
Finished product
Level 0
Level 1
Sub assemblies
Components
Level 2
N (2)
O (1)
N (3)
M
Components
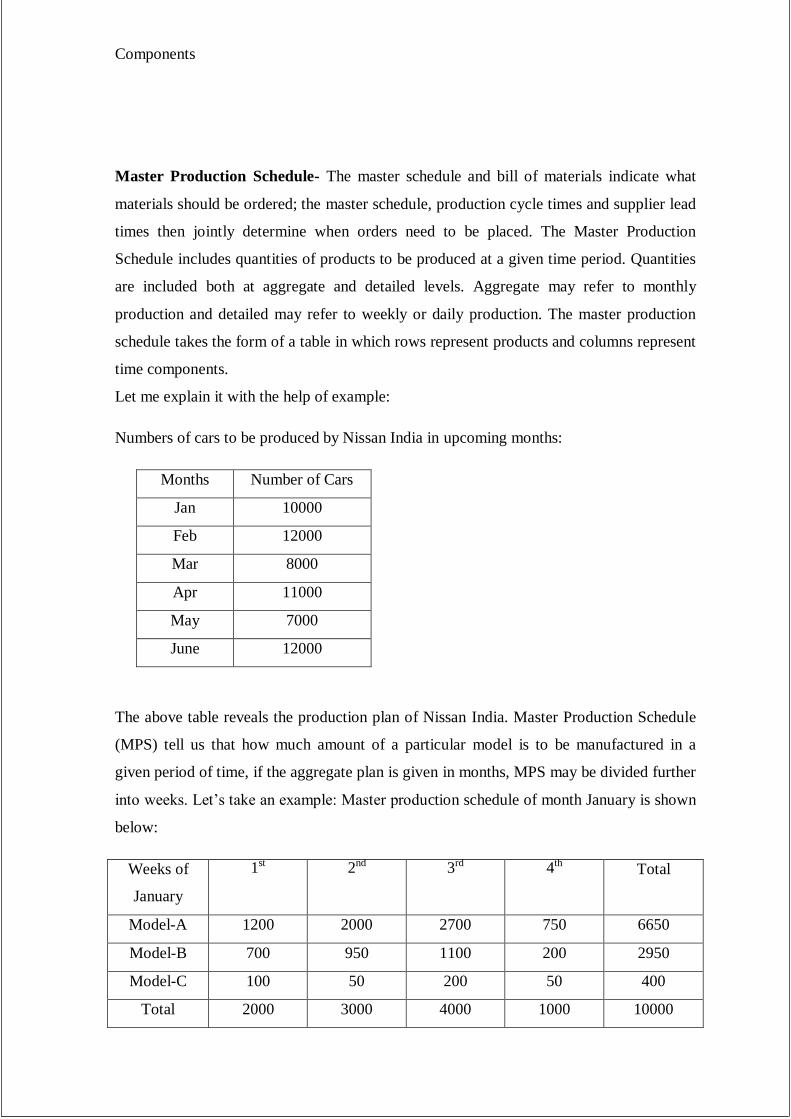
Master Production Schedule- The master schedule and bill of materials indicate what
materials should be ordered; the master schedule, production cycle times and supplier lead
times then jointly determine when orders need to be placed. The Master Production
Schedule includes quantities of products to be produced at a given time period. Quantities
are included both at aggregate and detailed levels. Aggregate may refer to monthly
production and detailed may refer to weekly or daily production. The master production
schedule takes the form of a table in which rows represent products and columns represent
time components.
Let me explain it with the help of example:
Numbers of cars to be produced by Nissan India in upcoming months:
Months Number of Cars
Jan 10000
Feb 12000
Mar 8000
Apr 11000
May 7000
June 12000
The above table reveals the production plan of Nissan India. Master Production Schedule
(MPS) tell us that how much amount of a particular model is to be manufactured in a
given period of time, if the aggregate plan is given in months, MPS may be divided further
into weeks. Let‘s take an example: Master production schedule of month January is shown
below:
Weeks of
January
1st 2nd 3rd 4th Total
Model-A 1200 2000 2700 750 6650
Model-B 700 950 1100 200 2950
Model-C 100 50 200 50 400
Total 2000 3000 4000 1000 10000
Further, the above MPS can also contain information on sub models of a model, e.g., in a
given week how many Model-1 will be produced with power steering and how many with
power windows and so on.
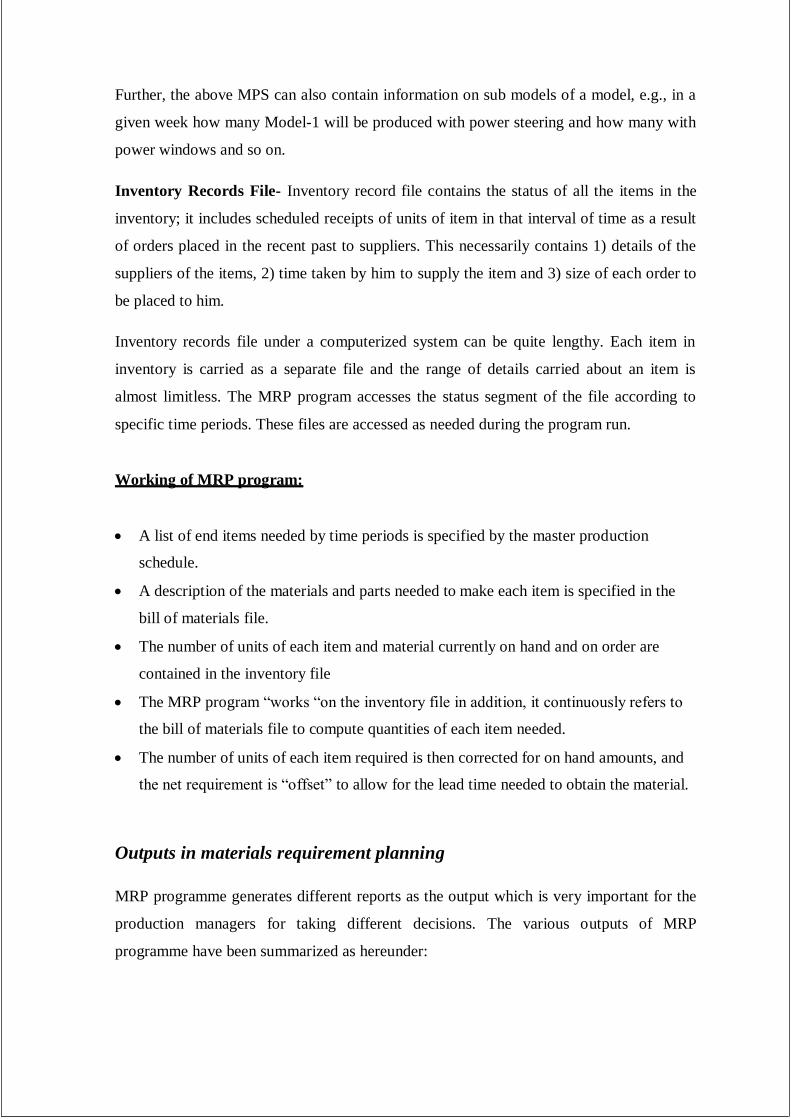
Inventory Records File- Inventory record file contains the status of all the items in the
inventory; it includes scheduled receipts of units of item in that interval of time as a result
of orders placed in the recent past to suppliers. This necessarily contains 1) details of the
suppliers of the items, 2) time taken by him to supply the item and 3) size of each order to
be placed to him.
Inventory records file under a computerized system can be quite lengthy. Each item in
inventory is carried as a separate file and the range of details carried about an item is
almost limitless. The MRP program accesses the status segment of the file according to
specific time periods. These files are accessed as needed during the program run.
Working of MRP program:
A list of end items needed by time periods is specified by the master production
schedule.
A description of the materials and parts needed to make each item is specified in the
bill of materials file.
The number of units of each item and material currently on hand and on order are
contained in the inventory file
The MRP program ―works ―on the inventory file in addition, it continuously refers to
the bill of materials file to compute quantities of each item needed.
The number of units of each item required is then corrected for on hand amounts, and
the net requirement is ―offset‖ to allow for the lead time needed to obtain the material.
Outputs in materials requirement planning
MRP programme generates different reports as the output which is very important for the
production managers for taking different decisions. The various outputs of MRP
programme have been summarized as hereunder:
(1) Primary Reports - Primary reports are the main or normal reports used for the
inventory and production control. These report consist of
(a) Planned orders to be released at a future time;
(b) Order release notices to execute the planned orders;
(c) Changes in due dates of open orders due to rescheduling;
(d) Cancellations or suspensions of open orders due to cancellation or suspension of
orders on the master production schedule;
(e) Inventory status data.
(2) Secondary Reports - Additional reports, which are optional under the MRP system,
fall into three main categories:
(a) Planned Order Report- Planned order report tells us about the planned orders
that would be released in future date or during a given interval of time. This report
helps in preparing the funds required for payments to the suppliers in the future
according to the dates and order sizes.
For instance, April is the current month and the finance manager wants to see
what quantities of raw material have to be made available in the month of May.
This report helps him very much in preparing report that what amount of fund is
required in May for making payments to the suppliers.
(b) Order Release Report- Order release report is that which gives information
about planned orders which would be released on the present date .IT helps the
purchase managers to release purchase orders purchase orders to the suppliers.
This report helps the purchase manager to keep track of the purchase order that
have to be sent on a particular day. The material requirement planning logic
makers use of the lead time of items in determining the release date of orders, so
that goods are supplied by the time the items are required for production.
(c) Order Changes Report- These refer to the orders which have been placed in the
past and the supplier of these items is preparing for these supplies to be made to
the company. During the lead time the material requirement planning may
fluctuate because some customers cancel their orders leading to revision of the
mps because of this change in demand open orders have to revise.
In this case: Suppliers are told either to cancel the order s placed earlier by the company or
to postpone them for some time or to reduce the order size to suit the current requirement.
The order change report provides information to purchase manager about all such changes
to be made in the open orders with the suppliers.
Calculation of Order Size in MRP
There are 4 methods of calculating the order size in MRP
Lot for lot method
Economic Order Quantity (EOQ) method
Least total cost method
Least unit cost method
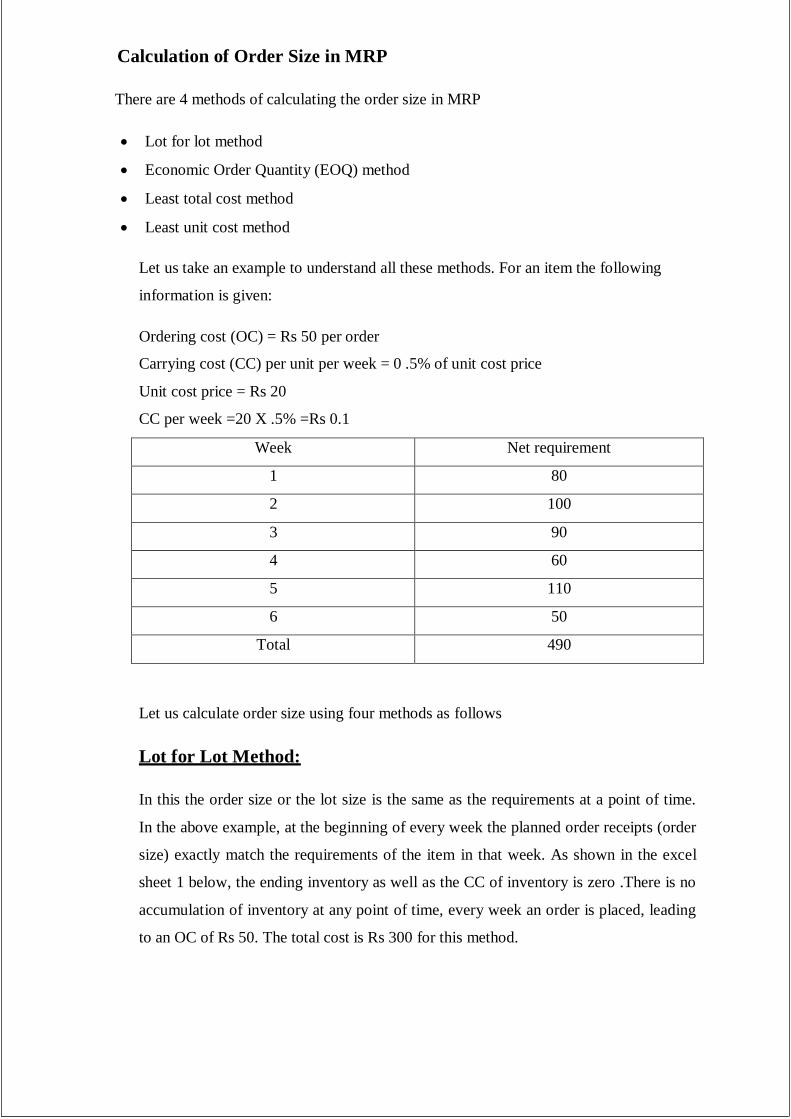
Let us take an example to understand all these methods. For an item the following
information is given:
Ordering cost (OC) = Rs 50 per order
Carrying cost (CC) per unit per week = 0 .5% of unit cost price
Unit cost price = Rs 20
CC per week =20 X .5% =Rs 0.1
Week Net requirement
1 80
2 100
3 90
4 60
5 110
6 50
Total 490
Let us calculate order size using four methods as follows
Lot for Lot Method:
In this the order size or the lot size is the same as the requirements at a point of time.
In the above example, at the beginning of every week the planned order receipts (order
size) exactly match the requirements of the item in that week. As shown in the excel
sheet 1 below, the ending inventory as well as the CC of inventory is zero .There is no
accumulation of inventory at any point of time, every week an order is placed, leading
to an OC of Rs 50. The total cost is Rs 300 for this method.
2Ao
C
2 X 4246.667 X50
5.2
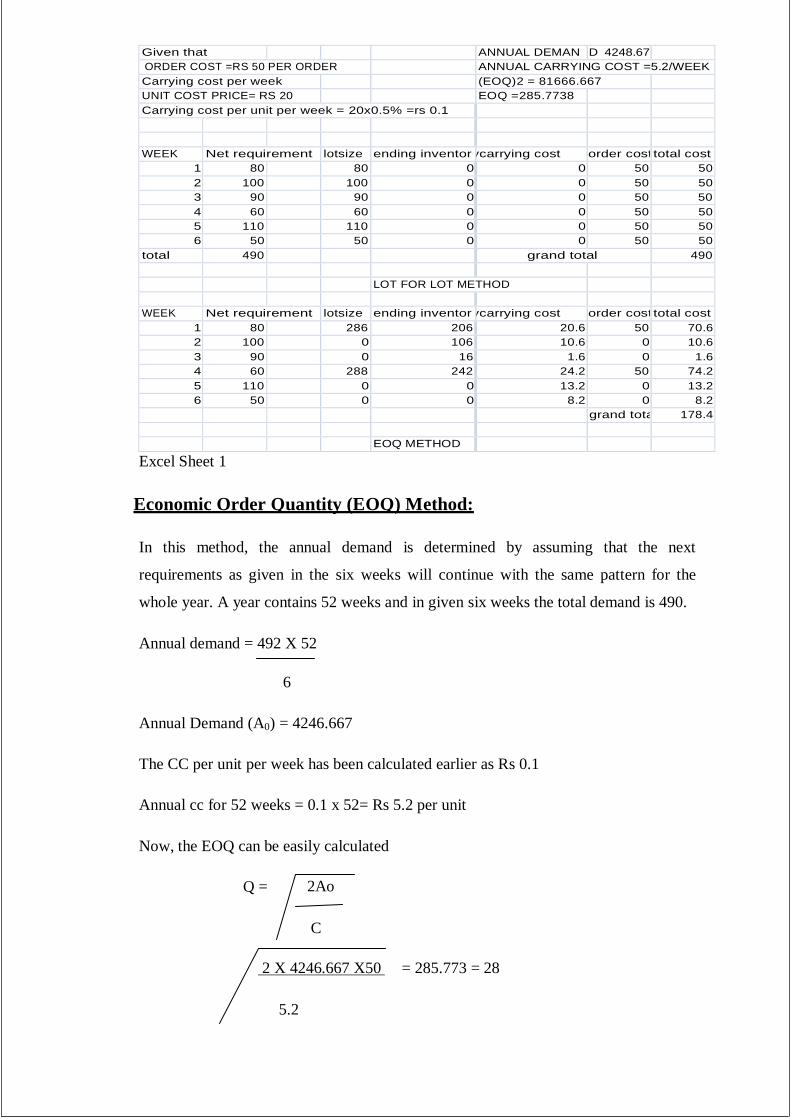
Given that ANNUAL DEMAN D 4248.67
ORDER COST =RS 50 PER ORDER ANNUAL CARRYING COST =5.2/WEEK
Carrying cost per week (EOQ)2 = 81666.667
UNIT COST PRICE= RS 20 EOQ =285.7738
Carrying cost per unit per week = 20x0.5% =rs 0.1
WEEK Net requirement lotsize ending inventor ycarrying cost order cost total cost
1 80 80 0 0 50 50
2 100 100 0 0 50 50
3 90 90 0 0 50 50
4 60 60 0 0 50 50
5 110 110 0 0 50 50
6 50 50 0 0 50 50
total 490 grand total 490
LOT FOR LOT METHOD
WEEK Net requirement lotsize ending inventor ycarrying cost order cost total cost
1 80 286 206 20.6 50 70.6
2 100 0 106 10.6 0 10.6
3 90 0 16 1.6 0 1.6
4 60 288 242 24.2 50 74.2
5 110 0 0 13.2 0 13.2
6 50 0 0 8.2 0 8.2
grand tota 178.4
EOQ METHOD
Excel Sheet 1
Economic Order Quantity (EOQ) Method:
In this method, the annual demand is determined by assuming that the next
requirements as given in the six weeks will continue with the same pattern for the
whole year. A year contains 52 weeks and in given six weeks the total demand is 490.
Annual demand = 492 X 52
6
Annual Demand (A0) = 4246.667
The CC per unit per week has been calculated earlier as Rs 0.1
Annual cc for 52 weeks = 0.1 x 52= Rs 5.2 per unit
Now, the EOQ can be easily calculated
Q =
= 285.773 = 28
This implies that an order of 286 units only must be placed every time. In above figure the
first planned order receipt of 286 units is in week 1.the net requirements in week 1 is only
80 units .Hence, the excess of 206 units forms the closing inventory, for which the CC will
be Rs 20.6(206 X .1). The OC in week 1 is Rs 50 .The inventory keeps on decreasing and
in week 3 it reduces to just 16 units .Thus , at the beginning of week 4, an order of 286
units is again placed to receive these immediately (assuming zero lead time).
The total cost in this method is Rs 178.4.
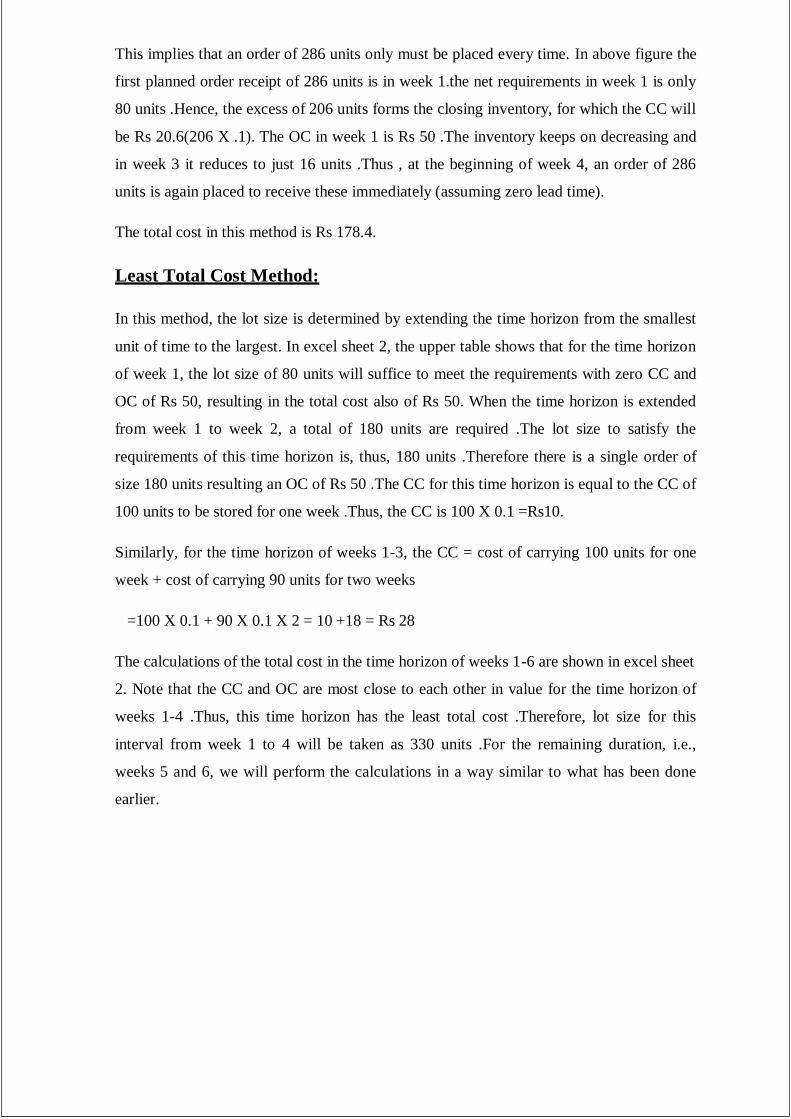
Least Total Cost Method:
In this method, the lot size is determined by extending the time horizon from the smallest
unit of time to the largest. In excel sheet 2, the upper table shows that for the time horizon
of week 1, the lot size of 80 units will suffice to meet the requirements with zero CC and
OC of Rs 50, resulting in the total cost also of Rs 50. When the time horizon is extended
from week 1 to week 2, a total of 180 units are required .The lot size to satisfy the
requirements of this time horizon is, thus, 180 units .Therefore there is a single order of
size 180 units resulting an OC of Rs 50 .The CC for this time horizon is equal to the CC of
100 units to be stored for one week .Thus, the CC is 100 X 0.1 =Rs10.
Similarly, for the time horizon of weeks 1-3, the CC = cost of carrying 100 units for one
week + cost of carrying 90 units for two weeks
=100 X 0.1 + 90 X 0.1 X 2 = 10 +18 = Rs 28
The calculations of the total cost in the time horizon of weeks 1-6 are shown in excel sheet
2. Note that the CC and OC are most close to each other in value for the time horizon of
weeks 1-4 .Thus, this time horizon has the least total cost .Therefore, lot size for this
interval from week 1 to 4 will be taken as 330 units .For the remaining duration, i.e.,
weeks 5 and 6, we will perform the calculations in a way similar to what has been done
earlier.
weeks lot size carrying cost order cost total cost
1 60 0 50 50
1 to 2 180 10 50 60
1 to 3 270 29 50 78
1to 4 330 46 50 96 least total cost
1 to 5 440 90 50 140
1 to6 490 115 50 165
5 110 0 50 50
5to 6 160 5 50 55 least total cost
week net req. lot size encoding inventory carrying cost order cost total cost
1 80 330 250 25 50 75
2 100 0 150 15 0 15
3 90 0 60 6 0 6
4 60 0 0 0 0 0
5 110 160 50 5 50 55
6 90 0 0 0 0 0
total 151
last total cost method
Excel Sheet 2
First, consider only weeks 5-6, for which the CC and OC are Rs 5 and Rs 50, respectively.
Clearly for weeks 5-6, the CC and OC values are nearer to each other compared to week 5
alone. Therefore, the least cost lot size is 160.
In excel sheet 2, the second table shows the usual total cost calculations, when the second
order of 160 units is placed at the beginning of week 1, while the second order of 160 units
is placed at the beginning of week 5, the total cost of this method is Rs 151.
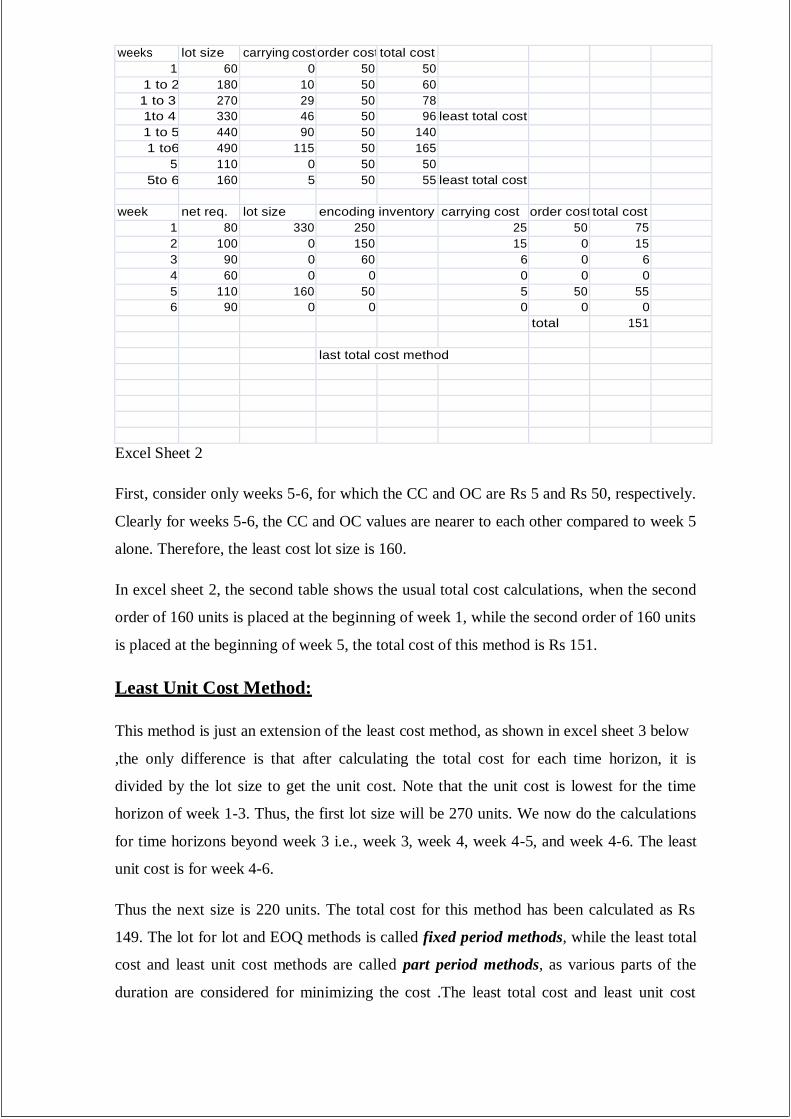
Least Unit Cost Method:
This method is just an extension of the least cost method, as shown in excel sheet 3 below
,the only difference is that after calculating the total cost for each time horizon, it is
divided by the lot size to get the unit cost. Note that the unit cost is lowest for the time
horizon of week 1-3. Thus, the first lot size will be 270 units. We now do the calculations
for time horizons beyond week 3 i.e., week 3, week 4, week 4-5, and week 4-6. The least
unit cost is for week 4-6.
Thus the next size is 220 units. The total cost for this method has been calculated as Rs
149. The lot for lot and EOQ methods is called fixed period methods, while the least total
cost and least unit cost methods are called part period methods, as various parts of the
duration are considered for minimizing the cost .The least total cost and least unit cost
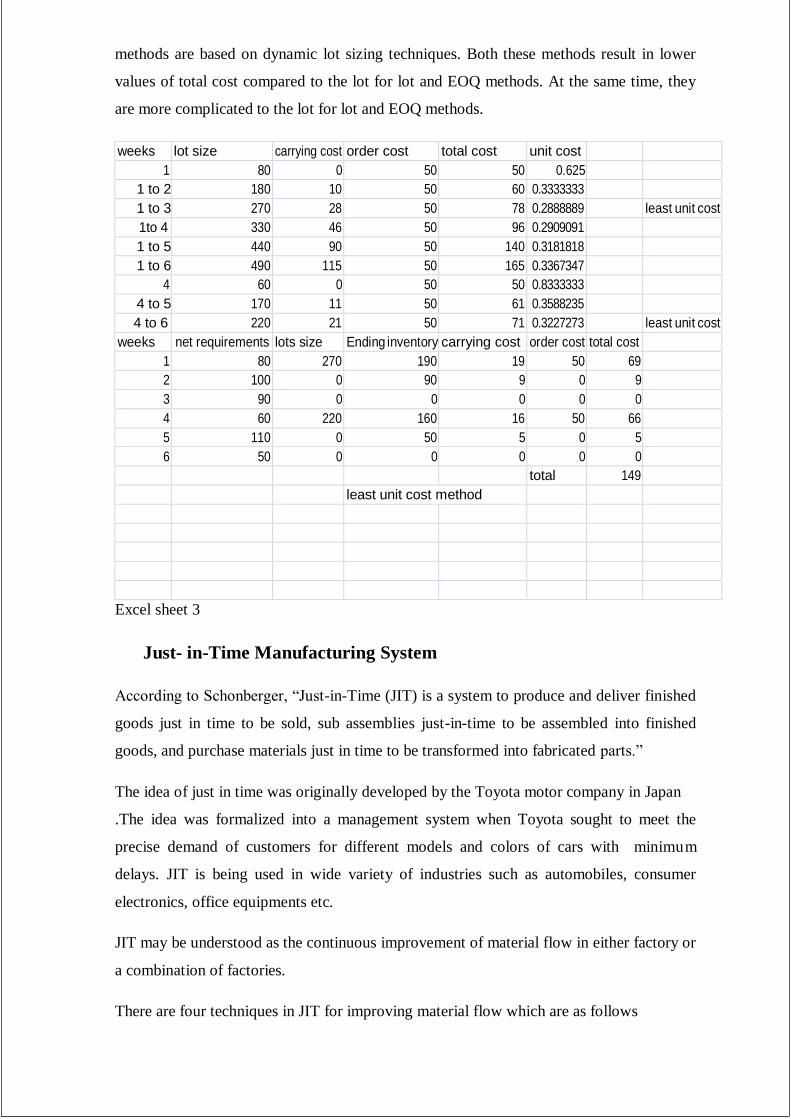
methods are based on dynamic lot sizing techniques. Both these methods result in lower
values of total cost compared to the lot for lot and EOQ methods. At the same time, they
are more complicated to the lot for lot and EOQ methods.
weeks lot size carrying cost order cost total cost unit cost
1 80 0 50 50 0.625
1 to 2 180 10 50 60 0.3333333
1 to 3 270 28 50 78 0.2888889 least unit cost
1to 4 330 46 50 96 0.2909091
1 to 5 440 90 50 140 0.3181818
1 to 6 490 115 50 165 0.3367347
4 60 0 50 50 0.8333333
4 to 5 170 11 50 61 0.3588235
4 to 6 220 21 50 71 0.3227273 least unit cost
weeks net requirements lots size Ending inventory carrying cost order cost total cost
1 80 270 190 19 50 69
2 100 0 90 9 0 9
3 90 0 0 0 0 0
4 60 220 160 16 50 66
5 110 0 50 5 0 5
6 50 0 0 0 0 0
total 149
least unit cost method
Excel sheet 3
Just- in-Time Manufacturing System
According to Schonberger, ―Just-in-Time (JIT) is a system to produce and deliver finished
goods just in time to be sold, sub assemblies just-in-time to be assembled into finished
goods, and purchase materials just in time to be transformed into fabricated parts.‖
The idea of just in time was originally developed by the Toyota motor company in Japan
.The idea was formalized into a management system when Toyota sought to meet the
precise demand of customers for different models and colors of cars with minimum
delays. JIT is being used in wide variety of industries such as automobiles, consumer
electronics, office equipments etc.
JIT may be understood as the continuous improvement of material flow in either factory or
a combination of factories.
There are four techniques in JIT for improving material flow which are as follows
Factory layout revision
Set up time reduction
Pull system implementation
Better coordination with suppliers
Factory Layout Revision
The layout of factories can be revised to introduce assembly lines and manufacturing cells
.sometimes called continuous flow manufacturing, the purpose of these layout
modifications is to minimize material handling activities and their associated transactions
and to provide faster quality feedback .Assembly lines are typically dedicated to a
particular product type, although they may be able to produce multiple models.
Manufacturing cells produce a variety of completed parts and the cells are developed using
group technology .often in order to have the capability to handle certain surges in demand,
excess capacity is built into the system.
Set-up Time Reduction
Factories can reduce set up times in order to reduce lot sizes and smooth production.
Reduced set up times enables a factory to produce smaller lot sizes economically. Smaller
lot sizes enable a factory to produce a broader variety of products, assemblies and parts
each day .However, preventive maintenance and lowering defects rates are also needed to
achieve these lower safety stock sizes.
Pull System Implementation
In a pull system, final assembly lines only produce actual orders and kanban cards are
used to signal sub assembly and part deliveries, and production.MRP may be used and
smooth production facilitates the use of a pull system.
Better coordination with suppliers
Factories can work with suppliers to reduce raw material inventories and solve quality
problems. The first three techniques are applicable to the suppliers as well, for improving
the material flow between a firm and its supplier‘s. The goal is to make the supplier an
extension of the internal material flows, to avoid the problems associated with shifting of
inventories from customers to suppliers.
Kanban Visual Systems
Kanban is a Japanese word that means flag or signal, and is a visual aid to convey the
message that action is required. The kanban inventory control system was originally
introduced by the Toyota motor company in Japan. On a visit to the USA, Toyota‘s Vice
President Taiichi Ohno noticed the technique, adapted by American supermarkets for
replenishing empty shelves in racks .Whenever a shelf was found drained of a product, it
triggered the replenishment of the product to the shelf. It was so simple because an empty
shelf was easily visible among the other shelves full of products. Ohno thought of
implementing the same idea for replenishment at his assembly lines. He adapted this
simple but effective method by using a trigger or kanban, to alert the manufacturing area
that the assembly area was running low on components. Every component must have its
own kanban to signal when it needs to be replenished.
The kanban system can be explained in the following stages:
Stage 1
When a worker needs components, he goes to the racks placed opposite his workstation.
These racks contain bins of components required by a workstation, which from the work
in process inventory. Every bin has the requisition kanban card affixed on it, which is
removable .This card contains the component name, its identification number, and the rack
number and shelf on the rack in the store where more bins of the component are stored.
The workers from the assembly line remove the kanban card from the bin, hang it on a
hook on the rack, and take away the bin to their workstation for using the components in
assembly operations. These hanging kanban cards are thus clearly visible from
everywhere, signaling replenishment of components from the store.
Stage 2
A supply worker called ―Mizosomashi” in Japanese keeps on moving in the aisle or the
passage way across the racks his trolley. When he reaches the racks opposite the assembly
line, he removes all the hanging requisition kanban cards and the empty bins from the
racks. He then takes these along with him through the aisle to the racks in the store
opposite the manufacturing cells.
Stage 3
Mizosomashi looks at the information on each requisition kanban card and locates the
position of the rack and the shelf on the rack containing the bins full of a particular
component .Every bin in the store has the production kanban card affixed on it, which is
removable. The production kanban card contains the name and identification number of
the component to be manufactured in the cell. Mizosomashi takes off the bins from the
racks corresponding to the requisition kanban card he had bought with him, and removes
the production kanban card from these. He hangs these on the hooks on the corresponding
racks in the store, attaches the requisition kanban cards on the bins, and puts the bins in the
trolley to the racks opposite the assembly line and places the bins in the appropriate racks.
Thus, the replenishment of the bins at the assembly line has taken place. Mizosomashi
repeats this process at regular intervals of time.
Stage 4
One worker from each of the manufacturing cells goes to the rack placed opposite his cell
with his trolley. He removes the hanging production kanban cards and places the empty
bins from the rack in his trolley. He takes these to his manufacturing cell, where the
different components mentioned on the production kanban cards are manufactured in exact
quantities so as to fill the empty bins completely. The filled in bins with the production
kanban cards attached to them are then taken from the manufacturing cell to the rack
opposite the cell and placed on the appropriate shelf mentioned in the production kanban
card.
JIT is a pull system, as opposed to the western norm of making bulk components and
storing them just in case they are needed. The obvious benefits of using the kanban system
are reduced inventory and less storage space required; however, the hidden benefit is the
high quality of components. Production of components in small batches makes it easier to
immediately detect defects in them. Thus reduced inventory acts as a buffer against bad
quality.
Benefits of MRP System
MRP system is of immense importance in manufacturing organizations. The key benefits
have been summarized as below:
Reduced inventories without reduced customer
service
Ability to track material requirements
Ability to evaluate capacity requirements
Means of allocating production time
Increased customer satisfaction due to meeting
delivery schedules
Faster response to market changes
Improved labor and equipment utilization
Better inventory planning and scheduling
In addition to above, the key outputs of MRP system are
very helpful in:
Calculating demand for component items
Determining requirements for subassemblies,
components, and raw material
Determining when they are needed
Generating work orders and purchase order
Considering lead time
Summary
Material requirement planning is a system for determining order quantities and the time
intervals for placing orders of dependent demand items e.f. components and raw materials
etc. It requires three inputs, namely, master production schedule, bill of materials and
inventory status. It generates three output reports – planned order reports, order release
report, and order change report. Just in time is a manufacturing system in which work in
process inventories are reduced to minimum levels. Small quantities of materials are
supplied by the suppliers to the assembly line directly with the aid of visual kanban cards.
In MRP, order size can be determined using four techniques namely, 1) Lot for lot
method, 2) Economic Order Quantity (EOQ) method, 3) Least total cost method and 4)
Least unit cost method.
MRP and JIT can be used together simultaneously as a hybrid MRP –JIT system, where
MRP is used for planning materials requirement only, and the purchase orders sent to the
suppliers act only as an indication of the probable requirements of the buyer company. The
supplier supplies the goods only according to the JIT system of kanban cards.
Keywords
Bill of materials: is a document which tells us about the structure of a product, showing
the sequence in which components sub assemblies are assembled and their required
numbers. It also contains details about the workstations at which the item is assembled.
Just in time system: is defined as produce and deliver finished goods just in time to be
sold, subassemblies just in time to be assembled into finished goods and purchased
materials just in time to be transformed into fabricated parts.
Kanban: is a Japanese word meaning flag or signal, and is a visual aid to convey the
message that action is required.
Master production schedule: is an extension of the aggregate production plan. It tells us
the number of units of different models of a product to be manufactured on a weekly or
monthly basis in the coming 6-18 months.
Material requirement planning: is a system for planning the future requirements of
dependent demand items.
Product structure: shows a product build up. It shows diagrammatically the components
required to assemble it, their numbers, and the sequence of assembly.
Purchasing: refers to the actual buying materials and the activities associated with it.
Self assessment questions
1. What is materials requirement planning? What are the inputs and outputs required by
the MRP processing logic?
2. What is product structure?
3. What is a bill of materials?
4. Give the general format of an MRP report using a hypothetical example.
5. Explain the various methods of determining the order size in MRP.
6. Define the Just in time system and explain the basic concept of JIT manufacturing?
7. What is kanban visual system? Explain the various steps followed in operating the
kanban system in a plant.
References
Karlsson, C. and Norr, C. (1994). Total effectiveness in a just in time system, International
Journal of Operations and Production Management, vol. 10, no.3
Lee choong,Y. (1993). A recent development of the integrated manufacturing systems, a
hybrid of MRP and JIT, International Journal of Operations and Production Management,
vol.13, no.4, pp.3-17
Mcmillan, Charles J. (1985). The Japanese Industrial System, Walter de Gruyler, New
York, pp. 61
Schonberger, R.J. (1982). Japanese Manufacturing Techniques; Nine Hidden Lessons in
Simplicity, Free press, New York.
Monden, Y. (1981). Adaptable Kanban System helps Toyota maintain just in time
production, Industrial Engineering, vol. 13, no. 5, pp.29-46
Westbrook, R. (1988), Time to forgot “just in time”? Observations on a visit to Japan,
International Journal of Operations and Production Management, vol. 8, no. 4, pp.5
*******
INVENTORY MANAGEMENT;
Introduction:
Inventory is basically working capital and that is why control of inventories is very
important as part of operations management. Inventories are crucial for proper functioning
of manufacturing and retailing organizations. There are many types of inventories like raw
material, spare parts or consumables, work-in-progress and finished goods. It is not
necessary that every organization needs these resources but should work according to the
needs and requirements of the resources depending upon what type of production is taking
place.
Various departments within the same organization have a contradictory approach towards
these kinds of resources. This is because the functions that are performed in various
departments influence the motivation in them. For example, the sales department might
need large amount of stocks of materials so that the production systems run very smoothly
with any hesitation. On the other hand, the finance department would need a minimum
investment in stocks so that the funds could be used elsewhere for even better purposes to
enhance the performance of the organization.
There are different inventory systems that determine the when to order and how much to
order. In this chapter, we will discuss all of them in detail.
Types of Inventory:
Inventories are used for many different purposes and by various departments for their
respective needs and requirements, but there are generally five types of inventories that
every production organization should emphasis on:
1) Movement inventories
2) Buffer inventories
3) Anticipation inventories
4) Decoupling inventories
5) Cycle inventories
1) Movement Inventories:
Everyday resources are being transported to the industries and putting them to use by
production organization through various modes of transportation. Movement inventories
are also called transit or pipeline inventories. This is basically dealt with transporting the
resources from source to destination. For example, coal is transported from coalfields to
an industrial township by trains, then the coal, while being transported will not be able to
provide any service to the customers for power generation or for burning furnaces etc.
2) Buffer Inventories:
These inventories are basically kept for future needs for the organization in stock because
there may a case when more inventories would be needed and therefore every organization
keeps an average amount of inventories in stock so that the organization can utilize those
resources efficiently and effectively without any delay. This mainly calls for uncertainty in
demand, as every organization would need the required amount of stock but what would
happen when the stock runs out? Everything would stop mainly the production so it is
very important that excess amount of resources should be kept in stock. Similarly, the
average time for delivery that is (the time between placing the order of resources and
receiving those orders and getting them ready for use in stock, technically known as lead-
time).
The idea of keeping buffer stocks is to enhance the level of providing customer service
and gradually reducing the number of stock outs and back-orders. Stock out is something
when the stock runs out and the needs of customers are not being able to fulfilled but in
some situations back ordering is possible that is (the order for goods demanded is fulfilled
as soon as the next shipment of stock arrives.) while in others it is not as it looks because
the demand might be lost forever which leads to temporary or permanent loss of customer
goodwill.
So it is very important to keep buffer stocks as demand may arise at any point of time.
3) Anticipation Inventories:
Anticipation inventories are put under scrutiny for future demands so that when the time
arrives, the supply of products flow rapidly. Like producing rain coats before the rainy
season, creating crackers before Diwali etc. The idea under this is to smoothen the flow of
production process for longer time on an iterative scale instead of operating with excess
overtime in a particular period and then keeping the system idle for long or even shut
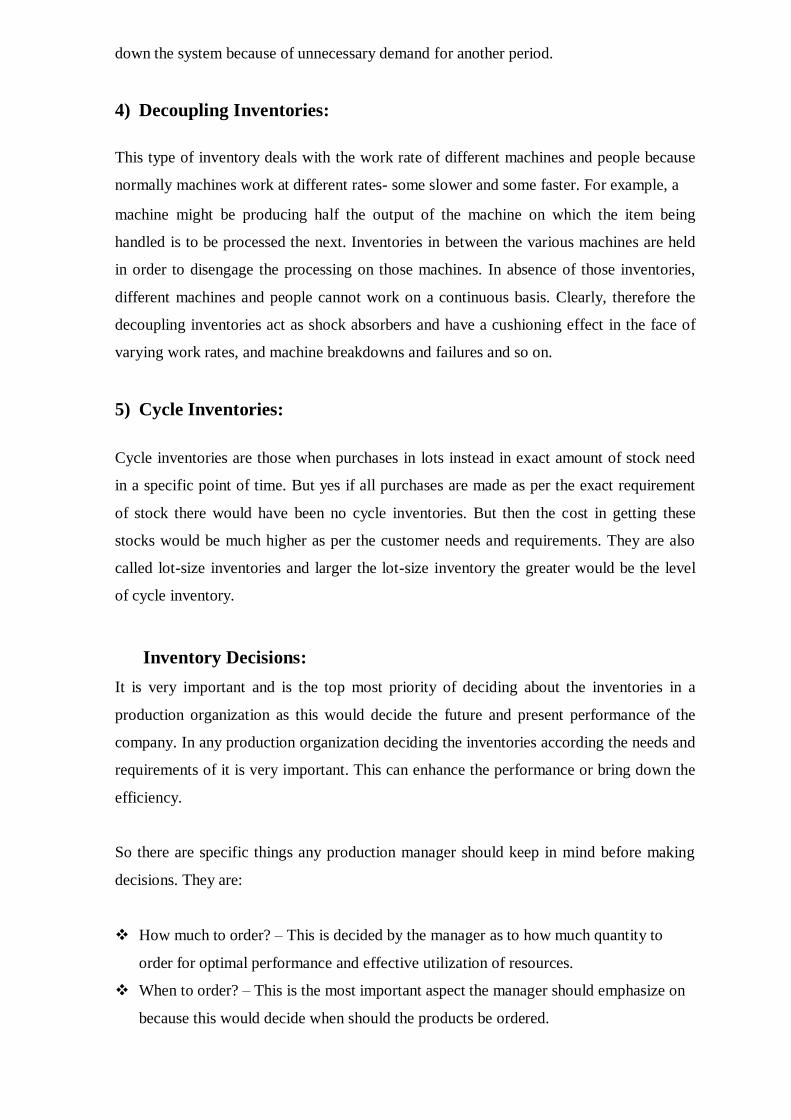
down the system because of unnecessary demand for another period.
4) Decoupling Inventories:
This type of inventory deals with the work rate of different machines and people because
normally machines work at different rates- some slower and some faster. For example, a
machine might be producing half the output of the machine on which the item being
handled is to be processed the next. Inventories in between the various machines are held
in order to disengage the processing on those machines. In absence of those inventories,
different machines and people cannot work on a continuous basis. Clearly, therefore the
decoupling inventories act as shock absorbers and have a cushioning effect in the face of
varying work rates, and machine breakdowns and failures and so on.
5) Cycle Inventories:
Cycle inventories are those when purchases in lots instead in exact amount of stock need
in a specific point of time. But yes if all purchases are made as per the exact requirement
of stock there would have been no cycle inventories. But then the cost in getting these
stocks would be much higher as per the customer needs and requirements. They are also
called lot-size inventories and larger the lot-size inventory the greater would be the level
of cycle inventory.
Inventory Decisions:
It is very important and is the top most priority of deciding about the inventories in a
production organization as this would decide the future and present performance of the
company. In any production organization deciding the inventories according the needs and
requirements of it is very important. This can enhance the performance or bring down the
efficiency.
So there are specific things any production manager should keep in mind before making
decisions. They are:
How much to order? – This is decided by the manager as to how much quantity to
order for optimal performance and effective utilization of resources.
When to order? – This is the most important aspect the manager should emphasize on
because this would decide when should the products be ordered.
How much stock should be kept in safety? – This indicates how much quantity should
be taken under consideration so that the stock can be used safely in the future without
any hesitation.
Inventory Costs:
For deciding the best suitable inventory policy, the top most criteria used is the cost
function. This inventory analysis has four major components:
1) Purchase Cost:
This is basically the nominal cost of an inventory. It is the cost incurred in buying from the
outside sources, and it would be known as production cost if the items are produced within
the organization. The cost is constant for a unit but may vary according to the quantity
purchased increases or decreases. For example, the unit price is Rs.20 for up to 100 units
and Rs.19.50 for more than 100 units. If a unit cost is constant, the control decisions
would not have any affect because whether all the requirements are produced just once or
made in installments the total amount of money involved would be the same.
2) Ordering Cost/Set-up Cost:
This occurs whenever the stock replenishes. It associates with the processing and chasing
the purchased order, transportation, and inspection for quality. It is also called
procurement cost. The parallel of ordering cost when the units are produced within the
organization is the set-up cost. It refers to cost incurred in relation to developing
production schedules. The ordering cost and set-up cost are taken to be independent to the
order size. So the unit ordering/set-up cost decreases as the purchase order increases.
3) Carrying Cost:
Carrying cost is also known as holding cost and it refers to the cost that is associated with
storing an item in the inventory. It is proportional to the amount of inventory and the time
taken to hold that inventory. The elements of carrying cost include opportunity cost,
obsolescence cost, deterioration cost. The carrying cost is expressed in terms of rate per
unit or as a percentage of the inventory value.
4) Stockout Cost:
Stock out cost is the cost, which incurs when customers are not being served. These costs
imply shortages. If stock out is internal, that means that some production is lost internally
also resulting in idle time for man and machines. If stock out were external, it would result
in potential sales or loss of customer goodwill. When the new shipment arrives, a
customer who was denied earlier would be immediately supplied the goods. But it would
involve costs like packaging costs and shipment costs.
Inventory Management Systems:
There are basically two types of management systems:
Fixed order quantity system: Also known as re-order point, when a specific level is
reached called the re-order level and the stock level reached this point, an order for a
particular number of units is placed;
Periodic Review System: This is a system where the stock is replenished over a fixed
period of time. In this system, the time after which the order is placed, is fixed, but
not the quantity.
Fixed Order Quantity System:
This system also called the Q-System. In this, a re-order point is established and as soon as
the stock level reaches this level, new set of orders are placed. This system is taken under
consideration of certainty. A couple of models based on different conditions shall be
developed to study various operations of the system under deterministic conditions.
Model 1: The Classical EOQ Model
EOQ stands for Economic Order Quantity also known as the Wilson Formulation. It is the
most elementary of all the inventory models. For this, a fixed cost model is made and then
it is manipulated to form an inventory model.
This model is based on the following assumptions:
1) The demand for the item is continuous, constant and certain over time.
2) The purchase price is constant, and no discount is available on the large lots.
3) The inventory is replenished immediately as the stock level reaches level equal to zero.
So there is no shortage or overage.
4) The lead is always known and fixed. When the lead-time is zero, the delivery of item
is instantaneous.
5) Within the range of quantities ordered, per unit holding cost and the ordering cost are
constant and thus independent of the quantity ordered.
With these assumptions, the inventory level would vary over time as shown in the graph 1
as below:
Graph 1
Now, we begin with a stock of Q on the time zero. This will be consumed at the rate of
some units per day. If the stock can be replenished instantaneously (that means lead time
is zero), then a new set of orders is made and the inventory is obtained. When this stock is
consumed, an order would be made at another time.
The interval between two different points when orders are placed, or the time elapsed in
consuming the entire lot of items, is called the inventory cycle. The maximum inventory
held would be Q while the minimum be zero, and hence the average inventory level would
be equal.
There is no need for maintaining a safety stock because of the first two assumptions. For
determining the optimum order quantity, we shall take two types of cost: ordering cost and
the holding cost. Since the purchase price is uniform in nature, it does not affect the
decision as to the quantity of the item to be ordered for purchase and, hence, is irrelevant
for the purpose.
The cost model assuming for a period of one year is:
T (Q) = O (Q) + H (Q)
Where,
Q = the ordering quantity
T (Q) = total annual inventory cost
O (Q) = total annual ordering cost
H (Q) = total annual holding cost
Example 1:
Samsung Electronics Co produces 2000 TV sets in a year for which it needs an equal
number of picture tubes of a certain type. Each tube costs Rs10 and the cost to hold a tube
in stock for a year is Rs 2.40. Besides, the cost of placing the order is Rs 150, which is not
related to its size.
Now, if an order for 2000 tubes is placed, only one order per annum is required. When
1000 units are ordered, 2 orders in a year are needed, while 500 units are ordered to be
supplied, then a total of 4 orders per annum are required. Naturally, as the number of
orders placed increases the ordering cost goes up. More orders, however, would also imply
smaller order quantity and therefore decreasing holding costs. Thus, we have a trade-off
between the ordering and the holding cost. What we attempt in our EOQ model is, then, to
find the order size that minimizes the cost function T (Q).
A) Total Annual Ordering Cost: This is given by the number of times an order is placed,
N, multiplied by ordering cost per order. A.
O (Q) = N x A
The value of N itself is independent on the order quantity Q, and the annual demand, D.
Here N would be equal to D/Q. Accordingly:
O (Q) = D/Q x A
So, When:
N=1, Q=2000 and O (Q) = 1x150 = Rs150
N=2, Q=1000 and O (Q) = 2x150 = Rs300
N=4, Q=500 and O (Q) = 4x150 = Rs600
N=5, Q=400 and O (Q) = 5x150 = Rs750
B) Total Annual Holding Cost: The annual holding cost is obtained by multiplying the
unit holding cost, h, by the average number of units held in the inventory. As been pointed
out earlier, the average inventory held equals Q/2. Consequently, the total cost of holding
inventory, per annum would be:
H (Q) = Q/2 x h
So, When:
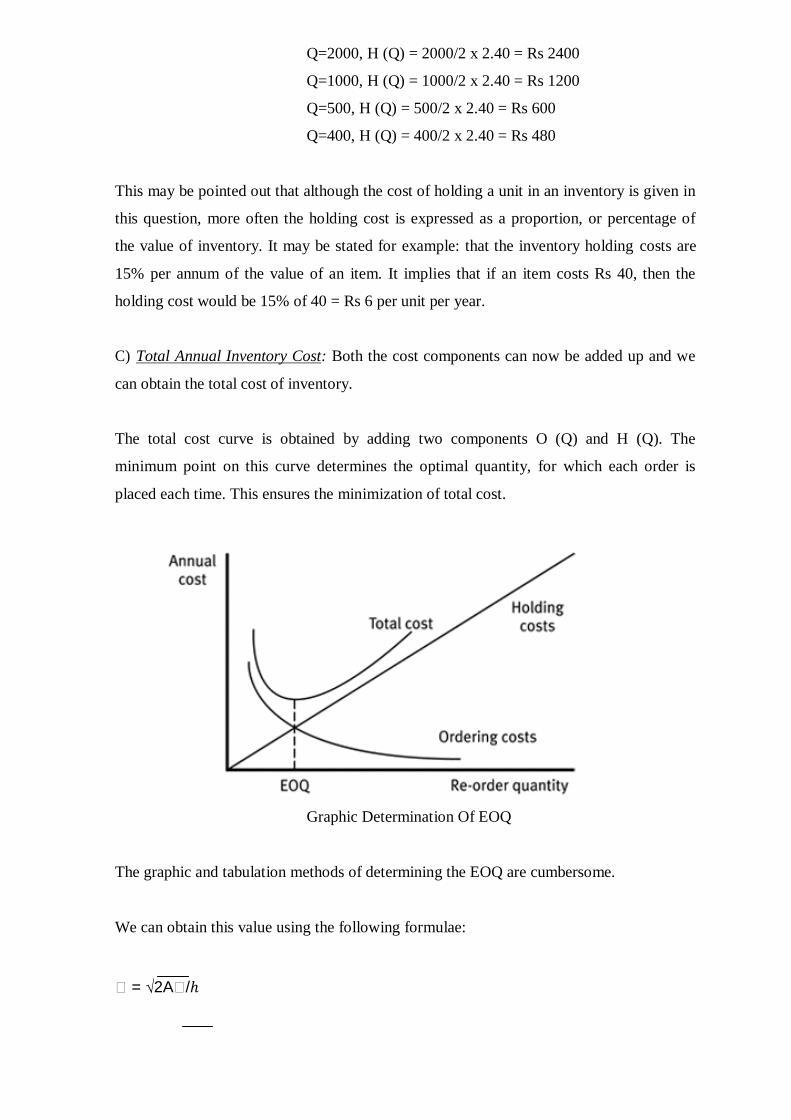
Q=2000, H (Q) = 2000/2 x 2.40 = Rs 2400
Q=1000, H (Q) = 1000/2 x 2.40 = Rs 1200
Q=500, H (Q) = 500/2 x 2.40 = Rs 600
Q=400, H (Q) = 400/2 x 2.40 = Rs 480
This may be pointed out that although the cost of holding a unit in an inventory is given in
this question, more often the holding cost is expressed as a proportion, or percentage of
the value of inventory. It may be stated for example: that the inventory holding costs are
15% per annum of the value of an item. It implies that if an item costs Rs 40, then the
holding cost would be 15% of 40 = Rs 6 per unit per year.
C) Total Annual Inventory Cost: Both the cost components can now be added up and we
can obtain the total cost of inventory.
The total cost curve is obtained by adding two components O (Q) and H (Q). The
minimum point on this curve determines the optimal quantity, for which each order is
placed each time. This ensures the minimization of total cost.
Graphic Determination Of EOQ
The graphic and tabulation methods of determining the EOQ are cumbersome.
We can obtain this value using the following formulae:
� = √2A�/ℎ
Or, � = √2A�/�c
For example: We have A = Rs 150 per order, h = Rs 2.40 per unit per annum. D = 2000
units. Thus,
Q= √2 × 150 × 2000/2.40
=√2,50,000 = 500 u��ts
Determination of the Re-order Level:
The re-order level would be known at a point such as: The data below,
No. of working days = 250
Lead time = 15 working days
With this info, the daily demand = 2000/250 = 8 tubes
Demand during lead time = 15 x 8 = 120 tubes
Re-order level=120 tubes
A) Annual Total Variable Inventory Cost: The minimum annual inventory cost can be
determined by substituting Q* for Q.
T (Q*) = D/Q* x A + Q*/2 x h
It may be noted that when the holding cost is expressed in the proportion form, we
have: T (Q*) = √2Ad�c
B) Inventory Cycle: With a uniform and constant demand D, and the economic order
quantity Q*, the problem of the optimal interval between the successive orders can be
answered easily. If T* represents the optimal interval between any consecutive orders,
we have,
T*=Q*/D
T* is also called the inventory cycle time.
C) Number of Orders: The optimal number of orders placed per year, N*, can also be
obtained. It equals the reciprocal of T*. Thus, N* = 1/T*. Thus, when T* = 0.25 = 1/4,
N* = 4 orders per year.
D) Rupee value: The monetary value of optimal order quantity and average inventory held
can also be determined:
Rupee value of EOQ = Q* x C (where c is the unit price)
= 500 x 10 = 5000
Rupee value of the average inventory = Q* x C/2
= 500 x 10/2 = Rs 2500
In most cases, demand is expressed in money terms instead of units. So in this case, of the
unit price is known, the demand may be converted into units by dividing rupee demand by
the unit cost price.
Where ever, the cost is not given and then we can determine the economic order quantity
in rupee terms. When the demand is given in monetary terms, the holding cost must be
expressed as a proportion.
Dm= the annual demand in rupee terms
A= the acquisition cost
I = the holding rate
Example:
Using the following data, obtain the EOQ and the total variable cost associated with the
policy if ordering quantities of that size.
Annual Demand = Rs. 20000
Ordering Cost = Rs 150 per order
Inventory carrying cost= 24% of average inventory value
Here,
Dm = Rs20000
A = Rs 150/order
I = 24% = 0.24
EOQ (in rupees) = √2�150�20000
0.24
= Rs 5000
Total Cost, T (Q*) = √2 × 150 × 20000 × 0.24
= Rs 1200
Violation of Assumptions of EOQ Model:
o In the EOQ model, we assumed that demand of an item is certain, continuous and
constant. But however, the demand is more likely to be uncertain, discontinuous and
variable.
o Demand is always supplied immediately and there is no availability of shortage.
However, even when the demand and lead-time are known and constant, stockouts
may be permitted.
o The unit price is the same. The analysis can be extended to cover situations when
quantity discounts are available.
o The implicit assumption that the entire quantity ordered for would be received in a
single lot may not hold true sometimes. If the supply of goods is gradual, the model
needs adjustments.
Model 2: EOQ with Price Breaks
The previously discussed, the classical EOQ model is based on the assumption that the
cost of an item under consideration is uniform. But in real life, it is very common to find
cost discounts on quantities for which the order is placed. Lower rates are highlighted if
the quantity of goods is high. So in cases like these, the quantity ordered should be
carefully examined taking into consideration the price levels of different quantity ranges.
When the unit cost price is uniform, the purchasing cost is inadequate to determine the
order size. But under the conditions of price break, the item cost, being a function of order
quantity, is the incremental cost and must be included in the cost model. As such, the cost
model would include the holding cost, ordering cost and the purchasing cost of items.
� �
T (Q) = �
× A + 2
× ℎ + c��
This cost model is a step function, and not a continuous like the one given earlier. To
understand how optimal order quantity can be determined in such a case, we would take
an example:
D = 2000 units per annum
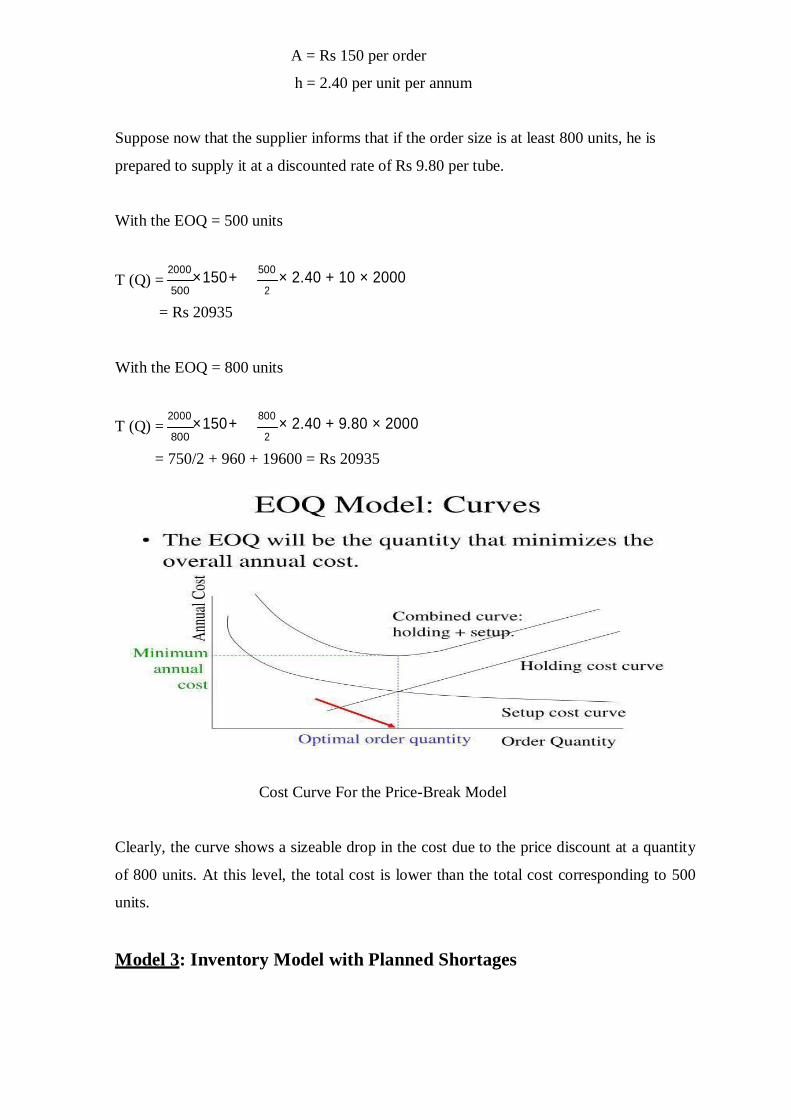
A = Rs 150 per order
h = 2.40 per unit per annum
Suppose now that the supplier informs that if the order size is at least 800 units, he is
prepared to supply it at a discounted rate of Rs 9.80 per tube.
With the EOQ = 500 units
T (Q) = 2000
× 150 + 500
500 × 2.40 + 10 × 2000
2
= Rs 20935
With the EOQ = 800 units
T (Q) = 2000
× 150 + 800
800 × 2.40 + 9.80 × 2000
2
= 750/2 + 960 + 19600 = Rs 20935
Cost Curve For the Price-Break Model
Clearly, the curve shows a sizeable drop in the cost due to the price discount at a quantity
of 800 units. At this level, the total cost is lower than the total cost corresponding to 500
units.
Model 3: Inventory Model with Planned Shortages
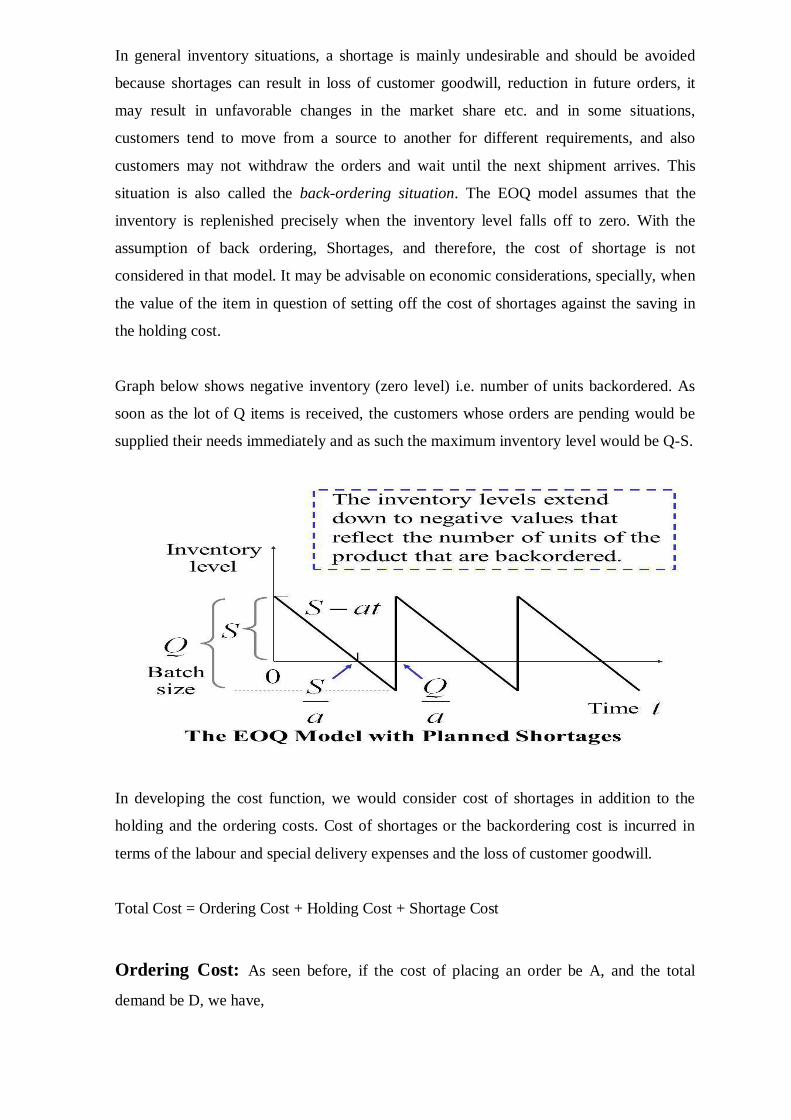
In general inventory situations, a shortage is mainly undesirable and should be avoided
because shortages can result in loss of customer goodwill, reduction in future orders, it
may result in unfavorable changes in the market share etc. and in some situations,
customers tend to move from a source to another for different requirements, and also
customers may not withdraw the orders and wait until the next shipment arrives. This
situation is also called the back-ordering situation. The EOQ model assumes that the
inventory is replenished precisely when the inventory level falls off to zero. With the
assumption of back ordering, Shortages, and therefore, the cost of shortage is not
considered in that model. It may be advisable on economic considerations, specially, when
the value of the item in question of setting off the cost of shortages against the saving in
the holding cost.
Graph below shows negative inventory (zero level) i.e. number of units backordered. As
soon as the lot of Q items is received, the customers whose orders are pending would be
supplied their needs immediately and as such the maximum inventory level would be Q-S.
In developing the cost function, we would consider cost of shortages in addition to the
holding and the ordering costs. Cost of shortages or the backordering cost is incurred in
terms of the labour and special delivery expenses and the loss of customer goodwill.
Total Cost = Ordering Cost + Holding Cost + Shortage Cost
Ordering Cost: As seen before, if the cost of placing an order be A, and the total
demand be D, we have,
√
Annual ordering Cost = D/Q x A
Holding Cost: It is the period in a given inventory cycle when positive inventory is
held. Since the maximum inventory, M, is Q-S, the average inventory level equals (Q-
S)/2. Thus,
Holding cost during a given cycle T = (Q-S)/ 2 x ht
From the above formulae, we observe that the quantity (Q-S) is sufficient to last a period.
Shortage Cost: We shall now develop expressions for the average number of shortages
and the shortage cost with the help of which we shall determine the annual shortage cost.
Since S represents the maximum level of shortages, the average level of shortages, during
the period when there is a shortage shall be S/2.
From the analysis, the total cost expression would be:
T (Q) = �
A + (� − �)2ℎ /2� + b�2/2� �
Derived from the expression, Q* would be:
Q* =
√2Æ� × (ℎ + �)
ℎ �
= 2Aℎ � + √B + B �
Determination of the re-order level: The optimal shortage being 474 units and the
consumption during the lead-time being equal to 8x15=120 units, the re-order level would
be established at a point where the shortage reaches 474-120=354 units.
Therefore: Re-order level = -354 units (shortage level of 354 units).
Economic Manufacturing Batch Size:
The EOQ concept can be further extended to the determination of optimal manufacturing
batch size for semi-finished and finished goods. If the batch size is large, then the average
level of inventory is also large therefore the carrying costs for the inventory are high. But
a few cases like, large batches of would suffice for the annual requirements, the number of
set-ups would be low. On the other hand, when batch size is small, the order cost is higher,
but at the same time, the average inventory level is smaller thus making the carrying cost
lower. Thus, there is clear trade-off between costs involved.
Cost of Setup:
The set-up cost mainly includes the following:
1) Cost of time spent in setting up the equipments and organizing the labour for a
manufacturing batch. This is the cost of the idle time of labour and the machinery,
which would have otherwise produced goods. This is the opportunity cost of the time
lost due to a set-up.
2) Cost due to rejects, scrap, rework generated during a set-up.
3) Variable cost of administrative paper work for a set-up.
Calculation of Economic Batch Quantity:
The Economic Batch Quantity (EBQ) Formula for a single product is:
This expression is similar to that derived for the classical inventory model except for the
fact that it takes into consideration production and consumption rates of the product.
Example:
Compute the EBQ for manufacture given the following data:
Monthly demand = 500 units
Daily production rate = 25 units
Days in a month = 25 days
Cost of set–up = Rs. 1,500
Cost of holding inventory = Rs.10 per unit per year
Solution:
Annual Demand A = 500 x 12 = 6000 units per year
Monthly Consumption
The daily consumption rate r = No.of days in a month
= 500
25
=20 units per days
The above problem of optimal manufacturing batch size is confined to a case where only
one product is being manufactured. In practice, a number of different products may be
manufactured on the same plant facility. One might argue that the formula for the single
product can be used to determine individually the optimal batch quantities for different
products. Although this individual determination of the manufacturing batch sizes would
produce most economical results as far as individual products are concerned, it might
present some difficulties in a few cases.
When multiple products share the same plant facility, there are chances of interferences
and therefore, stock-outs occur. Such interference between different products is
experienced sometimes, when the products share the same equipment but the batch
quantities are calculated independently. To avoid this kind of problem, it is suggested that
the economic batch size of the products using the same plant facility be determined
jointly. Therefore, there will be joint cycles of manufacture and in each joint cycle all the
products will be manufactured in appropriate quantities. The determination of the
economic batch sizes of the different products then amounts to the determination of the
optimal number of joint cycles in a year; annual demand for a product divided by the
optimal number of joint cycles gives the economic batch quantity for the product.
Since all the products, using the same plant facility, are manufactured, one after another in
each optimal joint cycle, there is no question of shortage of any product at any time. The
principle to be followed in joint cycle determination is similar to that for the determination
of the optimal batch quantity for individual products. Numerical based on joint cycles are
beyond the scope of this chapter.
Safety Stock
The inventory models discussed so far are based on the common assumption of constant
and know demand for the item and the lead-time. Therefore, these models are called
deterministic models. The models that consider the situation in which the demand and
demand and/or lead-time are not known with certainty and they need not be constant is
beyond the scope of this chapter. In these models, demand and lead time are taken as
random variables, capable of assuming varying values whose probability distribution may
be known.
In the models, the stock is replenished as soon as the stock reaches the point of exhaustion,
due to the assumption underlying them. Under such idealistic situation, there is no need to
maintain any extra stock because the supplies would reach the moments the stock level
reduce to zero and there would be no stock outs (unless they are intentionally allowed to
occur). However when the demand is varying and so is the lead time, there is a need to
provide for the safety or buffer stock in order to meet either or both the lead time, there is
a need to provide for the safety or buffer stocks in order to meet either or both the
contingencies, viz. that demand rate during the lead time is in excess of what was
expected/forecasted and that the delivery of good is delayed. The safety stock, then acts as
a cushion against stock-outs caused by random deviations of nature.
The safety stock is an important constituent of the re-order level that is determined as the
expected demand of the item during lead time plus the safety stock. If the demand varies
about the mean daily demand equal to d with the expected lead time equal to L days, and
we set the re-order level R at L units, then we should expected a shortage to occur in about
half the lead time periods. To reduces this 50% probability of being out of stock, the safety
stock SS would be required to be kept. Thus,
Re-order level, R = L* d +S.S.
We know that in this system, an order is placed as soon as it reaches the re-order level.
Therefore, how high or low is the rate of demand before the re-order level reaches is of
little consequence. What is significant is the level of demand during the lead-time. Here
fresh supplies are received as soon as the stock level reaches the safety level. In this kind
of a situation, the average stock held would be exactly equal to SS + Q/2.
The idea of keeping the safety stock is clearly to prevent stock out and it is the amount of
stock that the organization would always like preserve for meeting extraordinary situation.
In general higher safety stock would be called for in situation where costs of stock out are
larger; higher levels of service (i.e. meeting greater proportion of demand) are sought;
significant variation are observed in the lead time and/or time demand; and where
holdings costs are smaller. Naturally, the higher the level of safety stock the greater the
service level and therefore to strike a balance between the two, The optimal safety stock
level is determined where successively declining stock out costs and successively rising
holding costs, caused by the successive units added to the safety stock, would balance.
There is no rigid formulation for determining the optimum level of safety. The different
approaches available for the purpose are based on the demand, the lead time and the stock
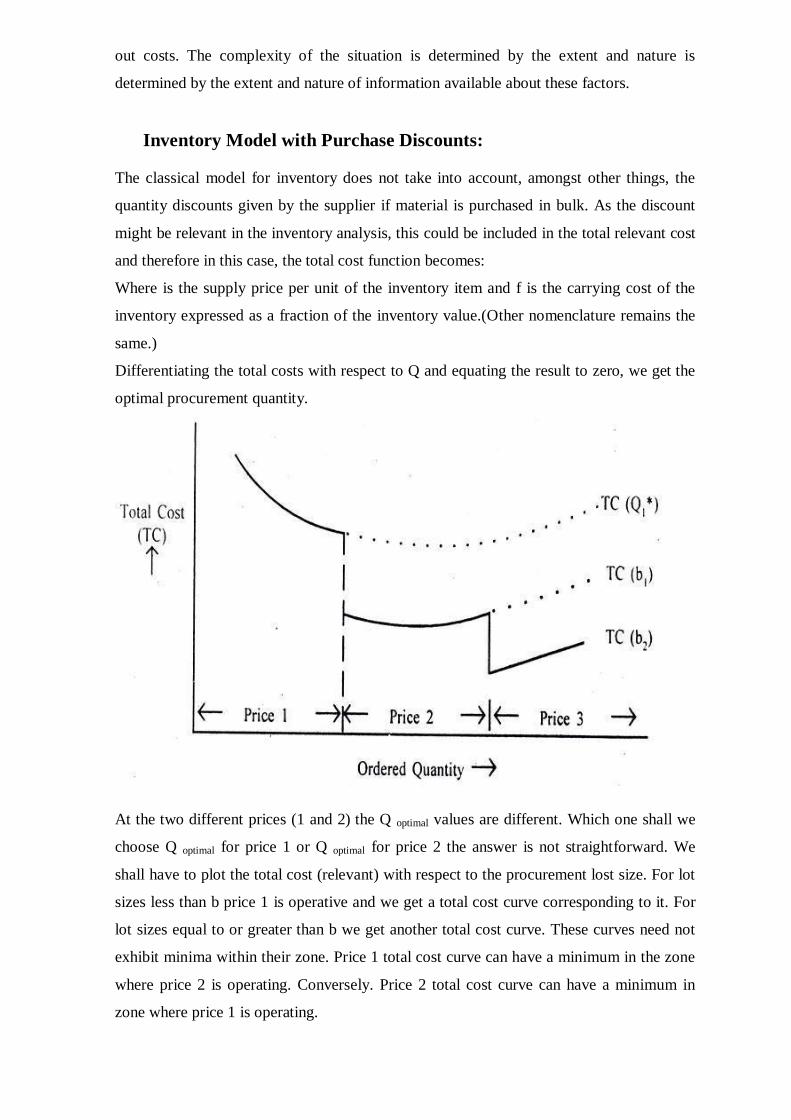
out costs. The complexity of the situation is determined by the extent and nature is
determined by the extent and nature of information available about these factors.
Inventory Model with Purchase Discounts:
The classical model for inventory does not take into account, amongst other things, the
quantity discounts given by the supplier if material is purchased in bulk. As the discount
might be relevant in the inventory analysis, this could be included in the total relevant cost
and therefore in this case, the total cost function becomes:
Where is the supply price per unit of the inventory item and f is the carrying cost of the
inventory expressed as a fraction of the inventory value.(Other nomenclature remains the
same.)
Differentiating the total costs with respect to Q and equating the result to zero, we get the
optimal procurement quantity.
At the two different prices (1 and 2) the Q optimal values are different. Which one shall we
choose Q optimal for price 1 or Q optimal for price 2 the answer is not straightforward. We
shall have to plot the total cost (relevant) with respect to the procurement lost size. For lot
sizes less than b price 1 is operative and we get a total cost curve corresponding to it. For
lot sizes equal to or greater than b we get another total cost curve. These curves need not
exhibit minima within their zone. Price 1 total cost curve can have a minimum in the zone
where price 2 is operating. Conversely. Price 2 total cost curve can have a minimum in
zone where price 1 is operating.
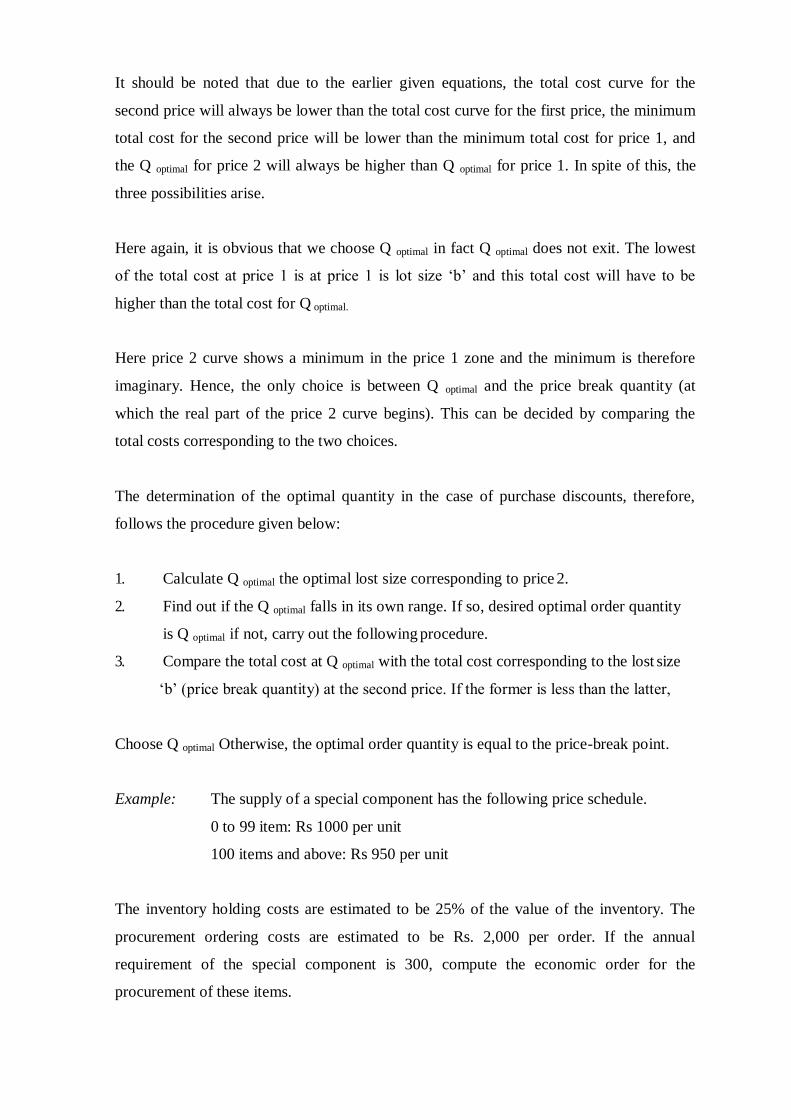
It should be noted that due to the earlier given equations, the total cost curve for the
second price will always be lower than the total cost curve for the first price, the minimum
total cost for the second price will be lower than the minimum total cost for price 1, and
the Q optimal for price 2 will always be higher than Q optimal for price 1. In spite of this, the
three possibilities arise.
Here again, it is obvious that we choose Q optimal in fact Q optimal does not exit. The lowest
of the total cost at price 1 is at price 1 is lot size ‗b‘ and this total cost will have to be
higher than the total cost for Q optimal.
Here price 2 curve shows a minimum in the price 1 zone and the minimum is therefore
imaginary. Hence, the only choice is between Q optimal and the price break quantity (at
which the real part of the price 2 curve begins). This can be decided by comparing the
total costs corresponding to the two choices.
The determination of the optimal quantity in the case of purchase discounts, therefore,
follows the procedure given below:
1. Calculate Q optimal the optimal lost size corresponding to price 2.
2. Find out if the Q optimal falls in its own range. If so, desired optimal order quantity
is Q optimal if not, carry out the following procedure.
3. Compare the total cost at Q optimal with the total cost corresponding to the lost size
‗b‘ (price break quantity) at the second price. If the former is less than the latter,
Choose Q optimal Otherwise, the optimal order quantity is equal to the price-break point.
Example: The supply of a special component has the following price schedule.
0 to 99 item: Rs 1000 per unit
100 items and above: Rs 950 per unit
The inventory holding costs are estimated to be 25% of the value of the inventory. The
procurement ordering costs are estimated to be Rs. 2,000 per order. If the annual
requirement of the special component is 300, compute the economic order for the
procurement of these items.
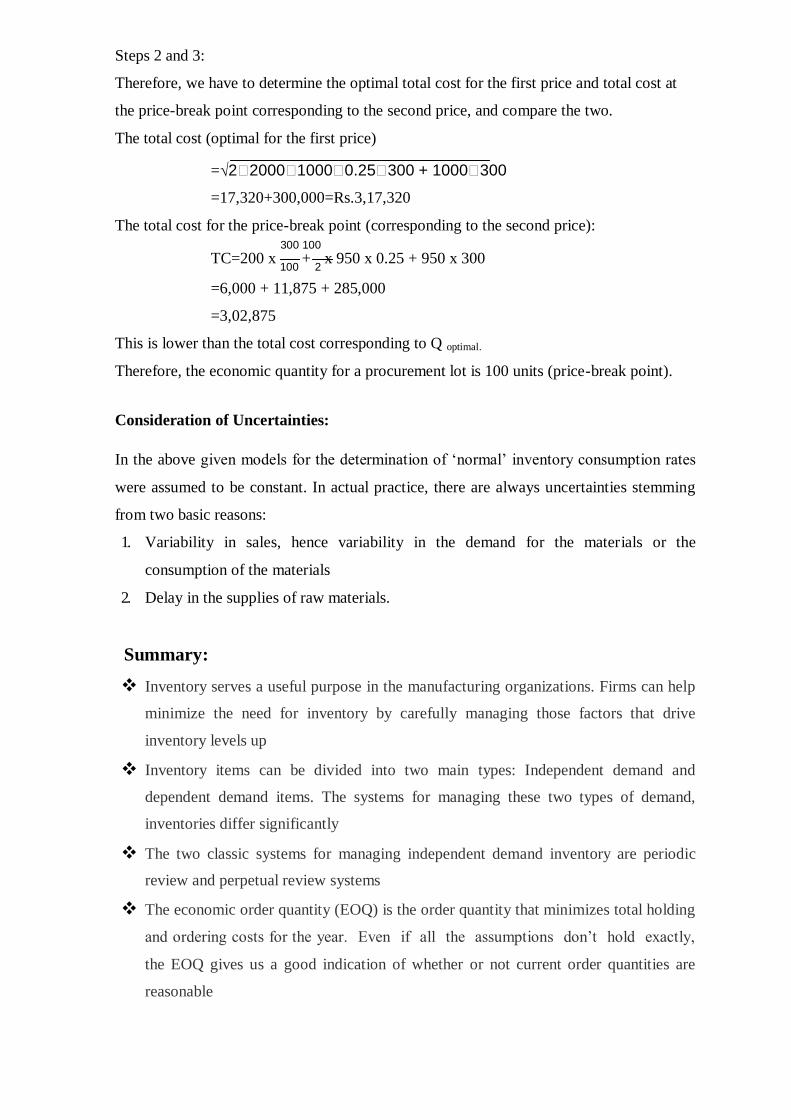
Steps 2 and 3:
Therefore, we have to determine the optimal total cost for the first price and total cost at
the price-break point corresponding to the second price, and compare the two.
The total cost (optimal for the first price)
=√2�2000�1000�0.25�300 + 1000�300
=17,320+300,000=Rs.3,17,320
The total cost for the price-break point (corresponding to the second price):
300 100
TC=200 x 100
+ 2
x 950 x 0.25 + 950 x 300
=6,000 + 11,875 + 285,000
=3,02,875
This is lower than the total cost corresponding to Q optimal.
Therefore, the economic quantity for a procurement lot is 100 units (price-break point).
Consideration of Uncertainties:
In the above given models for the determination of ‗normal‘ inventory consumption rates
were assumed to be constant. In actual practice, there are always uncertainties stemming
from two basic reasons:
1. Variability in sales, hence variability in the demand for the materials or the
consumption of the materials
2. Delay in the supplies of raw materials.
Summary:
Inventory serves a useful purpose in the manufacturing organizations. Firms can help
minimize the need for inventory by carefully managing those factors that drive
inventory levels up
Inventory items can be divided into two main types: Independent demand and
dependent demand items. The systems for managing these two types of demand,
inventories differ significantly
The two classic systems for managing independent demand inventory are periodic
review and perpetual review systems
The economic order quantity (EOQ) is the order quantity that minimizes total holding
and ordering costs for the year. Even if all the assumptions don‘t hold exactly,
the EOQ gives us a good indication of whether or not current order quantities are
reasonable
The reorder point formula allows us to determine the safety stock (SS) needed to
achieve a certain cycle service level. In general, the longer the lead times are, and the
greater the variability of demand and lead times, the more SS we will need
Inventories are vital to the successful functioning of manufacturing and retailing
organizations
The basic questions to keep in mind before getting any inventory:
a) How much inventory to keep
b) When to keep the inventory in the warehouse
Buffer stock is kept for review period + lead-time
Maximum inventory on hand is (Normal consumption + Buffer Stock) both for
review period plus on order.
Keywords:
Inventory: is working capital and therefore the control of inventories is an important
aspect of operations management
Lead Time: The time elapsing between placing an order and having goods in stock
Procurement costs: associated with processing and chasing of an order,
transportation, inspection for quality, expediting overdue orders and so on
Self-assessment Questions:
1. Define inventory. Discuss various types of inventory costs.
2. Discuss various types of inventories.
3. What are the basic assumptions underlying the classical EOQ model? Also discuss
its limitations.
4. What is the set-up cost of manufacture?
5. Discuss economic batch quantity with suitable example.
References:
R.G. Schroeder, Operation Management- Decision Making in the Operations Function,
McGraw-Hill, International Student Edu, 1985
J.K Sharma, Operations Management – Text and Cases, Trinity Press, 5th Edition
Ajay K Garg, Production and Operations Management, McGraw Hill
Charry, Production and Operations Management, McGraw Hill, 5th
Edition Kanishka Bedi, Production and Operations Management,
Oxford, 2nd
Edition
******
UNIT II
FORECASTING
Structure
Introduction
Demand Forecasting
Types of Forecasting
Forecasting Techniques
Utility of Forecasting
Forecasting Models
Criteria of a Good Forecasting Method
Techniques of Inventory Control System
Key Terms
Self assessment questions
References
Introduction
Inventory means stoke. It is essential in an organization for production activities and
maintenance of plant and machinery and for other operational requirements. The normal
tendency is to have more inventories so that most of the items are available when
required.
Production control means controlling the production by using various methods of
demand forecasting. Production control is the task of predicting, planning and scheduling
work, taking into account manpower, materials availability and other capacity
restrictions, and cost so as to achieve proper quality and quantity at the time it is needed
and then following up the schedule to see that the plan is carried out, using whatever
systems have proven satisfactory for the purpose.
Demand forecasting is the art and science of forecasting customer demand to drive
holistic execution of such demand by corporate supply chain and business management.
Demand forecasting involves techniques including both informal methods, such as
educated guesses, and quantitative methods, such as the use of historical sales data and
statistical techniques or current data from test markets. Demand forecasting may be used
in production planning, inventory management, and at times in assessing future capacity
requirements, or in making decisions on whether to enter a new market
Demand forecasting is predicting future demand for the product. In other words it refers
to the prediction of probable demand for a product or a service on the basis of the past
events and prevailing trends in the present.
Need of Inventory
Adequate inventory ensures uninterrupted supply of finished goods and continuous
production. The most significant aspect of inventory is that it should all be known and
quantified. For example, we have working stock because we can‘t make or buy just one
every time we sell or use one. We have safety stock because of lead times, forecast
errors, service requirements, etc., and our customers are unwilling to wait. We may have
extra stock to buffer against supply variability, for example because of poor vendor
performance, manufacturing problems, or seasonal product availability. Lastly we could
require hedge stock because we may know of a future price increase. Of course the above
could occur at any level of the bill of materials, i.e., finished goods, work in process, or
raw materials. For this discussion, we will concentrate just on the first two reasons for
maintaining the inventories: working stock and safety stock, and just at the finished
goods level. When we started in business, we concentrated at first on just the finished
goods. Eventually, however, we did the research and development necessary to expand
the science to address inventory at all levels
Forecasts are becoming the lifetime of business in a world, where the tidal waves of
change are sweeping the most established of structures, inherited by human society.
Commerce just happens to the one of the first casualties. Survival in this age of economic
predators requires the tact, talent and technique of predicting the future.
Forecast is becoming the sign of survival and the language of business. All requirements
of the business sector need the technique of accurate and practical reading into the future.
Forecasts are, therefore, very essential requirement for the survival of business. Man-
agement requires forecasting information when making a wide range of decisions.
Demand forecasting is predicting future demand for the product. In other words it refers
to the prediction of probable demand for a product or a service on the basis of the past
events and prevailing trends in the present.
Meaning of demand forecast
A demand forecast is the prediction of what will happen to your company's existing
product sales. It would be best to determine the demand forecast using a multi-functional
approach. The inputs from sales and marketing, finance, and production should be
considered. The final demand forecast is the consensus of all participating managers. You
may also want to put up a Sales and Operations Planning group composed of
representatives from the different departments that will be tasked to prepare the demand
forecast
The sales forecast is particularly important as it is the foundation upon which all
company plans are built in terms of markets and revenue. Management would be a simple
matter if business was not in a continual state of change, the pace of which has quickened
in recent years.
It is becoming increasingly important and necessary for business to predict their future
prospects in terms of sales, cost and profits. The value of future sales is crucial as it
affects costs profits, so the prediction of future sales is the logical starting point of all
business planning.
A forecast is a prediction or estimation of future situation. It is an objective assessment of
future course of action. Since future is uncertain, no forecast can be percent correct.
Forecasts can be both physical as well as financial in nature. The more realistic the
forecasts, the more effective decisions can be taken for tomorrow.
In the words of Cundiff and Still, ―Demand forecasting is an estimate of sales during a
specified future period which is tied to a proposed marketing plan and which assumes a
particular set of uncontrollable and competitive forces‖. Therefore, demand forecasting is
a projection of firm‘s expected level of sales based on a chosen marketing plan and
environment.
Procedure to Prepare Sales Forecast:
Companies commonly use a three-stage procedure to prepare a sales forecast. They make
an environmental forecast, followed by an industry forecast, and followed by a
company‘s sales forecast, the environmental forecast calls for projecting inflation,
unemployment, interest rate, consumer spending, and saving, business investment,
government expenditure, net exports and other environmental magnitudes and events of
importance to the company.
The industry forecast is based on surveys of consumers‘ intention and analysis of
statistical trends is made available by trade associations or chamber of commerce. It can
give indication to a firm regarding tine direction in which the whole industry will be
moving. The company derives its sales forecast by assuming that it will win a certain
market share.
All forecasts are built on one of the three information bases:
What people say?
What people do?
What people have done?
Types of Forecasting:
There are different basis to differentiate the forecasts.
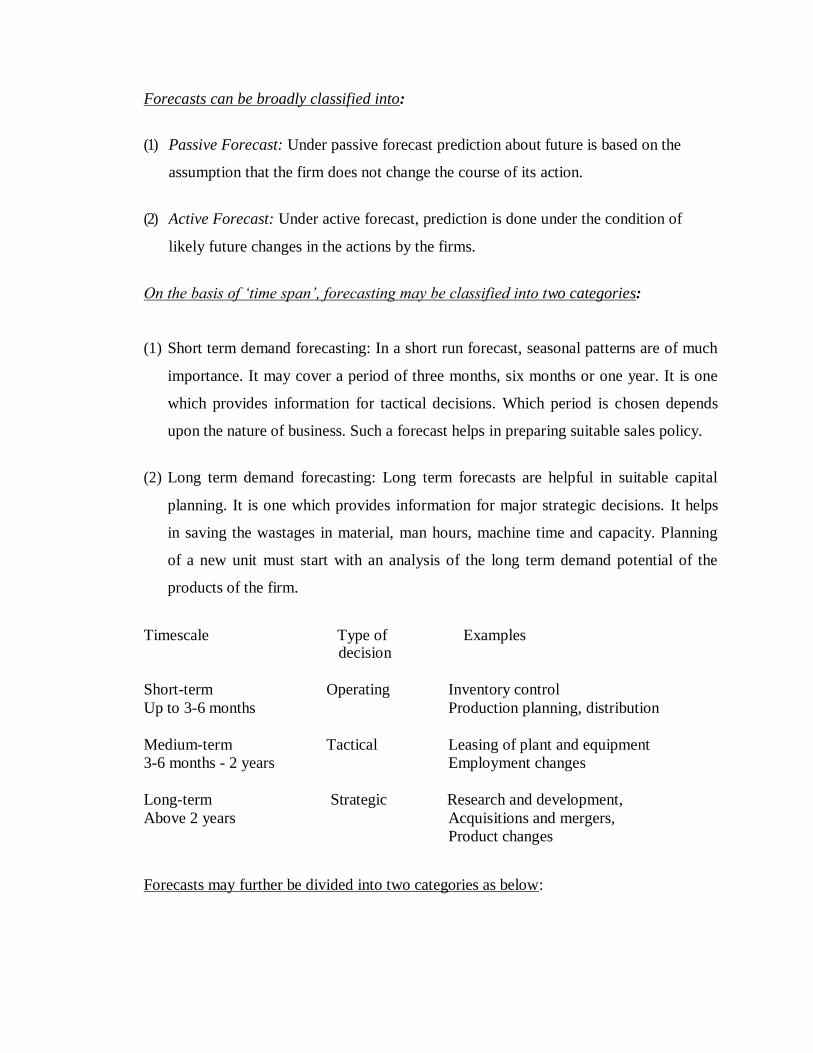
Forecasts can be broadly classified into:
(1) Passive Forecast: Under passive forecast prediction about future is based on the
assumption that the firm does not change the course of its action.
(2) Active Forecast: Under active forecast, prediction is done under the condition of
likely future changes in the actions by the firms.
On the basis of „time span‟, forecasting may be classified into two categories:
(1) Short term demand forecasting: In a short run forecast, seasonal patterns are of much
importance. It may cover a period of three months, six months or one year. It is one
which provides information for tactical decisions. Which period is chosen depends
upon the nature of business. Such a forecast helps in preparing suitable sales policy.
(2) Long term demand forecasting: Long term forecasts are helpful in suitable capital
planning. It is one which provides information for major strategic decisions. It helps
in saving the wastages in material, man hours, machine time and capacity. Planning
of a new unit must start with an analysis of the long term demand potential of the
products of the firm.
Timescale Type of
decision Examples
Short-term
Up to 3-6 months
Operating Inventory control
Production planning, distribution
Medium-term
3-6 months - 2 years
Tactical Leasing of plant and equipment
Employment changes
Long-term
Above 2 years
Strategic Research and development,
Acquisitions and mergers,
Product changes
Forecasts may further be divided into two categories as below:
External or national group of forecast: External forecast deals with trends in general
business. It is usually prepared by a company‘s research wing or by outside
consultants.
Internal or company group forecast: Internal forecast includes all those that are
related to the operation of a particular enterprise such as sales group, production
group, and financial group. The structure of internal forecast includes forecast of
annual sales, forecasts of products cost, forecast of operating profit, forecast of
taxable income, forecast of cash resources, forecast of the number of employees, etc.
Forecasting may be classified as below at different levels:
o Macro-level forecasting
o Industry- level forecasting
o Firm- level forecasting
o Product-line forecasting
Macro-level forecasting is concerned with business conditions over the whole economy.
It is measured by an appropriate index of industrial production, national income or
expenditure. Industry-level forecasting is prepared by different trade associations. This is
based on survey of consumers‘ intention and analysis of statistical trends. Firm-level
forecasting is related to an individual firm. It is most important from managerial view
point. Product-line forecasting helps the firm to decide which of the product or products
should have priority in the allocation of firm‘s limited resources.
Forecast may be general or specific in nature. The general forecast may generally be
useful to the firm. Many firms require separate forecasts for specific products and
specific areas, for this general forecast is fragmented further into specific forecasts.
There are different forecasts for different types of products like:
Forecasting demand for nondurable consumer goods
Forecasting demand for durable consumer goods
Forecasting demand for capital goods
pg. 84
Forecasting demand for new-products
Non-Durable Consumer Goods:
These are also known as ‗single-use consumer goods‘ or perishable consumer goods.
These vanish after a single act of consumption. These include goods like food, milk,
medicine, fruits, etc. Demand for these goods depends upon household disposable
income, price of the commodity and the related goods and population and characteristics.
Symbolically,
Dc = f (y, s, p, pr)
Where;
Dc = the demand for commodity c
у = the household disposable income
s = population
p = price of the commodity с
pr = price of its related goods
Disposable income expressed as Dc = f (y) i.e. other things being equal, the demand for
commodity с depends upon the disposable income of the household. Disposable income
of the household is estimated after the deduction of personal taxes from the personal
income. Disposable income gives an idea about the purchasing power of the household.
Price, expressed as Dc = f (p, pr) i.e. other things being equal, demand for commodity с
depends upon its own price and the price of related goods. While the demand for a
commodity is inversely related to its own price of its complements. It is positively related
to its substitutes. Price elasticity and cross-elasticity of non-durable consumer goods help
in their demand forecasting
Population, expressed as Dc= f (5) i.e. other things being equal, demand for commodity с
depends upon the size of population and its composition. Besides, population can also be
classified on the basis of sex, income, literacy and social status. Demand for non-durable
consumer goods is influenced by all these factors. For the general demand forecasting
population as a whole is considered, but for specific demand forecasting division of
population according to different characteristics proves to be more useful.
The various steps involved in forecasting the demand for non-durable consumer goods
are the following:
(i) First identify the variables affecting the demand for the product and express them in
appropriate forms,
(ii) Gather relevant data or approximation to relevant data to represent the variables, and
(iii)Use methods of statistical analysis to determine the most probable relationship
between the dependent and independent variables.
Durable Consumer Goods:
These goods can be consumed a number of times or repeatedly used without much loss to
their utility. These include goods like car, T.V., air-conditioners, furniture etc. After their
long use, consumers have a choice either these could be consumed in future or could be
disposed of.
The choice depends upon the following factors:
Whether a consumer will go for the replacement of a durable good or keep on using it
after necessary repairs depends upon his social status, level of money income, taste
and fashion, etc. Replacement demand tends to grow with increase in the stock of the
commodity with the consumers. The firm can estimate the average replacement cost
with the help of life expectancy table.
Most consumer durables are consumed in common by the members of a family. For
instance, T.V., refrigerator, etc. are used in common by households. Demand
forecasts for goods commonly used should take into account the number of
households rather than the total size of population. While estimating the number of
households, the income of the household, the number of children and sex-
composition, etc. should be taken into account.
Demand for consumer durables depends upon the availability of allied facilities. For
example, the use of T.V., refrigerator needs regular supply of power, the use of car
needs availability of fuel, etc. While forecasting demand for consumer durables, the
provision of allied services and their cost should also be taken into account.
Demand for consumer durables is very much influenced by their prices and their
credit facilities. Consumer durables are very much sensitive to price changes. A small
fall in their price may bring large increase in demand.
Forecasting Demand for Capital Goods:
Capital goods are used for further production. The demand for capital good is a derived
one. It will depend upon the profitability of industries. The demand for capital goods is a
case of derived demand. In the case of particular capital goods, demand will depend on
the specific markets they serve and the end uses for which they are bought.
The demand for textile machinery will, for instance, be determined by the expansion of
textile industry in terms of new units and replacement of existing machinery. Estimation
of new demand as well as replacement demand is thus necessary.
Three types of data are required in estimating the demand for capital goods:
a) The growth prospects of the user industries must be known,
b) The norm of consumption of the capital goods per unit of each end-use product must
be known, and
c) The velocity of their use.
Forecasting Demand for New Products:
The methods of forecasting demand for new products are in many ways different from
those for established products. Since the product is new to the consumers, an intensive
study of the product and its likely impact upon other products of the same group provides
a key to an intelligent projection of demand.
Joel Dean has classified a number of possible approaches as follows:
Evolutionary Approach: It consists of projecting the demand for a new product as an
outgrowth and evolution of an existing old product.
Substitute Approach: According to this approach the new product is treated as a
substitute for the existing product or service.
Growth Curve Approach: It estimates the rate of growth and potential demand for the
new product as the basis of some growth pattern of an established product.
Opinion-Poll Approach: Under this approach the demand is estimated by direct
enquiries from the ultimate consumers.
Sales Experience Approach: According to this method the demand for the new
product is estimated by offering the new product for sale in a sample market.
Vicarious Approach: By this method, the consumers‘ reactions for a new product are
found out indirectly through the specialized dealers who are able to judge the
consumers‘ needs, tastes and preferences.
Forecasting Techniques:
Demand forecasting is a difficult exercise. Making estimates for future under the
changing conditions is a Herculean task. Consumers‘ behaviour is the most unpredictable
one because it is motivated and influenced by a multiplicity of forces. There is no easy
method or a simple formula which enables the manager to predict the future.
Economists and statisticians have developed several methods of demand forecasting.
Each of these methods has its relative advantages and disadvantages. Selection of the
right method is essential to make demand forecasting accurate. In demand forecasting, a
judicious combination of statistical skill and rational judgment is needed.
Mathematical and statistical techniques are essential in classifying relationships and
providing techniques of analysis, but they are in no way an alternative for sound
judgment. Sound judgment is a prime requisite for good forecast.
The judgment should be based upon facts and the personal bias of the forecaster should
not prevail upon the facts. Therefore, a mid way should be followed between
mathematical techniques and sound judgment or pure guess work.
The various methods of demand forecasting can be as below:
Qualitative Methods/ Techniques:
(1) Opinion Polling Method: In this method, the opinion of the buyers, sales force and
experts could be gathered to determine the emerging trend in the market. The opinion
polling methods of demand forecasting are of three kinds:
Consumer‟s Survey Method or Survey of Buyer‟s Intentions: In this method,
the consumers are directly approached to disclose their future purchase plans.
This is done by interviewing all consumers or a selected group of consumers out
of the relevant population. This is the direct method of estimating demand in the
short run. Here the burden of forecasting is shifted to the buyer. The firm may go
in for complete enumeration or for sample surveys. If the commodity under
consideration is an intermediate product then the industries using it as an end
product are surveyed.
Complete Enumeration Survey: Under the Complete Enumeration Survey, the
firm has to go for a door to door survey for the forecast period by contacting all
the households in the area. This method has an advantage of first hand, unbiased
information, yet it has its share of disadvantages also. The major limitation of this
method is that it requires lot of resources, manpower and time. In this method,
consumers may be reluctant to reveal their purchase plans due to personal privacy
or commercial secrecy. Moreover, at times the consumers may not express their
opinion properly or may deliberately misguide the investigators.
Sample Survey and Test Marketing: Under this method some representative
households are selected on random basis as samples and their opinion is taken as
the generalized opinion. This method is based on the basic assumption that the
sample truly represents the population. If the sample is the true representative,
there is likely to be no significant difference in the results obtained by the survey.
Apart from that, this method is less tedious and less costly. A variant of sample
survey technique is test marketing. Product testing essentially involves placing the
product with a number of users for a set period. Their reactions to the product are
noted after a period of time and an estimate of likely demand is made from the
result. These are suitable for new products or for radically modified old products
for which no prior data exists. It is a more scientific method of estimating likely
demand because it stimulates a national launch in a closely defined geographical
area.
(2) End Use Method or Input-Output Method: This method is quite useful for
industries which are mainly producer‘s goods. In this method, the sale of the product
under consideration is projected as the basis of demand survey of the industries using
this product as an intermediate product, that is, the demand for the final product is the
end user demand of the intermediate product used in the production of this final
product.
The end user demand estimation of an intermediate product may involve many final
good industries using this product at home and abroad. It helps us to understand the
relationship among various industries. In input-output accounting two matrices used
are the transaction matrix and the input co-efficient matrix. The major efforts required
by this type are not in its operation but in the collection and presentation of data.
(3) Sales Force Opinion Method: This is also known as collective opinion method. In
this method, instead of consumers, the opinion of the salesmen is sought. It is
sometimes referred as the ―grass roots approach‖ as it is a bottom-up method that
requires each sales person in the company to make an individual forecast for his or
her particular sales territory.
These individual forecasts are discussed and agreed with the sales manager. The
composite of all forecasts then constitutes the sales forecast for the organization. The
advantages of this method are that it is easy and cheap. It does not involve any
elaborate statistical treatment. The main merit of this method lies in the collective
wisdom of salesmen. This method is more useful in forecasting sales of new products.
(4) Experts Opinion Method: This method is also known as “Delphi Technique” of
investigation. The Delphi method requires a panel of experts, who are interrogated
through a sequence of questionnaires in which the responses to one questionnaire are
used to produce the next questionnaire. Thus any information available to some
experts and not to others is passed on, enabling all the experts to have access to all the
information for forecasting.
The method is used for long term forecasting to estimate potential sales for new
products. This method presumes two conditions: Firstly, the panelists must be rich in
their expertise, possess wide range of knowledge and experience. Secondly, its
conductors are objective in their job. This method has some exclusive advantages of
saving time and other resources.
Statistical Methods/ Techniques:
Statistical methods have proved to be immensely useful in demand forecasting. In order
to maintain objectivity, that is, by consideration of all implications and viewing the
problem from an external point of view, the statistical methods are used.
The important statistical methods are discussed as below:
(1) Trend Projection Method: A firm existing for a long time will have its own data
regarding sales for past years. Such data when arranged chronologically yield what is
referred to as ‗time series‘. Time series shows the past sales with effective demand
for a particular product under normal conditions. Such data can be given in a tabular
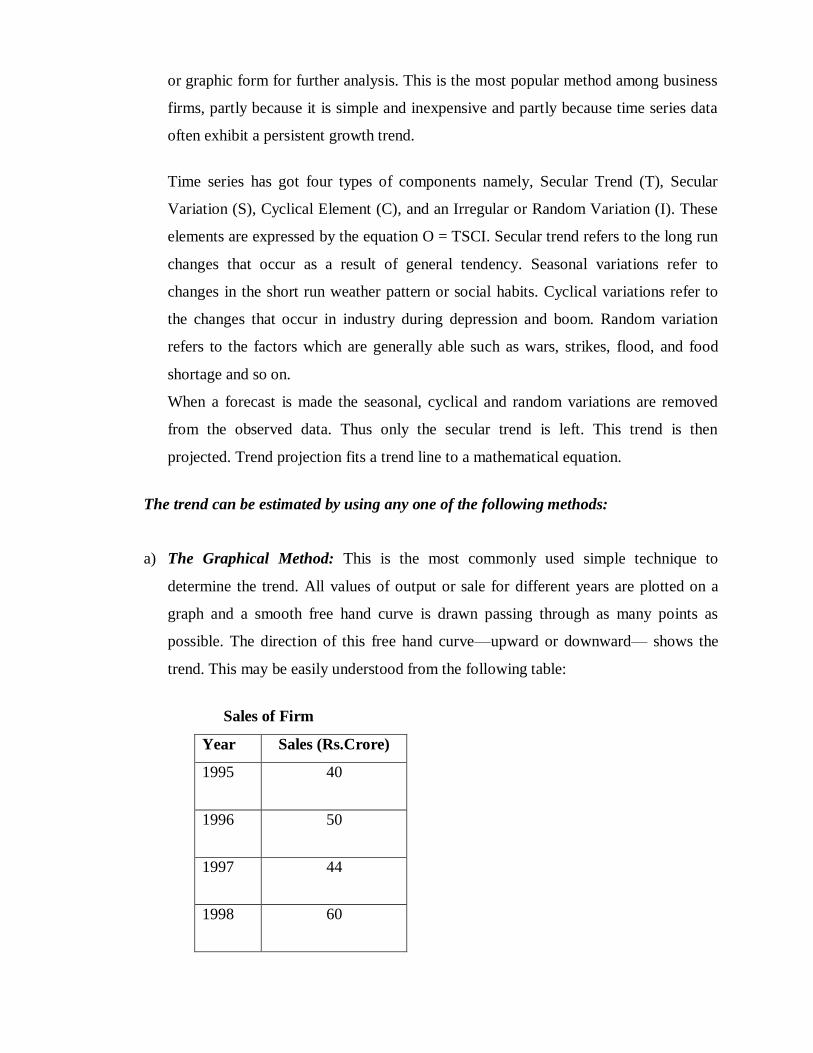
or graphic form for further analysis. This is the most popular method among business
firms, partly because it is simple and inexpensive and partly because time series data
often exhibit a persistent growth trend.
Time series has got four types of components namely, Secular Trend (T), Secular
Variation (S), Cyclical Element (C), and an Irregular or Random Variation (I). These
elements are expressed by the equation O = TSCI. Secular trend refers to the long run
changes that occur as a result of general tendency. Seasonal variations refer to
changes in the short run weather pattern or social habits. Cyclical variations refer to
the changes that occur in industry during depression and boom. Random variation
refers to the factors which are generally able such as wars, strikes, flood, and food
shortage and so on.
When a forecast is made the seasonal, cyclical and random variations are removed
from the observed data. Thus only the secular trend is left. This trend is then
projected. Trend projection fits a trend line to a mathematical equation.
The trend can be estimated by using any one of the following methods:
a) The Graphical Method: This is the most commonly used simple technique to
determine the trend. All values of output or sale for different years are plotted on a
graph and a smooth free hand curve is drawn passing through as many points as
possible. The direction of this free hand curve—upward or downward— shows the
trend. This may be easily understood from the following table:
Sales of Firm
Year Sales (Rs.Crore)
1995 40
1996 50
1997 44
1998 60
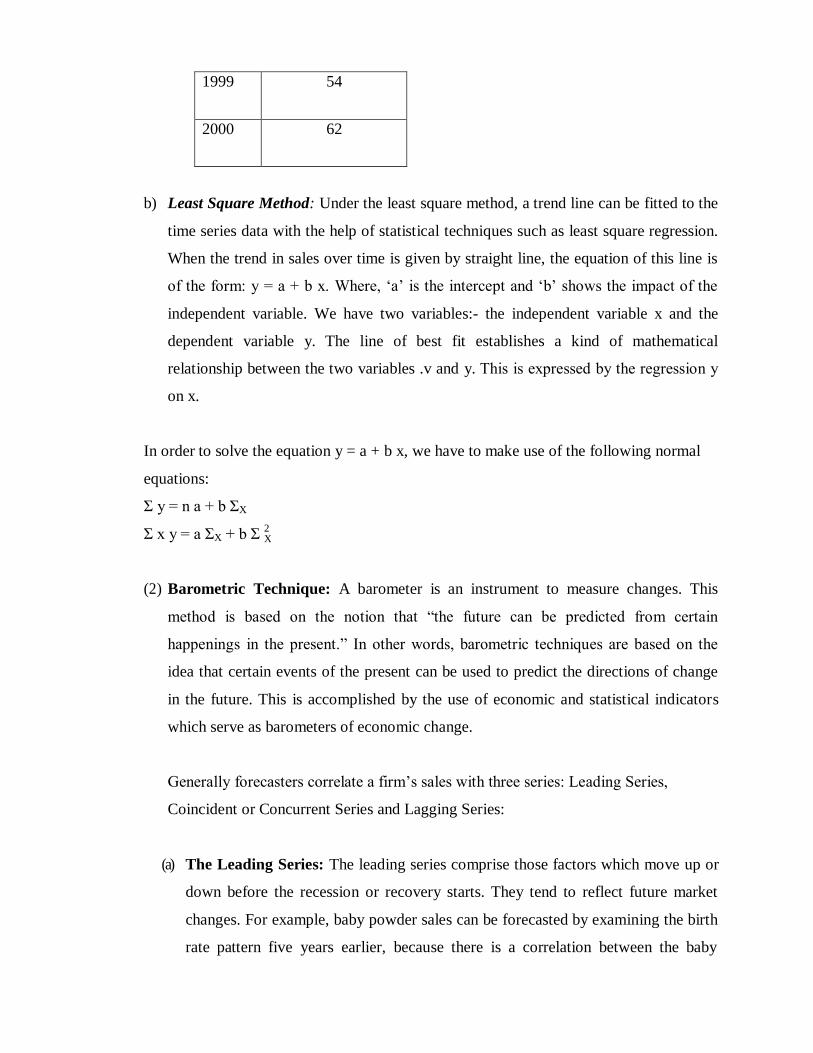
X
1999 54
2000 62
b) Least Square Method: Under the least square method, a trend line can be fitted to the
time series data with the help of statistical techniques such as least square regression.
When the trend in sales over time is given by straight line, the equation of this line is
of the form: y = a + b x. Where, ‗a‘ is the intercept and ‗b‘ shows the impact of the
independent variable. We have two variables:- the independent variable x and the
dependent variable y. The line of best fit establishes a kind of mathematical
relationship between the two variables .v and y. This is expressed by the regression у
on x.
In order to solve the equation y = a + b x, we have to make use of the following normal
equations:
Σ y = n a + b ΣX
Σ x y = a ΣX + b Σ 2
(2) Barometric Technique: A barometer is an instrument to measure changes. This
method is based on the notion that ―the future can be predicted from certain
happenings in the present.‖ In other words, barometric techniques are based on the
idea that certain events of the present can be used to predict the directions of change
in the future. This is accomplished by the use of economic and statistical indicators
which serve as barometers of economic change.
Generally forecasters correlate a firm‘s sales with three series: Leading Series,
Coincident or Concurrent Series and Lagging Series:
(a) The Leading Series: The leading series comprise those factors which move up or
down before the recession or recovery starts. They tend to reflect future market
changes. For example, baby powder sales can be forecasted by examining the birth
rate pattern five years earlier, because there is a correlation between the baby
powder sales and children of five years of age and since baby powder sales today
are correlated with birth rate five years earlier, it is called lagged correlation. Thus
we can say that births lead to baby soaps sales.
(b) Coincident or Concurrent Series: The coincident or concurrent series are those
which move up or down simultaneously with the level of the economy. They are
used in confirming or refuting the validity of the leading indicator used a few
months afterwards. Common examples of coinciding indicators are G.N.P itself,
industrial production, trading and the retail sector.
(c) The Lagging Series: The lagging series are those which take place after some
time lag with respect to the business cycle. Examples of lagging series are, labour
cost per unit of the manufacturing output, loans outstanding, leading rate of short
term loans, etc.
(3) Regression Analysis: It attempts to assess the relationship between at least two
variables (one or more independent and one dependent), the purpose being to predict
the value of the dependent variable from the specific value of the independent
variable. The basis of this prediction generally is historical data. This method starts
from the assumption that a basic relationship exists between two variables. An
interactive statistical analysis computer package is used to formulate the
mathematical relationship which exists.
For example, one may build up the sales model as:
Magnitude of Sales = a (price) + b (advertising) + c (price of the competing product) + d
(personal disposable income) + u
Where a, b, c, d are the constants which show the effect of corresponding variables as
sales. The constant u represents the effect of all the variables which have been left out in
the equation but having effect on sales. In the above equation, magnitude of sales is the
dependent variable and the variables on the right hand side of the equation are
independent variables. If the expected values of the independent variables are substituted
The regression equation can also be written in a multiplicative form as given below:
Magnitude of Sales = (Price) a + (Advertising)
b+ (Price of the rival products)
c +
(Personal disposable income) e + u
In the above case, the exponent of each variable indicates the elasticity of the
corresponding variable. Stating the independent variables in terms of notation, the
equation form is MS = Po.8
x Ao.42
x R °.83
x Y2°.68
x 40
Then we can say that 1 per cent increase in price leads to 0.8 per cent change in quantum
of sales and so on.
We can also take the logarithmic form of this multiple equation, and then we can write
the equation in an additive form as follows:
Log MS = a log P + b log A + с log R + d log Yd + log u
In the above equation, the coefficients a, b, c, and d represent the elasticity of variables P,
A, R and Yd respectively.
The co-efficient in the logarithmic regression equation are very useful in policy decision
making by the management.
(4) Econometric Models:
Econometric models are an extension of the regression technique whereby a system of
independent regression equation is solved. The requirement for satisfactory use of the
econometric model in forecasting is under three heads: variables, equations and data.
The appropriate procedure in forecasting by econometric methods is model building.
Econometrics attempts to express economic theories in mathematical terms in such a way
that they can be verified by statistical methods and to measure the impact of one
economic variable upon another so as to be able to predict future events.
Utility of Forecasting:
Forecasting cuts the risk associated with business fluctuations which generally produce
harmful effects in business, create unemployment, induce speculation, discourage capital
formation and reduce the profit margin. Forecasting is indispensable and it plays a very
important part in the determination of various policies. In modem times forecasting has
been put on scientific footing so that the risks associated with it have been considerably
minimized and the chances of precision increased.
Forecasts in India:
In most of the advanced countries there are specialized agencies. In India businessmen
are not at all interested in making scientific forecasts. They depend more on chance, luck
and astrology. They are highly superstitious and hence their forecasts are not correct.
Sufficient data are not available to make reliable forecasts. However, statistics alone do
not forecast future conditions. Judgment, experience and knowledge of the particular
trade are also necessary to make proper analysis and interpretation and to arrive at sound
conclusions.
Conclusion:
Decision support systems consist of three elements: decision, prediction and control. It is,
of course, with prediction that marketing forecasting is concerned. The forecasting of
sales can be regarded as a system, having inputs apprises and an output.
This simplistic view serves as a useful measure for the analysis of the true worth of sales
forecasting as an aid to management. In spite of all these no one can predict future
economic activity with certainty. Forecasts are estimates about which no one can be sure.
Forecasting Models
One can classify the various models available for forecasting into three categories:
Extrapolative models: They make use of past data and essentially prepare future
estimates by some methods of extrapolating the past data. For example, the demand
for soft drinks in a city or a locality could be estimated as 110 percent of the average
sales during the last three months. Similarly, the sale of new garments during the
festive season could be estimated to be a percentage of the festive season sales during
the previous year.
Casual models: It analyses data from the point view of cause-effect relationship. For
instance, to the process of estimating the demand for the new houses, the model will
identify the factors that could influence the demand for the new houses and establish
the relationship between these factors. The factors, for example, may include real
estate prices, housing finance options, disposable income of families, and cost of
construction and befits derived from tax laws. Once tea relationship between these
variables and the demand is established, it is possible to use it for estimating the
demand for new houses.
Subjective judgments: Another set of models consist of subjective judgment using
qualitative data. In some cases, it could be based on quantitative and qualitative data.
In several of these methods special mechanisms incorporated to draw substantially
from the expertise of group of senior managers using some collective decision
making framework.
Selection of a forecasting technique:
The selection of a forecasting technique depends on the following three factors:
(a) The characteristics of the decision making situation,
(b) The characteristics of the forecasting methods,
(c) Present situation
Criteria of a Good Forecasting Method:
There are thus, a good many ways to make a guess about future sales. They show contrast
in cost, flexibility and the adequate skills and sophistication. Therefore, there is a
problem of choosing the best method for a particular demand situation. There are certain
economic criteria of broader applicability which have been discussed as follows:
(i) Accuracy:
The forecast obtained must be accurate. How is an accurate forecast possible? To obtain
an accurate forecast, it is essential to check the accuracy of past forecasts against present
performance and of present forecasts against future performance. Accuracy cannot be
tested by precise measurement but buy judgment.
(ii) Plausibility:
The executive should have good understanding of the technique chosen and they should
have confidence in the techniques used. Understanding is also needed for a proper
interpretation of results. Plausibility requirements can often improve the accuracy of
results.
(iii) Durability:
Unfortunately, a demand function fitted to past experience may back cost very greatly
and still fall apart in a short time as a forecaster. The durability of the forecasting power
of a demand function depends partly on the reasonableness and simplicity of functions
fitted, but primarily on the stability of the understanding relationships measured in the
past. Of course, the importance of durability determines the allowable cost of the
forecast.
(iv) Flexibility:
Flexibility can be viewed as an alternative to generality. A long lasting function could be
set up in terms of basic natural forces and human motives. Even though fundamental, it
would nevertheless be hard to measure and thus not very useful. A set of variables whose
co-efficient could be adjusted from time to time to meet changing conditions in more
practical way to maintain intact the routine procedure of forecasting.
(v) Availability:
Immediate availability of data is a vital requirement and the search for reasonable
approximations to relevance in late data is a constant strain on the forecasters patience.
The techniques employed should be able to produce meaningful results quickly. Delay in
result will adversely affect the managerial decisions.
(vi) Economy:
Cost is a primary consideration which should be weighted against the importance of the
forecasts to the business operations. A question may arise: How much money and
managerial effort should be allocated to obtain a high level of forecasting accuracy? The
criterion here is the economic consideration.
(vii) Simplicity:
Statistical and econometric models are certainly useful but they are intolerably complex.
To those executives who have a fear of mathematics, these methods would appear to be
Latin or Greek. The procedure should, therefore, be simple and easy so that the
management may appreciate and understand why it has been adopted by the forecaster.
(viii) Consistency:
The forecaster has to deal with various components which are independent. If he does not
make an adjustment in one component to bring it in line with a forecast of another, he
would achieve a whole which would appear consistent.
In nutshell, an ideal forecasting method is one that yields returns over cost with accuracy,
seems reasonable, can be formalized for reasonably long periods, can meet new
circumstances adeptly and can give up-to-date results. The method of forecasting is not
the same for all products.
There is no unique method for forecasting the sale of any commodity. The forecaster may
try one or the other method depending upon his objective, data availability, the urgency
with which forecasts are needed, resources he intends to devote to this work and type of
commodity whose demand he wants to forecast.
Techniques of Inventory Control System
1. Setting up of various stock levels:
To avoid over-stocking and under stocking of materials, the management has to decide
about the maximum level, minimum level, re-order level, danger level and average level
of materials to be kept in the store. These terms are explained below:
a) Re-ordering level:
It is also known as ‗ordering level‘ or ‗ordering point‘ or ‗ordering limit‘. It is a point at
which order for supply of material should be made.
This level is fixed somewhere between the maximum level and the minimum level in
such a way that the quantity of materials represented by the difference between the re-
ordering level and the minimum level will be sufficient to meet the demands of
production till such time as the materials are replenished. Reorder level depends mainly
on the maximum rate of consumption and order lead time. When this level is reached, the
store keeper will initiate the purchase requisition.
Reordering level is calculated with the following formula:
Re-order level = Maximum Rate of consumption x max. lead time
(b) Maximum Level:
Maximum level is the level above which stock should never reach. It is also known as
‗maximum limit‘ or ‗maximum stock‘. The function of maximum level is essential to
avoid unnecessary blocking up of capital in inventories, losses on account of
deterioration and obsolescence of materials, extra overheads and temptation to thefts etc.
This level can be determined with the following formula. Maximum Stock level =
Reordering level + Reordering quantity — (Minimum Consumption x Minimum re-
ordering period)
(c) Minimum Level:
It represents the lowest quantity of a particular material below which stock should not be
allowed to fall. This level must be maintained at every time so that production is not held
up due to shortage of any material.
It is that level of inventories of which a fresh order must be placed to replenish the stock.
This level is usually determined through the following formula:
Minimum Level = Re-ordering level — (Normal rate of consumption x Normal delivery
period)
(d) Average Stock Level:
Average stock level is determined by averaging the minimum and maximum level of
stock.
The formula for determination of the level is as follows:
Average level =1/2 (Minimum stock level + Maximum stock level)
This may also be expressed by minimum level + 1/2 of Re-ordering Quantity.
(e) Danger Level:
Danger level is that level below which the stock should under no circumstances be
allowed to fall. Danger level is slightly below the minimum level and therefore the
purchases manager should make special efforts to acquire required materials and stores.
This level can be calculated with the help of following formula:
Danger Level =Average rate of consumption x Emergency supply time.
(f) Economic Order Quantity (E.O.Q.):
One of the most important problems faced by the purchasing department is how much to
order at a time. Purchasing in large quantities involve lesser purchasing cost. But cost of
carrying them tends to be higher. Likewise if purchases are made in smaller quantities,
holding costs are lower while purchasing costs tend to be higher.
Hence, the most economic buying quantity or the optimum quantity should be determined
by the purchase department by considering the factors such as cost of ordering, holding
or carrying.
This can be calculated by the following formula:
Q = √2AS/I
Where Q stands for quantity per order;
A stands for annual requirements of an item in terms of rupees;
S stands for cost of placement of an order in rupees; and
I stand for inventory carrying cost per unit per year in rupees.
2. Preparation of Inventory Budgets:
Organizations having huge material requirement normally prepare purchase budgets. The
purchase budget should be prepared well in advance. The budget for production and
consumable material and for capital and maintenance material should be separately
prepared.
Sales budget generally provide the basis for preparation of production plans. Therefore,
the first step in the preparation of a purchase budget is the establishment of sales budget.
As per the production plan, material schedule is prepared depending upon the amount and
return contained in the plan. To determine the net quantities to be procured, necessary
adjustments for the stock already held is to be made.
They are valued as standard rate or current market. In this way, material procurement
budget is prepared. The budget so prepared should be communicated to all departments
concerned so that the actual purchase commitments can be regulated as per budgets.
At periodical intervals actuals are compared with the budgeted figures and reported to
management which provide a suitable basis for controlling the purchase of materials,
3. Maintaining Perpetual Inventory System:
This is another technique to exercise control over inventory. It is also known as automatic
inventory system. The basic objective of this system is to make available details about the
quantity and value of stock of each item at all times. Thus, this system provides a rigid
control over stock of materials as physical stock can be regularly verified with the stock
records kept in the stores and the cost office.
4. Establishing Proper Purchase Procedures:
A proper purchase procedure has to be established and adopted to ensure necessary
inventory control. The following steps are involved.
(a) Purchase Requisition:
It is the requisition made by the various departmental heads or storekeeper for their
various material requirements. The initiation of purchase begins with the receipts of a
purchase requisition by the purchase department.
(b) Inviting Quotations:
The purchase department will invite quotations for supply of goods on the receipt of
purchase requisition.
(c) Schedule of Quotations:
The schedule of quotations will be prepared by the purchase department on the basis of
quotations received.
(d) Approving the supplier:
The schedule of quotations is put before the purchase committee who selects the supplier
by considering factors like price, quality of materials, terms of payment, delivery
schedule etc.
(e) Purchase Order:
It is the last step and the purchase order is prepared by the purchase department. It is a
written authorization to the supplier to supply a specified quality and quantity of material
at the specified time and place mentioned at the stipulated terms.
5. Inventory Turnover Ratio:
These are calculated to minimize the inventory by the use of the following formula:
Inventory Turnover Ratio = Cost of goods consumed/sold during the period/Average
inventory held during the period
The ratio indicates how quickly the inventory is used for production. Higher the ratio,
shorter will be the duration of inventory at the factory. It is the index of efficiency of
material management.
The comparison of various inventory turnover ratios at different items with those of
previous years may reveal the following four types of inventories:
(a) Slow moving Inventories:
These inventories have a very low turnover ratio. Management should take all possible
steps to keep such inventories at the lowest levels.
(b) Dormant Inventories:
These inventories have no demand. The finance manager has to take a decision whether
such inventories should be retained or scrapped based upon the current market price,
conditions etc.
(c) Obsolete Inventories:
These inventories are no longer in demand due to their becoming out of demand. Such
inventories should be immediately scrapped.
(d) Fast moving inventories:
These inventories are in hot demand. Proper and special care should be taken in respect
of these inventories so that the manufacturing process does not suffer due to shortage of
such inventories.
Perpetual inventory control system:
In a large b essential to have information about continuous availability of different types
of materials and stores purchased, issued and their balance in hand. The perpetual
inventory control system enables the manufacturer to know about the availability of these
materials and stores without undergoing the cumbersome process of physical stock
taking.
Under this method, proper information relating to receipt, issue and materials in hand is
kept. The main objective of this system is to have accurate information about the stock
level of every item at any time.
Perpetual inventory control system cannot-be successful unless and until it is
accompanied by a system of continuous stock taking i.e., checking the total stock of the
concern 3/4 times a year by picking 10/15 items daily (as against physical stock taking
which takes place once a year).
The items are taken in rotation. In order to have more effective control, the process of
continuous stock taking is usually undertaken by a person other than the storekeeper. This
will check the functioning of storekeeper also. The items may be selected at random to
have a surprise check. The success of the system of perpetual inventory control depends
upon the proper implementation of the system of continuous stock taking.
6. ABC analysis:
In order to exercise effective control over materials, A.B.C. (Always Better Control)
method is of immense use. Under this method materials are classified into three
categories in accordance with their respective values. Group ‗A‘ constitutes costly items
which may be only 10 to 20% of the total items but account for about 50% of the total
value of the stores.
A greater degree of control is exercised to preserve these items. Group ‗B‘ consists of
items which constitutes 20 to 30% of the store items and represent about 30% of the total
value of stores.
A reasonable degree of care may be taken in order to control these items. In the last
category i.e. group ‗Q‘ about 70 to 80% of the items is covered costing about 20% of the
total value. This can be referred to as residuary category. A routine type of care may be
taken in the case of third category.
This method is also known as ‗stock control according to value method‘, ‗selective value
approach‘ and ‗proportional parts value approach‘.
If this method is applied with care, it ensures considerable reduction in the storage
expenses and it is also greatly helpful in preserving costly items.
Key Terms
ABC Classification: Classification of inventory in three groups: an A group comprising
items with a less volume and large rupee value, a B group comprising items with
moderate volume and moderate rupee value, and C group comprising items with a large
volume and small volume.
Inventory refers to the materials in stock. It is also called the idle resource of an
enterprise. Inventories represent those items which are either stocked for sale or they are
in the process of manufacturing or they are in the form of materials which are yet to be
utilized.
Inventory control is a planned approach of determining what to order, when to order and
how much to order and how much to stock so that costs associated with buying and
storing are optimal without interrupting production and sales
Forecasting The process of analyzing and understanding current and past information to
understand the future patterns through a scientific and systemic approach is called
forecasting. And the process of estimating the future demand of product in terms of a unit
or monetary value is referred to as demand forecasting.
Inventory Control System is a system the encompasses all aspects of managing a
company's inventories; purchasing, shipping, receiving, tracking, warehousing and
storage, turnover, and reordering
Self-Assessment Question
1. Define the term ―forecasting‖ What is its purpose? Describe the uses and limitations
of weighted moving average method of forecasting.
2. Discuss critically the different models of forecasting.
3. What are the possible consequences if a large-scale firm places its product in the
market without having estimated the demand for its product?
4. Explain the regression method of demand forecasting.
5. Why is demand forecasting essential? Is demand forecasting equally important for
small and big; old or new business ventures.
6. What do you mean by ‗Inventory Control‘?
References
1. Everette E. Adam, Jr. Ronald J. Ebert, Production and Operations Management,
Prentice Hall of India
2. Nair N.G., Production and Operations Management, Tata Mc. Graw Hill
3. Panneerselvam R, Production and Operations Management, Prentice Hall of India
4. Shafer Scott M., Operations Management, John Wiley
*******
UNIT III
SCHEDULING
INTRODUCTION
Aggregate Planning is an intermediate planning method used to determine the necessary
resource capacity a firm will need in order to meet its expected demand. It is an
intermediate range capacity planning, usually covering 2/3 to 12/18 months. In other
words, it is the matching of capacity and the demand in such a way that cost are
minimized.
Definition
The term Aggregate Planning is defined as, ―An operational activity which does an
aggregate plan for the production process, in advance of 2 to 18 month, to give an idea to
management as to what quantity of materials and other resources are to be procured and
when, so that the total cost of operations of the organization is kept at minimum over that
period‖.
Aggregate planning is the process of developing, analyzing, and maintaining a
preliminary, approximate schedule of the overall operations of an organization. The
aggregate plan generally contains targeted sales forecasts, production levels, inventory
levels, and customer backlogs. This schedule is intended to satisfy the demand forecast at
a minimum cost. Properly done, aggregate planning should minimize the effects of
shortsighted, day-to-day scheduling, in which small amounts of material may be ordered
one week, with an accompanying layoff of workers, followed by ordering larger amounts
and rehiring workers the next week. This longer-term perspective on resource use can help
minimize short-term requirements changes with a resulting cost savings.
The main objectives of aggregate planning are summarized as hereunder:
Maximize customer service.
Minimize inventory investment.
Minimize changes in workforce levels.
Minimize changes in production rates.
Maximize utilization of plant and equipment.
In simple terms, aggregate planning is an attempt to balance capacity and demand in such
a way that costs are minimized. The term "aggregate" is used because planning at this

level includes all resources "in the aggregate;" for example, as a product line or family.
Aggregate resources could be total number of workers, hours of machine time, or tons of
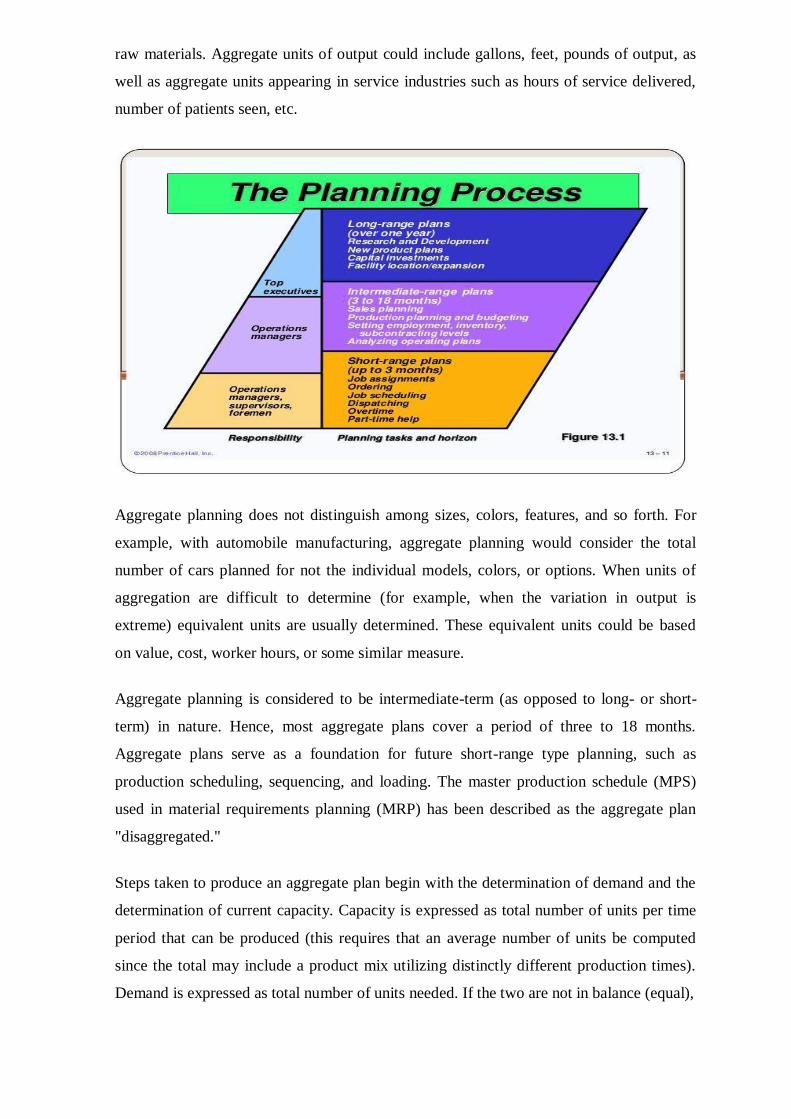
raw materials. Aggregate units of output could include gallons, feet, pounds of output, as
well as aggregate units appearing in service industries such as hours of service delivered,
number of patients seen, etc.
Aggregate planning does not distinguish among sizes, colors, features, and so forth. For
example, with automobile manufacturing, aggregate planning would consider the total
number of cars planned for not the individual models, colors, or options. When units of
aggregation are difficult to determine (for example, when the variation in output is
extreme) equivalent units are usually determined. These equivalent units could be based
on value, cost, worker hours, or some similar measure.
Aggregate planning is considered to be intermediate-term (as opposed to long- or short-
term) in nature. Hence, most aggregate plans cover a period of three to 18 months.
Aggregate plans serve as a foundation for future short-range type planning, such as
production scheduling, sequencing, and loading. The master production schedule (MPS)
used in material requirements planning (MRP) has been described as the aggregate plan
"disaggregated."
Steps taken to produce an aggregate plan begin with the determination of demand and the
determination of current capacity. Capacity is expressed as total number of units per time
period that can be produced (this requires that an average number of units be computed
since the total may include a product mix utilizing distinctly different production times).
Demand is expressed as total number of units needed. If the two are not in balance (equal),
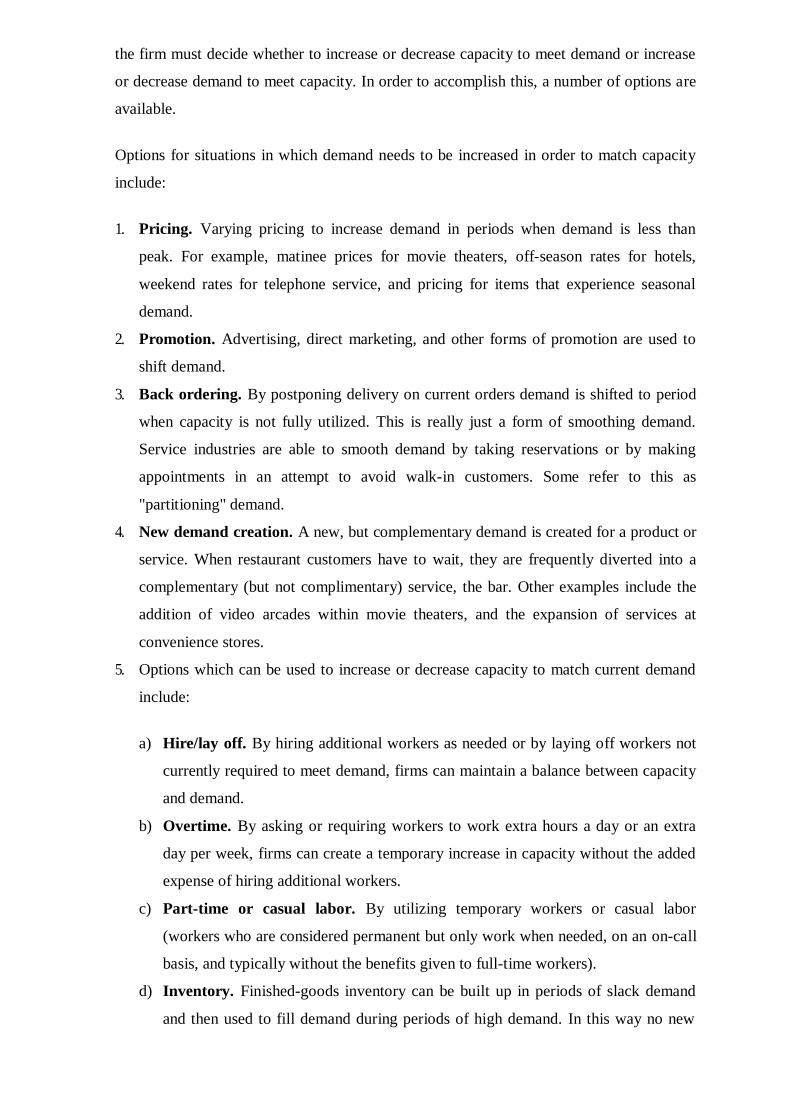
the firm must decide whether to increase or decrease capacity to meet demand or increase
or decrease demand to meet capacity. In order to accomplish this, a number of options are
available.
Options for situations in which demand needs to be increased in order to match capacity
include:
1. Pricing. Varying pricing to increase demand in periods when demand is less than
peak. For example, matinee prices for movie theaters, off-season rates for hotels,
weekend rates for telephone service, and pricing for items that experience seasonal
demand.
2. Promotion. Advertising, direct marketing, and other forms of promotion are used to
shift demand.
3. Back ordering. By postponing delivery on current orders demand is shifted to period
when capacity is not fully utilized. This is really just a form of smoothing demand.
Service industries are able to smooth demand by taking reservations or by making
appointments in an attempt to avoid walk-in customers. Some refer to this as
"partitioning" demand.
4. New demand creation. A new, but complementary demand is created for a product or
service. When restaurant customers have to wait, they are frequently diverted into a
complementary (but not complimentary) service, the bar. Other examples include the
addition of video arcades within movie theaters, and the expansion of services at
convenience stores.
5. Options which can be used to increase or decrease capacity to match current demand
include:
a) Hire/lay off. By hiring additional workers as needed or by laying off workers not
currently required to meet demand, firms can maintain a balance between capacity
and demand.
b) Overtime. By asking or requiring workers to work extra hours a day or an extra
day per week, firms can create a temporary increase in capacity without the added
expense of hiring additional workers.
c) Part-time or casual labor. By utilizing temporary workers or casual labor
(workers who are considered permanent but only work when needed, on an on-call
basis, and typically without the benefits given to full-time workers).
d) Inventory. Finished-goods inventory can be built up in periods of slack demand
and then used to fill demand during periods of high demand. In this way no new
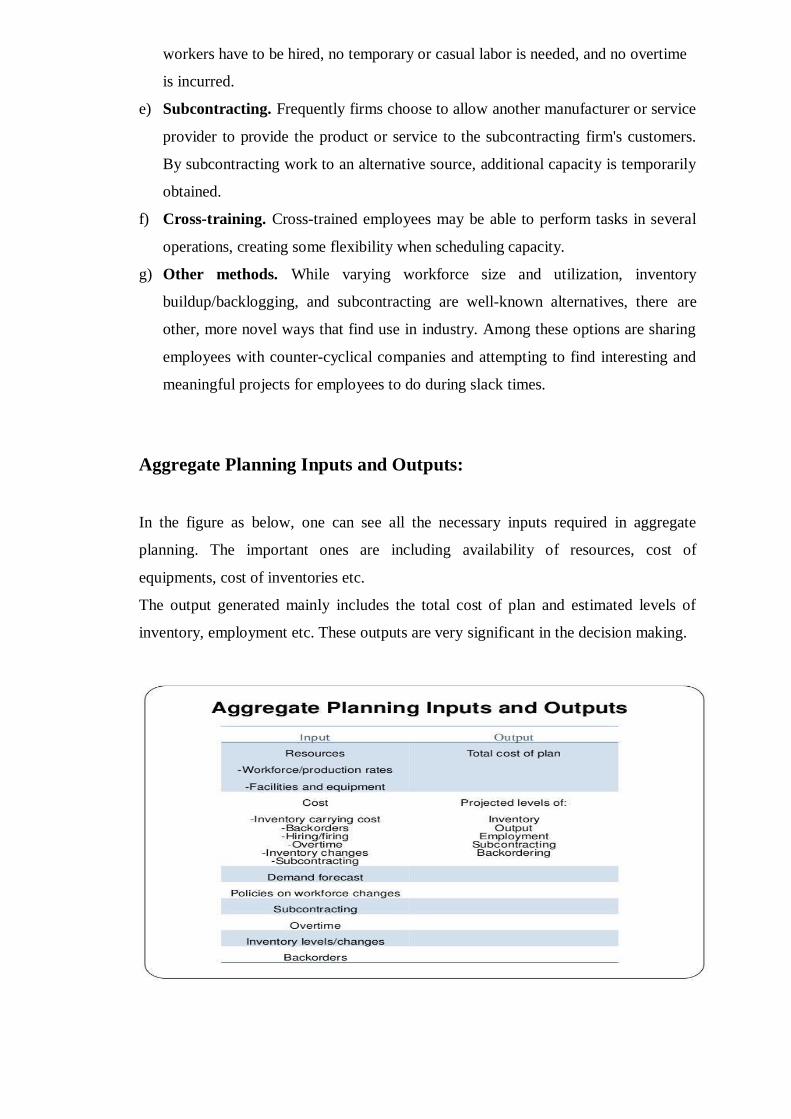
workers have to be hired, no temporary or casual labor is needed, and no overtime
is incurred.
e) Subcontracting. Frequently firms choose to allow another manufacturer or service
provider to provide the product or service to the subcontracting firm's customers.
By subcontracting work to an alternative source, additional capacity is temporarily
obtained.
f) Cross-training. Cross-trained employees may be able to perform tasks in several
operations, creating some flexibility when scheduling capacity.
g) Other methods. While varying workforce size and utilization, inventory
buildup/backlogging, and subcontracting are well-known alternatives, there are
other, more novel ways that find use in industry. Among these options are sharing
employees with counter-cyclical companies and attempting to find interesting and
meaningful projects for employees to do during slack times.
Aggregate Planning Inputs and Outputs:
In the figure as below, one can see all the necessary inputs required in aggregate
planning. The important ones are including availability of resources, cost of
equipments, cost of inventories etc.
The output generated mainly includes the total cost of plan and estimated levels of
inventory, employment etc. These outputs are very significant in the decision making.
The main benefits are as follows:
Determine demand for each period.
Determine capacities for each period.
Determine pertinent company policies.
Determine unit cost based on all relevant sources.
Develop alternative plans and calculate the cost for each.
Choose the best overall plan based on company objectives and cost.
Aggregate Planning Strategies
There are two pure planning strategies available to the aggregate planner: a level strategy
and a chase strategy. Firms may choose to utilize one of the pure strategies in isolation, or
they may opt for a strategy that combines the two.
LEVEL STRATEGY
A level strategy seeks to produce an aggregate plan that maintains a steady production rate
and/or a steady employment level. In order to satisfy changes in customer demand, the
firm must raise or lower inventory levels in anticipation of increased or decreased levels of
forecast demand. The firm maintains a level workforce and a steady rate of output when
demand is somewhat low. This allows the firm to establish higher inventory levels than are
currently needed. As demand increases, the firm is able to continue a steady production
rate/steady employment level, while allowing the inventory surplus to absorb the increased
demand.
A second alternative would be to use a backlog or backorder. A backorder is simply a
promise to deliver the product at a later date when it is more readily available, usually
when capacity begins to catch up with diminishing demand. In essence, the backorder is a
device for moving demand from one period to another, preferably one in which demand is
lower, thereby smoothing demand requirements over time.
A level strategy allows a firm to maintain a constant level of output and still meet demand.
This is desirable from an employee relations standpoint. Negative results of the level
strategy would include the cost of excess inventory, subcontracting or overtime costs, and
backorder costs, which typically are the cost of expediting orders and the loss of customer
goodwill.
CHASE STRATEGY
A chase strategy implies matching demand and capacity period by period. This could
result in a considerable amount of hiring, firing or laying off of employees; insecure and
unhappy employees; increased inventory carrying costs; problems with labor unions; and
erratic utilization of plant and equipment. It also implies a great deal of flexibility on the
firm's part. The major advantage of a chase strategy is that it allows inventory to be held to
the lowest level possible, and for some firms this is a considerable savings. Most firms
embracing the just-in-time production concept utilize a chase strategy approach to
aggregate planning.
Most firms find it advantageous to utilize a combination of the level and chase strategy. A
combination strategy (sometimes called a hybrid or mixed strategy) can be found to better
meet organizational goals and policies and achieve lower costs than either of the pure
strategies used independently.
Techniques for Aggregate Planning
Techniques for aggregate planning range from informal trial-and-error approaches, which
usually utilize simple tables or graphs, to more formalized and advanced mathematical
techniques. William Stevenson's textbook Production/Operations Management contains
an informal but useful trial-and-error process for aggregate planning presented in outline
form. This general procedure consists of the following steps:
1. Determine demand for each period.
2. Determine capacity for each period. This capacity should match demand, which
means it may require the inclusion of overtime or subcontracting.
3. Identify company, departmental, or union policies that are pertinent. For example,
maintaining a certain safety stock level, maintaining a reasonably stable workforce,
backorder policies, overtime policies, inventory level policies, and other less explicit
rules such as the nature of employment with the individual industry, the possibility of
a bad image, and the loss of goodwill.
4. Determine unit costs for units produced. These costs typically include the basic
production costs (fixed and variable costs as well as direct and indirect labor costs).
Also included are the costs associated with making changes in capacity. Inventory
holding costs must also be considered, as should storage, insurance, taxes, spoilage,
and obsolescence costs. Finally, backorder costs must be computed. While difficult to
measure, this generally includes expediting costs, loss of customer goodwill, and
revenue loss from cancelled orders.
5. Develop alternative plans and compute the cost for each.
6. If satisfactory plans emerge, select the one that best satisfies objectives. Frequently,
this is the plan with the least cost. Otherwise, return to step 5.
Passive (reactive) Strategies in Aggregate Planning:
There are mainly two types of approaches in aggregate planning that have been discussed
as below:
Chase approach
The chase method helps the firms to match production and demand by hiring and firing
workers as necessary to control output. The Capacities (workforce levels, production
schedules, output rates, etc.) are adjusted to match demand requirements over the planning
horizon.
Merits:
Anticipation inventory is not required, and investment in inventory is low
Labor utilization is kept high
Demerits:
Expense of adjusting output rates and/or workforce levels
Alienation of workforce
Level Approach
The Level method allows for a constant rate of production and uses inventory levels to
absorb fluctuations in demand. The Capacities (workforce levels, production schedules,
output rates, etc.) are kept constant over the planning horizon
Merits:
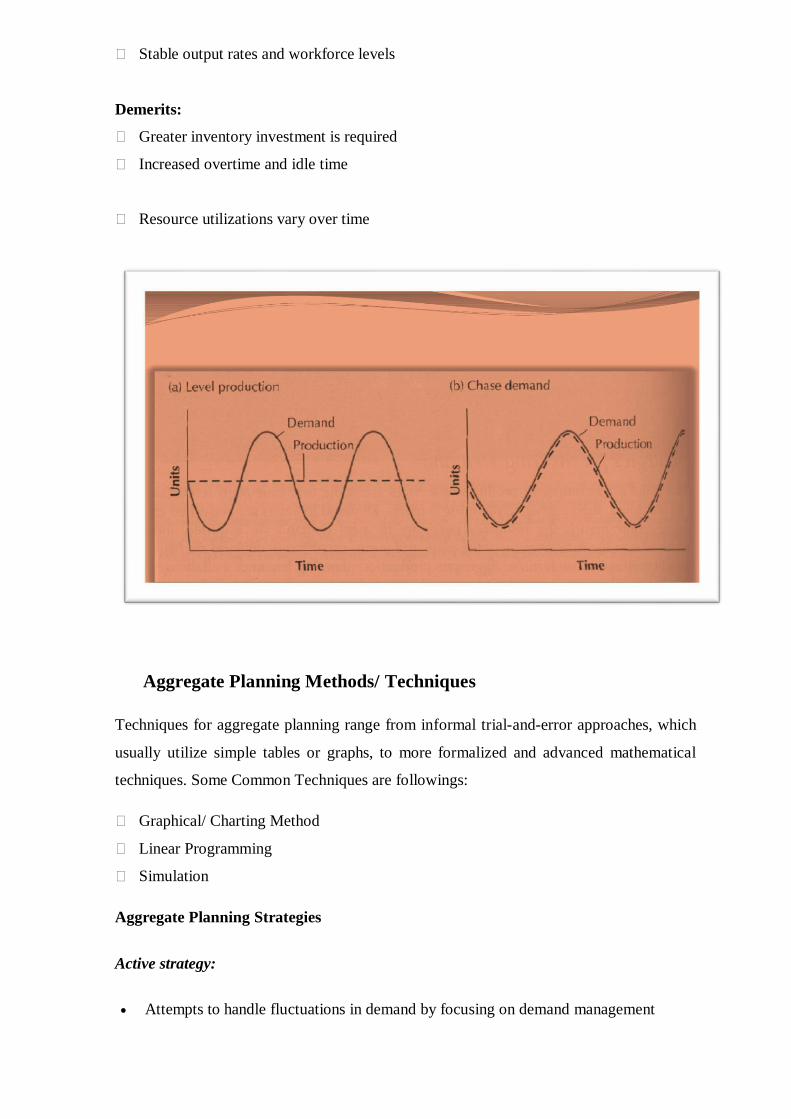
Stable output rates and workforce levels
Demerits:
Greater inventory investment is required
Increased overtime and idle time
Resource utilizations vary over time
Aggregate Planning Methods/ Techniques
Techniques for aggregate planning range from informal trial-and-error approaches, which
usually utilize simple tables or graphs, to more formalized and advanced mathematical
techniques. Some Common Techniques are followings:
Graphical/ Charting Method
Linear Programming
Simulation
Aggregate Planning Strategies
Active strategy:
Attempts to handle fluctuations in demand by focusing on demand management
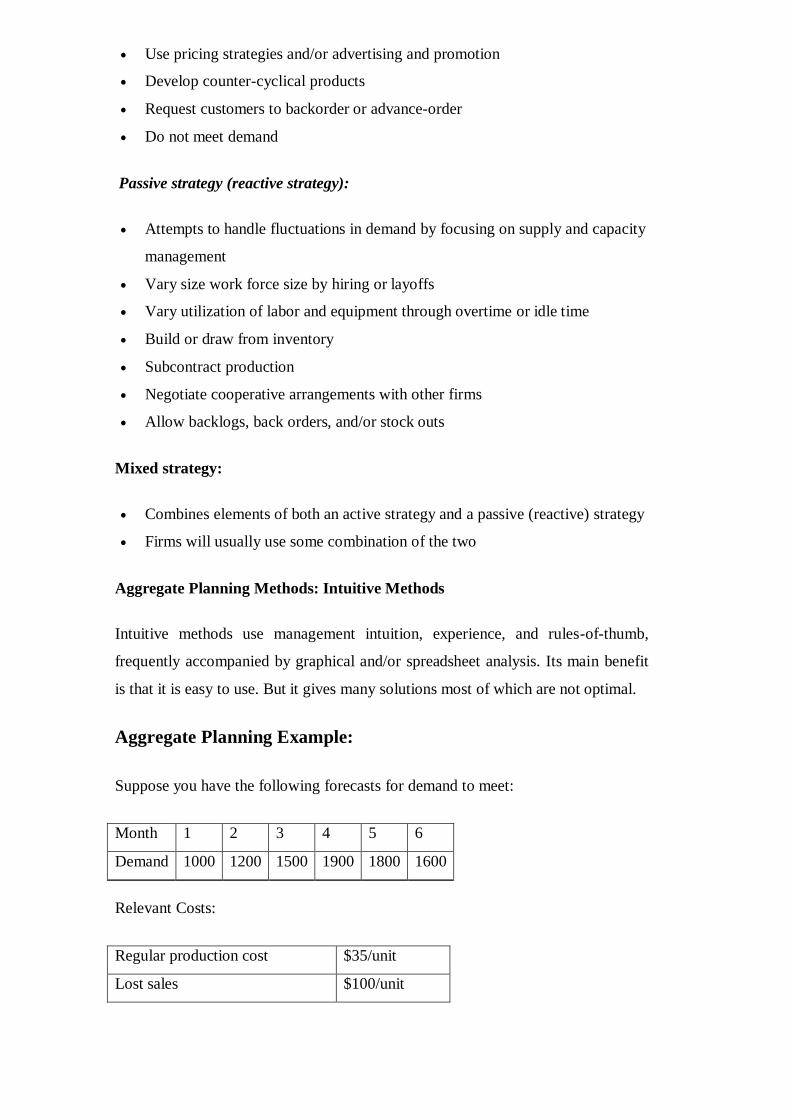
Use pricing strategies and/or advertising and promotion
Develop counter-cyclical products
Request customers to backorder or advance-order
Do not meet demand
Passive strategy (reactive strategy):
Attempts to handle fluctuations in demand by focusing on supply and capacity
management
Vary size work force size by hiring or layoffs
Vary utilization of labor and equipment through overtime or idle time
Build or draw from inventory
Subcontract production
Negotiate cooperative arrangements with other firms
Allow backlogs, back orders, and/or stock outs
Mixed strategy:
Combines elements of both an active strategy and a passive (reactive) strategy
Firms will usually use some combination of the two
Aggregate Planning Methods: Intuitive Methods
Intuitive methods use management intuition, experience, and rules-of-thumb,
frequently accompanied by graphical and/or spreadsheet analysis. Its main benefit
is that it is easy to use. But it gives many solutions most of which are not optimal.
Aggregate Planning Example:
Suppose you have the following forecasts for demand to meet:
Month 1 2 3 4 5 6
Demand 1000 1200 1500 1900 1800 1600
Relevant Costs:
Regular production cost $35/unit
Lost sales $100/unit
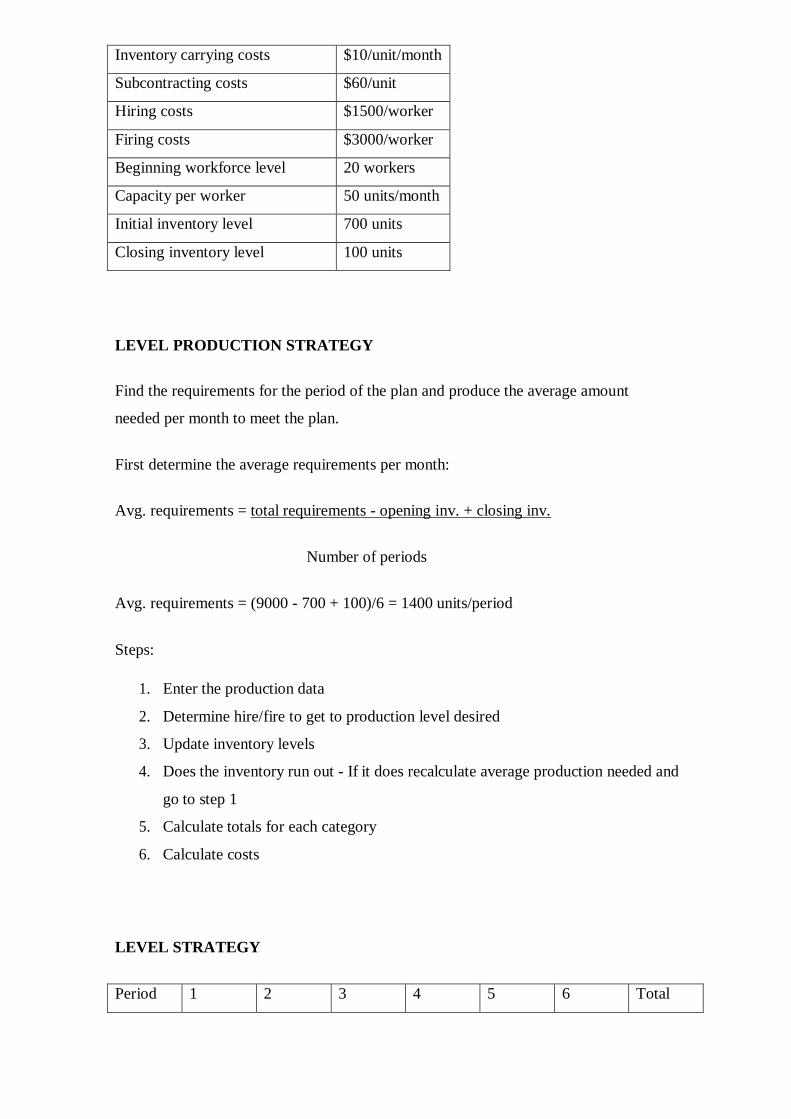
Inventory carrying costs $10/unit/month
Subcontracting costs $60/unit
Hiring costs $1500/worker
Firing costs $3000/worker
Beginning workforce level 20 workers
Capacity per worker 50 units/month
Initial inventory level 700 units
Closing inventory level 100 units
LEVEL PRODUCTION STRATEGY
Find the requirements for the period of the plan and produce the average amount
needed per month to meet the plan.
First determine the average requirements per month:
Avg. requirements = total requirements - opening inv. + closing inv.
Number of periods
Avg. requirements = (9000 - 700 + 100)/6 = 1400 units/period
Steps:
1. Enter the production data
2. Determine hire/fire to get to production level desired
3. Update inventory levels
4. Does the inventory run out - If it does recalculate average production needed and
go to step 1
5. Calculate totals for each category
6. Calculate costs
LEVEL STRATEGY
Period 1 2 3 4 5 6 Total
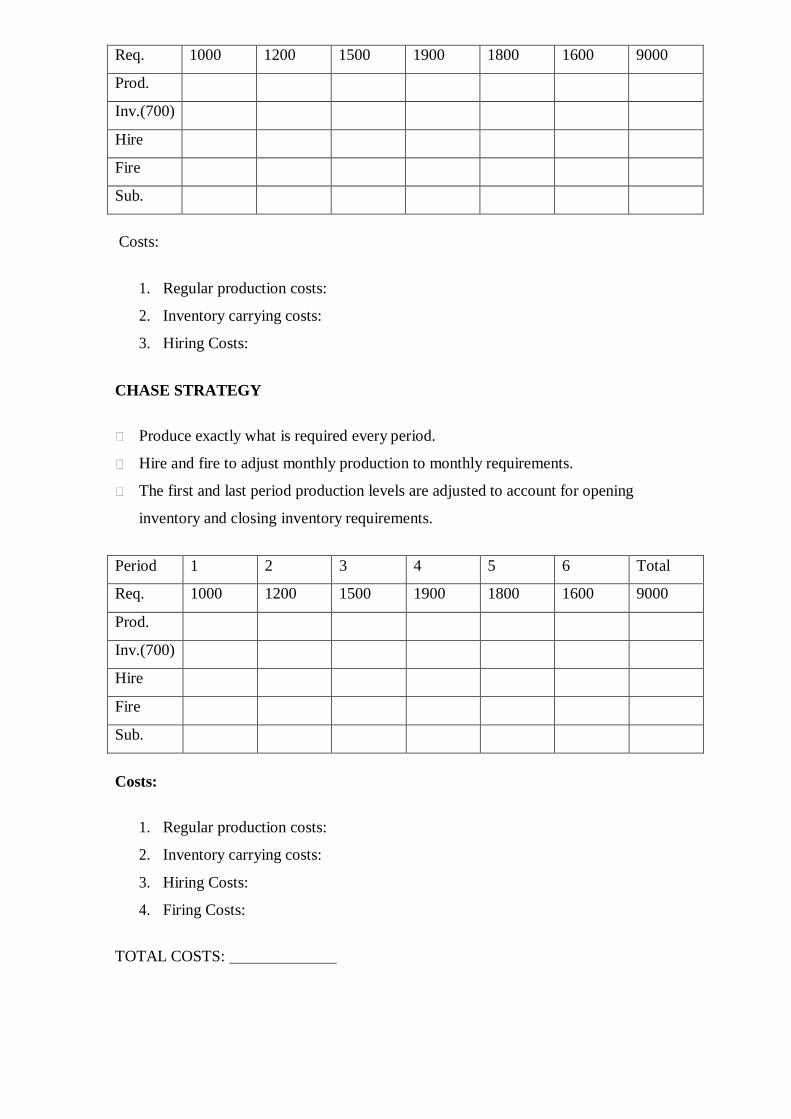
Req. 1000 1200 1500 1900 1800 1600 9000
Prod.
Inv.(700)
Hire
Fire
Sub.
Costs:
1. Regular production costs:
2. Inventory carrying costs:
3. Hiring Costs:
CHASE STRATEGY
Produce exactly what is required every period.
Hire and fire to adjust monthly production to monthly requirements.
The first and last period production levels are adjusted to account for opening
inventory and closing inventory requirements.
Period 1 2 3 4 5 6 Total
Req. 1000 1200 1500 1900 1800 1600 9000
Prod.
Inv.(700)
Hire
Fire
Sub.
Costs:
1. Regular production costs:
2. Inventory carrying costs:
3. Hiring Costs:
4. Firing Costs:
TOTAL COSTS:
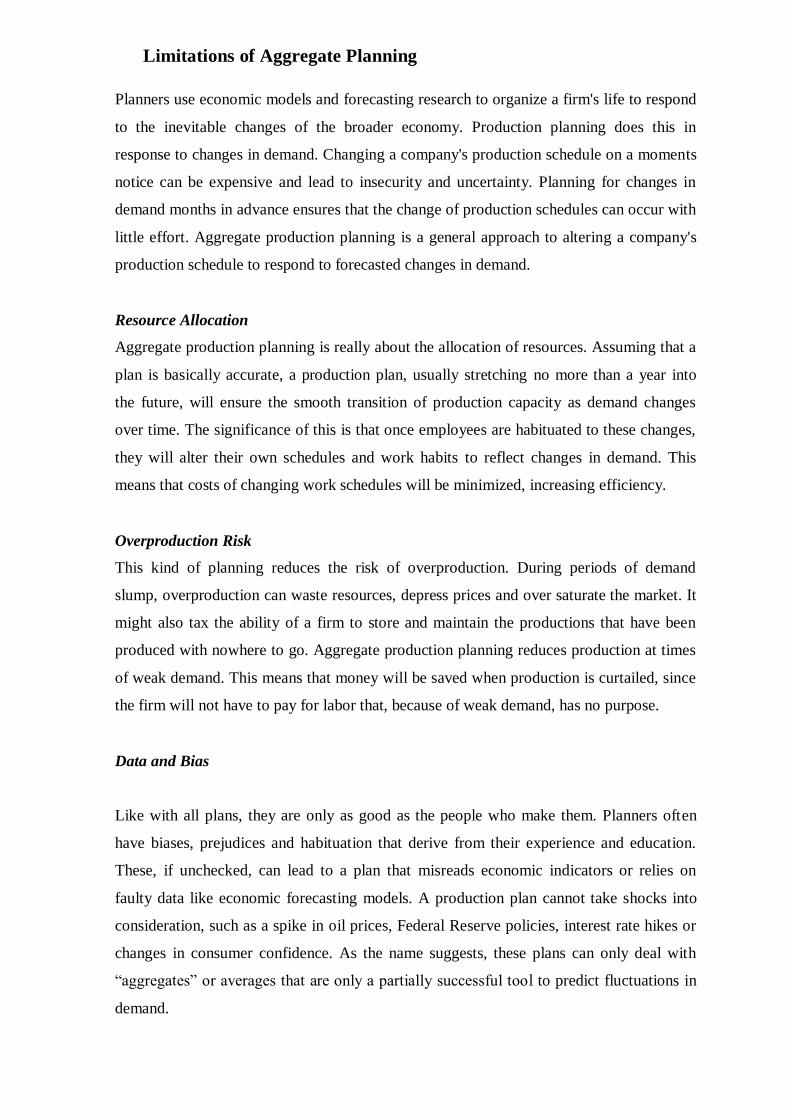
Limitations of Aggregate Planning
Planners use economic models and forecasting research to organize a firm's life to respond
to the inevitable changes of the broader economy. Production planning does this in
response to changes in demand. Changing a company's production schedule on a moments
notice can be expensive and lead to insecurity and uncertainty. Planning for changes in
demand months in advance ensures that the change of production schedules can occur with
little effort. Aggregate production planning is a general approach to altering a company's
production schedule to respond to forecasted changes in demand.
Resource Allocation
Aggregate production planning is really about the allocation of resources. Assuming that a
plan is basically accurate, a production plan, usually stretching no more than a year into
the future, will ensure the smooth transition of production capacity as demand changes
over time. The significance of this is that once employees are habituated to these changes,
they will alter their own schedules and work habits to reflect changes in demand. This
means that costs of changing work schedules will be minimized, increasing efficiency.
Overproduction Risk
This kind of planning reduces the risk of overproduction. During periods of demand
slump, overproduction can waste resources, depress prices and over saturate the market. It
might also tax the ability of a firm to store and maintain the productions that have been
produced with nowhere to go. Aggregate production planning reduces production at times
of weak demand. This means that money will be saved when production is curtailed, since
the firm will not have to pay for labor that, because of weak demand, has no purpose.
Data and Bias
Like with all plans, they are only as good as the people who make them. Planners often
have biases, prejudices and habituation that derive from their experience and education.
These, if unchecked, can lead to a plan that misreads economic indicators or relies on
faulty data like economic forecasting models. A production plan cannot take shocks into
consideration, such as a spike in oil prices, Federal Reserve policies, interest rate hikes or
changes in consumer confidence. As the name suggests, these plans can only deal with
―aggregates‖ or averages that are only a partially successful tool to predict fluctuations in
demand.
Labor and Uncertainty
Labor remains one of the most serious problems of aggregate production planning. For
example, a company plans to increase overtime hours and hire part-time workers for peak
demand seasons. It will then cut hours and give unpaid furloughs during poor demand
seasons. This implies that workers, especially long-term ones, will become increasingly
dissatisfied and cynical about company policy and will not work up to capacity. Even
more, well-qualified workers will choose other companies because of the constant
insecurity of such a production policy. As most aggregate models forecast alternations in
labor conditions, this can cause problems among full-time workers. It introduces
insecurities and uncertainty into the workplace.
Summary
Aggregate planning is an "intermediate-range capacity planning technique, usually
covering a time frame of 2-12 months for a production process, in order to keep the costs
of operations at a minimum." Companies use aggregate planning to help make decisions
about their capacity because seasonal variations in demand are difficult to predict
accurately. The main goal of the company is to match resources with the expected
demand. This goal is achieved by taking into account a diverse amount of factors such as:
decisions on output rates, overtime, employment levels and changes, inventory levels and
changes, back orders, and subcontracting work.
A more extensive form of aggregate planning is sales and operations planning. Sales and
operations planning are "intermediate-range decisions to balance supply and demand,
integrating financial and operations planning". Sales and operations planning decisions are
made using demand forecasts, financial limits, and organization's capacity constraints. The
sales and operations plan carries information that impacts the supply chain.
Self-Assessment Questions
1) Which of the following is a computerized model that can be tested under different
scenarios to identify acceptable solutions?
a. test model
b. difference model
c. simulation model
d. changing model
e. growth model
The answer is C.
2) Which of the following is not included in a planning sequence for aggregate
planning?
A. business plan
b. aggregate plan
c. master schedule
d. master plan
e. the entire above are included
The answer is E.
3) What are the three most significant factors an organization has to consider when
choosing a start:
a. labor, demand, and time
b. company policy, flexibility, and costs
c. labor, time, and costs
d. company policy, flexibility, and demand
e. flexibility, time, and costs
The answer is B.
4) What are the key issue(s) in aggregate planning?
a. how to handle variations in demand
b. how to handle changes
c. how to manage cost
d. both a & b
e. none of the above
the answer is C.
5) what are the three types of aggregate planning?
a. long-range plans, intermediate plans, and short-range plans.
b. Long term demand, short term demand, economies of scale
c. minimization curves, inflections points in cost schedules, profit maximization
d. pricing models, statistical evaluation, tax shelter
e. freight costs, J-I-T delivery, logistics
The answer is A.
6) Which of the following are examples of service organizations that use aggregate
planning?
a. airlines
b. hospitals
c. restaurants
d. A & B
e. all of the above
ANSWER: E
7) What are the three duties of master scheduling?
a) Provide delivery dates for orders, deal with problems, and schedule aggregate
plans
b) Evaluate the impact of new orders, provide delivery dates for orders, and deal with
problems
c) Schedule aggregate plans evaluate impact of new orders; deal with problems of
previous orders
d) Evaluate the impact of old orders, provide delivery dates for new orders, and
disaggregate plans
e) Deal with new and old problems, evaluate the impact of production, and provide
delivery dates for new orders.
Answer: B
8) What are the differences between manufacturing and services for aggregate planning?
a. Demand for service can be difficult to predict
b. Capacity availability
c. Labor flexibility
d. Services occur when they are rendered
e. All of above
Answer is E.
9) Which of the following are Demand Options?
a) Pricing
b) Promotion
c) Using back orders
d) Creating new demand
e) all of the above
Answer: E
10) Which of the following is NOT a supply option?
a) Hire and lay off workers
b) Overtime/slack time
c) Subcontractors
d) Promotion
e) All of the above ARE supply options
Answer: D
Key Terms
Smoothing: refers to costs that result from changing production and workforce levels
from one period to the next.
Bottleneck Problems: It is the inability of the system to respond to sudden changes in
demand as a result of capacity restrictions.
Planning Horizon: The number of periods for which the demand is to be forecasted, and
hence the number of periods for which workforce and inventory levels are to be
determined, must be specified in advance.
Treatment of Demand: Aggregate planning methodology requires the assumption that
demand is known with certainty. This is simultaneously a weakness and a strength of the
approach.
References
Chopra, Sunil and Peter Meindl. Supply Chain Management: Strategy, Planning, and
Operation. Upper Saddle River, NJ: Pearson Prentice Hall, 2004.
Dejonckheere, J., S.M. Disney, M. Lambrecht, and D.R. Towill. "The Dynamics of
Aggregate Planning‖. Production Planning & Control 14, no. 6, (2003): 497–516.
Finch, Byron J. Operations Now. Boston: McGraw-Hill Irwin, 2004.
Hung, Rudy. "Annualized Hours and Aggregate Planning." Production and Inventory
Management Journal 38, no. 4 (1997)
Iyer, Ananth V., Vinayak Deshpande, and Zhengping Wu. "A Postponement Model for
Demand Management." Management Science 49, no. 8, (2003): 983–1002.
Stevenson, William J. Production Operations Management. Boston: McGraw-Hill Irwin,
2004.

Nahmias, Steven ,"Production and Operation Analysis". New York, New York: McGraw-
Hill Inrwin, 2009
Schroeder, R.G, Operations Management. New York, New York: McGraw-Hill Inrwin,
2007
*******
UNIT IV
SCHEDULING AND ROUTING
Structure
Objectives
Introduction
Concept of Scheduling
Scheduling Decisions
Elements of Shop Floor Scheduling
Operations Controlling
Elements of Operations Control
Summary
Key Terms
Self-Assessment question
References
7.0 Objectives:
This chapter will help the students to understand the:
1. The use of scheduling in operations
2. Principles of scheduling
3. Various elements of shop floor scheduling
4. Operation control mechanism
5. Elements of operations control
Introduction
Operations (or production) are the process and activities for transforming resources into
finished services and goods for customers. The operations function creates four kinds of
utility – time utility, place utility; possess utility, and form utility – to meet customer
needs.
Performing a service is different from manufacturing a good in several key ways: the raw
material for service production includes the people who are seeking the service. In
addition, most services are intangible, customized, and cannot be stored. Because of these
characteristics, service providers generally focus on the customer service, often
acknowledging the customer as part of the operations process.
Operations planning for both goods and services involve the analysis of five key factors:
Capacity planning requires determining how much of a product a firm must be able to
produce. Location planning involves choosing among potential facility sites. Layout
planning entails designing an effective, efficient facility. Quality planning ensures that
products meet a firm‘s quality standards. Methods planning involve identifying specific
production steps and methods for performing them.
What is an operation scheduling?
Scheduling is actually concerned with establishing both the timing and the use of
resources within a firm. First, keeping in view the estimated future demand of the final
product, aggregate planning is done for long time horizon usually for 1-3 years. In turn,
this long term plan is broken down in master production schedules for shorter time period.
Master production schedule is a document that comprises of the complete information
about the quantity and time of different products to be produced. On the basis of this,
demand for the raw material, components etc (known as secondary demand) are estimated
under the material requirement planning system. Finally, very short term schedules are
prepared which establish both the timing and the use of resources within a firm.
In fact, schedules are the operations plans which are executed at lowest (shop floor) level.
Thus, schedules ensure timely production and delivery of products and the availability of
required quantity of resources when they are actually required without interrupting the
production.
Similarly, operations control is also a mechanism which is exercised to ensure the
continuous production as per the planned one. In case of any discrepancy, taking an
immediate remedial action in order to produce defect free products on scheduled time
Concept of Scheduling:
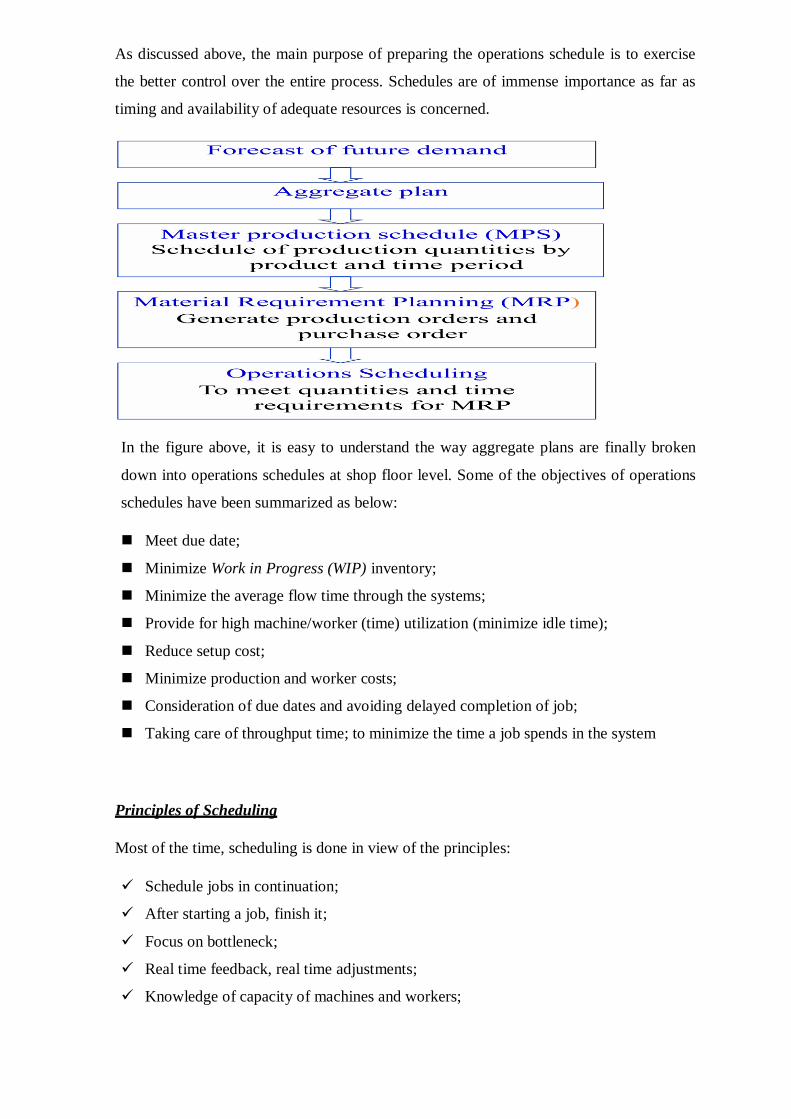
As discussed above, the main purpose of preparing the operations schedule is to exercise
the better control over the entire process. Schedules are of immense importance as far as
timing and availability of adequate resources is concerned.
In the figure above, it is easy to understand the way aggregate plans are finally broken
down into operations schedules at shop floor level. Some of the objectives of operations
schedules have been summarized as below:
Meet due date;
Minimize Work in Progress (WIP) inventory;
Minimize the average flow time through the systems;
Provide for high machine/worker (time) utilization (minimize idle time);
Reduce setup cost;
Minimize production and worker costs;
Consideration of due dates and avoiding delayed completion of job;
Taking care of throughput time; to minimize the time a job spends in the system
Principles of Scheduling
Most of the time, scheduling is done in view of the principles:
Schedule jobs in continuation;
After starting a job, finish it;
Focus on bottleneck;
Real time feedback, real time adjustments;
Knowledge of capacity of machines and workers;
Continuous enhancement of product and process;
Approaches to Scheduling:
There are mainly two types of approaches which are commonly used:
1. Forward scheduling: in forward scheduling, the scheduler schedules all activities
forward in time.
(a) Jobs are given earliest available time slot in operation;
(b) Usually excessive WIP results.
2. Backward scheduling: In backward scheduling, the scheduler begins with a planned
date and moves backward in time.
(a) Start with due date and work backward through operations reviewing lead times;
(b) Less WIP but must have accurate lead time.
Scheduling Decisions:
Whenever, different types of products are produced using the same facility, complete
changeover of the system is required. Changeover is the cost of changing a processing
step in a production system from one job to another. Such cost corresponds to changing
machine settings, getting job instructions, changing material and changing tools.
In case of changeover, one has to be very cautious in changing the schedules also. When
there is any changeover in the organization, in addition to operations schedules, the
components of production system that need to be changed are as followings:
INPUTS: When there is a change over in a organization production system inputs are
changed according to the production. Inputs include raw materials, components etc;
OUTPUT: When inputs are changed so automatically outputs are also changed in the
production system;
LOGISTICS: logistics are also will be changed in the changeover of production
system;
COST: Cost is the main factor in change over. As cost may increase or decrease in
the changeover of production system in the organization;
LABOUR: Labour is also important factor as which labour will do which it has to be
assigned;
TIME: In changeover production system in an organization time factor matters the
most. As it is not be same that first production done in a given time will be done as
of same time in other production. The time may vary now.
Elements of Shop Floor Scheduling
As we know by the discussion so far, schedules are the operations plans which are
executed at the lowest (shop floor) level. The classic approaches to shop floor scheduling
focuses on the following elements:
Job arrival patterns: static or dynamic
Static: jobs arrive in batch;
Dynamic: jobs arrive over time interval according to some statistical
distribution.
Numbers and variety of machines in the shop floor
If there is only one machine or if a group of machines can be treated as one
machine, the scheduling problem is much more simplified;
As number of variety of machines increase, the more complex the scheduling
problems is likely to become.
Ratio of workers to machines
Machine limited system: more workers than machine or equal number workers
and machines;
Labor-limited system: more machines than worker.
Flow pattern of jobs: flow shop or job shop
Flow shop: all jobs follow the same paths from one machine to the next;
Job shop: no similar pattern of movement of jobs from one machine to the next
Job sequencing
Sequencing or priority sequencing: the process of determining which job is
started first on some machines or work center by priority rule;
Priority rule: the rule used for obtaining a job sequencing;
Priority rule evaluation criteria
To meet corresponding objectives of scheduling;
Common standard measures:
Meeting due date of customers or downstream operations;
Minimizing flow time (the time a job spends in the shop flow);
Minimizing WIP;
Minimizing idle time of machines and workers (Maximizing utilization).
Loading:
Loading is concerned with assigning jobs to work centers and corresponding to various
machines in the work centers.
Approaches to Loading work centers
a) Infinite Loading: In infinite loading jobs are assigned to work centers without
considering the capacity of the work centers
b) Finite Loading: Finite Loading estimates the actual start and stop time of each job
at each work centers.
Sequencing:
Sequencing means determining the order in which jobs are processed. The order is also
require for work processed at individual workstation. If work centers are heavily loaded
and jobs are lengthy, the situation can become complicated. The order of processing is
vital when it comes to the cost of waiting to be processed and the cost of ideal time at
work centers.
Rules for Sequencing:
1. FCFS (first come-first served)
1. Jobs are processed in the sequence in which they entered the shop;
2. The simplest and nature way of sequencing as in queuing of a bank
2. SPT (shortest processing time)
1. Jobs are sequenced in increasing order of their processing time;
2. The job with shortest processing time is first, the one with the next shortest
processing time is second, and so on;
3. EDD (earliest due date)
1. Jobs are sequenced in increasing order of their due dates;
2. The job with earliest due date is first, the one with the next earliest due date is
second, and so on;
4. CR (Critical ratio)
1. Critical ratio is the remaining time until due date divided by processing time;
2. Scheduling the job with the smallest CR next;
3. CR provides the balance between SPT and EDD, such that the task with shorter
remaining time and longer processing time takes higher priority;
4. CR will become smaller as the current time approaches due date, and more priority
will be given to one with longer processing time;
5. For a job, if the numerator of its CR is negative ( the job has been already later), it
is naturally scheduled next;
6. If more than one jobs are later, higher priority is given to one that has shorter
processing time (SPT).
5. Least work remaining (LWR)
It is an extension of SPT. It indicates that work be scheduled according
to the processing time remaining before the job is considered to be complete.
6. Fewest operations remaining (FOR)
It is another form of SPT. It sequences jobs based on the number of successive
operations remaining until the job is considered.
7. Slack time (ST)
Slack is determined by subtracting the sum of set-up and processing times from the
time remaining until the job due date. Jobs are processed in order of the smallest
amount of slack.
8. Slack time per operation (ST/O)
The slack time is divided by the number of operations remaining until the job is
complete with the smallest values being scheduled first.
9. Next queue (NQ)
It depends on the machine utilization. It considers queues at each of the succeeding
work centers at which the jobs will go.
10. Least set –up (LSU)
It maximizes utilization. Least set-up selects first the job minimizes changeover time
on given machine.
Functions of Schedules:
The following functions must be performed in scheduling and controlling a shop floor:
Allocating orders, equipment‘s, and personnel to work centers or other specified
location-Short term capacity planning;
Determining the sequence of orders (i. e. job priorities);
Initializing performance of the scheduled work, commonly termed the dispatching of
jobs;
Shop-floor control, involving
Reviewing the status and controlling the progress of orders as they are being
worked on;
Expediting the late and critical orders;
Revising the schedules in light of changes in order status.
Operations Controlling
Operational controlling is used to regulate the internal processes necessary to monitor and
direct of the company in the short term. It allows making decisions related to ongoing
business operations. The main tasks of operational controlling include:
Controlling of the results,
Liquidity planning,
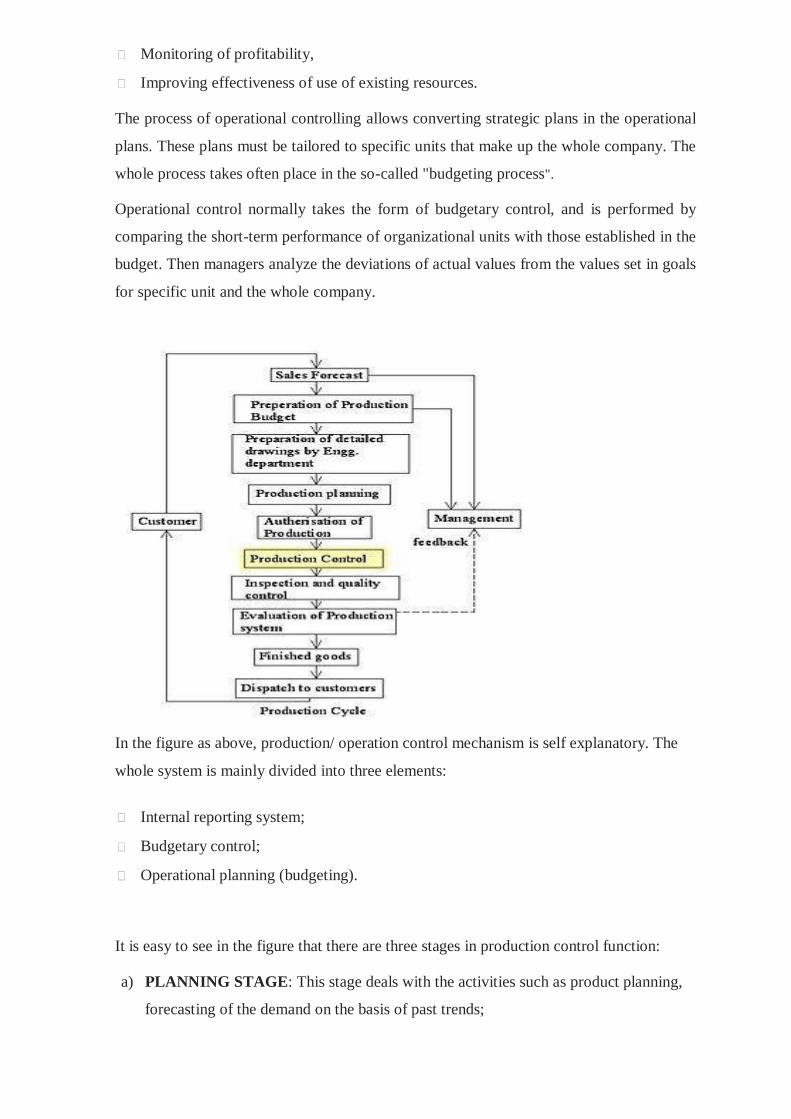
Monitoring of profitability,
Improving effectiveness of use of existing resources.
The process of operational controlling allows converting strategic plans in the operational
plans. These plans must be tailored to specific units that make up the whole company. The
whole process takes often place in the so-called "budgeting process".
Operational control normally takes the form of budgetary control, and is performed by
comparing the short-term performance of organizational units with those established in the
budget. Then managers analyze the deviations of actual values from the values set in goals
for specific unit and the whole company.
In the figure as above, production/ operation control mechanism is self explanatory. The
whole system is mainly divided into three elements:
Internal reporting system;
Budgetary control;
Operational planning (budgeting).
It is easy to see in the figure that there are three stages in production control function:
a) PLANNING STAGE: This stage deals with the activities such as product planning,
forecasting of the demand on the basis of past trends;
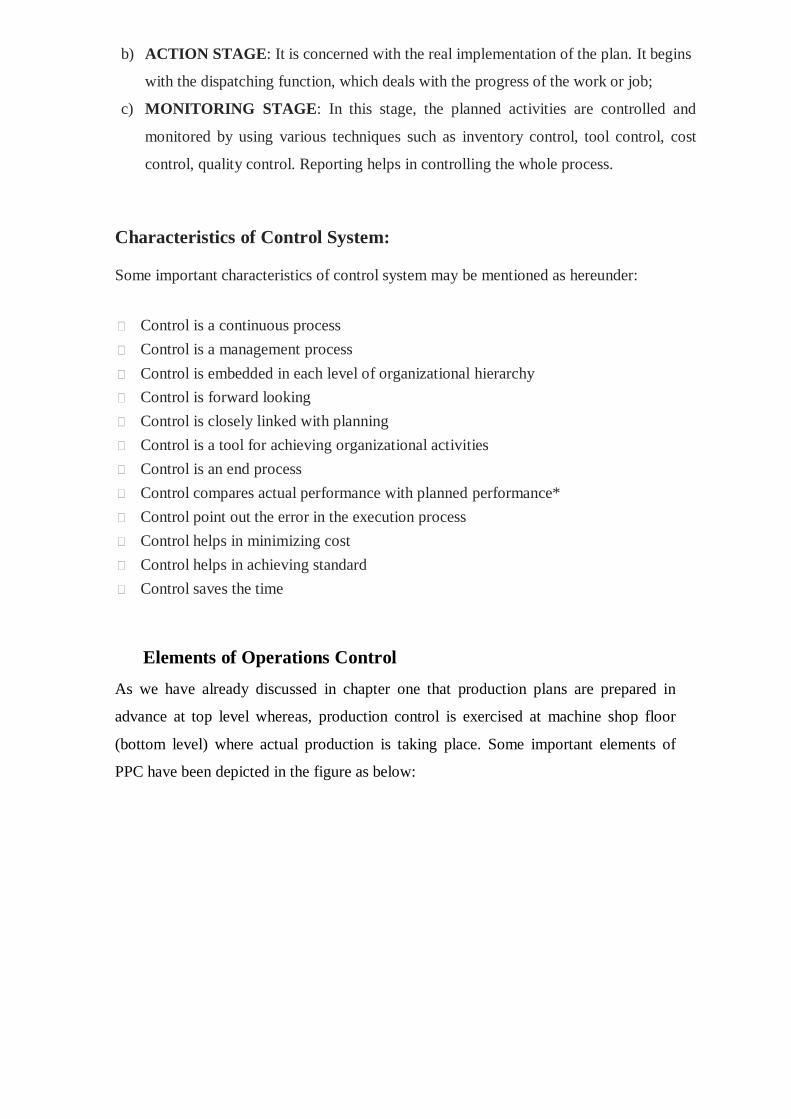
b) ACTION STAGE: It is concerned with the real implementation of the plan. It begins
with the dispatching function, which deals with the progress of the work or job;
c) MONITORING STAGE: In this stage, the planned activities are controlled and
monitored by using various techniques such as inventory control, tool control, cost
control, quality control. Reporting helps in controlling the whole process.
Characteristics of Control System:
Some important characteristics of control system may be mentioned as hereunder:
Control is a continuous process
Control is a management process
Control is embedded in each level of organizational hierarchy
Control is forward looking
Control is closely linked with planning
Control is a tool for achieving organizational activities
Control is an end process
Control compares actual performance with planned performance*
Control point out the error in the execution process
Control helps in minimizing cost
Control helps in achieving standard
Control saves the time
Elements of Operations Control
As we have already discussed in chapter one that production plans are prepared in
advance at top level whereas, production control is exercised at machine shop floor
(bottom level) where actual production is taking place. Some important elements of
PPC have been depicted in the figure as below:
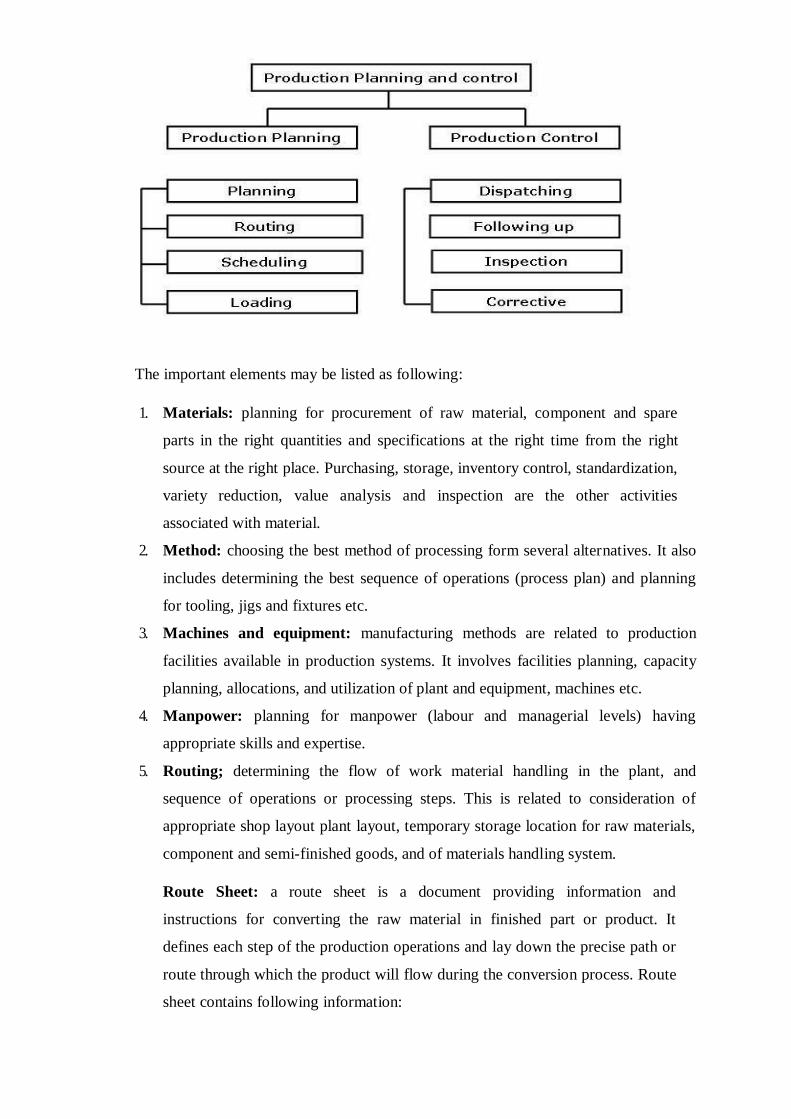
The important elements may be listed as following:
1. Materials: planning for procurement of raw material, component and spare
parts in the right quantities and specifications at the right time from the right
source at the right place. Purchasing, storage, inventory control, standardization,
variety reduction, value analysis and inspection are the other activities
associated with material.
2. Method: choosing the best method of processing form several alternatives. It also
includes determining the best sequence of operations (process plan) and planning
for tooling, jigs and fixtures etc.
3. Machines and equipment: manufacturing methods are related to production
facilities available in production systems. It involves facilities planning, capacity
planning, allocations, and utilization of plant and equipment, machines etc.
4. Manpower: planning for manpower (labour and managerial levels) having
appropriate skills and expertise.
5. Routing; determining the flow of work material handling in the plant, and
sequence of operations or processing steps. This is related to consideration of
appropriate shop layout plant layout, temporary storage location for raw materials,
component and semi-finished goods, and of materials handling system.
Route Sheet: a route sheet is a document providing information and
instructions for converting the raw material in finished part or product. It
defines each step of the production operations and lay down the precise path or
route through which the product will flow during the conversion process. Route
sheet contains following information:
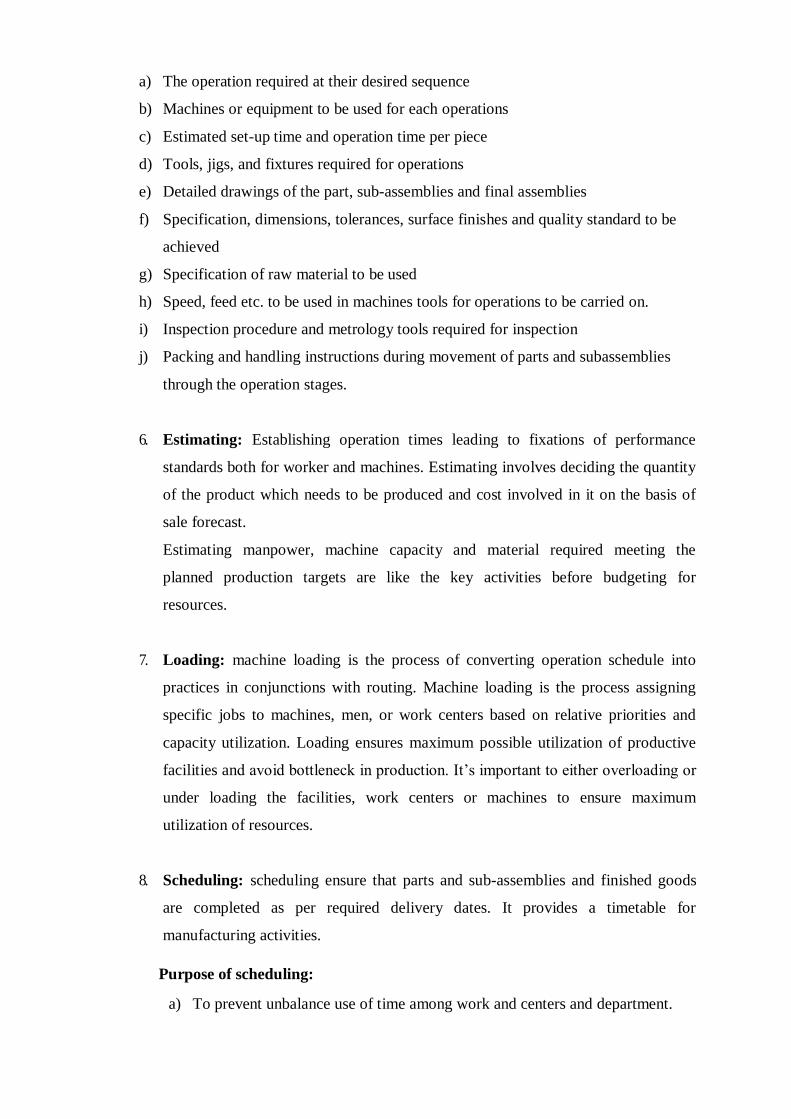
a) The operation required at their desired sequence
b) Machines or equipment to be used for each operations
c) Estimated set-up time and operation time per piece
d) Tools, jigs, and fixtures required for operations
e) Detailed drawings of the part, sub-assemblies and final assemblies
f) Specification, dimensions, tolerances, surface finishes and quality standard to be
achieved
g) Specification of raw material to be used
h) Speed, feed etc. to be used in machines tools for operations to be carried on.
i) Inspection procedure and metrology tools required for inspection
j) Packing and handling instructions during movement of parts and subassemblies
through the operation stages.
6. Estimating: Establishing operation times leading to fixations of performance
standards both for worker and machines. Estimating involves deciding the quantity
of the product which needs to be produced and cost involved in it on the basis of
sale forecast.
Estimating manpower, machine capacity and material required meeting the
planned production targets are like the key activities before budgeting for
resources.
7. Loading: machine loading is the process of converting operation schedule into
practices in conjunctions with routing. Machine loading is the process assigning
specific jobs to machines, men, or work centers based on relative priorities and
capacity utilization. Loading ensures maximum possible utilization of productive
facilities and avoid bottleneck in production. It‘s important to either overloading or
under loading the facilities, work centers or machines to ensure maximum
utilization of resources.
8. Scheduling: scheduling ensure that parts and sub-assemblies and finished goods
are completed as per required delivery dates. It provides a timetable for
manufacturing activities.
Purpose of scheduling:
a) To prevent unbalance use of time among work and centers and department.
b) To utilize labour such a way that output is produced within established lead
time or cycle time so as to deliver the products on time and complete
production in minimum total cost.
9. Dispatching: This is concerned with the execution of the planning functions. It
gives necessary authority to start a particular work which has already planned
under routing and scheduling functions. Dispatching is release of orders and
instructions for starting of production in accordance with routing sheet and
scheduling charts.
10. Inspection: This function is related to maintenance of quality in production and of
evaluating the efficiency of the processes, methods and labours so that
improvement can be made to achieve the quality standard set by product design.
11. Evaluating: The objective of evaluating is to improve performance. Performance
of machines, processes and labour is evaluated to improve the same.
12. Cost control: Manufacturing cost is controlled by wastage reduction, value
analysis, inventory control and efficient utilization of all resources.
Requirements for an effective Operations Control System:
In an organization, control based operations system can be effective only if the
following aspects are given due considerations before implementation:
a) Appropriate organization structure with sufficient delegation of authority and
responsibility at various levels of manpower.
b) Right person should be deputed at right place for right job.
c) Maximum level of standardization of inventory, tooling, manpower, job,
workmanship, equipment, etc.
d) Appropriate management decision for production schedule, materials controls,
inventory and manpower turnover and product mix.
e) Flexible production system to adjust any changes in demand, any problem in
production or availability of materials maintenance requirements, etc
f) Estimation of accurate leads times for both manufacturing and purchase.
g) Management information system should be reliable, efficient and supporting.
h) Capacity to produce should be sufficient to meet the demand.
i) The facility should be responsive enough to produce new products change of products
mix and be able to change the production rates.
The above elements are very important and necessary to make the production planning
system effective and efficient.
Utility of Operational Controlling System:
The implementation of control based operation system yields various advantages to any
organization for various functional activities, which include the following:
a) Last hour rush is avoided: Production is well planned and controlled as per the
given time schedules. Therefore, production control reduces the number of
emergency order and overtime works on plant and thus reduces the overheads.
b) Problems areas of bottleneck get reduced: The incomplete work or work-in-
transit does not get piled up because production control balances the line and flow
of work.
c) Cost reduction: An appropriate production control increases the men-machines
utilization, which maintains in process inventories at a satisfactory level, leads to a
better control on raw material inventories, reduces costs of storage and materials
handling, helps in maintaining quality and limits rejections and thus ultimately
reduces the unit cost of production.
d) Optimum utilization of resources: It reduces the time loss of the workers waiting
for materials and makes most effectives use of equipment.
e) Better coordination of plants activities: PPC coordinates the activities of the plant
that leads to control concerted effort by workforce.
f) Benefits to workers: PPC results into better efficiency and productivity, which
leads to adequate wages stable employment, job security, improved working
conditions increased job satisfaction and ultimately high morale.
g) Improved services to customers: PPC leads to better services to the customers as it
ensures production in accordance with the time schedules and therefore, deliveries
are made as per the committed schedules.
Scope of Operational Controlling System:
a) Nature of Inputs: To manufacture a product, different types of inputs are used. The
quality of the product depends upon the nature of the inputs are used. Hence the
planning is done to determine the nature of various types of inputs which is a
complicated process.
b) Quantity of Inputs: To achieve a level of production, determination of quantity of the
inputs and their composition is very important. A product can be prepared only when
there is an estimate of the required composition of inputs.
c) Proper Coordination: It ensures the proper coordination among the workforce,
machines and equipment. This leads to avoidance of wastages and smooth flow of
production.
d) Better Control: Production planning is the method of control. For a better control,
planning is a precondition. Only then, one can compare the performance and calculate
the deviations which lead control of the production.
e) Ensure Uninterrupted Production: The planning of materials ensures the regular
supply of raw materials and other components. The regular flow of materials and
supplies are helpful in the uninterrupted production.
f) Capacity Utilization: There is a need to use the available resources effectively. It is
helpful in bringing down various costs of production.
g) Timely Delivered: If there is good production planning and control, there will be
timely production and the finished product will be rushed to the market in time. This
also ensures the better relationship with the customers.
Design of Operational controlling system:
The complete design process has been explained in brief as follows:
Determination of the time, scope and field of controlling;
Preparation - setting goals and plans;
Selection of parameters, measures and indicators;
Providing proper information sources across organization;
Determining the procedure for monitoring deviations;
Establishing rules for decision-making process;
A decision on the implementation of the system;
Determination of the detailed time schedule and financial resources needed for
implementation;
Operational controlling provides broad source of the information necessary to control
main economic processes. This information pertains primarily of present business,
performance and resource utilization. Operational controlling is closely linked and
integrated with strategic controlling.
Summary
Operations function in a manufacturing or service organization is concerned with the
transformation of some inputs into some outputs that have some value for the end users. In
manufacturing organizations, there are many types of production systems namely mass,
process, batch and job production systems. The selection of system depends upon mainly
two things: i) nature of the product, ii) type of manufacturing process.
Scheduling is the final planning that occurs before the actual execution of the plan.
Production planners track the performance of operations in meeting the planned schedule.
This is critical because the master scheduler evaluates production planners on the level of
customer service achieved for their product responsibilities.
Schedules are essential to shop floor supervisors. The amount of time to complete a job is
often determined by a time standard. If the time standards are inaccurate (either too
stringent or too loose), the worker‘s morale may be affected.
Customers often need to know when the service will be provided (cable installers) so that
the customer is available. Customers often link quality of service with adherence to the
schedule (if the company delivers on time, everything is fine).
Scheduling executes a company‘s strategic business plan and affects functional areas
throughout the company
Accounting relies on schedule information and completion of customer orders to develop
revenue projections
Marketing uses schedule effectiveness measurement to determine whether the company is
using lead times for competitive advantage
Information systems maintains the scheduling database
Operations uses the schedule to maintain its priorities and to provide customer service by
finishing jobs on time
Different kinds of environments need different scheduling techniques. Scheduling in the
high-volume environment is typically done through line design and balancing. Scheduling
in a low-volume environment typically involves the use of priority rules.
Shop loading techniques included infinite or finite loading. Finite loading loads jobs
up to a predetermined capacity level. Loading can be done using forward or
backward scheduling
Priority rules are used to make scheduling decisions. SPT always minimizes mean
job flow times, mean job lateness, and average number of jobs in system. Rules
related to due dates tend to minimize the maximum tardiness of the jobs.
Operations control is a mechanism to monitor the execution of the plans. It has several
important functions:
a) Making sure that all activities are started at planned places and planned times.
b) Observing progress of the operations and recording it properly.
c) Analyzing the recorded data with the plans and measuring the deviations.
d) Taking immediate corrective actions to minimize the negative impact of deviations
from the plans.
e) Feeding back the recorded information to the planning section in order to improve
future plans.
Key Terms:
Scheduling: is the timetable for various activities;
Estimating: is a process of setting operation times after fixing standards both for
worker and machines;
Loading: is the process of converting operation schedule into practices;
Routing: is the process of determining the flow of work material handling in the
plant, and sequence of operations
Self-assessment Questions:
a) Define scheduling. Discuss the objectives and principles of scheduling.
b) Explain in detail the scheduling decisions.
c) Discuss the elements of shop floor scheduling.
d) Define operation control. Discuss the elements of operations control.
e) Explain in detail the characteristics of an operational control mechanism.
References:
a) Rama Murthy, P., Production and Operations Management, New Age International
Publishers, 2005
b) Chase, R.B., Aquilano, N.J., and Jacobs, F.R., Production and Operations
Management: Manufacturing and Services, Richard D. Irwin, Inc., 1998.
c) Narshimha, S.L., Production Planning and Inventory Control, PHI, 2002
d) Garg, A.K., Production and Operations Management, Mc GrawHill, 2012
e) Chary, S.N., Operations Management, TMH, 1996
f) Baffa and Sarin, R., Modern Production/ Operations Management, John wiley and
Sons, 2002
*****
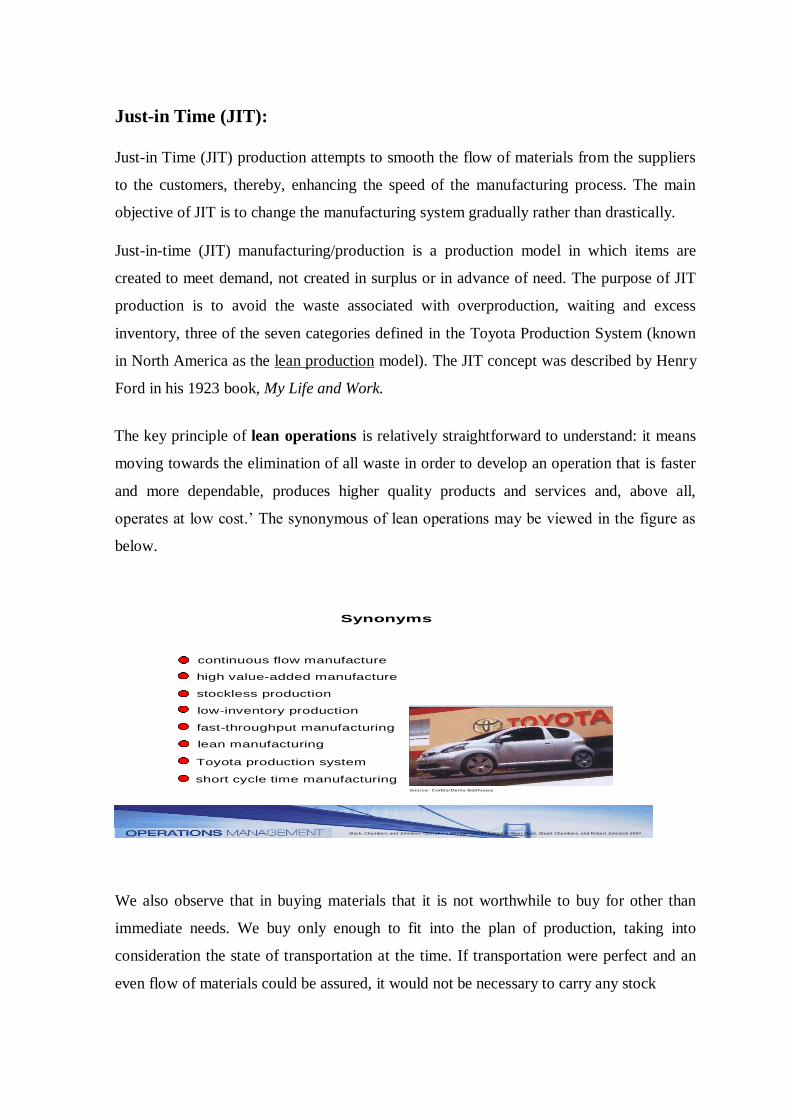
Just-in Time (JIT):
Just-in Time (JIT) production attempts to smooth the flow of materials from the suppliers
to the customers, thereby, enhancing the speed of the manufacturing process. The main
objective of JIT is to change the manufacturing system gradually rather than drastically.
Just-in-time (JIT) manufacturing/production is a production model in which items are
created to meet demand, not created in surplus or in advance of need. The purpose of JIT
production is to avoid the waste associated with overproduction, waiting and excess
inventory, three of the seven categories defined in the Toyota Production System (known
in North America as the lean production model). The JIT concept was described by Henry
Ford in his 1923 book, My Life and Work.
The key principle of lean operations is relatively straightforward to understand: it means
moving towards the elimination of all waste in order to develop an operation that is faster
and more dependable, produces higher quality products and services and, above all,
operates at low cost.‘ The synonymous of lean operations may be viewed in the figure as
below.
We also observe that in buying materials that it is not worthwhile to buy for other than
immediate needs. We buy only enough to fit into the plan of production, taking into
consideration the state of transportation at the time. If transportation were perfect and an
even flow of materials could be assured, it would not be necessary to carry any stock
Synonyms
continuous flow manufacture
high value-added manufacture
stockless production
low-inventory production
fast-throughput manufacturing
lean manufacturing
Toyota production system
short cycle time manufacturing Source: Corbis/Denis Balihouse
Slack, Chambers and Johnston, Operations Management 5th Edition © Nigel Slack, Stuart Chambers, and Robert Johnston 2007
whatsoever. The carloads of raw materials would arrive on schedule and in the planned
order and amounts, and go from the railway cars into production. That would save a great
deal of money, for it would give a very rapid turnover and thus decrease the amount of
money tied up in materials.
According to fuller, ―JIT is a disciplined approach to improving overall productivity and
eliminating waste. It provides for the cost –effective production and delivery of only the
necessary quantity of parts at the right quality, at the right time and place, while using a
minimum amount of facilities equipment, materials and human resources‖. JIT is
dependent on the balance between the supplier‘s flexibility and the user‘s flexibility. It is
accomplished through the application of elements which require total employees
involvement and teamwork. A key philosophy of JIT is simplification.
It is worthy to note here, that the first definition is a statement of aims. JIT will not
achieve these aims immediately. Rather, it describes a state that a JIT approach helps to
work towards. No definition of JIT fully conveys its full implications for operations
practice, however. This is why so many different phrases and terms exit to describe JIT-
type approaches? For example:
Lean operations.
Continuous flow manufacture.
High value-added manufacture.
Stock less production.
War on waste.
Fast- throughput manufacturing.
Short cycle time manufacturing.
In this chapter, we will try to examine JIT both as a philosophy and as method of
operations planning and control. This means that, for much of the chapter, we will take a
relatively focused view of JIT, concentrating on its planning and control aspects although
in practice it has much wider implications for improving operations performance. The JIT
principles, which were a radical departure from traditional operations practice, have now
they become the accepted wisdom in operations management. In effect, the chapter
addresses the question:
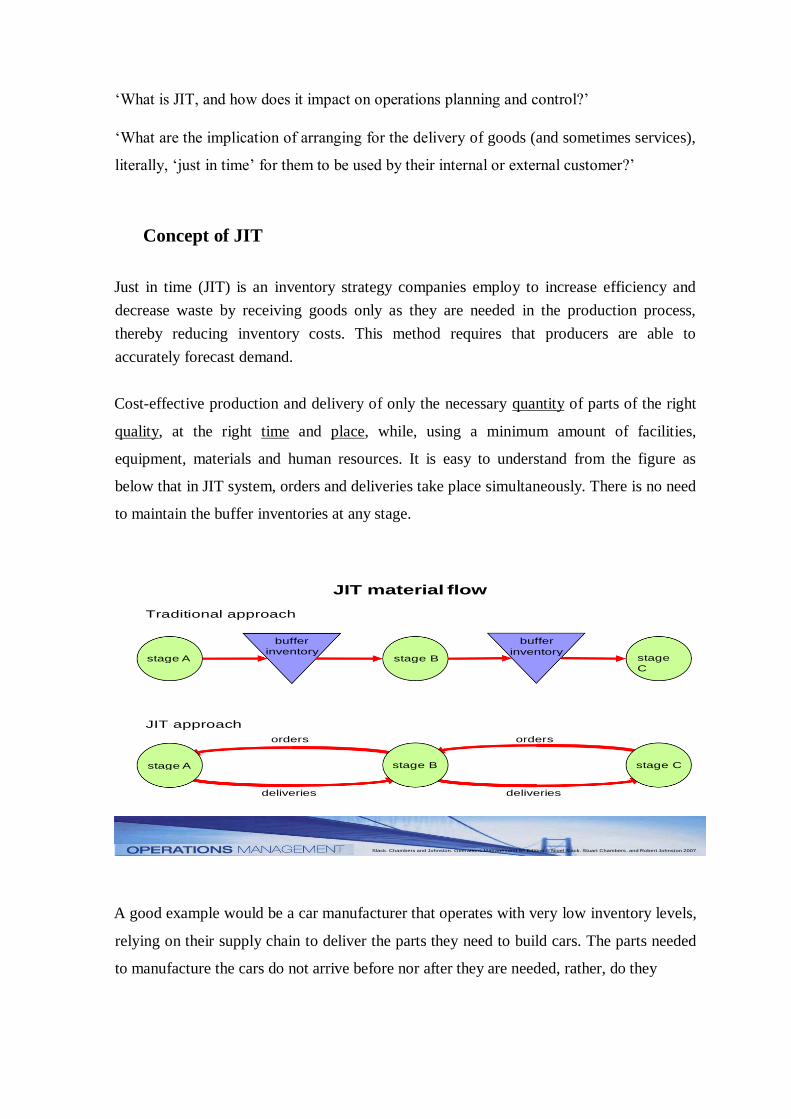
‗What is JIT, and how does it impact on operations planning and control?‘
‗What are the implication of arranging for the delivery of goods (and sometimes services),
literally, ‗just in time‘ for them to be used by their internal or external customer?‘
Concept of JIT
Just in time (JIT) is an inventory strategy companies employ to increase efficiency and
decrease waste by receiving goods only as they are needed in the production process,
thereby reducing inventory costs. This method requires that producers are able to
accurately forecast demand.
Cost-effective production and delivery of only the necessary quantity of parts of the right
quality, at the right time and place, while, using a minimum amount of facilities,
equipment, materials and human resources. It is easy to understand from the figure as
below that in JIT system, orders and deliveries take place simultaneously. There is no need
to maintain the buffer inventories at any stage.
A good example would be a car manufacturer that operates with very low inventory levels,
relying on their supply chain to deliver the parts they need to build cars. The parts needed
to manufacture the cars do not arrive before nor after they are needed, rather, do they
Slack, Chambers and Johnston, Operations Management 5 th Edition © Nigel Slack, Stuart Chambers, and Robert Johnston 2007
deliveries deliveries
stage C stage B stage A
orders orders
JIT approach
stage
C
buffer
inventory stage B
buffer
inventory stage A
Traditional approach
JIT material flow
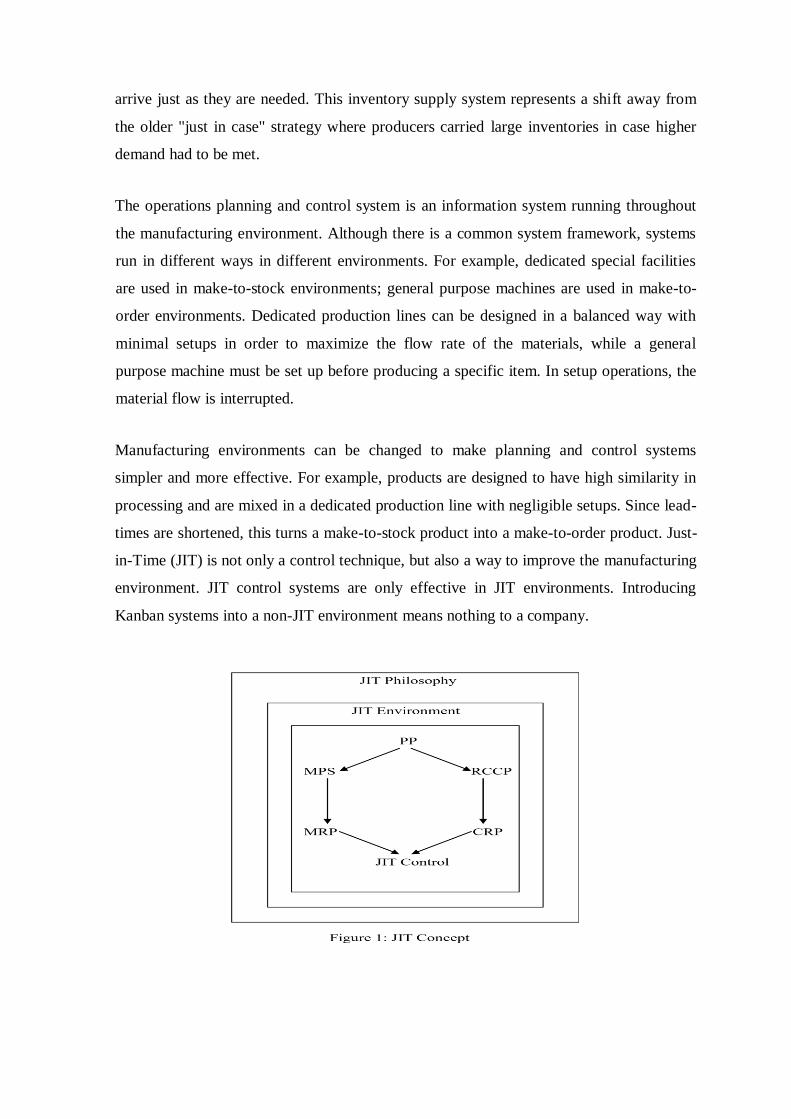
arrive just as they are needed. This inventory supply system represents a shift away from
the older "just in case" strategy where producers carried large inventories in case higher
demand had to be met.
The operations planning and control system is an information system running throughout
the manufacturing environment. Although there is a common system framework, systems
run in different ways in different environments. For example, dedicated special facilities
are used in make-to-stock environments; general purpose machines are used in make-to-
order environments. Dedicated production lines can be designed in a balanced way with
minimal setups in order to maximize the flow rate of the materials, while a general
purpose machine must be set up before producing a specific item. In setup operations, the
material flow is interrupted.
Manufacturing environments can be changed to make planning and control systems
simpler and more effective. For example, products are designed to have high similarity in
processing and are mixed in a dedicated production line with negligible setups. Since lead-
times are shortened, this turns a make-to-stock product into a make-to-order product. Just-
in-Time (JIT) is not only a control technique, but also a way to improve the manufacturing
environment. JIT control systems are only effective in JIT environments. Introducing
Kanban systems into a non-JIT environment means nothing to a company.
JIT Control can be incorporated into an ERP system as a control part with a condition that
the system has to be in a JIT environment. The JIT philosophy guides the development of
the JIT environment. The JIT environment provides the foundation for implementing the
JIT control techniques. The JIT philosophy, JIT environment, and the JIT technique can be
expressed in Figure 1 as above.
JIT as a Philosophy and Environment
JIT as a Philosophy
a) Elimination of waste: Any activity that does not add value to the product or service
in the eyes of the customer is a waste. Poor product design such as the inclusion of
fancy functions not required by the customer is a waste. A product design causing
difficulty in manufacturing is a waste. Standardization reduces the planning and
control efforts, the number of parts, and the inventory required. A poor product
design without enough standardization leads to waste. In addition to waste resulting
from poor design, Toyota identifies seven examples of waste resulting from poor
manufacturing methods.
b) Waste of overproduction: Overproduction is the production of goods more than
what are immediately needed. Overproduction causes extra material handling, quality
problems, and unnecessary inventories.
Consuming materials for unnecessary products may cause a shortage of material for
other products that are needed. Never overproduce products to keep men and
machines busy. If the required loading is less than the capacity, leave it alone. The
labor can be switched to other departments, cleaning or maintaining machines,
accepting training and education, etc.
c) Waste of waiting: A material waiting in queue is a waste. An operator waiting for
material or instruction and having no productive work to do is a waste.
d) Waste of movement: Poor plant layout results in materials having to be moved extra
distances and cause unnecessary material handling costs. Work centers should be
close to each other in order to reduce the move distance. Someone may say that close
work centers provide no room for WIP inventories. That is fine! No room for WIP
inventory forces the WIP to decrease.
e) Waste of inventories: Inventory causes costs of interest, space, record keeping, and
obsolescence. Moreover, inventory can mask problems which could cause more
inventory buildup. For example, WIP inventory between work centers can hide the
symptoms of an unbalanced production rate. Finished goods inventory can mask poor
forecasting, poor quality, and poor production control. Inventory is not an asset; it is a
waste!
f) Waste of motion: Improper methods of performing tasks by the operators cause
wasted motions. Reaching far for materials or machine buttons is a waste of motion.
Searching for tools is a waste of motion. Any activity that does not add value to the
products should be eliminated. Bad layout or training causes waste of motion.
g) Waste of making defects: The cost of scraps is a waste. But it is the least important
compared with other wastes caused by making defects. Defects interrupt the smooth
flow of materials in the production line. If the scrap is not identified, next workstation
will try using it to produce more wastes, or waste time waiting for good materials.
h) Waste of process itself: Bad process design is a waste. For example, wrong type or
size of machines, wrong tools, and wrong fixtures are wastes.
The principle of eliminating the wastes includes:
a. All waste should be eliminated.
b. Waste can gradually be eliminated by removing small amounts of inventory from the
system, correcting the problems that ensue, and then, removing more inventory.
c. The customers' definitions of quality should drive product design and manufacturing
system.
d. Manufacturing flexibility is essential to maintain high quality and low cost with an
increasingly differentiated product line.
e. Mutual respect and support should exist among an organization, its employees, its
suppliers, and its customers.
f. A team effort is required to achieve world class manufacturing capability.
g. The employee who performs a task is the best source of suggested improvements.
Continuous improvement/One Less at a Time
As it has been mentioned earlier, JIT improves the manufacturing system gradually rather
than drastically, as in business process re-engineering (BPR). This gradual continuous
improvement is defined by APICS Dictionary as ―one less at a time‖: a process of
gradually reducing the lot size of the number of items in the manufacturing pipeline to
expose, prioritize, and eliminate waste. ―One less at a time‖ is a constant, step-by-step
methodology for making JIT work in any manufacturing environment. JIT is a never-
ending series of small, controlled steps, not one great leap forward. In the JIT philosophy,
not the same product is produced over and over again; instead, the same process is used
repeatedly to produce different products.
The procedure of ―one less at a time‖ is as follows:
a) If the inventory is equal to zero then stop, else
b) Select the most prioritized process to be improved.
c) Improve the process
d) Is the process economical? If no, go to step 3
e) Reduce the inventory by a small amount
f) Go to step 1.
The third step ―Improve the process‖ in the above procedure can be broken down into
following steps:
Observe the existing method and collect related data on the selected process.
Investigate and analyze the data to generate alternatives to improve the process.
Evaluate the alternatives to determine the new method for the process.
Install the new method and educate the operator.
Maintain the new method.
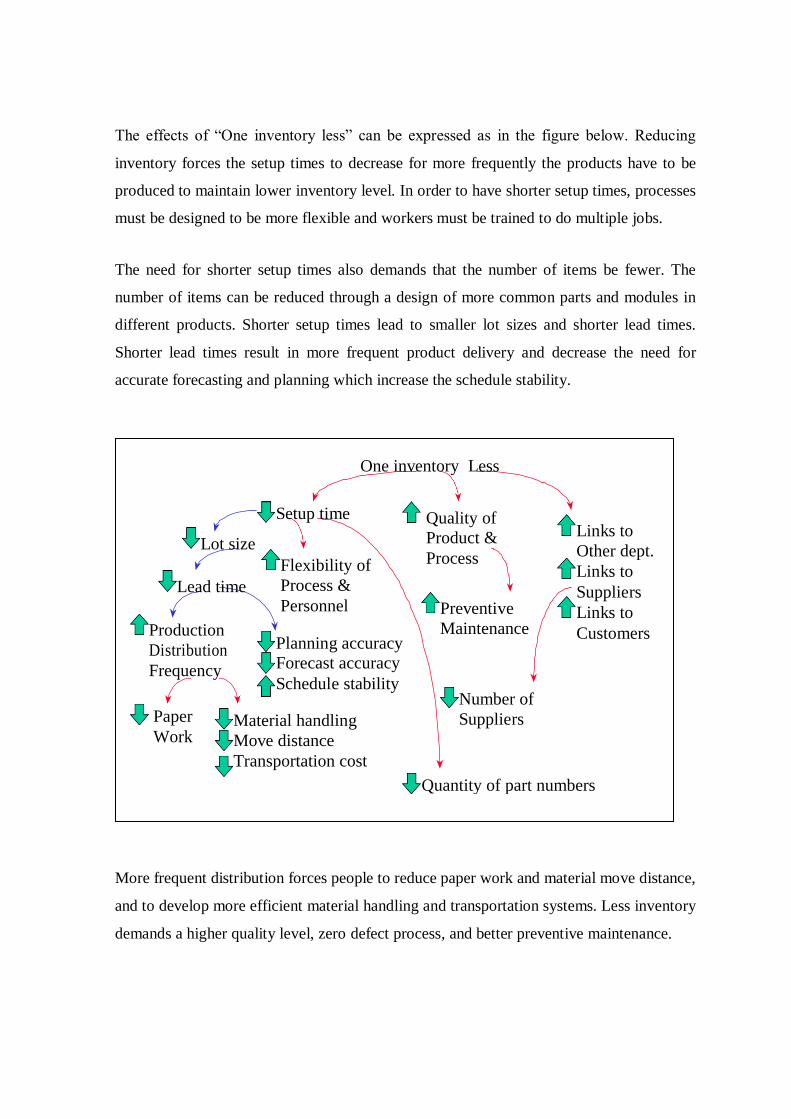
The effects of ―One inventory less‖ can be expressed as in the figure below. Reducing
inventory forces the setup times to decrease for more frequently the products have to be
produced to maintain lower inventory level. In order to have shorter setup times, processes
must be designed to be more flexible and workers must be trained to do multiple jobs.
The need for shorter setup times also demands that the number of items be fewer. The
number of items can be reduced through a design of more common parts and modules in
different products. Shorter setup times lead to smaller lot sizes and shorter lead times.
Shorter lead times result in more frequent product delivery and decrease the need for
accurate forecasting and planning which increase the schedule stability.
More frequent distribution forces people to reduce paper work and material move distance,
and to develop more efficient material handling and transportation systems. Less inventory
demands a higher quality level, zero defect process, and better preventive maintenance.
Quantity of part numbers
Number of
Suppliers Material handling
Move distance
Transportation cost
Paper
Work
Links to
Other dept.
Links to
Suppliers
Links to
Customers
Preventive
Maintenance Planning accuracy
Forecast accuracy
Schedule stability
Production
Distribution
Frequency
Flexibility of
Process &
Personnel Lead time
Quality of
Product &
Process Lot size
Setup time
One inventory Less
Fewer inventories also require better communication between departments, customers, and
suppliers, and hence require a smaller number of suppliers.
(1) Problem as an opportunity:
JIT philosophy sees the problems as the opportunities. A problem is an opportunity to
improve. JIT exposes problems rather than covering them.
(2) Quality at the source:
Defects may occur at the design stage, any workstation in the production line, or the
suppliers‘ plants. Quality does not come from inspection. It does not come from
manufacturing either. Quality comes from good design. The quality of a product is
determined at the design stage, including product design and process design. A poor
design will never result in good quality. In a production line, it is not adequate to
inspect the products at the end the line. Inspections should be executed by the
operators themselves at each step of the line before the parts are passed on to the
following process. The operator in the next workstation has no obligation to inspect an
incoming part. A defect must be screened out immediately after it occurs. For
purchased parts, the inspection should be completed before delivery. Incoming
inspection is not required.
(3) Simplification:
Simplicity is a key to successful manufacturing. Products should be designed to be
easy to manufacture, install, and repair. Only 2 or 3 levels should exist in the bill of
material. Suppliers deliver the materials regularly and purchase orders are not
required. Materials are stored at the point of use (POU), and picking orders are not
required. Work centers produce the items when they are consumed and shop orders
are not required. Material inventory records are not updated until the finished goods
are reported complete. Simplifying the system is central to the philosophy of JIT.
(4) Visual Control:
Visible control tools are used wherever possible. Cards attached to the materials,
containers at sight, tags in stock indicating order points, etc. are examples of visual
control tools. These signals are processed by human intelligence at the speed of light,
and are superior to any computer in the world. JIT philosophy reminds us that natural
human senses are effective tools but are frequently ignored.
(5) Focus on customer needs:
In JIT philosophy, only values in customers‘ eyes are real values. Values perceived
by engineers but not accepted by customers are wastes. All activities from production
design, material procurement, fabrication, assembly, distribution to after sale service;
focus on customer needs. Any motion of the operator on the shop floor not adding
value to customer needs is a waste.
(6) Production to customer demand:
In JIT philosophy, only immediate customer demands are produced. Extra items not
required immediately by the customers are not put into production. Without customer
demand, there should be no production.
(7) Respect for individuals:
Each individual in a company is an important asset. Education and training are
frequently conducted to enhance the capability of the employees. Employee
involvement and empowerment are part of JIT philosophies. Employee involvement is
the concept of using the experience, creativity, and intelligence of all employees by
treating them with respect, keeping them informed, and including them and their ideas
in decision making processes (Apices, 1995). Employee empowerment is the practice
of giving non-managerial employees the responsibility and power to make decisions
that can affect their jobs or tasks. It allows employee to take responsibility for tasks
normally associated with staff specialists, such as scheduling, inspection, etc. (Apices,
1995).
JIT as an Environment
In addition to philosophical concepts, JIT also provides an environment in which products
are manufactured in a simpler way.
Repetitive manufacturing:
Repetitive manufacturing is the production of discrete items in a production line with
fixed routing. The items can be a product or a family of products. The product is
standard or made from standard modules. The manufacturing environment is make-to-
order (MTO) or assemble-to-order (ATO). The production line consists of
workstations located close together and in sequence. Materials flow from a
workstation to the next at a relatively constant rate. Material handling systems are
normally used to move the materials from process to process in the production line.
Normally, the capacity of the production line is kept sufficient. The repetitive
manufacturing is based on an uninterrupted flow of materials.
Total Quality Management:
Total quality management is a management approach used to achieve quality
improvement and long-term success through customer satisfaction. TQM involves all
members of the organization, and is meant to improve the quality of all processes,
products, services, operations, and corporate culture.
TQM activities follow a plan-do-check-action (PDCA) cycle to improve the quality.
In the ―plan‖ step, the problem is defined, the symptoms are explained, and the key
performance measures are determined. In the ―do‖ step, the cause of the symptoms is
identified. The causes of the causes are also investigated until the root cause is
uncovered. Then, an approach to solve the problem is developed and implemented.
The performance measures can be changed in this step. In the ―check‖ step, the
effectiveness of the proposed approach is observed by using the performance
measures. In the ―action‖ step, the results are studied to determine what was learned
and what can be predicted. The improvement process is standardized to apply to
similar problems. In the PDCA cycle, the steps are not necessarily followed strictly
sequentially. For example, if we find a proposed approach is not affirmative in
―check‖ step, we may jump to the ―do‖ stage to revise the approach.
Total Productive Maintenance (TPM):
―Preventive maintenance‖ is a restrictive term which mentally prohibits us from
thinking more broadly. TPM means preventive maintenance and continuing efforts to
adapt, modify, and refine equipment in order to increase flexibility, reduce material
handling, and promote continuous flows. It is operator-oriented maintenance involving
all qualified employees in all maintenance activities. (Apices, 1995)
Total employee Involvement (TEI):
Elimination of waste and continuous improvement are the central ideas of the JIT
philosophy. They can be accomplished only when employees are cooperative. A
successful JIT environment should have the cooperation and involvement of everyone
in the organization. Traditionally, operators take orders from management and do what
they are asked to do, while management is in charge of planning, supervising,
inspecting, etc. In a JIT environment, operators take responsibility for controlling the
equipment, inspecting for quality, correcting the deviations, maintaining the machines,
and improving the processes. Many of the tasks traditionally done by the management
become the duties of the line workers under JIT. Managers are not playing the game;
they are coaches and the line workers are the players. The mission of a coach is to train
the players.
Supplier Partnership:
In order to establish a smooth flow of materials into the factory, a close and reliable
relationship with the suppliers is very important. Supplier partnership is the
establishment of a working relationship with a supplier whereby the two organizations
act as one. Relationships with the suppliers should be based on mutual trust,
cooperation, and long-term commitment.
JIT as a Control Technique:
After taking JIT as a philosophy and environment, now we will try to understand JIT as a
control measure. In daily operations, JIT provides useful control methods. The
characteristics of a JIT control technique include uniform loading, repetitive processes,
pull system, using production cards, and synchronized production.
Pull System:
JIT control pulls materials from the previous workstation. The workstation replenishes
any materials consumed by its following workstation. Since only the consumed
materials are produced, the inventories between workstations never accumulate. For
the first workstation of the factory, the supplier is its preceding workstation. For the
last workstation in a factory, the customer is its following workstation. Customers pull
the products from the factory, and factory pulls the materials from the suppliers.
Uniform Loading:
The loads for jobs in every workstation are equal. This makes the pull system possible.
If uneven loading exists, the following workstation may have to wait for the materials
from the preceding workstation. Uniform loading allows the materials to flow through
the production line smoothly. Every workstation runs at a constant rate. If the demand
increases, the production rates in all workstation increase together. If the demand
drops, all workstations may have the same level of idleness.
Production Card:
JIT control uses various cards to transmit production signals. During the production,
these cards are attached to and detached from the materials. Production signals are
transmitted from the following workstation back to the preceding workstation. The
cards have various shapes and colors to indicate different purposes. Sometimes
material containers or the material itself are themselves the signals.
Synchronized Production:
Synchronized production is a manufacturing practice in which production activities in
each workstation are synchronized with certain control signals. The production rates of
workstations are related to each other, and the work-in-process inventories are limited
to a predetermined level. Synchronized production can be seen in JIT environments or
theory-of-constraints (TOC) environments. The control signals are carried by
Kanban‘s in a JIT environment. In the TOC environment, drum-buffer-(DBR) is used
to synchronize the workstations.
Characteristics of JIT:
Some important characteristics of JIT have been summarized as follows:
product or product type. Each worker in each cell knows how to operate all the
the downtime resulting from breakdowns employee absences.
variety of operations and tasks on an as-needed basis to maintain smooth production
flow.
materials ready for a production run.
initiated to when a finished good is produced.
high-quality goods for just-in-time use possibly within a day or less. Supplier‘s
dependability is crucial in JIT system because inventory levels are kept low in a JIT
system, the company must have a very close relationship with its suppliers to make
certain that the supplier makes frequent deliveries of smaller amounts of Inventory,
thus long-term contracts are typically negotiated to reduce order costs.
Buyer-supplier relationships are further facilitated by electronic data interchange
(EDI), a technology that allows the supplier access to the buyer's online inventory
management system. Thus, electronic messages replace paper documents (purchase
orders and sales invoices), and the production schedules and deliveries of the parties
can be more readily coordinated.
Reliable suppliers: Careful screening of suppliers to ensure on-time deliveries of
Reduced setup times: Reduction of the time required to get tools, equipment, and
Multi skilled workers: Cross-functional training of workers so they can perform a
Production organized into manufacturing work cells: Each work cell produces a
machines in that cell and can perform supporting tasks within that cell. This reduces
Reduced manufacturing lead times: Reduction of the time from when an order is
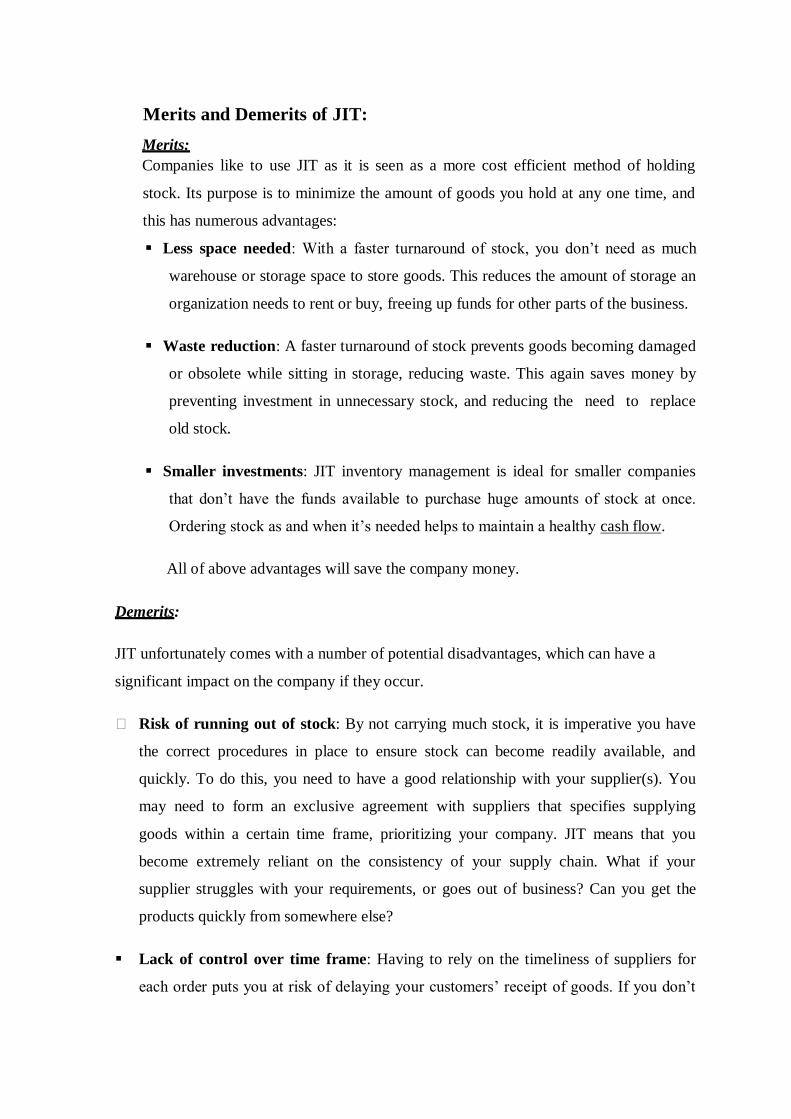
Merits and Demerits of JIT:
Merits:
Companies like to use JIT as it is seen as a more cost efficient method of holding
stock. Its purpose is to minimize the amount of goods you hold at any one time, and
this has numerous advantages:
Less space needed: With a faster turnaround of stock, you don‘t need as much
warehouse or storage space to store goods. This reduces the amount of storage an
organization needs to rent or buy, freeing up funds for other parts of the business.
Waste reduction: A faster turnaround of stock prevents goods becoming damaged
or obsolete while sitting in storage, reducing waste. This again saves money by
preventing investment in unnecessary stock, and reducing the need to replace
old stock.
Smaller investments: JIT inventory management is ideal for smaller companies
that don‘t have the funds available to purchase huge amounts of stock at once.
Ordering stock as and when it‘s needed helps to maintain a healthy cash flow.
All of above advantages will save the company money.
Demerits:
JIT unfortunately comes with a number of potential disadvantages, which can have a
significant impact on the company if they occur.
Risk of running out of stock: By not carrying much stock, it is imperative you have
the correct procedures in place to ensure stock can become readily available, and
quickly. To do this, you need to have a good relationship with your supplier(s). You
may need to form an exclusive agreement with suppliers that specifies supplying
goods within a certain time frame, prioritizing your company. JIT means that you
become extremely reliant on the consistency of your supply chain. What if your
supplier struggles with your requirements, or goes out of business? Can you get the
products quickly from somewhere else?
Lack of control over time frame: Having to rely on the timeliness of suppliers for
each order puts you at risk of delaying your customers‘ receipt of goods. If you don‘t
meet your customers‘ expectations, they could take their business elsewhere, which
would have a huge impact on your business if this occurs often.
More planning required: With JIT inventory management, it‘s imperative that
companies understand their sales trends and variances in close detail. Most companies
have seasonal sales periods, meaning a number of products will need a higher stock
level at certain times of the year due to higher demand. Therefore, you need to factor
that into planning for inventory levels, ensuring suppliers are able to meet different
volume requirements at different times.
If run properly, JIT inventory management is seen as one of (if not the) best ways of
managing inventory. While it is not without risks, it has significant rewards, and is ideal
for those who are able to plan carefully in advance, and build strong relationships with
suppliers.
The advantages and disadvantages are also shown in the table as below:
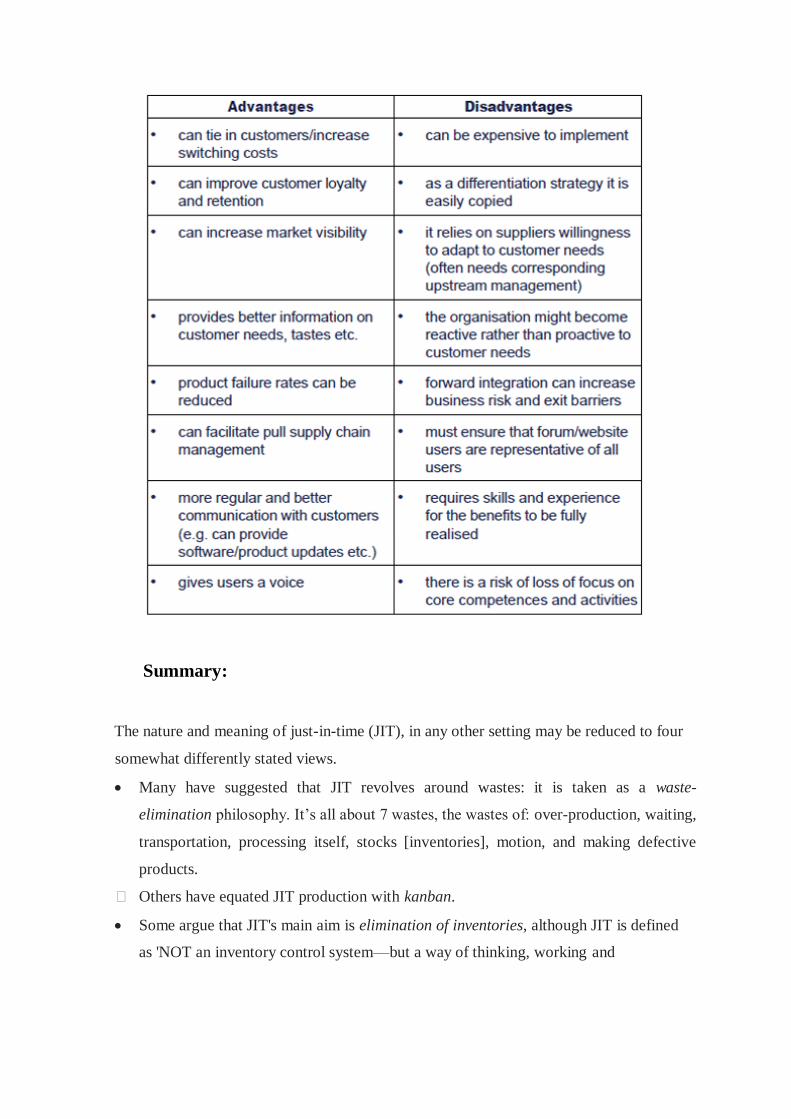
Summary:
The nature and meaning of just-in-time (JIT), in any other setting may be reduced to four
somewhat differently stated views.
Many have suggested that JIT revolves around wastes: it is taken as a waste-
elimination philosophy. It‘s all about 7 wastes, the wastes of: over-production, waiting,
transportation, processing itself, stocks [inventories], motion, and making defective
products.
Others have equated JIT production with kanban.
Some argue that JIT's main aim is elimination of inventories, although JIT is defined
as 'NOT an inventory control system—but a way of thinking, working and
such inventory buffers by continually attacking causes of disruptions. Zero inventories
are posed only as an unattainable ideal, one that is easy to see and count.
The last view is that JIT is mainly about quick response, According to Blackburn,
Quick response is one of the major benefits of JIT. Time or speed is the key of this
manufacturing philosophy. Inventory, on the other hand, is an ancillary benefit. Quick
response refers alternatively to reduction of cycle times; flow times, throughput times,
and, all the way to the customer lead times. JIT has the provocative goal of producing
instantaneously, with perfect quality and minimum waste. The ideal way to produce
the end product is literally just in time to meet the market demand for it. Thus, JIT is
primarily a lead-time reduction programme.
The four JIT views—referring to wastes, kanban, inventory, and quick response/lead-time
reduction—do not suggest opposing views, but rather appear to be complementary points
of emphasis, collectively serving to describe the essence of JIT.
Aside from the four viewpoints, Just in time has often been paired with total quality
control, forming the acronym, JIT/TQC. The rationale is that TQC avoids stoppages and
slowdowns disruptive to the quick-flow aims of JIT; and JIT exposes quality issues and
their causes soon after they occur, thus facilitating their elimination.
Review Questions:
Define the "Just-In-Time" concept.
Is "Just-In-Time" a philosophy or just a collection of techniques? Explain your
answer.
Discuss the advantages and disadvantages of JIT approach.
List and discuss some of the characteristics of JIT approach.
What is JIT? How does it impact on operations planning and control?
Keywords
Just-in-Time (JIT): denoting a manufacturing system in which materials or
components are delivered immediately before they are required in order to minimize
storage costs.
Material Requirements Planning (MRP): is a computer-based
production planning and inventory control system. MRP is concerned with both
production scheduling and inventory control. It is a material control system that
attempts to keep adequate inventory levels to assure that required materials are
available when needed
Manufacturing resource planning (MRP II): Manufacturing resource
planning (MRP II) is defined as a method for the effective planning of all resources of
a manufacturing company. Ideally, it addresses operational planning in units,
financial planning, and has a simulation capability to answer "what-if" questions and
extension of closed-loop MRP
Lean production: Lean production is an assembly-line methodology developed
originally for Toyota and the manufacturing of automobiles. It is also known as the
Toyota Production System or just-in-time production.
References
Ansari, A. and B. Modarress. 1990. Just in Time Purchasing. New York: Free Press.
Ashburn, A., 1977. Toyota's "famous Ohno system." American Machinist, July, 120–123.
Galsworth, G. 2005. Visual Workplace: Visual Thinking. Portland, Ore.: Visual-Lean
Enterprise Press.
Hirano, H. 1994. Five Pillars of the Visual Workplace. Cambridge, Mass.: Productivity
Inc.
Jordon, S., ―Analysis and approximation of a JIT production line‖, Decision and
science, Summer 1988.
Karatsu, H., TQC Wisdom of Japan, Productivity Press, Cambridge, MA, 1988.
Lu, D. J., Kanban Just In Time at Toyota, Productivity Press, Cambridge, MA, 1988.
Miltenburg, J., ―Level schedules for mixed-model assembly lines in Just-In-Time
production systems‖, Management Science, February 1989
Plenert, G. 2007.Reinventing Lean: Introducing Lean Management into the Supply Chain.
Oxford, U.K.: Butterworth-Heinemann. pp 41–42.
Plenert, G. J., ―Three different concepts of JIT‖, Production and Inventory Management,
31(2), 1990
*********
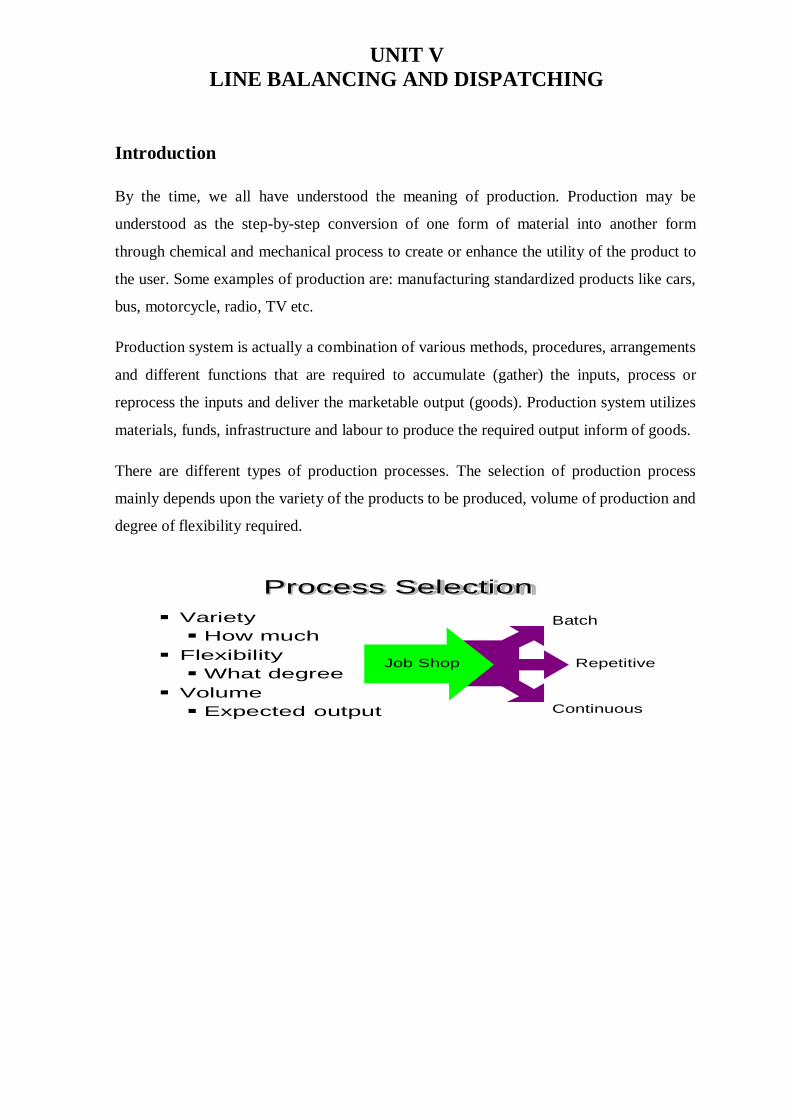
UNIT V
LINE BALANCING AND DISPATCHING
Introduction
By the time, we all have understood the meaning of production. Production may be
understood as the step-by-step conversion of one form of material into another form
through chemical and mechanical process to create or enhance the utility of the product to
the user. Some examples of production are: manufacturing standardized products like cars,
bus, motorcycle, radio, TV etc.
Production system is actually a combination of various methods, procedures, arrangements
and different functions that are required to accumulate (gather) the inputs, process or
reprocess the inputs and deliver the marketable output (goods). Production system utilizes
materials, funds, infrastructure and labour to produce the required output inform of goods.
There are different types of production processes. The selection of production process
mainly depends upon the variety of the products to be produced, volume of production and
degree of flexibility required.
Variety
How much
Flexibility
What degree
Volume
Expected output
Batch
Repetitive
Continuous
Process Selection
Job Shop
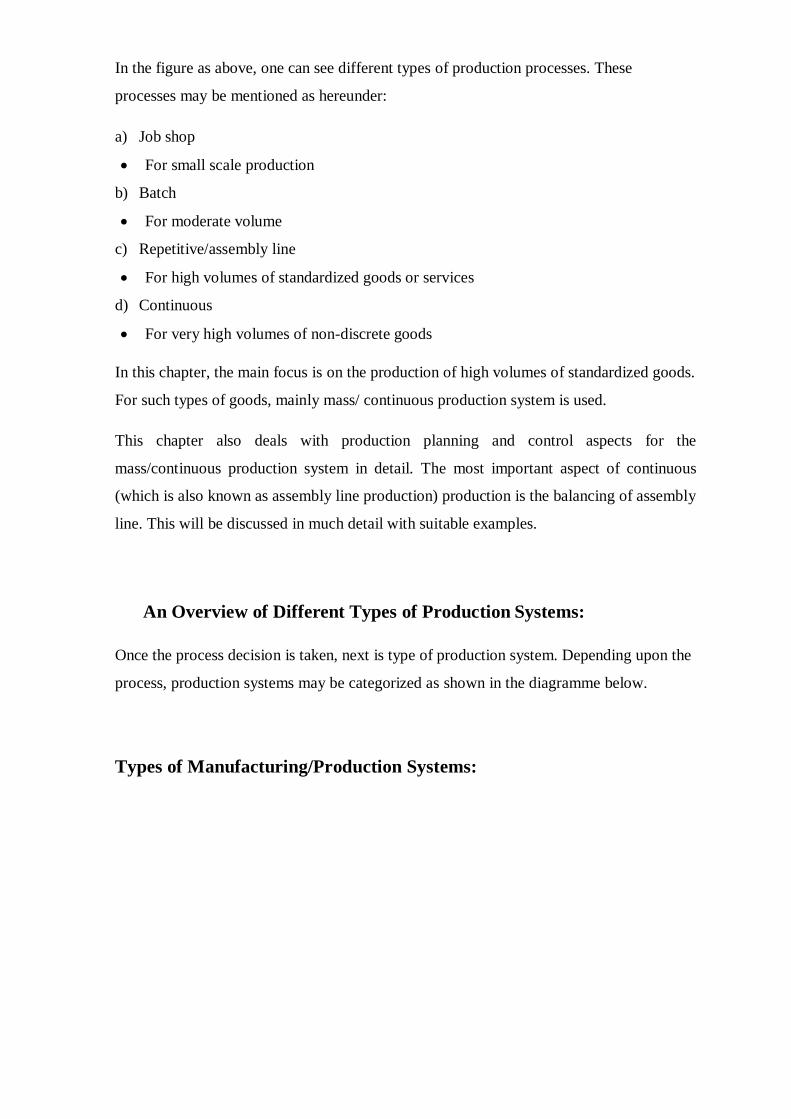
In the figure as above, one can see different types of production processes. These
processes may be mentioned as hereunder:
a) Job shop
For small scale production
b) Batch
For moderate volume
c) Repetitive/assembly line
For high volumes of standardized goods or services
d) Continuous
For very high volumes of non-discrete goods
In this chapter, the main focus is on the production of high volumes of standardized goods.
For such types of goods, mainly mass/ continuous production system is used.
This chapter also deals with production planning and control aspects for the
mass/continuous production system in detail. The most important aspect of continuous
(which is also known as assembly line production) production is the balancing of assembly
line. This will be discussed in much detail with suitable examples.
An Overview of Different Types of Production Systems:
Once the process decision is taken, next is type of production system. Depending upon the
process, production systems may be categorized as shown in the diagramme below.
Types of Manufacturing/Production Systems:
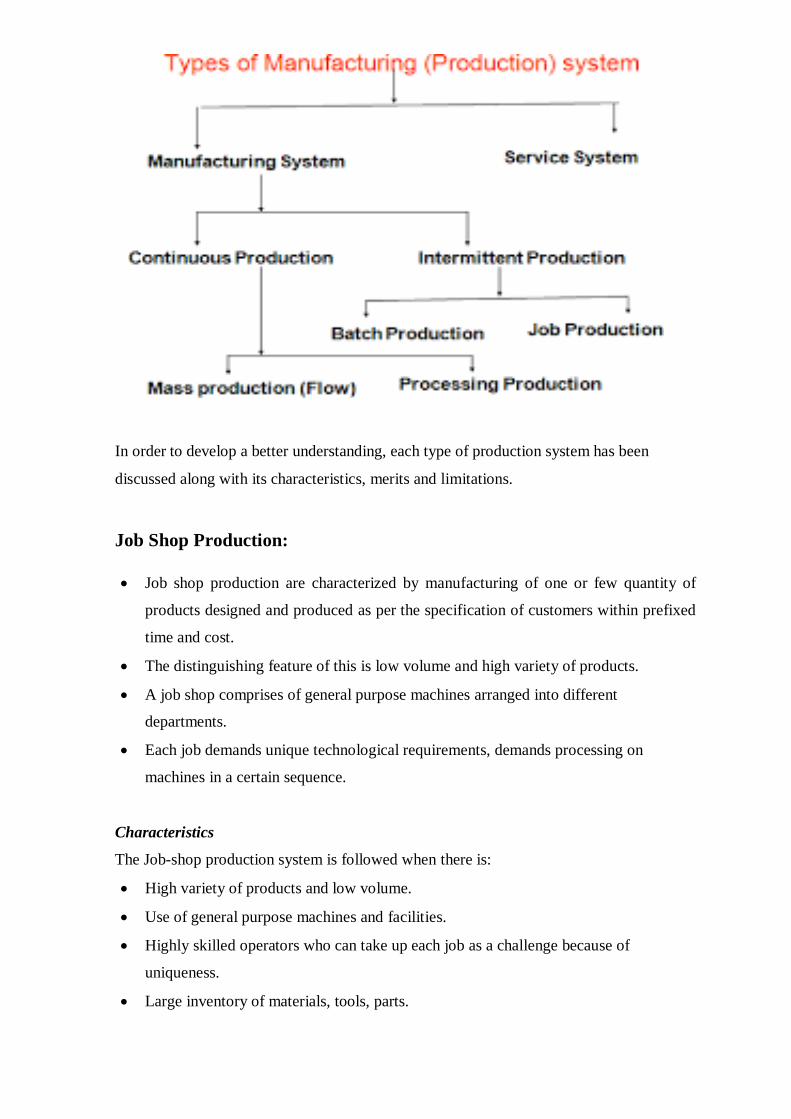
In order to develop a better understanding, each type of production system has been
discussed along with its characteristics, merits and limitations.
Job Shop Production:
Job shop production are characterized by manufacturing of one or few quantity of
products designed and produced as per the specification of customers within prefixed
time and cost.
The distinguishing feature of this is low volume and high variety of products.
A job shop comprises of general purpose machines arranged into different
departments.
Each job demands unique technological requirements, demands processing on
machines in a certain sequence.
Characteristics
The Job-shop production system is followed when there is:
High variety of products and low volume.
Use of general purpose machines and facilities.
Highly skilled operators who can take up each job as a challenge because of
uniqueness.
Large inventory of materials, tools, parts.
Detailed planning is essential for sequencing the requirements of each product,
capacities for each work centre and order priorities.
Advantages
Following are the advantages of job shop production:
Because of general purpose machines and facilities variety of products can be
produced.
Operators will become more skilled and competent, as each job gives them learning
opportunities.
Full potential of operators can be utilised.
Opportunity exists for creative methods and innovative ideas.
Limitations
Following are the limitations of job shop production:
Higher cost due to frequent set up changes.
Higher level of inventory at all levels and hence higher inventory cost.
Production planning is complicated.
Larger space requirements.
Batch Production:
Batch production is defined by American Production and Inventory Control Society
(APICS) “as a form of manufacturing in which the job passes through the functional
departments in lots or batches and each lot may have a different routing.” It is
characterized by the manufacture of limited number of products produced at regular
intervals and stocked awaiting sales.
Characteristics
Batch production system is used under the following circumstances:
When there is shorter production runs.
When plant and machinery are flexible.
When plant and machinery set up is used for the production of item in a batch and
change of set up is required for processing the next batch.
When manufacturing lead time and cost are lower as compared to job order
production.
Advantages
Following are the advantages of batch production:
Better utilization of plant and machinery.
Promotes functional specialization.
Cost per unit is lower as compared to job order production.
Lower investment in plant and machinery.
Flexibility to accommodate and process number of products.
Job satisfaction exists for operators.
Limitations
Following are the limitations of batch production:
Material handling is complex because of irregular and longer flows.
Production planning and control is complex.
Work in process inventory is higher compared to continuous production.
Higher set up costs due to frequent changes in set up.
Continuous Production:
Production facilities are arranged as per the sequence of production operations from the
first operations to the finished product. The items are made to flow through the sequence
of operations through material handling devices such as conveyors, transfer devices, etc.
Characteristics
Continuous production is used under the following circumstances:
Dedicated plant and equipment with zero flexibility.
Material handling is fully automated.
Process follows a predetermined sequence of operations.
Component materials cannot be readily identified with final product.
Planning and scheduling is a routine action.
Advantages
Following are the advantages of continuous production:
Standardization of product and process sequence.
Higher rate of production with reduced cycle time.
Higher capacity utilization due to line balancing.
Manpower is not required for material handling as it is completely automatic.
Person with limited skills can be used on the production line.
Unit cost is lower due to high volume of production.
Limitations
Following are the limitations of continuous production:
Flexibility to accommodate and process number of products does not exist.
Very high investment for setting flow lines.
Product differentiation is limited
Mass Production:
Henry ford designed his first moving assembly line. In 1913, and revolutionized the
manufacturing processes. It was Henry‘s intention to produce largest no. of cars, to the
simplest design, for the lowest possible cost. The assembly line became the benchmark for
mass production methods around the world.
Mass Production is the name given to the method of producing goods in large quantities at
low cost per unit. But mass production, although allowing lower prices, does not have to
mean low quality production. Instead mass produced goods as standardized by means of
precision manufactured, interchangeable parts.
Machine tools and interchangeable parts the material basis for mass production was laid
by the development of the machine tool industry that is, the making of machines to make
machines.
The assembly line is an arrangement of machines, tools and workers in which a product is
assembled by having each perform a specific, successive operation on an incomplete unit
as it passes by in a series of stages organized in a direct line.
Example of Mass Production systems:
Production of biscuits in a factory can be taken as an example of mass production. At
every stage a particular operation is performed using a specific machine. As is shown
below, packs of identical biscuits are produced in an industrial unit
Stage: 1: MIXING: Flour + fat + sugar + bicarbonate + additives
Stage: 2: MOULDING: Dough is laminated in a laminator
Stage: 3: GAUZE ROLLS: Laminated dough is cut as per size and shape
Stage: 4: BAKING: Biscuits cut into shapes are baked in the oven
Stage: 5: COOLING: Biscuits are cooled in conveyors once they are baked
Stage: 6: PACKAGING: The final product is then packed into pouches and cartons
Characteristics
Achieve economies of scale by producing in very large quantity
Standardizing products
Developing efficient processes
Producing more of each product at one time
Selling at lower price
Advantages
Higher rate of production with reduced cycle time.
Higher capacity utilization due to line balancing.
Less skilled operators are required.
Low process inventory.
Manufacturing cost per unit is low.
Reducing direct labour cost
Accuracy in product design and quality
Limitations
Breakdown of one machine will stop an entire production line.
Line layout needs major change with the changes in the product design.
High investment in production facilities.
The cycle time is determined by the slowest operation.
Concept of Standardization
Standardization means producing maximum variety of products from the minimum variety
of materials, parts, tools and processes. It is the process of establishing standards or units
of measure by which extent, quality, quantity, value, performance etc., may be compared
and measured.
Factors encouraging standardization are:
Economies of scale in production and marketing
Consumer mobility - the more consumers travel the more is the demand
Technology
Image, for example "Japanese", "made in".
Advantages of Standardization to various departments in the company:
Benefits to Manufacturing Department:
Lower unit cost.
Better quality products.
Better methods and tooling.
Increased interchangeability of parts.
Better utilization of manpower and equipment.
Accurate delivery dates.
Better services of production control, stock control, purchasing, etc.
More effective training.
Benefits to Production Planning Department:
Scope for improved methods, processes and layouts.
Opportunities for more efficient tool design.
Better resource allocation.
Reduction in pre-production activities.
Benefits to Production Control Department:
Well proven design and methods improve planning and control.
Accurate delivery promises.
Fewer delays arise from waiting for materials, tools, etc.
Follow-up of small batches consumes less time.
Benefits to Purchase and Stock Control Department:
Holding of stock of standard items leads to less paper work and fewer requisitions and
orders.
Storage and part location can be improved.
Newer techniques can be used for better control of stocks.
Because of large purchase quantities involved, favorable purchase contracts can be
made.
Benefits to Quality Control Department:
Better inspection and quality control is possible.
Quality standards can be defined more clearly.
Operators become familiar with the work and produce jobs of consistent quality.
Other Benefits:
Work study section is benefited with efficient break down of operations and effective
work measurement.
Costing can obtain better control by installing standard costing.
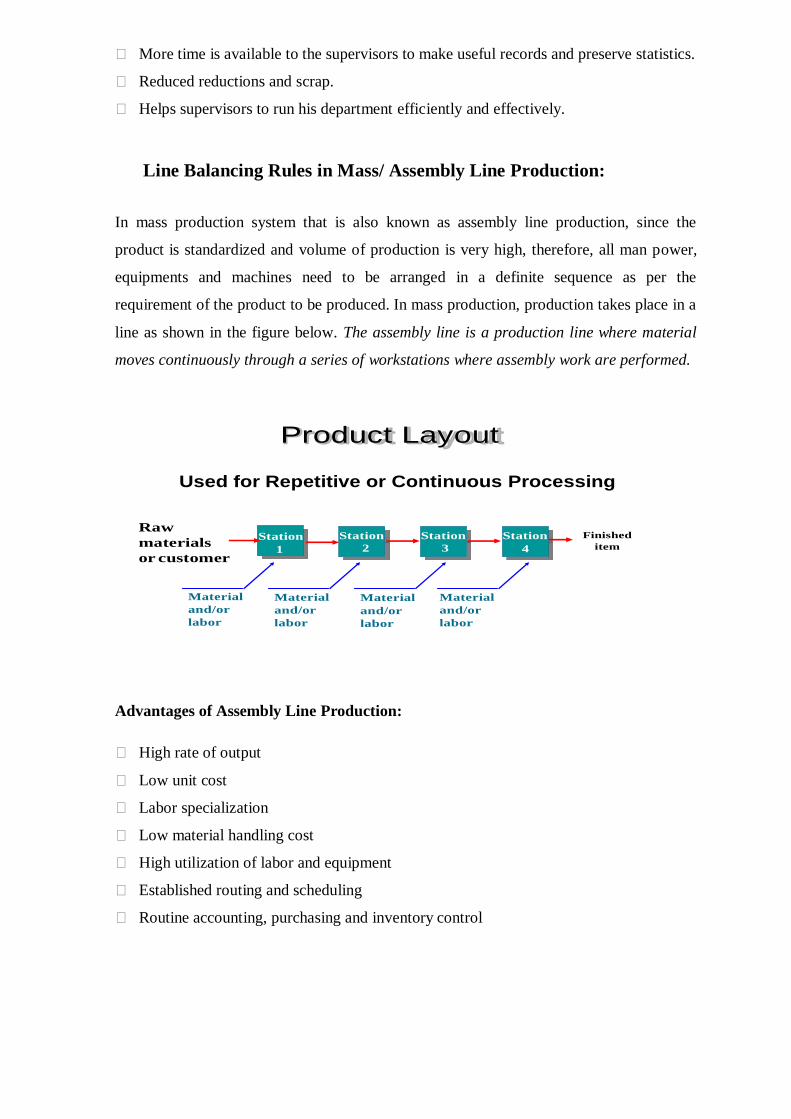
More time is available to the supervisors to make useful records and preserve statistics.
Reduced reductions and scrap.
Helps supervisors to run his department efficiently and effectively.
Line Balancing Rules in Mass/ Assembly Line Production:
In mass production system that is also known as assembly line production, since the
product is standardized and volume of production is very high, therefore, all man power,
equipments and machines need to be arranged in a definite sequence as per the
requirement of the product to be produced. In mass production, production takes place in a
line as shown in the figure below. The assembly line is a production line where material
moves continuously through a series of workstations where assembly work are performed.
Used for Repetitive or Continuous Processing
Raw
materials
or customer
Finished
item
Material
and/or
labor
Material
and/or
labor
Material
and/or
labor
Material
and/or
labor
Advantages of Assembly Line Production:
High rate of output
Low unit cost
Labor specialization
Low material handling cost
High utilization of labor and equipment
Established routing and scheduling
Routine accounting, purchasing and inventory control
Product Layout
Station
4
Station
3
Station
2
Station
1
Line Balancing Problem in Assembly Line Production:
Since in assembly line production, all man power, machines, equipments and workstations
are arranged in a line as per the product process requirements, it is necessary that this line
should be balanced. This means that time taken at each work station must be equal and
preferably equal to cycle time, otherwise continuous production may be hampered.
Therefore, there is a pressing need to arrange the individual processing and assembly tasks
at the workstations so that the total time required at each workstation is approximately the
same. It is almost impossible to reach perfect balance.
Things to Consider in Line Balancing:
Sequence of tasks is restricted, there is a required order, called precedence constraints
There is a production rate needed, i.e. how many products needed per time period
Design the line to meet demand and within constraints
Terminology and Definitions:
Minimum Work Element
Total Work Content
Workstation Process time
Cycle Time
Precedence Constraints
Balance Delay
Minimum Work Element:
Dividing the job into tasks of a rational and smallest size
Example: Drill a hole, can‘t be divided
Symbol – Time for element j: Tej
Tej is a constant
Total Work Content:
Aggregate of work elements
Twc Tej
j 1
n
Work Station Process Time:
The amount of time for an individual workstation, after individual tasks have been
combined into stations
Sum of task times = sum of workstation times
Cycle Time:
Time between parts coming off the line
Ideally, the production rate, but may need to be adjusted for efficiency and down time
Established by the bottleneck station, that is station with largest time
Precedence Constraints:
Generally given, determined by the required order of operations
Draw in a network style for understanding
Cannot violate these, an element must be complete before the next one is started
Balance Delay:
Measure of line inefficiency due to imbalances in station times
d nTc Twc
nTc
Method- Largest candidate Rule:
List elements in descending order of T
Assign elements to first station, from top to bottom of list, minding constraints, and
not causing sum to exceed cycle time
Continue assigning elements to stations where each station < cycle time, largest
assigned first, until all assigned
Example of Line Balancing in Continuous/ Mass Production:
The above discussed rule and complete process of line balancing may be understood better
with the help of following example:
IFFCO Fertilizer Limited plant manager on the basis of forecast made by sales
department; wants its production line to be designed to make 2,400 spreaders per week.
The plant will operate 40 hours per week.
(Q1.) What should be the line‟s cycle time or throughput rate per hour be?
Throughput rate/hr = 2400 / 40 = 60 spreaders/hr
Cycle Time = 1/Throughput rate= 1/60 = 1 minute = 60 seconds
Assume that in order to produce the new fertilizer spreader on the assembly line requires
doing the following steps in the order specified:
Work
Element
Description
Time (sec) Immediate
Predecessor(s)
A Bolt leg frame to hopper 40 None
B Insert impeller shaft 30 A
C Attach axle 50 A
D Attach agitator 40 B
E Attach drive wheel 6 B
F Attach free wheel 25 C
G Mount lower post 15 C
H Attach controls 20 D, E
I Mount nameplate 18 F, G
Total 244
(Q2.) What is the total number of stations or machines required?
TM (Total machines) = total production time / cycle time = 244/60 = 4.067 or ≈ 5
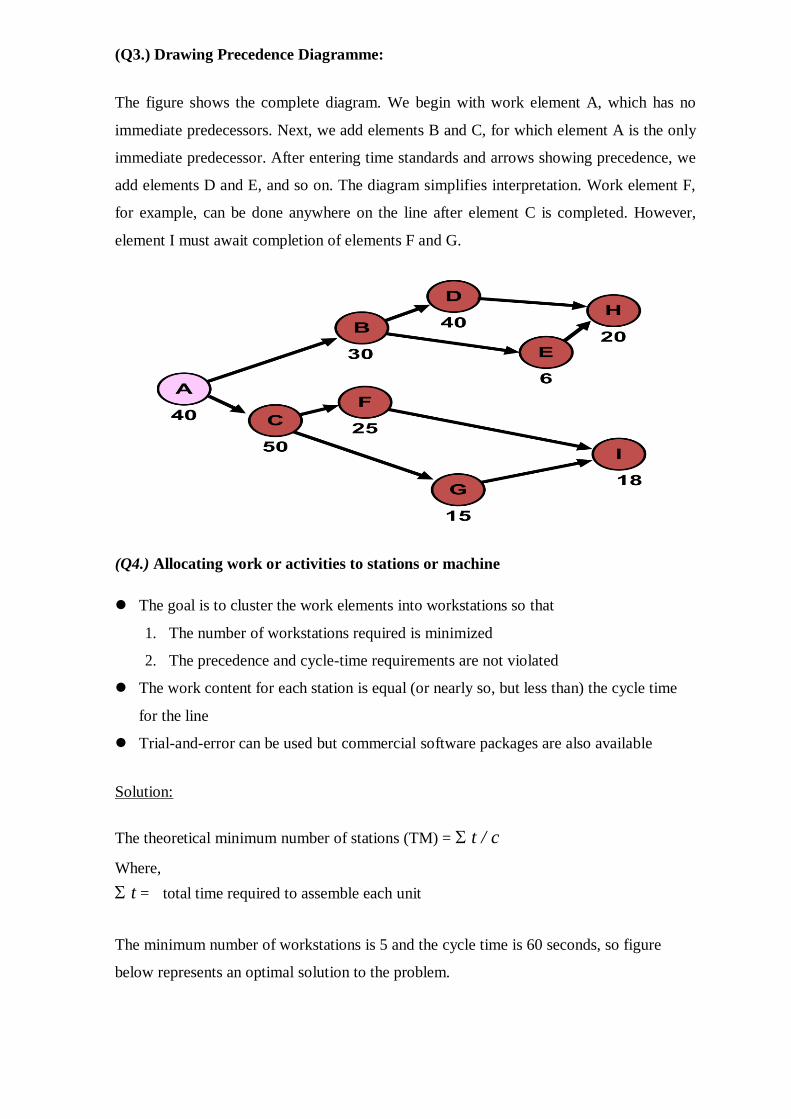
(Q3.) Drawing Precedence Diagramme:
The figure shows the complete diagram. We begin with work element A, which has no
immediate predecessors. Next, we add elements B and C, for which element A is the only
immediate predecessor. After entering time standards and arrows showing precedence, we
add elements D and E, and so on. The diagram simplifies interpretation. Work element F,
for example, can be done anywhere on the line after element C is completed. However,
element I must await completion of elements F and G.
(Q4.) Allocating work or activities to stations or machine
The goal is to cluster the work elements into workstations so that
1. The number of workstations required is minimized
2. The precedence and cycle-time requirements are not violated
The work content for each station is equal (or nearly so, but less than) the cycle time
for the line
Trial-and-error can be used but commercial software packages are also available
Solution:
The theoretical minimum number of stations (TM) = t / c
Where,
t = total time required to assemble each unit
The minimum number of workstations is 5 and the cycle time is 60 seconds, so figure
below represents an optimal solution to the problem.
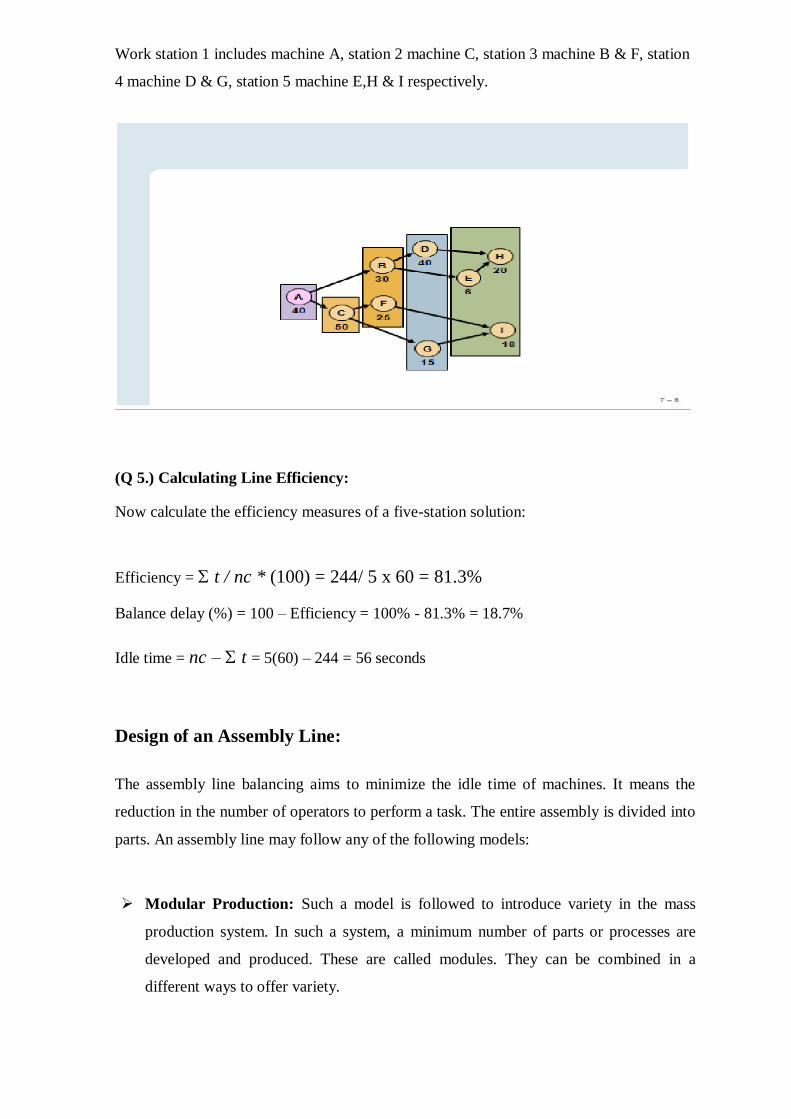
Work station 1 includes machine A, station 2 machine C, station 3 machine B & F, station
4 machine D & G, station 5 machine E,H & I respectively.
(Q 5.) Calculating Line Efficiency:
Now calculate the efficiency measures of a five-station solution:
Efficiency = t / nc * (100) = 244/ 5 x 60 = 81.3%
Balance delay (%) = 100 – Efficiency = 100% - 81.3% = 18.7%
Idle time = nc – t = 5(60) – 244 = 56 seconds
Design of an Assembly Line:
The assembly line balancing aims to minimize the idle time of machines. It means the
reduction in the number of operators to perform a task. The entire assembly is divided into
parts. An assembly line may follow any of the following models:
Modular Production: Such a model is followed to introduce variety in the mass
production system. In such a system, a minimum number of parts or processes are
developed and produced. These are called modules. They can be combined in a
different ways to offer variety.
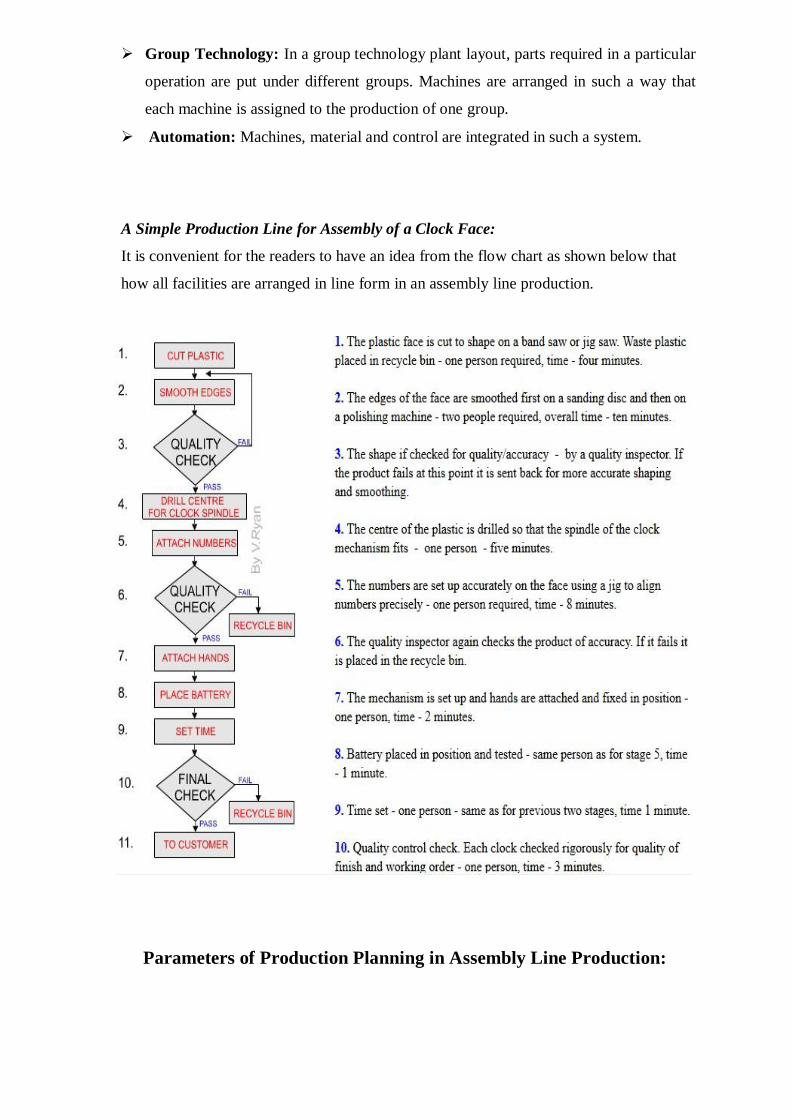
Group Technology: In a group technology plant layout, parts required in a particular
operation are put under different groups. Machines are arranged in such a way that
each machine is assigned to the production of one group.
Automation: Machines, material and control are integrated in such a system.
A Simple Production Line for Assembly of a Clock Face:
It is convenient for the readers to have an idea from the flow chart as shown below that
how all facilities are arranged in line form in an assembly line production.
Parameters of Production Planning in Assembly Line Production:
Production planning is related to making the plans i.e. the detailed scheduling of jobs,
assigning of workloads to machines (and people), routing, and the actual flow of work
through the system. As production is an organized activity of converting row materials
into useful products, plans are made in coordination with different departments: such as
production, marketing, logistics, warehouse and other departments depending upon the
nature of organization. Planning is always done on the basis of the aim and objective of
the production process while keeping in mind the available resources.
Production control is concerned with the effective implementation of the plans. Planning
and control are the two most basic, integral and interdependent functions. The plan for an
activity is drawn before executing the design or the process. The planning part is always
pre operation. Control is done after execution or implementation of the planned layout and
procedure. Production planning and control can be viewed as nervous system of the
production operation.
A proper control system has to be in place for the best utilization of resources and
information before production and analyzing and appraising the performance of labor and
equipment after the production is complete. A critical assessment is possible only by
setting up a control mechanism.
The basic objectives of production planning and control are:
To evaluate and appraise the resources at input stage, like the raw materials, labor,
data, information and methods required for a production process and to estimate their
quantity and quality
To implement the preplanned process in such a way that optimum production is
achieved with maximum efficiency and minimum wastage.
Benefits of Production Planning and Control:
Systematic planning of production activities to achieve the highest efficiency in
production of goods/services
To organize the production facilities like machines, men, etc., to achieve stated
production Objectives with respect to quantity and quality time and cost
Optimum scheduling of resources
Coordinate with other departments relating to production to achieve regular balanced
and uninterrupted production flow
To conform to delivery commitments
Materials planning and control
To be able to make adjustments due to changes in demand and rush orders.
Parameters of Production Planning:
The various parameters of production planning may be explained as hereunder:
Materials: Raw materials, finished parts and bought out components should be made
available in required quantities and at required time to ensure the correct start and end
for each operation resulting in uninterrupted production. The function includes the
specification of materials (quality and quantity) delivery dates, variety reduction
(standardization) procurement and make or buy decisions. In assembly line production
material planning becomes very easy as there is no any frequent change in process and
production takes place continuously.
Machines and equipment: This function is related with the detailed analysis of
available production facilities, equipment down time, maintenance policy procedure
and schedules. Concerned with economy of jigs and fixtures and equipment
availability. Thus, the duties include the analysis of facilities and making their
availability with minimum down time because of breakdowns
Methods: This function is concerned with the analysis of alternatives and selection of
the best method with due consideration to constraints imposed. Developing
specifications for processes is an important aspect of production planning and
determination of sequence of operations. In assembly line all machines, equipments
and man power are arranged in a line in the form of work station, therefore, it is the
simplest in it.
Routing: Routing means determination of most advantageous path to be followed
from department to department and machine, till the raw material gets its final shape.
Routing is related to considerations of layout, temporary storage of in process
inventory and material handling.
Routing in continuous production industries does not present any problem because of
the product type of layout, where the machines are arranged according to the sequence
of operations required to be performed on the components. As the production is made
of standardized products, the number of operations and sequence of operations arc
standardized. The machines are arranged in sequence with automatic material handling
systems. As the production is continuous and constant, routing becomes a routine and
mechanical function. In automation routing is still simple and is governed
automatically.
Advantages of Routing:
Reduction in manufacturing costs;
Improvement in quantity and quality of the output;
Provides a basis for scheduling and loading.
Estimating: Once the overall method and sequence of operations is fixed and process
sheet for each operation is available, then the operations times are estimated. This
function is carried out using extensive analysis of operations along with methods and
routing and a standard time for operation are established using work measurement
techniques.
Loading and scheduling: Scheduling is concerned with preparation of machine loads
and fixation of starting and completion dates for each of the operations. Machines have
to be loaded according to their capability of performing the given task and according
to their capacity. Thus the duties include:
(a) Loading, the machines as per their capability and capacity.
(b) Determining the start and completion times for each operation.
(c) To coordinate with sales department regarding delivery schedules.
Dispatching: This is the execution phase of planning. It is the process of setting
production activities in motion through release of orders and instructions. It
authorizes the start of production activities by releasing materials, components, tools,
fixtures and instruction sheets to the operator.
The activities involved are:
To assign definite work to definite machines, work centers and men
To issue required materials from stores
To issue jigs, fixtures and make them available at correct point of use
Release necessary work orders, time tickets, etc., to authorize timely start of
operations
To record start and finish time of each job on each machine or by each man.
Procedure for Production Planning
The process of production planning and control is based on a preset formulation. The plans
are made for a specified time period keeping in view the stipulated costs and agreed
policies. It is necessary to ensure that the plans are implemented properly. In planning,
costs include the capital cost of the facility, assets and labor. The procedure followed in
production planning is as follows:
1) Demand predictions: The production planning process begins with estimating or
forecasting the demand among the consumers for the product or the service which is
being offered.
Preparation of production budget: to compute the total cost of production.
Design the facility layout
Prescribe the types of machines and equipments to be used
Appropriation of production requirements: At the planning stage itself the
appropriation of raw materials, men and machinery required is done. Specifics
regarding their quality and quantity are decided.
2) Schedules: The schedules of production are drawn. Date by which a particular
operation or production step should be completed is stipulated and reasonable
allowances are made for any possible delays or errors.
The shortage or excess of the end product is ascertained in relation to efficiency of
labor and equipment. According to the fluctuation in the demand for the product,
necessary adjustments are made in capacity of machines and the number of labor.
Plans are drawn in case of a sudden surge in demand as in seasonal advantages of
certain products. Cost of surplus inventory and stocks are taken account of.
3) Rate of Production: The rate and scale of production is set up. It is broken into
realistic time periods and schedules. The stipulated or specified job needs to be
finished by a particular date to start the next step.
In assembly line production, it is a great challenge to equalize the rate of
production for each and every workstation. It is done through line balancing as
explained earlier in this chapter. The main purpose is to reduce the line idle time so
that line efficiency is the maximum.
Factors Affecting Production Planning:
Production planning particularly in assembly line production is affected by following
factors:
Use of Computers: Modern factories are using office automation equipment like PC,
punch cards etc. It helps accurate computation of required of men and machine.
Seasonal Variations: Demand of certain products is affected by seasons, for instance
umbrellas and raincoats during the monsoons and outputs. Production planning and
control must take such changes into consideration while planning and control
activities of inputs and outputs.
Test Marketing: In an aggressive marketing strategy new products are to be test
marketed in order to know the trends. This is a short- cycle operation, intermittent in
nature and often upsets regular production.
After Sales Service: This has become an important parameter for success. In after
sales services, many items are returned for repair. These are unscheduled work and
also overload the production line.
Losses due to Unpredictable Factors: Losses occur due to accidents, fire and theft
of production inputs, mainly materials and components. These are unpredictable.
Shortage of input due to such factors upset the planned production schedule in time
and quantity.
Losses due to Predictable Factors: There are losses of inputs, due to natural
engineering phenomena like production losses and changes in consumption of
materials and occurrence of defectives.
Production of Order: There are occasions when last minute prioritization of existing
orders due to external pressure takes place. These changes in priority are often
decided by sufficiently high level of management.
Design Changes: Design changes are issued by R & D and the engineering
department. This will necessarily force production planning control change the input
materials and process.
Rejection and Replacement: There are occasions when sub-assemblies or finished
goods are rejected during stage or final inspection. Production planning and control
must cater for contingent plans to take care of rework without affecting scheduled
quality.
Summary:
In this chapter, we have discussed the meaning of production that is step-by-step
conversion of one form of material into another form through chemical and mechanical
process to create or enhance the utility of the product to the user. Some examples of
production are: manufacturing standardized products like cars, bus, motorcycle, radio, TV
etc.
A production system is actually a combination of various methods, procedures,
arrangements and different functions that are required to accumulate (gather) the inputs,
process or reprocess the inputs and deliver the marketable output (goods). Production
system utilizes materials, funds, infrastructure and labour to produce the required output.
There are different types of production systems. These processes may be mentioned as
hereunder:
Job shop: For small scale production
Batch: For moderate volume
Repetitive/assembly line: For high volumes of standardized goods or services
Continuous: For very high volumes of non-discrete goods
The selection of production system mainly depends upon the variety of the products to be
produced, volume of production and degree of flexibility required.
In the chapter, our main focus is on the production of high volumes of standardized goods.
For such types of goods, mainly mass/ continuous production system is used. It is also
known as assembly line production. In assembly line production system, since the product
is standardized and volume of production is very high, therefore, all man power,
equipments and machines need to be arranged in a definite sequence as per the
requirement of the product to be produced. In this, production takes place in a line. The
assembly line is a production line where material moves continuously through a series of
workstations where assembly work are performed.
Production planning parameters and procedure for assembly line has been discussed in
detail. The main problem in assembly line production is to equalize the rate of production
for every work station and make it equal to cycle time. It is done under line balancing. The
complete process has been explained with the help of suitable example. Adequate
emphasis has also been given on the factors affecting planning procedure in assembly line
production.
Self-assessment Questions:
1) What do you understand by production and production process? Discuss various
production processes.
2) Explain in detail various types of production System.
3) Why Standardization is required in Mass Production?
4) Discuss in detail the merits and limitations of mass production.
5) Discuss the various parameters of production planning in assembly line production.
6) Explain the complete procedure of production planning in assembly line production.
7) Explain the concept of line balancing with the help of suitable example. Calculate all
of its necessary parameters.
Keywords:
Production System: Manufacturing subsystem that includes all functions required to
design, produce, distribute, and service a manufactured product.
Mass Production: Mass production or flow production is the production of large amounts
of standardized products, including and especially on assembly lines.
Standardization: Standardization is a framework of agreements to which all relevant
parties in an industry or organization must adhere to ensure that all processes associated
with the creation of a good or performance of a service are performed within set
guidelines.
Production Planning and Control: Production planning and control address a
fundamental problem of low productivity, inventory management and resource utilization.
Capacity Planning: Capacity is defined as the ability to achieve, store or produce. For an
organization, capacity would be the ability of a given system to produce output within the
specific time period. Capacity planning is essential to be determining optimum utilization
of resource and plays an important role decision-making process, for example, extension
of existing operations, modification to product lines, starting new products, etc.
Routing: Selecting the minimum cost, distance, and/or time path from several alternatives
for a good or message to reach its destination.
Scheduling: Scheduling is the process of arranging, controlling, optimizing work and
workloads in a production process or manufacturing process.
References:
Ravi, A., Chopra, S., Sudhakar, D., Deshmukh, J. A., Mieghem, V. and Zemel, E.
Managing Business Process Flows: Principles of Operations Management. Upper Saddle
River, NJ: Pearson Prentice Hall, 2006.
Production/Operations Management by William J. Stevenson, Irwin/McGraw-Hill
Production Planning and Control by K. Shridhara Bhat and K. Aswathappa
Production Systems: Planning, Analysis & Control: By —Riggs, J.L.(4th Edn.) John Wiley
& Sons
*******
Procedure and Documentation in Production Planning and Control (PPC)
As we have already discussed the concept of production planning and control in detail in
previous chapters, now our focus would be on the various types of information, reports
and documents required in production planning and control exercise. Production plans are
prepared for the future production, in which the facilities needed are determined and
arranged. A production planning is made periodically for a specific time period, called the
planning horizon.
Production Planning may be said to be a technique of forecasting ahead every step in the
long process of production, taking them at right time and in the right degree and trying to
complete operations at the maximum efficiency
In the words of Kimball and Kimball Jr –
“The planning of industrial operations involves four considerations, namely, what work
shall be done, how the work shall be done and lastly, when the work shall be done.”
Production control is the process that keeps a watchful eye on the production flow and size
of resources along with the location, of any deviation from the present action and to
arrange for the prompt adjustment so that the production may run according to the original
or revised schedule
In the words of Henry Fayol –
“Production control refers to ensuring that all which occurs is in accordance with the
rules established and instructions issued.”
Production planning and control essentially consists of planning production in a
manufacturing organization before actual production activities start and exercising control
activities to ensure that the planned production is realized in terms of quantity, quality,
delivery schedule and cost of production. Production planning involves the organization of
an overall manufacturing / operating system to produce a product.
The various activities involved in production planning are designing the product,
determining the equipment and capacity requirement, designing the layout of physical
facilities and material and material handling system, determining the sequence of
operations and the nature of the operations to be performed along with time requirements
and specifying certain production quantity and quality levels. The main objective of
production planning is to provide a physical system together with a set of operating
guidelines for efficient conversion of raw materials, human skills and other inputs into
finished products.
An Overview of Production Planning and Control:
Modern production planning methods and tools have been developed since late 19th
century. Under Scientific Management, the work for each man or each machine is mapped
out in advance. The origin of production planning goes back another
century. Kaplan (1986) summarized that "the demand for information for internal planning
and control apparently arose in the first half of the 19th century when firms, such as textile
mills and railroads, had to devise internal administrative procedures to coordinate the
multiple processes involved in the performance of the basic activity (the conversion of raw
materials into finished goods by textile mills, the transportation of passengers and freight
by the railroads)."
Herrmann (1996) further describes the circumstances in which new methods for internal
planning and control evolved: "The first factories were quite simple and relatively small.
They produced a small number of products in large batches. Productivity gains came from
using interchangeable parts to eliminate time-consuming fitting operations. Through the
late 1800s, manufacturing firms were concerned with maximizing the productivity of the
expensive equipment in the factory. Keeping utilization high was an important objective.
Foremen ruled their shops, coordinating all of the activities needed for the limited number
of products for which they were responsible. They hired operators, purchased materials,
managed production, and delivered the product. They were experts with superior technical
skills, and they (not a separate staff of clerks) planned production. Even as factories grew,
they were just bigger, not more complex.
About production planning Herrmann (1996) recounts that "production scheduling started
simply also. Schedules, when used at all, listed only when work on an order should begin
or when the order is due. They didn't provide any information about how long the total
order should take or about the time required for individual operations".
In 1923 Industrial Management cited a Mr. Owens who had observed: "Production
planning is rapidly becoming one of the most vital necessities of management. It is true
that every establishment, no matter how large or how small has production planning in
some form ; but a large percentage of these do not have planning that makes for an even
flow of material, and a minimum amount of money tied up in inventories."
Characteristics of Production Planning & Control:
Inputs like materials, men and machines are efficiently used
Factors of production are integrated to use them economically
Division of work is undertaken carefully so that every available element is properly
utilized
Work is regulated from the first stage of procuring raw materials to the stage of
finished goods
Questions like what, when and how to be manufactured are decided
Aims & Objectives:
Determining sequence of operations for continuous production
Planning plant capacity for future production programmes
Issuing coordinated work schedules to concerned persons
Maintaining sufficient inventories to support continuous flow of production
Evaluating performance of workshops
Maintaining production schedules to ensure delivery at proper time.
Importance of Production planning and Control:
Production planning and control is important for the following reasons:
For Increasing Production: Main purpose of production planning is to arrange
inputs. Production control programme minimizes idleness of men and machines. It
thus helps in raising industrial output.
For Coordinating Plant Activity: In planning production is carried out in a number
of processes and thus activities are synchronized for smooth working.
For Cost Control: A properly planned system of production will help in controlling
costs by not only making full utilization of various inputs but also by increasing
output and lowering overhead expenses per unit.
For Rationalization of Production Activities: In production planning, the process of
entering of raw materials and converting them into finished goods is planned in such
a way that everything is done in sequence or routine. It regulates flow of inputs to run
production system smoothly.
Benefits of Production Planning and Control:
It ensures that optimum utilization of production capacity is achieved, by proper
scheduling of the machine items which reduces the idle time as well as over use.
It ensures that inventory levels are maintained at optimum levels at all time, i.e. there
is no over-stocking or under-stocking.
It also ensures that production time is kept at optimum level and thereby increasing
the turnover time.
Since it takes care of all aspects of production, quality of final product is always
maintained.
Limitations of Production Planning and Control:
Following are the limitations faced by production planning and control –
Based on Assumptions – Production planning and control is based on certain
assumptions. In case the assumptions prove correct, the planning and control will go
smoothly. But if they go wrong, process of planning and control will go weak.
Rigidity – Under production planning and control, there is rigidity in the behaviour of
employees and it may not help in smoothening flow of work.
Difficult for Small Firms – This process is time consuming and therefore not
affordable for small firms
Costly – It is a costly device as its implementation requires separate persons to
perform functions of planning, expediting, dispatching etc.
Dependence on External Factors – External factors like natural calamities, change
in technology, government controls etc reduce effectiveness of production planning.
Procedure of Production Planning and Control:
Procedure of Production Planning:
Planning in a manufacturing organization is done before actual production activities start.
Production planning involves the organization of an overall manufacturing / operating
system to produce a product. The main purpose of planning is to provide a physical system
together with a set of operating guidelines for effective transformation of raw materials,
human skills and other inputs into finished products. The main activities covered in
planning are as follows:
Materials: Planning for procurement of raw materials, components, and spare parts
in the right quantities and specifications at the right time from the right source at the
right price. Purchasing, storage, inventory control, standardization, variety reduction,
value analysis, and inspection are the other activities associated with material.
*Materials & Resource Planning is explained in details later.
Methods: Choosing the best method of processing form several alternatives. It also
including determining the best sequence of operations (process plans) and planning
for tooling, jigs and fixtures etc.
Machines and Equipments: Manufacturing methods are related to production
facilities available in the production systems. It involves facilities planning, capacity
planning, allocation, and utilization of plant and equipments, machines etc.
Manpower: Planning for manpower (labour and managerial levels) having
appropriate skills and expertise.
Procedure of Production Control:
Planning and control in production go side by side. Production control is the process that
keeps a close vigil on the production flow and size of resources along with the location, of
any deviation from the present action and to arrange for the prompt adjustment so that the
production may run according to the original or revised schedule. In short, production
control refers to ensuring that all which occurs is in accordance with the rules established
and instructions issued in the plans. Control encompasses following procedures:
Routing: Determining the flow of work, material handling in the plant and sequence
of operations or processing steps. It is related to consideration of appropriate shop
layout and plant layout, temporary storage locations for raw materials, components
and semi-finished goods, and of materials handling systems. The information
pertaining to all above is contained in a document termed as ―route sheet‖.
Route sheet: This is a document providing information and instruction for converting
the raw materials into finished parts or products. It defines each step of the production
operation and lays down the precise path or route through which the product will flow
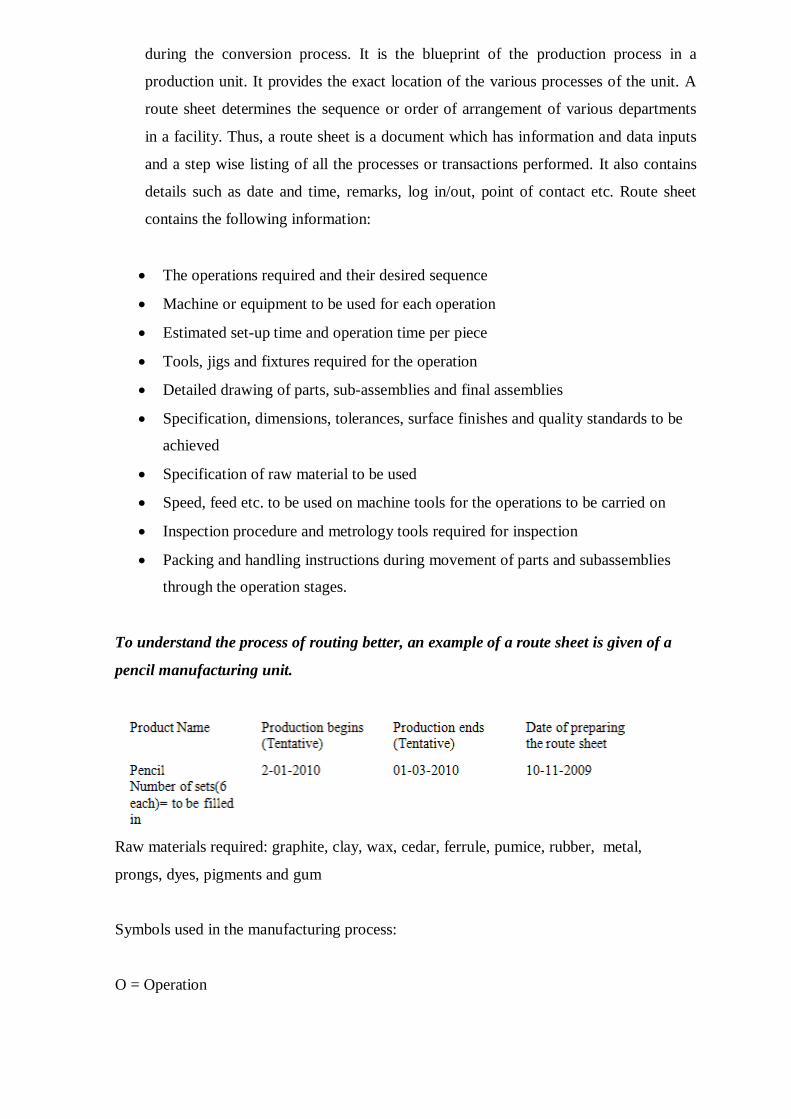
during the conversion process. It is the blueprint of the production process in a
production unit. It provides the exact location of the various processes of the unit. A
route sheet determines the sequence or order of arrangement of various departments
in a facility. Thus, a route sheet is a document which has information and data inputs
and a step wise listing of all the processes or transactions performed. It also contains
details such as date and time, remarks, log in/out, point of contact etc. Route sheet
contains the following information:
The operations required and their desired sequence
Machine or equipment to be used for each operation
Estimated set-up time and operation time per piece
Tools, jigs and fixtures required for the operation
Detailed drawing of parts, sub-assemblies and final assemblies
Specification, dimensions, tolerances, surface finishes and quality standards to be
achieved
Specification of raw material to be used
Speed, feed etc. to be used on machine tools for the operations to be carried on
Inspection procedure and metrology tools required for inspection
Packing and handling instructions during movement of parts and subassemblies
through the operation stages.
To understand the process of routing better, an example of a route sheet is given of a
pencil manufacturing unit.
Raw materials required: graphite, clay, wax, cedar, ferrule, pumice, rubber, metal,
prongs, dyes, pigments and gum
Symbols used in the manufacturing process:
O = Operation
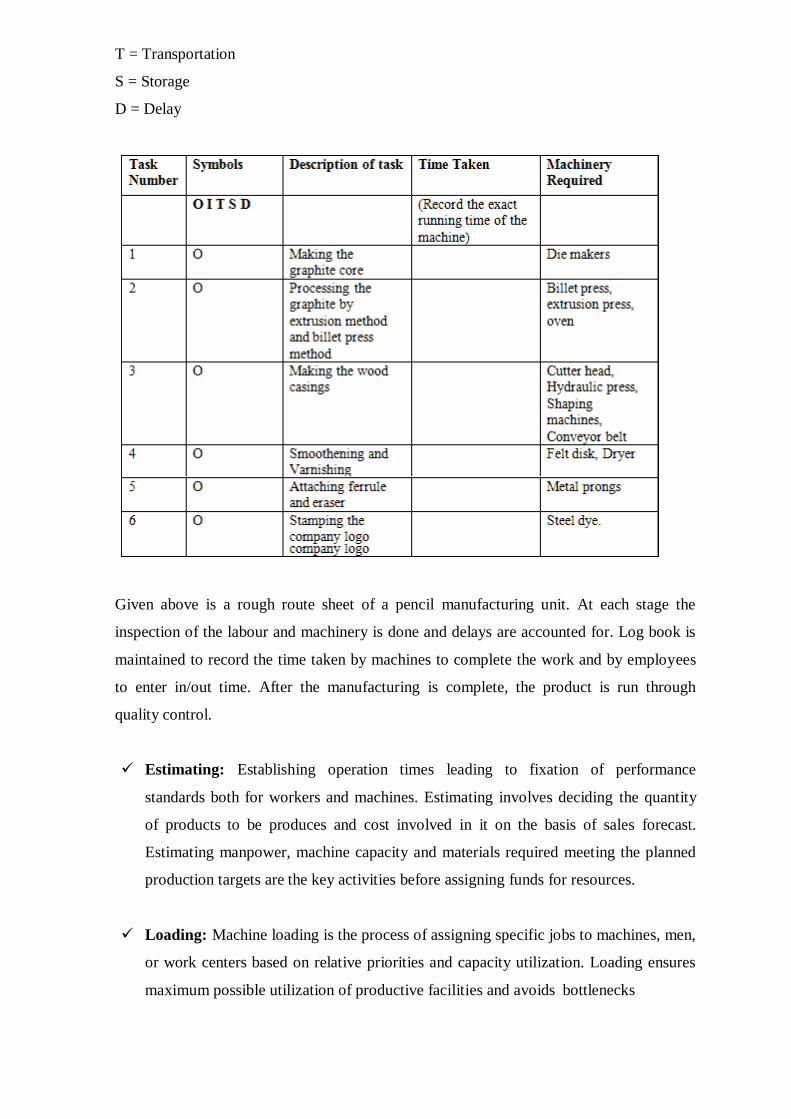
T = Transportation
S = Storage
D = Delay
Given above is a rough route sheet of a pencil manufacturing unit. At each stage the
inspection of the labour and machinery is done and delays are accounted for. Log book is
maintained to record the time taken by machines to complete the work and by employees
to enter in/out time. After the manufacturing is complete, the product is run through
quality control.
Estimating: Establishing operation times leading to fixation of performance
standards both for workers and machines. Estimating involves deciding the quantity
of products to be produces and cost involved in it on the basis of sales forecast.
Estimating manpower, machine capacity and materials required meeting the planned
production targets are the key activities before assigning funds for resources.
Loading: Machine loading is the process of assigning specific jobs to machines, men,
or work centers based on relative priorities and capacity utilization. Loading ensures
maximum possible utilization of productive facilities and avoids bottlenecks
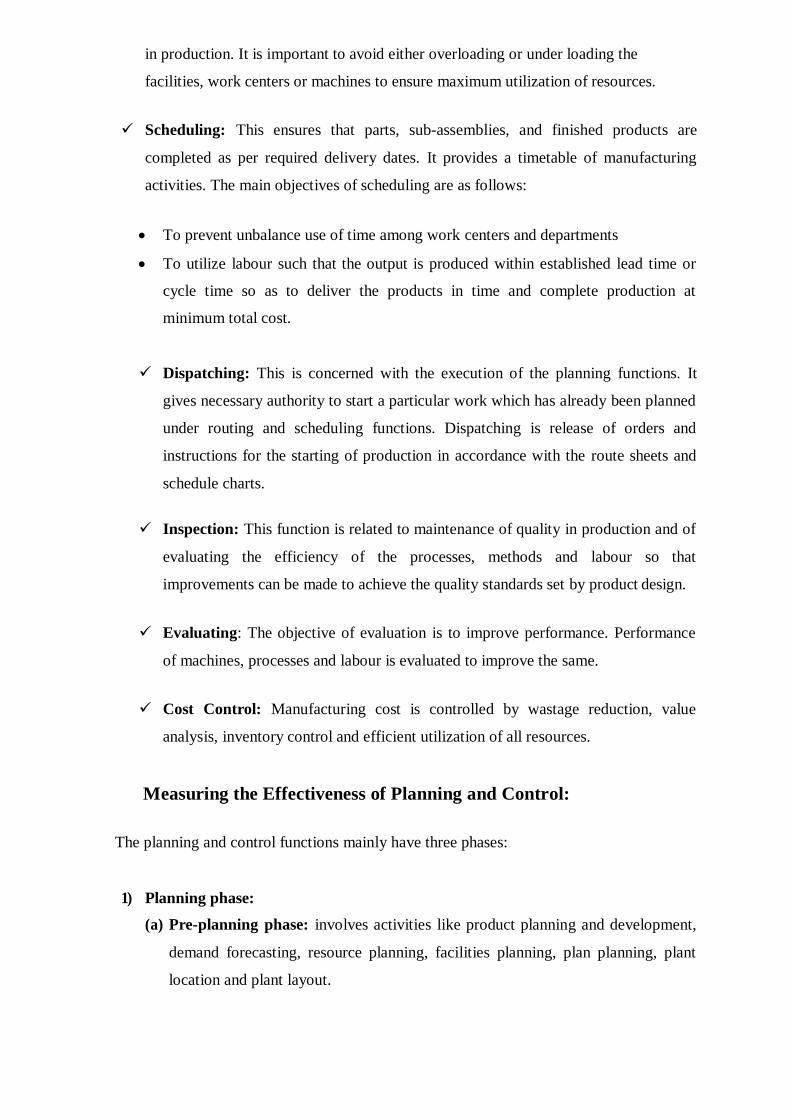
in production. It is important to avoid either overloading or under loading the
facilities, work centers or machines to ensure maximum utilization of resources.
Scheduling: This ensures that parts, sub-assemblies, and finished products are
completed as per required delivery dates. It provides a timetable of manufacturing
activities. The main objectives of scheduling are as follows:
To prevent unbalance use of time among work centers and departments
To utilize labour such that the output is produced within established lead time or
cycle time so as to deliver the products in time and complete production at
minimum total cost.
Dispatching: This is concerned with the execution of the planning functions. It
gives necessary authority to start a particular work which has already been planned
under routing and scheduling functions. Dispatching is release of orders and
instructions for the starting of production in accordance with the route sheets and
schedule charts.
Inspection: This function is related to maintenance of quality in production and of
evaluating the efficiency of the processes, methods and labour so that
improvements can be made to achieve the quality standards set by product design.
Evaluating: The objective of evaluation is to improve performance. Performance
of machines, processes and labour is evaluated to improve the same.
Cost Control: Manufacturing cost is controlled by wastage reduction, value
analysis, inventory control and efficient utilization of all resources.
Measuring the Effectiveness of Planning and Control:
The planning and control functions mainly have three phases:
1) Planning phase:
(a) Pre-planning phase: involves activities like product planning and development,
demand forecasting, resource planning, facilities planning, plan planning, plant
location and plant layout.
(b) Active planning phase: involves planning for quality, determination of product-
mix, routing, scheduling, material planning, process planning, facility planning,
capacity planning and tool planning.
2) Action phase: Execution or implementation phase includes dispatching and
progressing function.
3) Control phase: Includes status reporting, material control, tool control, inventory
control, quality control, labour output control and cost control.
Measuring Effectiveness:
The main task of production planning and control department is to coordinate the activities
of various departments, which supports production department viz., purchase, stores,
industrial engineering, quality control, design, maintenance etc. Hence the effectiveness of
planning and control functions can be generally measured by the company‘s success in
meeting the demand and its ability to produce quality products and deliver them in the
delivery schedules desired by the customers at a reasonable price that is acceptable to
customers and thereby achieve maximum customer satisfaction.
There are four specific areas in which effectiveness of planning and control function can
be measured:
Delivery: This can be measured by finding out the number of deliveries effected on
time and those got delayed over a period of time
Inventory levels: The value of average inventory held annually value of obsolete
inventory, value of non-moving and surplus inventories and the inventories and the
inventory turnover ratio are indicators of efficiency in inventory management
Comparison of planned and actual: Production indicates the performance of planning
and control function. Number of overtime hours worked, machine utilization ratio etc
is also indicator of effectiveness of this function
Revenues and expenditures: The expenditures incurred for carrying out the various
function of planning and control vis-à-vis the production values and sales revenue
realized.
Materials & Resource Requirement Planning:
As we have discussed in earlier chapters per se, success of production/ operation
department in any organization depends upon an efficient production plan. One of the key
essential of a production plan is material and resource requirement planning system. This
plays a pivotal role in assembly-line production. Material requirement planning is a system
based approach, which organizes all required production material. Material requirement
planning is an information system for production planners based on inventory
management. It generates various types of reports as its outputs that are of immense
significance for the production planners. The basic components of material planning are as
follows:
Material planning provides information that all the required raw material and products
are available for production.
Material planning ensures that inventory levels are maintained at its minimum levels.
Moreover, it ensures that material and product are available whenever production is
scheduled, therefore, helping in matching demand and supply.
Material planning provides information of production planning and scheduling but
also provides information around dispatch and stocking.
Objective of Material Requirement Planning
Material requirement planning is processed which production planning and inventory
control system, and its three objectives are as follows:
Primary objective is to ensure that material and components are available for
production, and final products are ready for dispatch.
Another primary objective is not only to maintain minimum inventory but also ensure
right quantity of material is available at the right time to produce right quantity of
final products.
Another primary objective is to ensure planning of all manufacturing processes, this
scheduling of different job works as to minimize or remove any kind of idle time for
machine and workers.
Material Requirement Planning - Inter dependency of Business Function
Material planning not only benefits operation department but is also beneficial to the other
department of organization. They are as follows:
Material planning is useful in determining cash flow requirement based on material
requirements and final dispatch schedules.
It helps procurement team in scheduling purchase of necessary material.
It helps the sales team in determining delivery dates for final products.
Implementation of Material Requirement Planning
Implementation and success of material resource planning dependent on following factors:
Acceptability of by top management about advantages and benefits
Proper training and participation of all workers and personnel
Precision and accuracy of input data for accurate and reliable results
Advantages of Material Requirement Planning
It helps in maintain minimum inventory levels.
With minimum inventory levels, material planning also reduces associated costs.
Material tracking becomes easy and ensures that economic order quantity is achieved
for all lot orders.
Material planning smoothens, capacity utilization and allocates correct time to
products as per demand forecast.
Disadvantages of Material Requirement Planning
Material planning is highly dependent on inputs it receives from other systems or
department. If input information is not correct than output for material planning will
also be incorrect.
Material planning requires maintenance of robust database with all information
pertaining inventory records, production schedule, etc. without which output again
would be incorrect.
Material planning system requires proper training for end users in order to get
maximum out of the system.
Material resource planning system requires substantial investment of time and capital.
Inventory Management in Planning and Control:
Inventory records are very important sources of information for the production planners.
As we know that inventory management plays a central role within supply-chain
management. They play a pivotal role in ensuring goods, and services are delivered on
time to customers. At the same time, inventory involves various cost, investment, space
management, etc. Also there are chances that stored inventory may get damaged or get
stolen adding to extra cost to the company. Therefore, it is important to have a robust
inventory management for an organization.
Inventory Holding:
For an organization, it becomes important to hold inventory for the following reason:
Inventory holding ensures that operation delay do not impact delivery to customers.
It also ensures that company can meet spikes or fluctuation in product demand.
It ensures that there is flexibility in production.
It ensures that any delay by suppliers do not affect working of the company.
Considering the above inventory holding objectives, next step for the company is to make
inventory related decision. Inventory decision involves two major considerations, first is
the order quantity of the raw material and second is timing for placing those orders.
Inventory Models:
Inventory management is based upon two basic models namely, independent demand
inventory model and dependent demand inventory model.
Independent Demand Inventory Model: talks about finished goods or raw material
demand which is dependent upon prevailing market conditions and is not correlated to
any raw material currently used by the organization. A finished good is an appropriate
example for independent demand inventory model.
Dependent Demand Inventory Model talks about raw material demand which are
integral parts of production and form important part of material resource planning. For
example, demand for raw material can be established as the basis of demand of
finished products.
Inventory Costs:
There are three broad categories of cost associated with inventory; holding cost, ordering
cost and set up cost.
Holding cost: is carrying cost associated with inventory over a period of time. They
include insurance, warehousing, interest, extra head-count, etc.
Ordering cost: is cost associated with purchasing of raw material and receiving raw
materials. They include forms, order processing, office maintenance supplies and staff
associated with ordering.
Set- up Cost: is cost associated with installation of machine for production. They
include clean- up cost, re-tooling cost and adjustment cost.
In nutshell, inventory management ensures that organizations are able to minimize cost
and maximize profit.
Summary:
For efficient, effective and economical operation in a manufacturing unit of an
organization, it is essential to integrate the production planning and control system.
Production planning and subsequent production control follow adaption of product design
and finalization of a production process.
Production planning and control address a fundamental problem of low productivity,
inventory management and resource utilization. Production planning is required for
scheduling, dispatch, inspection, quality management, inventory management, supply
management and equipment management. Production control ensures that production team
can achieve required production target, optimum utilization of resources, quality
management and cost savings. Planning and control is an essential ingredient for success
of an operation unit.
Keywords
Estimating: is a process of setting operation times after fixing standards both for
worker and machines
Loading: is the process of converting operation schedule into practices
Routing: is the process of determining the flow of work material handling in the
plant, and sequence of operations
Expediting: To speed up the work/inspection
Production control: Monitoring the plans and taking corrective actions in case of
deviations;
Batch Scheduling: Scheduling of different lots
Self-Assessment Questions
Discuss in detail the planning and control functions.
Explain the procedure followed in production planning and control.
Define route. Discuss the route sheet.
Discuss the characteristics, merits and limitations of material requirement planning.
Define inventory management. Discuss the various costs associated with an
inventory.
References
Chase, Jacob, Aquilano, Agarwal (2008), Operations Management for Competitive
Advantage, Tata McGraw-Hill
Krajewski, Ritzman, Malhotra (2007), Operations Management: Processes and Value
Chains, Prentice Hall
Heizer, Render, Jagadeesh (2009), Operations Management, Pearson Education, India
http://www.managementstudyguide.com/production-planning-and-control.htm
http://www.managementstudyguide.com/materials-and-resource-requirement-
planning.htm
********
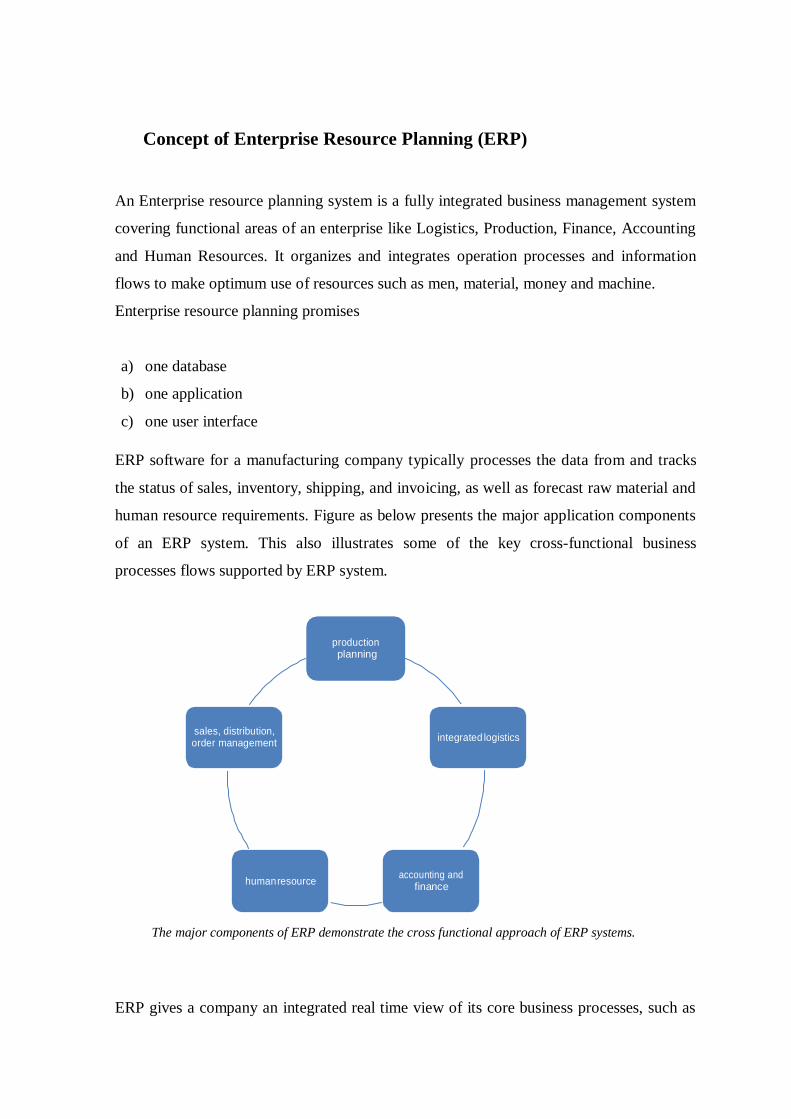
Concept of Enterprise Resource Planning (ERP)
An Enterprise resource planning system is a fully integrated business management system
covering functional areas of an enterprise like Logistics, Production, Finance, Accounting
and Human Resources. It organizes and integrates operation processes and information
flows to make optimum use of resources such as men, material, money and machine.
Enterprise resource planning promises
a) one database
b) one application
c) one user interface
ERP software for a manufacturing company typically processes the data from and tracks
the status of sales, inventory, shipping, and invoicing, as well as forecast raw material and
human resource requirements. Figure as below presents the major application components
of an ERP system. This also illustrates some of the key cross-functional business
processes flows supported by ERP system.
The major components of ERP demonstrate the cross functional approach of ERP systems.
ERP gives a company an integrated real time view of its core business processes, such as
production planning
sales, distribution, order management
integrated logistics
human resource accounting and
finance
production, order processing, and inventory management, tied together by the ERP
application software and a common database maintained by a database management
system. ERP system tracks business resources (such as cash, raw material, and production
capacity), and the status of commitments made by the business (such as customer orders,
purchasing orders, and employee payroll), no matter which department (manufacturing,
purchasing, sales, accounting, and so on) has entered the data into system.
ERP software suites typically consists of integrated modules of manufacturing,
distribution, sales, accounting, and human resource applications. Examples of
manufacturing processes supported are material requirement planning, production
planning, and capacity planning. Some of the sales and marketing processes supported by
ERP are sales analysis, sales planning, and pricing analysis, while typical distribution
applications include order management, purchasing, and logistics planning. ERP systems
support many vital human resource processes, from personnel requirements planning to
salary and benefits administration, and accomplish most required financial record-keeping
and managerial accounting applications.
Evolution of ERP:
In the ever-growing business environment, the following demands are placed on the
industry:
Aggressive cost control initiatives
Need to analyse costs/revenues on a product or customer basis
Flexibility to respond to changing business requirements
More informed management decision making
Changes in ways of doing business.
One or more applications and planning systems have been introduced into the business
world for crossing some of hurdles and achieving growth. They are as follows:
Management Information Systems (MIS)
Integrated Information Systems (IIS)
Executive Information Systems (EIS)
Corporate Information Systems (CIS)
Enterprise Wide Systems (EWS)
Material Resource Planning (MRP)
Manufacturing Resource Planning (MRP II)
Money Resource Planning (MRP III)
ERP has evolved from the system known as MRP II (Manufacturing Resource Planning)
system with the integration of information between Vendor, Customer and Manufacturer
using networks such as LAN, WAN and INTERNET etc.
MRP II system again evolved from MRP (Material Requirement Planning) system. MRP
is a technique that explodes the end product demands obtained from Master Production
Schedule (MPS) for the given product structure which is taken from Bill of Material
(BOM) into a schedule of planned orders considering the inventory in hand.
MRP II has a number of drawbacks as listed below:
The main problem is that it has not been able to effectively integrate the different
functional areas to share the resources effectively.
The traditional application systems, which the organizations generally employ, treat
each transaction separately.
They are built around the strong boundaries of specific functions that a specific
application is meant to cater.
For an ERP, it stops treating these transactions separately as stand-alone activities and
considers them to be the part of the inter-linked processes that make up the business.
Enabling Technologies:
It is not possible to think of an ERP system without sophisticated information
technology infrastructure.
It is said that, the earlier ERP systems were built only to work with huge mainframe
computers.
The new era of PC, advent of client server technology and scalable Relational
Database Management Systems (RDBMS)
Most of the ERP systems exploit the power of Three Tier Client Server Architecture.
The other important enabling technologies for ERP systems are Workflow, Work
group, Group Ware, Electronic Data Interchange (EDI), Internet, Intranet, Data
warehousing, etc.
ERP Characteristics:
Any system has to possess few key characteristics to qualify for a true ERP solution.
These features are as follows:
1) Flexibility: An ERP system should be flexible to respond to the changing needs of an
enterprise. The client server technology enables ERP to run across various database
back ends through Open Database Connectivity (ODBC).
2) Modular & Open: ERP system has to have open system architecture. This means
that any module can be interfaced or detached whenever required without affecting
the other modules. It should support multiple hardware platforms for the companies
having heterogeneous collection of systems. It must support some third party add-ons
also.
3) Comprehensive: It should be able to support variety of organizational functions and
must be suitable for a wide range of business organizations.
4) Beyond the Company: It should not be confined to the organizational boundaries,
rather support the on-line connectivity to the other business entities of the
organization.
5) Best Business Practices: It must have a collection of the best business processes
applicable worldwide. An ERP package imposes its own logic on a company‘s
strategy, culture and organization.
Features of ERP:
ERP provides multi-platform, multi-facility, multi-mode manufacturing, multi-
currency, multi-lingual facilities.
It supports strategic and business planning activities, operational planning and
execution activities, creation of Materials and Resources.
ERP covering all functional areas like manufacturing, selling and distribution,
payables, receivables, inventory, accounts, human resources, purchases etc.
ERP performs core activities and increases customer service, thereby augmenting the
corporate image.
ERP bridges the information gap across organisations.
ERP provides complete integration of systems not only across departments but also
across companies under the same management.
ERP is the solution for better project management.
ERP allows automatic introduction of the latest technologies like Electronic Fund
Transfer (EFT), Electronic Data Interchange (EDI), Internet, Intranet, Video
conferencing, E-Commerce etc.
ERP eliminates most business problems like material shortages, productivity
enhancements, customer service, cash management, inventory problems, quality
problems, prompt delivery etc.
ERP provides intelligent business tools like decision support system, Executive
information system, Data mining and easy working systems to enable better
decisions.
Need to Undertake ERP
In present era, each and every organization needs to undertake ERP system because of the
following reasons:
a) Integrate financial information: As the CEO tries to understand the company‘s
overall performance; he may find many different versions of the truth. ERP creates a
single version of the truth that cannot be questioned because everyone is using the
same system.
b) Integrate customer order information: ERP systems can become the place where
the customer order lives from the time a customer service representative receives it
until the loading dock ships the merchandise and finance sends an invoice. By having
this information in one software system companies can keep track of orders more
easily, and coordinate manufacturing, inventory and shipping among many different
locations simultaneously.
c) Standardise and speed up manufacturing processes: Manufacturing companies -
especially those with an appetite for mergers and acquisitions—often find that
multiple business units across the company make the same transaction / recording /
report using different methods and computer systems. ERP systems come with
standard methods for automating some of the steps of a manufacturing process.
d) Reduce inventory: ERP helps the manufacturing process flow more smoothly, and it
improves visibility of the order fulfilment process inside the company. That can lead
to reduced inventories of the materials used to make products (work-in-progress
inventory), and it can help users better plan deliveries to customers, reducing the
finished good inventory at the warehouses and shipping docks.
e) Standardise HR information: Especially in companies with multiple business units,
HR may not have a unified, simple method for tracking employees‘ time and
communicating with them about benefits and services. ERP can fix that.
Benefits of ERP:
Following are some of the benefits they achieved by implementing the ERP packages:
Gives Accounts Payable personnel increased control of invoicing and payment
processing and thereby boosting their productivity and eliminating their reliance on
computer personnel for these operations.
Reduce paper documents by providing on-line formats for quickly entering and
retrieving information.
Improves timeliness of information by permitting posting daily instead of monthly.
Greater accuracy of information with detailed content, better presentation, satisfactory
for the auditors.
Improved cost control.
Faster response and follow-.up on customers.
More efficient cash collection, say, material reduction in delay in payments by
customers.
Better monitoring and quicker resolution of queries.
Enables quick response to change in business operations and market conditions.
Helps to achieve competitive advantage by improving its business process.
Improves supply-demand linkage with remote locations and branches in different
countries.
Provides a unified customer database usable by all applications.
Improves International operations by supporting a variety of tax structures, invoicing
schemes, multiple currencies, multiple period accounting and languages.
Improves information access and management throughout the enterprise.
Provides solution for problems like Y2K and Single Monetary Unit (SMU) or Euro
Currency.
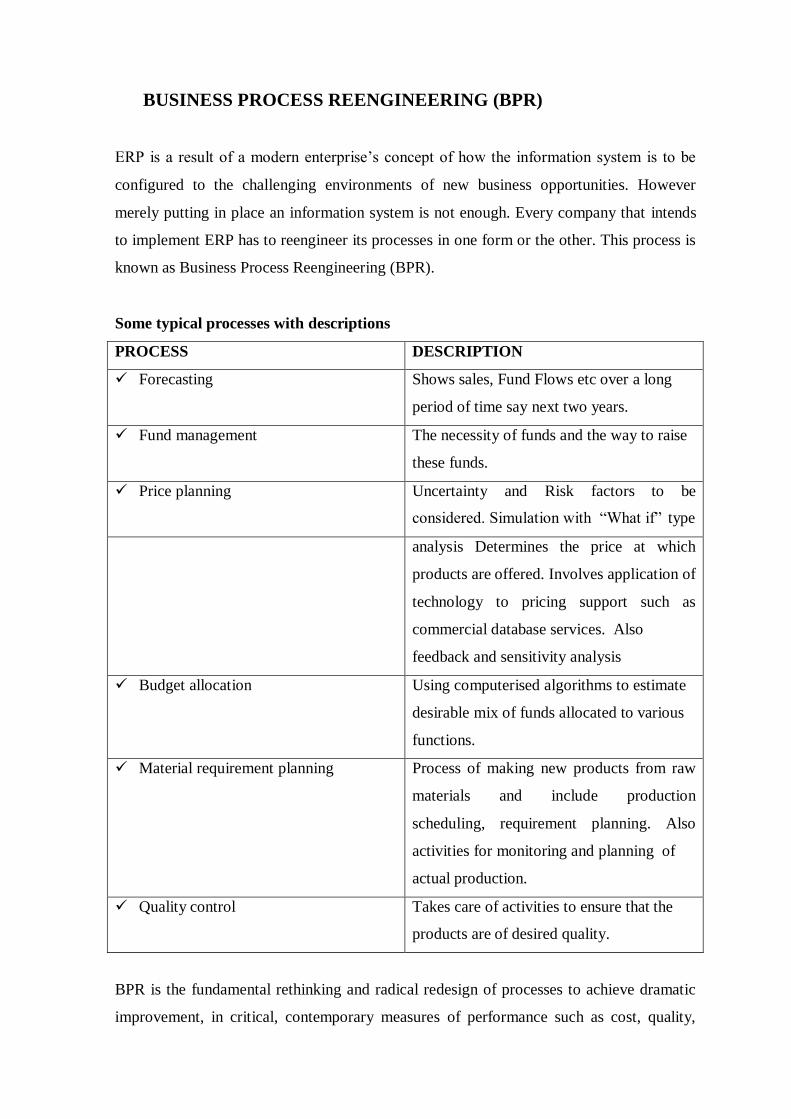
BUSINESS PROCESS REENGINEERING (BPR)
ERP is a result of a modern enterprise‘s concept of how the information system is to be
configured to the challenging environments of new business opportunities. However
merely putting in place an information system is not enough. Every company that intends
to implement ERP has to reengineer its processes in one form or the other. This process is
known as Business Process Reengineering (BPR).
Some typical processes with descriptions
PROCESS DESCRIPTION
Forecasting Shows sales, Fund Flows etc over a long
period of time say next two years.
Fund management The necessity of funds and the way to raise
these funds.
Price planning Uncertainty and Risk factors to be
considered. Simulation with ―What if‖ type
analysis Determines the price at which
products are offered. Involves application of
technology to pricing support such as
commercial database services. Also
feedback and sensitivity analysis
Budget allocation Using computerised algorithms to estimate
desirable mix of funds allocated to various
functions.
Material requirement planning Process of making new products from raw
materials and include production
scheduling, requirement planning. Also
activities for monitoring and planning of
actual production.
Quality control Takes care of activities to ensure that the
products are of desired quality.
BPR is the fundamental rethinking and radical redesign of processes to achieve dramatic
improvement, in critical, contemporary measures of performance such as cost, quality,
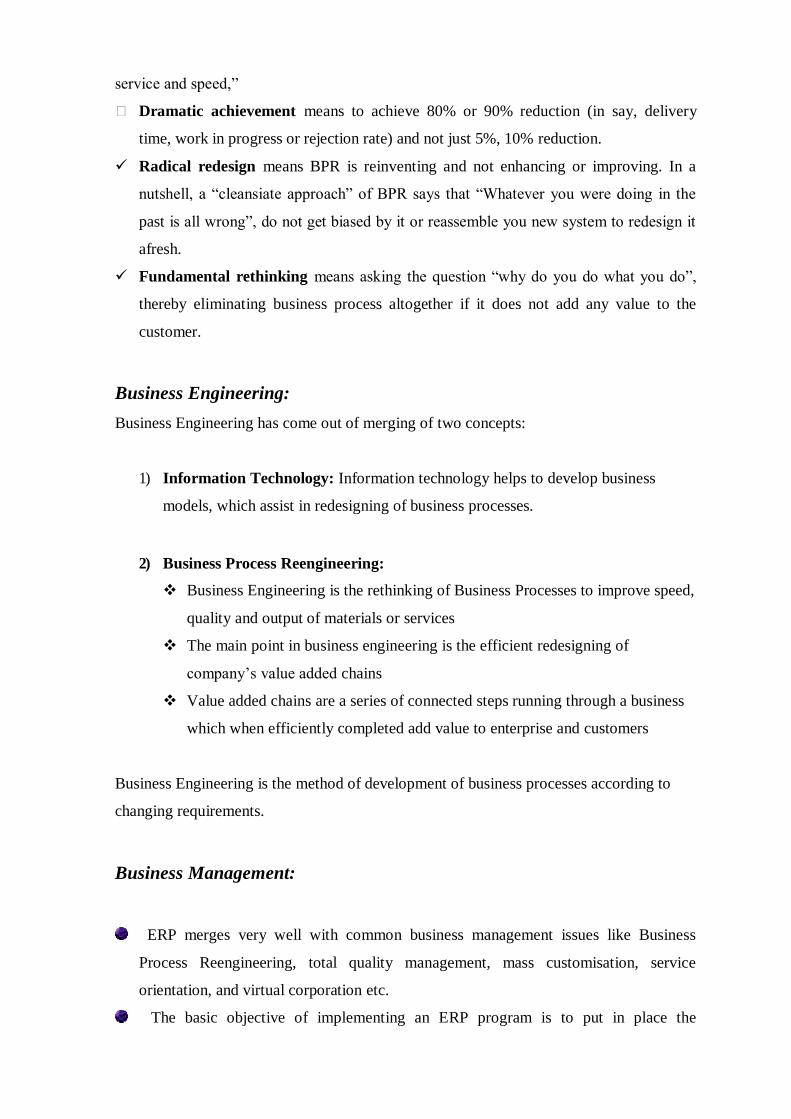
service and speed,‖
Dramatic achievement means to achieve 80% or 90% reduction (in say, delivery
time, work in progress or rejection rate) and not just 5%, 10% reduction.
Radical redesign means BPR is reinventing and not enhancing or improving. In a
nutshell, a ―cleansiate approach‖ of BPR says that ―Whatever you were doing in the
past is all wrong‖, do not get biased by it or reassemble you new system to redesign it
afresh.
Fundamental rethinking means asking the question ―why do you do what you do‖,
thereby eliminating business process altogether if it does not add any value to the
customer.
Business Engineering:
Business Engineering has come out of merging of two concepts:
1) Information Technology: Information technology helps to develop business
models, which assist in redesigning of business processes.
2) Business Process Reengineering:
Business Engineering is the rethinking of Business Processes to improve speed,
quality and output of materials or services
The main point in business engineering is the efficient redesigning of
company‘s value added chains
Value added chains are a series of connected steps running through a business
which when efficiently completed add value to enterprise and customers
Business Engineering is the method of development of business processes according to
changing requirements.
Business Management:
ERP merges very well with common business management issues like Business
Process Reengineering, total quality management, mass customisation, service
orientation, and virtual corporation etc.
The basic objective of implementing an ERP program is to put in place the
applications and infrastructure architecture that effectively and completely support the
Enterprise‘s business plan and business processes.
When an enterprise does not have optimized business processes, the ERP
implementation needs a process reengineering which enable to capture knowledge of
the experts into the system thus gaining considerable benefits in productivity.
The first step in implementation of ERP is the development of a business process
model showing business process as one large system and the interconnection and
sequence of business subsystems or processes that drive it.
First of all, a model consisting of core business processes or activities of the business is to
be developed. This is the diagrammatic representation of business as a large system with
interconnection of subsystems or processes that it comprises of. The Data model consists
of two elements:
o A diagram describing various Business processes and their interactions.
o An underlying Data Model.
Business modelling in practice:
Most of the ERP packages available today enable flow charting business processes
using standard flow chart symbols.
By connecting symbols used for users, events, tasks/functions, and other
organizational information, complex business information can be analysed.
For example SAP which is a popular ERP package uses event driven process chain
(EPC) methodology to model Business Process.
Business Modeling is the basis by which one can select and implement a suitable ERP
package.
ERP IMPLEMENTATION:
The success of an implementation mainly depends on how closely the implementation
consultants, users and vendors work together to achieve the overall objectives of the
organisation.
The implementation consultants have to understand the needs of the users, understand
the prevailing business realties and design the business solutions keeping in mind It is
the users who will be driving the implementation and therefore their all these factors
active involvement at all stages of implementation is vital for the overall success of
implementation.
It is worthwhile to remember that ERP is an enabling tool, which makes one do his
work better, which naturally needs additional efforts.
During the course of implementation the standard package may undergo changes
which may be a simple one or a major ‗functionality‘ change. Implementing such
changes is known as Customization.
The contents of the package are known as modules and the modules are further
divided into Components.
The roles and responsibilities of the employees have to be clearly identified,
understood and the employees will have to accept new processes and procedures
configured in the system laid down in the ERP system.
At the same time these processes and procedures have to be simple and user friendly.
A well-managed and implemented ERP package can give a 200 percent return on
investment where as a poorly implemented one can yield a return on investment as
low as 25 percent.
Key planning and implementation decisions: a number of the key decisions that need to
be made when this discussion looks at considering an enterprise integration effort. The
decision to implement an ERP should be based on a business case rational:
Technology justifications include the need to address the Y2K problem (in most
cases, this is no longer applicable), integrate the functions of disparate systems;
merge acquisitions with new capabilities such as web accessibility into the business
environment.
Process improvements address actions that result in personal and IT cost reductions.
Productivity improvements include the need to close the financial cycle and increase
the overall production from an enterprise standpoint.
Strategic considerations to implement new strategies not supported by the current
software improve customer service and satisfaction, respond to competitive
responsiveness.
Follow Software’s Processes or Customize?
This key decision may determine the success or failure of the ERP effort.
If the organization decides to follow the process of the software, this will result in the
organization following Best practices within its sector, thereby giving it a chance to
improve and standardize their processes.
However, this processes approach can create significant turmoil by requiring
employees to change their ways of doing business.
If the organization decides to stick with its current processes and customize the
software to fit these processes, the organization obviously will not have to experience
the pain and stress
However, it will be very costly to customize and maintained the software over time.
In-house or Outsource?
Outsourcing
IT has the advantage of allowing the organization to continue to focus on its core the
mission,
Avoid a relative substantial financial commitment (in some cases) and minimize
impact on the MIS department.
On the downside, providing opportunities to those external to the organization may
poorly impact employee morale and may give rise to security issues.
In-house
Implementation include: a better match between the software and the business,
applications optimized for the organization and better maintained security.
However, an in-house approach cannot be accomplished if there is a lack of internal
expertise and personnel to support such an effort.
“Big Bang” or Phased Implementation
A ―big bang‖ implementation involves having all modules at all location implemented
at the same time. Characteristics of this approach include no need for temporary
interfaces, limited requirement to maintain legacy software, cross-module
functionality and overall cost if no contingencies arise.
Phased implementation one or a group at a time, often a single location at a time.
Benefits of approach include: a smoothing of resource requirements, an ability to
focus on a particular module, avail-ability of existing legacy systems, as fall-back,
reduced risk, the knowledge gained with each phase and the usefulness of
demonstrable working system.
The wave approach: This approach involves the application of different waves of
change to different business units or regions.
Parallel implementation: This approach involves both ERP and an existing system
running together for a period of time.
Instant cutovers (flip-the-switch): This approach is lower in cost motivates users to
convert to the new system and reduces the need for redundant systems, however it
tends to be risky, stressful to users and requires a high level of contingency planning.
ERP Implementation Methodology:
Several steps are involved in the implementation of a typical ERP package:
1. Identifying the Needs: Some of the basic questions, which are to be answered, are
Why should an ERP package be implemented?
Will it improve profitability?
Can the delivery times of products be reduced?
How does it improve customer satisfaction in terms of quality, cost, delivery time
and service?
Will it help to reduce cost of products?
How can it help to increase business turnover and at the same time reduce
manpower?
Will it be possible to reengineer the business processes?
2. Evaluating the “AS IS” situation of the business:
To understand the present situation of the business, the various functions should first be
listed.
Total time taken by the business processes.
Number of decision points existing in the present scenario.
Number of Departments/Locations of businesses process.
The flow of information and its routing.
The number of reporting points currently available.
3. „Would Be‟ situation:
Deciding the desired ‗Would Be‘ situation: The concept of ‗Benchmarking‘ is used to see
that processes achieved are the best in industry. Benchmarking is done on various factors
like cost, quality, service etc. This concept enables to optimise the processes to gain
overall benefits.
4. Reengineering the business process: Reengineering of business processes is done to
Reduce the business process cycle time.
To reduce the number of decision points to a minimum.
Streamlining the flow of information and eliminating the unwanted flow of
information.
5. Evaluation of various ERP packages: Evaluation of ERP packages are done based on
the following criteria:-
Flexibility: It should enable organizations to respond quickly by leveraging changes to
their advantage, letting them concentrate on strategically expanding to address new
products and markets.
Comprehensive: It should be applicable across all sizes, functions and industries. It
should have in-depth features in accounting and controlling, production and materials
management, quality management and plant maintenance, sales and distribution, human
resources management and plant maintenance, sales and distribution, human resources
management, and project management.
Beyond the company: It should support and enable inter-enterprise business processes
with customers, suppliers, banks, government and business partners and create complete
logistical chains covering the entire route from supply to delivery, across multiple
geographies, currencies and country specific business rules.
Best business practices: The software should enable integration of all business operation
in an overall system for planning, controlling and monitoring and offer a choice of
multiple ready-made business processes including best business practices that reflect the
experiences, suggestions and requirements of leading companies across industries. In other
words, it should intrinsically have a rich wealth of business and organisational knowledge
base.
New technologies: It should incorporate cutting-edge and future-proof technologies such
as object orientation into product development and ensure inter-operability with the
Internet and other emerging technologies. It should be Y2K and Euro compliant, group up.
Other factors to be considered are:
• Global presence of package.
• Local presence.
• Market Targeted by the package.
• Price of the package.
• Obsolescence of package.
• Ease of implementation of package.
• Cost of implementation.
• Post-implementation support availability.
6. Finalisation of the ERP package: Finalisation of the ERP package can be done by
making a comparison of critical factors through a matrix analysis.
7. Installation of Hardware and Networks: This work is carried out in phased manner
depending on the schedule of implementation and need of the hardware components.
8. Finalising the Implementation Consultants: The factors of selection for consultants:
skill set
industry specific experience
cost of hiring consultants
9. Implementation of ERP package
formation of team
preparation of plan
mapping of business process to package
gap analysis
customization
development of user specific reports and transaction
uploading of data from existing system
test run
user training
Parallel run.
Concurrence from user
Migration to the new system
User documentation.
Post-implementation support.
System monitoring and fine tuning
Implementation Guidelines for ERP:
There are certain general guidelines, which are to be followed before starting the
implementation of an ERP package:
Understanding the corporate needs and culture of the organisation and then adopt the
implementation technique to match these factors.
Doing a business process redesign exercise prior to starting the implementation.
Establishing a good communication network across the organisation.
Providing a strong and effective leadership so that people down the line are well
motivated.
Finding an efficient and capable project manager
Creating a balanced team of implementation consultants who can work together as a
team.
Selecting a good implementation methodology with minimum customisation.
Training of end users.
Adapting the new system and mating the required changes in the working environment
to make effective use of the system in future.
POST- IMPLEMENTAION:
To start at the beginning, many post implementation problems can be traced to wrong
expectations and fears. The expectations and fear that corporate management have from an
ERP have been greatly published. Of course, some of the blame for this is on the ERP
vendors and their pre-implementation sales hype. A few of the popular expectations are:
An improvement in processes
Increased productivity on all fronts.
Total automation and disbanding of all manual processes.
Improvement of all key performance indicators.
Elimination of all manual record keeping.
Real time information systems available to concerned people on a need basis.
Total integration of all operations.
ERP implementation also causes a host of fears. Some of them are:
Job redundancy.
Loss of importance as information is no longer an individual prerogative.
Change in job profile.
An organizational fear of loss of proper control and authorization.
Increased stress caused by greater transparency.
Individual fear of loss of authority.
Balancing the expectations and fears is a very necessary part of the implementation
process.
RISK AND GOVERNANCE ISSUES IN AN ERP:
Organizations face several new business risks when they migrate to real-time, integrated
ERP systems. Those risks include:
a) Single point of failure: Since all the organization‘ data and transaction processing is
within one application system and transaction processing is within one application
system. Structural changes significant personnel and organizational structures changes
associates with reengineering or redesigning business processes.
b) Job role changes: transition of traditional user‘s roles to empowered-based roles with
much greater access to enterprises information in real time.
c) Online, real-time: An online real-time system environment requires a continuous
business environment capable of utilizing the new capabilities of the ERP application
and responding quickly to any problem requiring of re-entry of information.
d) Change management: It is challenging to embrace a tightly integrated environment
when different business processes have existed among business units for so long. The
level of user acceptance of the system has a significant influence on its success. Users
must understand that their actions or inaction have a direct impact upon other users
and, therefore, must learn to be more diligent and efficient in the performance of their
Day to day duties. Considerable training is therefore required for what is typically a
large number of users.
e) Distributed computing experience: Inexperience with implementing and managing
distributed computing technology may pose significant challenges.
f) Broad system access: Increased remote access by users and outsiders and high
integration among application functions allow increased access to application and data.
g) Dependency on external assistance: Organization accustomed to in-house legacy
systems may find they have to rely on external help. Unless such external assistance is
properly managed, it could introduce an element of security and resource management
risk that may expose the organizations to greater risk.
h) Program interfaces and data conversions: Extensive interfaces and data conversions
from legacy systems and other commercial software are often necessary. The
exposures of data integrity, security and capacity requirements for ERP are therefore
often much higher.
i) Audit expertise: Specialist expertise is required to effectively audit and control an
ERP environment. The relative complexity of ERP systems has created specialisation
such that each specialist may know only a relatively small fraction of the entire ERP‘s
functionality in a particular core module,
More recently, some of the additional risks and good governance issues introduced by the
enabled ERP environments concern:
1. Single sign on: It reduces the security administration effort associated with
administrating web-based access to multiple systems, but simultaneously introduces
additional risk in that an incorrect assignment of access may result in inappropriate
access to multiple systems.
2. Data content quality: As enterprise applications are opened to external suppliers and
customers, the need for integrity in enterprise data becomes paramount.
3. Privacy and confidentiality: Regularity and governance issues surrounding the
increased capture and visibility of personal information, i.e. spending habits.
Summary:
Enterprise Resource Planning (ERP) Systems are coherent and integrated software
applications that can support a large variety of operational processes and business
functions and a focal monitoring, control and coordination tool for all operations that take
place in the headquarters and the distinct remote locations of modern enterprises. Via
advanced database and communication technologies and sound coverage of diverse
business functions, ERP systems achieve data centralization, integration of business
software applications and business process redesign, all in the quest for process
optimization, productivity enhancements and gaining of competitive advantage through
innovative information technology. For the successful enterprises and organizations within
the Information and Knowledge Society, ERP Systems are the backbone transactional
information platforms that allow quick response to the challenges emanating from the
continuously evolving business landscape
Self-assessment Questions:
1. What is ERP?
2. Why implement ERP system in business firms?
3. What are the benefits of ERP?
4. What are the reasons of ERP failure?
5. What is ERP implementation strategy?
6. Discuss various risks and governance issues in implementation of ERP?
Keywords:
ERP: ERP has evolved from the system known as MRP II systems with the
integration of information between vendor, customer and manufacturer using network
such as LAN, WAN, and INTERNET etc.
MRP II: This again evolved from MRP system. MRP is a technique that explodes the
end product demands obtained from master production schedule of planned orders
considering the inventory in hand.
MRP: system provides reports such as MRP reports, planned order releases for
purchase orders, work orders, reschedules open orders report, firm planned reports,
shortage reports etc. MRP is considered as an important planning and manufacturing
control activity for materials.
RDBMS: It stands for scalable Relational Data Base management System that
contributes for the ease of deployment of ERP.
References:
1. Rouse, Margaret. "ERP (enterprise resource planning)". Tech Target. Retrieved July
14, 2015.
2. Bidgoli, Hossein, (2004). The Internet Encyclopaedia, Volume 1, John Wiley & Sons,
Inc. p. 707.
3. Shaul, L. and Tauber, D. 2012. CSFs along ERP life-cycle in SMEs: a field study.
Industrial Management & Data Systems, 112(3), 360-384.
4. Khosrow–Puor, Mehdi. (2006). Emerging Trends and Challenges in Information
Technology Management. Idea Group, Inc. p. 865.
5. "A Vision of Next Generation MRP II", Scenario S-300-339, Gartner Group, April
12, 1990
6. Anderegg, Travis. "MRP/MRPII/ERP/ERM — Confusing Terms and Definitions for a
Murkey Alphabet Soup". Retrieved September 23, 2013.
7. Sheilds, Mureell G. (2005). E-Business and ERP: Rapid Implementation and Project
Planning. John Wiley and Sons, Inc. p. 9.
********
Production Planning and Control Function
Introduction
In the previous chapter, an attempt has been made to give you an indepth understanding of
various types of production systems and the concept of production planning and control.
Fundamentally, production planning and control is viewed as a managerial function which
in turn becomes the nervous system of the production system. Its main objective is efficient
utilization of required material resources, people and facilities in any enterprise. This is
done through planning, coordinating and controlling all production activities which convert
the raw material resources into finished products or components in the most optimal
manner.
Broadly speaking, production Planning is a dynamic function which is largely concerned
with the issues like required production facilities, laying down these facilities and the
methods to utilize them in such a way that the desired output may be produced at the
desired rate and desired cost. Production plans need to be changed according to the changes
in circumstances.
On the other hand, production control is a mechanism to monitor the execution of the
production plans. It ensures that all production operations/activities take place strictly as per
the set plans. In case of any deviations, taking immediate corrective measures and
informing the planning section so that they may improve the future plans accordingly.
Production planning and control as a department plays a vital role in manufacturing
organizations. It coordinates with other departments and provides relevant information.
The stages in production planning and controls are:
1. Planning – choosing the best course of action among several alternatives.
2. Operation – execution as per plan.
3. Control – maintaining the performance by comparing the actual result with performance
standard set and taking appropriate corrections action if necessary to reduce variance.
In this chapter, a detailed discussion has been made pertaining to role of production
planning and control in manufacturing organization, changes in production planning and
control techniques on the basis of production system, its significance and benefits for the
organization, fundamental differences between production planning and production control
per the its benefits, constraints of production planning and control etc
Factors Determining Production Planning Procedures:
Production planning keeps varying from company to company. This begins with a product
idea, plan for design of the product and entire production/operating system to manufacture
that product. It also includes the task of planning for the manufacturing of modified version
of an existing product using the existing facilities. The main difference between the
planning procedures is one company and another is principally due to the difference in the
economic and technological conditions under which the companies operate. The main
factors affecting production planning procedures are summarized as below:
i) Production Volume
The purview of production planning in any organization mainly depends upon the
quantity/volume of output to be produced. Its main objective is to cut the manufacturing
cost. For instance, in case of custom order job shop, where volume of production is
generally less, the planning of production is limited to only purchase of the raw material/
component and determination of work centers, which have the capacity of manufacturing
the product.
ii) Nature of Production Process
Nature of manufacturing process is also an important factor that determines the intensity of
production planning in any organization. For example, in case of custom job shop, the
production planning may be informal and development of the work methods is left to
individual workman who is highly skilled. Whereas, in the high volume production, many
product engineers are involved who put enormous amount of effort in the designing the
product and manufacturing processes.
iii) Nature of operations
Nature of required operations is again very significant parameter that determines the scope
of production planning in any organization. For example, continuous production of any
single standardized that is characterized by repetitive operations, detailed production
planning is required.
There are mainly two types of manufacturing approach:
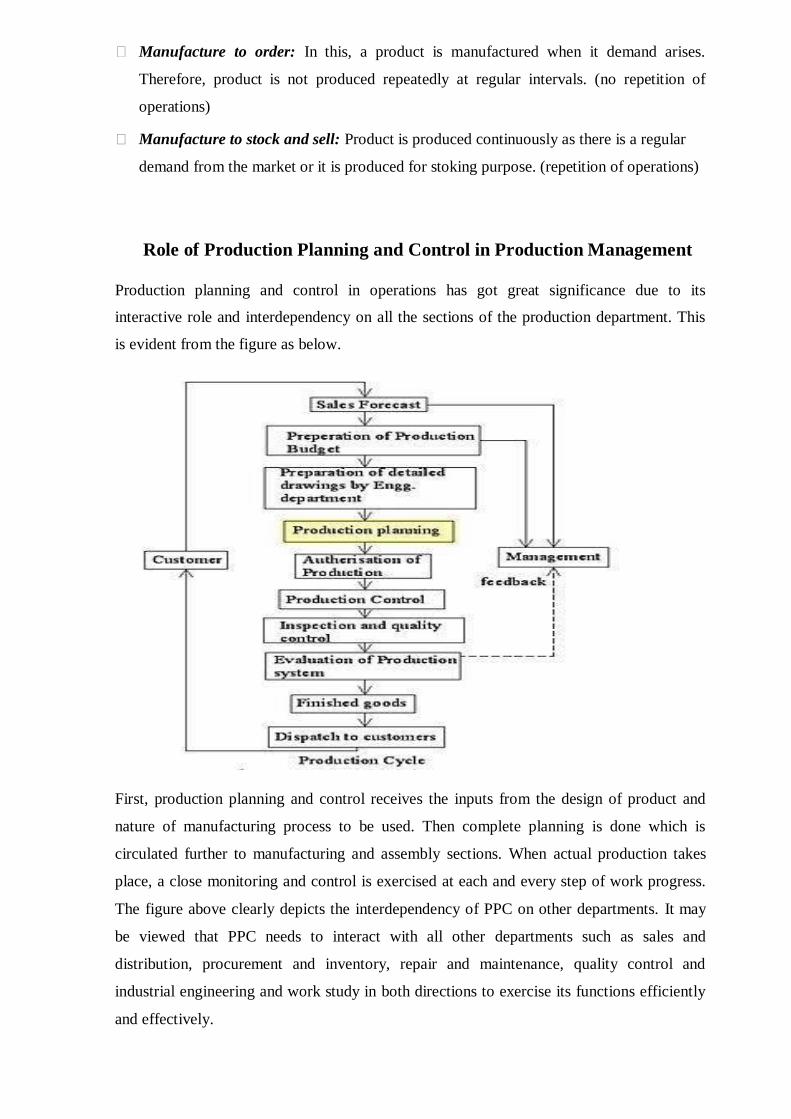
Manufacture to order: In this, a product is manufactured when it demand arises.
Therefore, product is not produced repeatedly at regular intervals. (no repetition of
operations)
Manufacture to stock and sell: Product is produced continuously as there is a regular
demand from the market or it is produced for stoking purpose. (repetition of operations)
Role of Production Planning and Control in Production Management
Production planning and control in operations has got great significance due to its
interactive role and interdependency on all the sections of the production department. This
is evident from the figure as below.
First, production planning and control receives the inputs from the design of product and
nature of manufacturing process to be used. Then complete planning is done which is
circulated further to manufacturing and assembly sections. When actual production takes
place, a close monitoring and control is exercised at each and every step of work progress.
The figure above clearly depicts the interdependency of PPC on other departments. It may
be viewed that PPC needs to interact with all other departments such as sales and
distribution, procurement and inventory, repair and maintenance, quality control and
industrial engineering and work study in both directions to exercise its functions efficiently
and effectively.
PPC requires a lot of documentation and paper work for the proper functioning of
production department. The main documents include demand forecast reports, customer‘s
orders, estimated sales figure, long term production plans for the current and new products,
production budget for each product, master production schedules for a given time, work
orders with production department, inventory reports, estimates of costs, various reports
from purchase department, job specifications, shortage reports and many more reports etc.
PPC is a complex phenomenon which becomes more and more complicated with the
growing number of products in company‘ product mix increase.
Shop Floor Production Planning and Control
Here, it is important to understand that the production planning is done at the highest level
considering the issues mainly including product design, job design process design,
equipment selection and replacement, labour skills and training programs, input material
selection including raw material and sub-contracting, plant selection and layout, scheduling
steps of the plan, implementing and controlling the schedule and choice of production
system etc.
Shop floor production planning is done at the bottom level (usually known as shop floor) by
the junior level people over a short range time span. It is concerned with the utilization of
existing facilities rather than creating new facilities. It involves proper utilization of key
resource such as raw materials, machine capacity, energy etc. Short-term planning takes
into account current customer order, priorities, material availability, absenteeism rate, cash
flows etc. and it is designed to respond quickly to change in production levels and market
conditions. Short range planning establishes short range schedule which specify the quantity
of specific product to be produce in each week of planning horizon which varies from
weeks to few months. Machine shop planning involves the day to day issues and decision
related to operations planning.
Difference between Production Planning and Production Control
The production planning and control essentially has two important functions namely
production planning and production control. They facilitate in effective production function.
These two functions are running parallel to each other. But they have very different scope
and nature. The difference are shown in below
Production Planning
Production planning is one part of production planning and control dealing with basic
concepts of what to produce, when to produce, how much to produce, etc. It involves taking
a long-term view at overall production planning. This can be done only after assessing the
customer demand for the product. Production planning focuses on the principle of meeting
the targeted customer demand rate in the most efficient way possible while keeping open
the capability to respond to variations in demand.
This assesses the requirement of different materials to fulfill your production target and
their availability. An efficient production planning keeps the minimum materials as standard
inventory. Planners must evaluate how much material the company needs, the lead times for
orders, the delivery times for suppliers and the reliability of the suppliers/vendors.
Production planners take into account the capabilities of the machines/ equipments used to
produce the output. Basic stability of an equipment is ascertained on the basis of three
parameters namely, its availability, its performance and its quality. This is done by Overall
Equipment Effectiveness (OEE). Manpower planning needs accurately estimating the
number of employees required to do the work. The capacity of the workforce must match
the capabilities of the equipment to plan for the highest efficiency. Planning for the
processes is done keeping in view that the processes continue to operate efficiently and
safely during the entire production time. Often the normal operations of a process require
occasional testing and adjustments. A final production planning puts in place controls that
detect problems as soon as they occur. When controls are in place, it enables to take
possible corrective actions to minimize the effects and return production to the required
levels.
Hence, the main objectives of production planning may be summarized as below:
To ensure right quantity and quality of raw material, equipment, etc. are available
during times of production;
To ensure capacity utilization is in tune with forecast demand at all the time;
To streamline the overall production process;
To ensure the timely and regular delivery of the product;
To provide advance information to vendors/ suppliers about the requirement of different
types of raw materials and components;
To reduce investments in inventory;
To reduce overall production cost by driving in efficiency.
This is important to notice that the production planning is concerned with two basic
strategies‘ product planning and process planning. Production planning is done at three
different time dependent levels i.e. long-range planning dealing with facility planning,
capital investment, location planning, etc.; medium-range planning deals with demand
forecast and capacity planning and lastly short term planning dealing with day to day
operations often termed as shop floor planning. We have already discussed shop floor
planning in the previous section.
Production Control
In literary sense control means action to check/regulate. According to Mary Gushing Niles,
―Control is maintaining a balance in activities towards a goal or set of goals evolved during
production planning.‖ Planning only outlines some course of action whereas control is an
execution process involving standardization, evaluation and corrective functions.
As per Fayol, ―Control consists in verifying whether everything occurs in conformity with
the adopted plan and established principles. The objective of control is to point out
weaknesses and shortcomings, if any, in order to rectify them and prevent recurrence. It
operates on everything viz. material, equipment, men, operations etc. For control to be
effective, it must be applied within reasonable time and be followed-up sanctions.‖
Therefore, production control may be understood as a scientific procedure that regulates an
orderly flow of material and co-ordinate various production operations to achieve the
objective of producing desired item in right quantity of desired quality at the required time
by the best and the cheapest method i.e., to attain highest efficiency in production.
Alternately, production control is the function of management which plans, directs and
controls the material supply and processing activities of an enterprise; so that specified
products are produced by specified methods to meet an approved sales programme. It
ensures that the activities are carried in such a way that the available labour and capital are
used in the best possible way.
Need of Production Control in Manufacturing Organizations:
Production system of a manufacturing unit comprises of man, machine, equipments, labour
etc which are put together at a given time. Their arrangement is mainly governed by
conditions imposed by the required operations. One must remember that it is not possible
for a production planner to control the inputs. In fact, planner makes an attempt to control
the output so that it is in conformity with the target set by the marketing department.
Briefly, we can say that production control attempts to streamline the complete process so
that goods and services are produced as per the requirements of the customers, i.e., of right
quality, quantity at the desired time.
In the present severe competition, it goes without saying that production control has become
the hallmark of production efficiency. It is a necessity and not a luxury but a profitable
investment. This is a boon for a firm which attempts to take corrective measures whenever
there is some deviation from the planned strategy. The success of an enterprise greatly
depends on the performance of its production control department. Production control looks
to utilize different type of control techniques to achieve optimum performance out of the
production system as to achieve overall production planning targets.
The main functions of production control are discussed as below:
To make provisions for raw material, equipment, machines and labour;
To organize production schedule in conformity with the demand forecast;
To utilize resources in the best possible manner so that the cost of production is
minimized and delivery date is maintained;
To determine economic production runs with a view to reduce setup costs;
To ensure proper co-ordination of the operations of various sections/departments
responsible for production;
To ensure regular and timely supply of raw material at the desired place and of
prescribed quality and quantity to avoid delays in production;
To perform inspection of semi-finished and finished goods and use quality control
techniques to ascertain that the produced items are of required specifications;
To decide the product design and development.
Factors Determining Production Control Operations
It is necessary to understand that production control cannot be same across all the
organization. This varies from organization to organizations. Production control mainly
depends upon following factors:
a) Nature of Production: In case of continuous production, production control becomes
very easy due to fixed process. But for the job type production, where process changes
on the basis of every order, control becomes very complicated.
b) Nature of operations: In different manufacturing firms, the operations are reasonably
varied in terms of nature, sequence and duration. Hence the control procedure also
needs lot of continuous changes accordingly.
c) Magnitude of operations: the centralized controlling system provides the most effective
coordination to the organization but when the organization starts to increase in terms of
size then there is the requirement of decentralization of the production and the control
functions. The degree of decentralization totally depends upon the scope of operations.
Hence, we can say that production planning and production control both are essential for
customer delight and overall success of an organization.
Importance of Production Planning and Control
An efficient production planning and control system provides better and more economic
goods to the customers with lower amount of the investment for the organization. This is
vital for all the production plants. Its importance can be explained by the following points:
Improved customer service: The production planning and controlling uses the proper
instrument of scheduling and expediting of work, which provides better services to
customers in the form of better quality of goods at reasonable prices at pre decided
delivery dates. It improves relations with customers and helps to achieve profitable re-
order.
No pendency of order: By effective production planning and control operations move
smoothly as per planning and in conformity with the required delivery dates. it leads to
fewer rush orders and less overtime.
Improved inventory control: PPC assists in maintaining inventory at optimum levels
which minimizes investment in inventory. It requires lower work-in-progress. PPC
provides better control over raw-material inventory.
Efficient utilization of facilities: PPC helps in the most effective use of equipment. It
updates the management on a regular basis for the latest position of all orders in process
equipment and personnel requirements. Also, unnecessary purchases of equipment and
materials can be avoided with the help of PPC. Thus it ensures proper utilization of
equipment and other resources.
Curtailing idle times: PPC can reduce idle time, i.e. wastage of time by workers
waiting for materials and other facilities because PPC ensures that all required materials
and other facilities are available at the required time.
Congenial working environment: As the production planning and control system
coordinates with all departments involved, it maintains a healthy working environment
which improves morale.
Better reputation: An effective production planning and controlling system leads to
systematized operations in an organization. Thus an organization can meet its orders in
time resulting in the satisfaction of its customers, increased sales, increased profit, and
industrial harmony, and developing a better reputation of the organization.
Curtailing investment: In PPC, everything is planned well in advanced of operations.
Thus, inputs can be made available early, which avoids any bottleneck. So it helps in
minimizing capital investment in equipment and inventories.
Production Planning and Control in Different Production System
Production planning and control (PPC) for different types of system has been explained in
detail as below:
(1) PPC in Mass Production
The mass production rests on the concept of the assembly line. In this, the entire process is
sub divided into small components and afterwards they are grouped to follow production
procedures. Assembly line ensures that available labour force and machines/ equipments are
arranged in a sequential manner. In this, pre-determined task is completed at each
workstation and then materials transmit continuously at a constant average rate (cycle time)
to another work station. At different work stations, a certain portion of work is done. This
system is very effective in case of production of large quantities like toys, automobiles,
television, and computers.
PPC in mass production becomes very easy in view of the followings:
1. Material handling is very convenient and efficient.
2. Since the process is very well defined and easy, no specialization required
3. Well defined arrangement of machines and labour
4. No frequent changeovers in assembly line
5. It ensures high production rate.
6. The cycle time once fixed, remains same for a specific product
Drawbacks of Mass Production:
1. Each and every machine must function properly otherwise entire production brings to
an end.
2. Assembly line is unique and completely inflexible setup.
3. Assembly line installations are capital-intensive due to types of machines.
(2) PPC in Job Production
Unlike mass production, job production deals with different types of jobs. Various jobs are
performed with specific set of operations and particular time duration for each operation.
The available labour and equipments are divided for use in different departments. The
requirement of each machine is different based on the operation to be performed for a
particular job. The job shop is similar to waiting line system because when a job is finished
from one machine, it needs to wait in line for the next machine having earlier jobs in line
too. Sometimes, the machines also wait for jobs while running ideally, thus a proper system
of planning and control is a must for the job shop production.
PPC becomes very complex in case of job production because of the followings:
1. Very frequent changeovers in production setup
2. Very frequent changes in sequencing and prioritizing to prevent wastage
3. An appropriate scheduling needs to be done according to the estimated time taken by
each job.
4. Loading needs to be adjusted according to job
PPC in Job production may be understood well by the following cases:
Case 1
In this, a number of jobs are performed by single machine. In such a case, prioritizing and
scheduling become very critical as the jobs have to wait in line to be completed. Its purpose
is to improve the average idle time, waiting time, and the work in process time. The shortest
processing time (SPT) is aimed for in a job shop production.
Case 2
In this, a number of jobs are performed by two machines M1 and M2. The processing time
on both the machines is determined. The minimum time to complete a job is also estimated.
Now a sequence is worked out to line jobs on both the machines for the target of maximum
production in minimum time.
Prioritizing rules for job shops
The job which has the shortest processing time (SPT) is chosen. In such a case, one can also
put the job which has the earliest delivery due date first in line. First come first serve rule
may be applied. It depends on the manufacturer‘s priorities and the master production
schedule.
Job shop productions include paint shops, machine tool factories and specialty restaurants.
(3) PPC in Batch Production
Batch production is used when one needs to produce a large number of products but in
small quantities. It is more appropriate for the small scale firms where often, the product is
produced in smaller quantities but in different variants. The lot size or batch size is fixed
keeping view the economic factor. It means that the best batch size keeps the total cost to a
minimum while maintaining the high demand. Production should be such that all the
different varieties of the product can be sold simultaneously. Batch size mainly depends on
the 1) set-up cost and 2) carrying cost.
In batch production, a process layout is required. Similar machines are grouped into various
departments. All processes follow their own routes.
The complexity of PPC in batch production may be understood by the followings:
1. Materials handling is slow, time consuming and costlier because of the interruptive
flow of material.
2. More elaborative production planning and control is required.
3. Work-in-process needs more capital and space.
4. More skilled workers are required.
Constraints of Production Planning and Control
The Production planning and control functions are carried out under following constraints
and limitations:
PPC is a time consuming activity, particularly for the complex production mix as well
as depends on having a large number of components and parts because of difficulty in
carrying out routing, scheduling and loading functions;
PPC is based on certain given conditions and assumptions and depends on uncertain
demand forecast. Therefore, working becomes erroneous many times;
Production capacity, quality of materials, availability of materials and power, level of
skill of manpower, managing PPC are the main constraints for effective functions of
PPC.
Plans, checks and controls are the integral parts of the PPC which are often protested
by the workers and sometimes even by supervisors;
Business environment plays a dominant role in PPC. Because of its dynamic nature, it
makes very difficult to manage PPC in case of changes in technology, customers
demand and tastes, government policy, etc.
Summary
Briefly, production Planning is a dynamic function which is largely concerned with the
issues like required production facilities, laying down these facilities and the methods to
utilize them in such a way that the desired output may be produced at the desired rate and
desired cost. Production plans need to be changed according to the changes in
circumstances.
On the other hand, production control is a mechanism to monitor the execution of the
production plans. It ensures that all production operations/activities take place strictly as per
the set plans. In case of any deviations, taking immediate corrective measures and
informing the planning section so that they may improve the future plans accordingly.
Production planning and control as a department plays a vital role in manufacturing
organizations. It coordinates with other departments and provides relevant information.
Importance of production planning and control better service to customers, fewer rush
orders, better control of inventory, more effective use of equipment, reduced idle time,
improved plant morale, good public images, lower capital requirements.
There are many factors which affect PPC in an organization. It needs to be changed as per
the volume of production, type of production system used and variety of product. At present
PPC have become a necessity and not a luxury. This is a wise investment to accomplish the
goals in the most optimum manner. Like others, PPC is also not without the limitations. It
has to work under certain constraints and limitations.
Self assessment Questions
1. Explain the concept of production planning and control. Discuss its main functions?
2. What do you mean by production control? Discuss its objectives?
3. Differentiate between production planning and production control?
4. Discuss the role of production control system in enhancing the efficiency of production
function?
5. ―PPC is a non-tangible function and is very difficult to measure its efficiency.‖ Justify
the statement?
Keywords
Dispatching: Estimating the value of the product
Expediting: To speed up the work/inspection
Production control: Monitoring the plans and taking corrective actions in case of
deviations;
Batch Scheduling: Scheduling of different lots
Routing: To fix the routes/paths of various operations
References
Chase, R.B, Aquilano, N.J., and Jacobs, F,R., Production and Operations management:
Manufacturing and Services. Tata McGraw-Hill
Chopra, S. and Meindl, p., Supply Chain Management: Prentice Hall Delhi.
Krajewski, L. J. and Ritzman, L.P., Operations Management: Strategy and Analysis, 5th
ed, Addison Wesley.
****