lecturenotes-turbulencemodeling
DESCRIPTION
turbulence modelingTRANSCRIPT

1
RANS TURBULENCE MODELS
1. Introduction
The Navier-Stokes equations can be used to describe a turbulent flow, but such a flow
contains a wealth of small scale structures so resolving all scales in space and time (Direct
Numerical Simulation, DNS) is extremely expensive. Even the option to resolve only the
large (energy-bearing) eddies and modelling the small (more isotropic) scales (Large Eddy
Simulation, LES) is generally not very realistic for analysis of many engineering problems,
again due to the high required computer storage and speed. Note that LES, similarly to DNS,
requires an application of three-dimensional geometries and advancement of the solution in
time. Moreover, from a practical point of view, a mean flow characteristics are often
sufficient for design purposes. This means that if DNS or LES are used, the result is
subsequently averaged statistically. In the Reynolds averaging of the Navier-Stokes equations
(RANS), the equations are averaged statistically before solving them. The price which one has
to be pay for this is that some unknown terms, which result form averaging, have to be
modelled. This is why the RANS methods have some limitations with respect to accuracy due
to the fact that the proposed closure terms cannot be very general. But the application of the
RANS models is the cheapest option with respect to computational time for modelling of the
turbulent flows.
1.2. Time-averaging
For simplicity, the discussion of the RANS-based models is limited here to the constant-
density (incompressible) fluids. A linear relationship is assumed between the components of
the stress and deformation tensors. An extension to compressible fluids is straightforward and
can be found in many textbooks (see for instance Wilcox, 2006, 2008). In case of
compressible fluid one has to apply the Favre-averaging (density-based averaging) instead of
mentioned Reynolds-averaging to allow for some simplifications in the mass and momentum
conservation equations.
The instantaneous velocity component )t,(ui x can be written as the sum of a mean )(u i x
and a fluctuating part )t,(ui x
(fig. 1):
t,uut,u iii xxx (1.1)
where the mean velocity is defined as the time-averaged value

2
Fig. 1 Decomposition of the signal in mean and fluctuating components.
Tt
t
iT
i dtt,uT
1limu xx (1.2)
T is the averaging time interval. We assume that T. This corresponds to the steady RANS
model. For time-accurate RANS (called URANS) this time interval has to be sufficiently
large with respect to the time scale T1 of the turbulent fluctuations (fig. 2) and small with
respect to the time scale T2 of large scale unsteadiness. So for time-accurate RANS Eq. (1.2)
takes the form:
Tt
t
ii dtt,uT
1t,u xx
Fig. 2 Time-averaging windows. T1 – time scale of turbulent fluctuations, T2 – time scale of
unsteady motion. The time-averaging window T should be: T1 < T < T2

3
Two useful properties are (steady RANS):
- the time-average of a time-averaged value is again the same value (the averaged value
)(u i x is not a function of time)
Tt
t
i
Tt
t
i
Ti
T)(udt
T
ulimdtu
T
1limu
ix
xxx (1.3)
- and that the time-averaged value of the fluctuating part is zero
Tt
t
iiiiT
i 0u)(udt]u)t,(u[T
1limu xxxxx (1.4)
The other averaging properties are listed below for arbitrary quantities , and :
(1.5)
ii xx
(1.6)
(1.7)
(1.8)
0 (1.9)
0 (1.10)
0 (1.11)
The Reynolds-averaging is linear (1.5) and it commutes with the space derivatives (1.6).
Relations (1.7) and (1.8) come from the property (1.3). With (1.9) and (1.10) we take
advantage of the observation that the product of mean and fluctuating quantity is zero because
the mean of the latter is zero. The quantities and are correlated. It means the average of
their product is not zero (Eq. 1.11).
For incompressible fluid the conservation of mass and momentum equations are

4
0x
u
i
i
ji
jij
jii S2xx
p1
x
uu
t
u
(1.12)
(1.13)
where is the fluid density, is the dynamic molecular viscosity, p is the pressure and Sij is
the strain-rate tensor Sij=1/2(ui/xj+uj/xi).
First, we average the continuity equation (1.12). Taking the property (1.16) we obtain:
.x
u
x
u
i
i
i
i
(1.14)
Next we average the momentum equations (1.13).
ji
jij
jii S2xx
p1
x
uu
t
u
Using the property (1.15) we obtain
ji
jij
jii S2xx
p1
x
uu
t
u
(1.15)
Here we assume that the time-averaging commutes with the local time derivative. We can see
from figure 1 that for T
the time-derivative of the mean velocity is zero
0t
u
t
u ii
(1.16)
The convective derivative deserves attention. We average the product of ui and uj:
(1.17)
The second and third term on r.h.s. of eq. (1.17) cancels out (property 1.19). The last term is
nonzero because there is some correlation between iu and ju fluctuating velocity
components. So using property (1.7) we obtain:
(1.18)
Figure 3 shows the momentum exchange process in the shear layers of the plane jet at
Re=20000. This example is used to illustrate a correlation between u’ and v’ fluctuating
velocity components. Let us assume that the red fluid element (located on line R) is shifted to
jijijijijjiiji uuuuuuuuuuuuuu
jijiji uuuuuu

5
the left. This shift is visible by negative u’ fluctuating velocity component (see the coordinate
system). Since the red fluid element is moving from the high mean velocity zone VR to the
small mean velocity zone VL this transfer generates the positive v’ fluctuating velocity (v’=V-
current-Vnext=VR-VL, v’>0). The product of these two fluctuations is negative u’v’<0. The time-
averaged product of u’ and v’ is shown in fig. 3 (bottom). This is the turbulent shear stress
profile yxxy uu . We clearly see that the negative u’ fluctuation generates the positive v’
fluctuation.
The momentum exchange process can also be realized the other way around, so from left
to right (see blue fluid element located on line L). This is due to the fact that formation of the
shear layer is typically related to evolution (in space and time) of the coherent vortex
structures which subsequently breakdown into smaller forms. It means that at one time instant
there is a momentum exchange from right to left. But at the other time instance there might be
the momentum exchange from left to right. Let us, therefore, assume that the fluid element is
shifted from left to right (blue contour). This shift results in positive u’ fluctuating velocity.
Since the blue fluid element is moving from the low mean velocity zone VL to the high mean
velocity zone VR this transfer generates the negative v’ fluctuating velocity (v’=Vcurrent-
Vnext=VL-VR, v’<0). The product of these two fluctuating velocities is, again, negative
u’v’<0. It means that it leads to generation of the negative shear stress (fig. 3 bottom).
The Reader can perform a similar analysis for the right part of fig. 3. The result of this
analysis will be a formation of the positive shear stress profile (fig. 3, bottom). The sign
depends on the coordinate system. In both cases the net effect is the momentum transfer from
the mean flow to the fluctuating flow (resulting in increased turbulent shear stress). But the
most important remark is that in turbulent flow the momentum exchange in one flow direction
causes the momentum exchange in the other flow directions (flow is three dimensional). So
there is some correlation between both ui’ and uj’ fluctuating components. This results in the
shear stress tensor (Eq. 1.18).
Going back to the time-averaging. The terms on r.h.s. of equation (1.15) can be easily
averaged:
ii x
p1
x
p1
ji
j
ji
j
S2x
S2x
(1.19)
Finally, we obtain the Reynolds-Averaged Navier-Stokes (RANS) equations (eq. 1.14, 1.18,
1.19):
0x
u
i
i
ijji
jij
ijuuS2
xx
p1
x
)uu(
(1.20)
(1.21)
where

6
i
j
j
iij
x
u
x
u
2
1S
(1.22)
The last term on r.h.s of Eq. (1.21) is the Reynolds-stress tensor. The components of the
Reynolds –stress tensor are denoted by jiij uu .This term requires closure model (see
below).
Fig. 3. Momentum exchange in the shear layers of the plane jet. Mean V velocity component
(top) and the shear stress profile (bottom).
X
Y
u’>0
u’<0
L R
v’>0
v’<0

7
2. Closure of the RANS equations and turbulence models
2.1. Exact Reynolds-stress transport equations
If we denote by N(ui) the Navier-Stokes operator:
0xx
u
x
p1
x
uu
t
u)u(N
kk
i
2
ij
ik
ii
(2.1)
We can obtain the exact Reynolds-stress transport equation, by multiplying the momentum
equation (2.1) by fluctuating quantity ju
and adding to this term a similar term with the
indexes interchanged and averaging. The following transport equation is obtained (Wilcox,
2006):
.up1
up1
uuuxx
x
u
x
up
1
x
u
x
u2
x
u
x
u
xu
t
ikjjkikji
k
ij
k
i
j
j
i
k
j
k
i
k
i
jk
k
j
ik
k
ijk
ij
(2.2)
Derivation of Eq. (2.2) is show in Appendix A.
The physical meaning of the terms on r.h.s. of Eq. (2.2) can be described as follows:
- Production (first and second term). Turbulent stresses are generated at the expense of mean
flow energy by mean flow deformation. This term does not need any closure.
- The third term represents the stress dissipation which mainly occurs at the smallest scales (it
should be modelled).
- Pressure fluctuations (fourth term) redistribute the turbulent stress among components to
make turbulence more isotropic.
- Transport term (last term in Eq. 2.2). This term consists of several parts (in square bracket):
First term is the transport term and it is called the molecular diffusion.
Second, there is the turbulent diffusion term (transport through velocity fluctuations). A
closure model is necessary for this term.
A third and fourth part of the transport term is the pressure transport. This term also needs
closure model.

8
2.2 Transport equation for turbulent kinetic energy
An exact equation for the turbulent kinetic energy follows from the equations for the
Reynolds stress components (2.2) by contraction trough putting j = i and making the sum over
i = 1,2,3:
(2.3)
We take advantage of the continuity equation for the fluctuating velocity components.
(2.4)
which means that for an incompressible fluid studied here the pressure strain-rate term cancels
out in Eq. (2.3). We define the turbulent kinetic energy as:
(2.5)
Next, by inserting Eq. (2.5) to Eq. (2.2) we obtain an exact equation for the turbulent kinetic
energy
(2.6)
In Eq. (2.6) the first term on r.h.s describes production of the turbulent kinetic energy. This
term is modeled using the Boussinesq hypothesis:
ikiktik k3
2S2
(2.7)
We later write the production term as ikiktkiktk SS2x/uS2Pi
. t in Eq. (2.7)
denotes the turbulent viscosity (see discussion below).
The second term on r.h.s. of eq. (2.6) represents dissipation of the turbulent kinetic energy

9
(2.8)
In the frame of the two-equation models discussed here the field of the dissipation rate (2.8)
is obtained by solving an additional transport equation (discussion below).
The second and third term in brackets describe the turbulent transport process by velocity
fluctuations and the fluctuating pressure–velocity induced diffusion. Both terms are modeled
using the gradient hypothesis:
(2.9)
where k is a certain constant. Finally, the transport equation for the turbulent kinetic energy
reads:
(2.10)
We still need to propose the closure for the first and second term on r.h.s. of eq. (2.10).
2.3 Dissipation of the turbulent kinetic energy
An exact equation for dissipation of the turbulent kinetic energy can be derived in a similar
way as it was done for the Reynolds-stress transport equation (2.2). One can define the
following moment:
0)u(Nxx
u2 i
jj
i
(2.11)
where N(ui) denotes the Navier-Stokes operator given by eq. (2.1). After much algebra the
exact equation for can be derived (see for instance Wilcox, 2006). We have to stress that the
equation obtained in such way is much more complicated than the equation for k and contains
many more terms that need modelling. By some modellers, the derivation of the exact
equation for is considered as an unnecessary task for 2 reasons. The first is that the exact
equation for concerns the dissipation at the small scales, while the meaning of in Eq (2.10)
is more the rate of transfer at the largest scales. The second argument is that anyhow, we want
to arrive at a model equation containing a convective term, a diffusive term, a production term
and a dissipation term.

10
2.4. The expression for the eddy viscosity
The eddy viscosity concept means that if some of the scales in the turbulent motion are
filtered away, that the effect of these scales on the remaining motion is felt as an increased
viscosity. So, say that we filter away velocity scales smaller than a cut-off length scale Lc,
corresponding to the wavenumber κ larger than κc in Figure 3. The spectrum that is filtered
away, is then characterised by and Lc, where we can replace the length Lc with the kinetic
energy kc in the spectrum that is filtered away. So, if we accept that the only parameters that
characterise the filtering operation are and Lc, on dimensional grounds, the relations are
3/2
c
3/2
c
3/4
c
3/1
t Lk,L
(2.12)
Moreover, we note that at sufficiently high Reynolds number the scales Lc are much bigger
than the dissipative Kolmogorov scales L:
3/ 4
1/ 4L
(2.13)
Otherwise, there should also be influence from the molecular viscosity .
So, we can suggest as expressions:
2
ct
3/4
c
3/1
et
kCor,LC
(2.14)
where the factors Ce and C still have to be determined.
The second term in Eq. (2.14) can be obtained assuming the energy transfer in the inertial
range (valid between κe and κc in fig. 4):
2/3 5/3
KE( ) C
(2.15)
where κ denotes the wavenumber (κ = π/L). CK is the Kolmogorov constant (CK=1.4-1.5).
Taking the definition of modeled (subgrid) kinetic energy kc
dEk
c
c
We obtain after integration
3/2
c
3/23/2kc L
2
C3k
(2.16)
Inserting the length scale Lc form Eq. (2.16) to Eq. (2.14) we obtain (De Langhe, 2005).

11
2
c
2
c
3
kt
kC
k
2
C3
(2.17)
Note that Ce=(3Ck/2)-1
-4/3. It gives C0.1. The turbulent viscosity given by (2.17)
corresponds to filtering away only the small scales which belong to the inertial range of the
energy spectrum. Relation (2.17) is therefore well suited for construction of LES model. If
we eliminate all the turbulent motions from the flow field, as we do in RANS, the turbulent
viscosity can be written by
2
t
kC
(2.18)
where k is the turbulent kinetic energy of the whole spectrum of turbulent fluctuations.
Eq. (2.18) can be obtained by integration of the energy spectrum. In practice it is sufficient
to perform integration from κe = /Lt corresponding to the peak value on the energy spectrum
(Fig. 4):
dEk
e
with E(κ) given by Eq. (2.15). The integral length scale Lt is equal to
2/31
2/3
kt
k
2
C3L
(2.19)
The constant in Eq. (2.19) is equal to unity. Putting the turbulent length scale given by Eq.
(2.19) in place of Lc in Eq. (2.14) we obtain (2.18).
Figure 4. Energy spectrum for high Reynolds number flow.
e c

12
2.5. The transport equation for dissipation of the turbulent kinetic energy
The eddy viscosity expression (2.18) requires the knowledge of the turbulent kinetic energy,
which we can derive from equation (2.10). The second ingredient is the dissipation rate .
Remark that we are not restricted to an equation of . Any quantity which is a combination of
k and may be used. The most obvious is to use an equation for . The expression for is
known, Eq. (2.11). So, we could use an approach similar to the one as used for the turbulent
kinetic energy to derive a transport equation. Technically, this is possible, but the equation is
much more complicated than the equation for k and contains many more terms that need
modelling. So, looking at the k-equation (2.10) and taking into account that the parameter that
we can form with k and is the time scale =k/, the k-equation can be transformed into an -
equation by
k
t
k
21
k
k
xx
cPc
xu
t
(2.20)
where we introduce the constants cε1 and cε2 in the transformation of the production term and
the dissipation term. We further introduce the diffusion coefficient (see discussion latter).
One has to note that it is possible to obtain the transport equation for dissipation based on
some theoretical arguments. This derivation is not introduced in present course. So for further
analysis we will stay with the transport equation for dissipation given by Eq. (2.20).
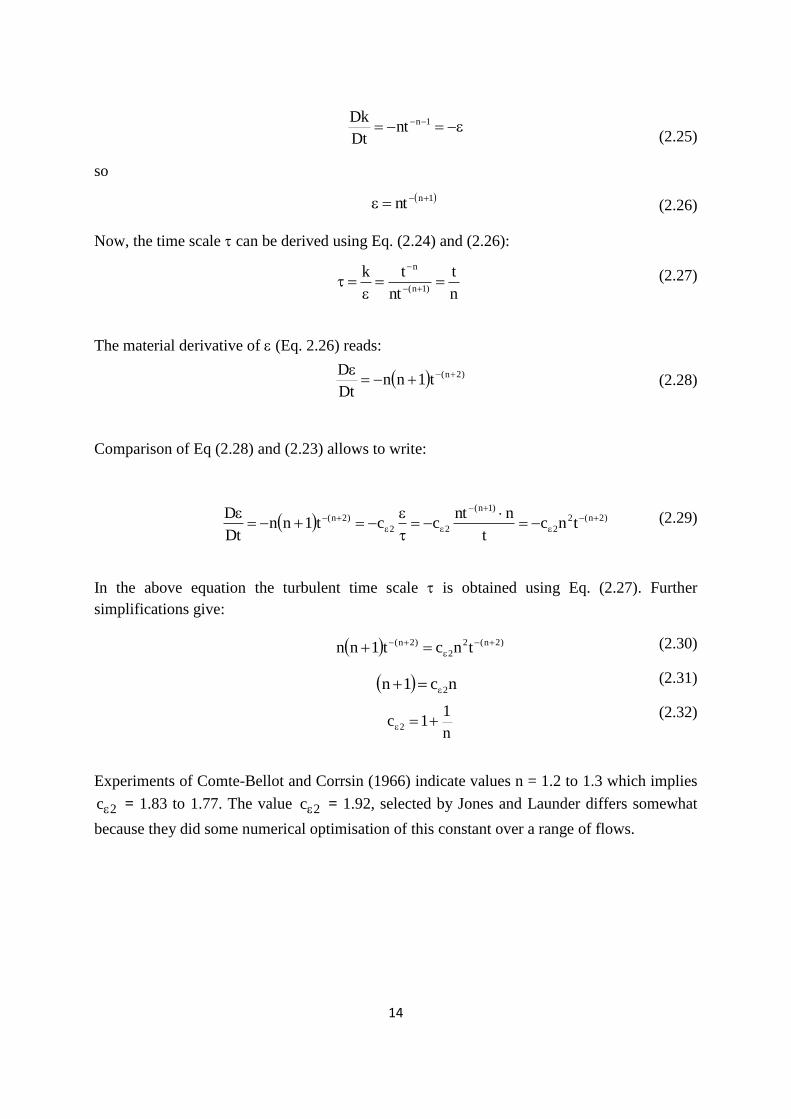
2.6. The standard k- model
The model which is called the standard k- turbulence model was developed by Jones and
Launder (1972). In this model, the RANS-equations are used together with the k-equation
(2.10), the -equation (2.20) and the eddy-viscosity expression (2.18). The standard values for
the model parameters are:
k 1 2c 0.09, 1.0, 1.3, c 1.44, c 1.92 (2.21)
The value for c comes from the observation of thin shear flows with approximate balance
between production and dissipation: 2D free jet mixing layers and the so-called inertial region
or logarithmic layer in a boundary layer flow. Figure 5 shows the terms in the turbulent
kinetic energy equation (Eq. 2.6) along normal to the wall direction in the turbulent boundary
layer at Re=1410. The results have been obtained using DNS by Laurent et al. (2012). The
molecular diffusion is important only at the wall. Both production and dissipation become
dominant at y+>5. Note a sign change on the profiles of the turbulent and molecular diffusion
inside the boundary layer (diffusion partly acts as a sink and partly as a source of the turbulent
kinetic energy). This makes the production and dissipation far more important than the
diffusion processes at sufficiently large distance from the wall. Moreover, we can assume
that production almost equals dissipation for y+>10: Pk=ε. With y as cross-stream coordinate
this results in (eq. 2.18):

13
2t
2t t2 2
u( )
u 'v 'yc ( )
kk k
For thin shear flows, the experimental observation is u 'v '( ) 0.3
k
, resulting in c = 0.09.
Figure 5. Terms in the turbulent kinetic energy equation inside the turbulent boundary layer
at Re=1410. DNS results by Laurent et al., (2012).
The constant 2c is determined by considering decaying homogeneous turbulence. Figure 6
shows the vortex structures obtained for DNS simulation of decaying isotropic and
homogeneous turbulence in the periodic box (Dubief i Delcayre, 2000). In this interesting
flow the statistics of all quantities in brackets on r.h.s. of Eq. (2.6) are constant. This means
that there is no diffusion. Moreover, the statistics of mean velocity derivatives are zero. It
means that there is no production either. The k- (2.10) and -equations (2.20) reduce to
Dk
Dt , (2.22)
2
2
2 ck
cDt
D (2.23)
where =k/. The first equation is satisfied for an observer moving with the flow by
ntk
(2.24)
Taking the material derivative of k (Eq. 2.24) and putting it into Eq. (2.22) gives:
production
dissipation
14
(2.25)
so
(2.26)
Now, the time scale can be derived using Eq. (2.24) and (2.26):
(2.27)
The material derivative of (Eq. 2.26) reads:
(2.28)
Comparison of Eq (2.28) and (2.23) allows to write:
(2.29)
In the above equation the turbulent time scale is obtained using Eq. (2.27). Further
simplifications give:
(2.30)
(2.31)
(2.32)
Experiments of Comte-Bellot and Corrsin (1966) indicate values n = 1.2 to 1.3 which implies
2c = 1.83 to 1.77. The value 2c = 1.92, selected by Jones and Launder differs somewhat
because they did some numerical optimisation of this constant over a range of flows.
1nntDt
Dk
1nnt
n
t
nt
tk)1n(
n
)2n(t1nnDt
D
)2n(2
2
)1n(
22
)2n( tnct
nntcct1nn
Dt
D
)2n(2
2
)2n( tnct1nn
nc1n 2
n
11c 2

15
Figure 6. Homogeneous and isotropic turbulence in a periodic box. (Dubief i Delcayre, 2000)
The constant 1c is determined from a homogeneous shear flow experiment. Figure 7 shows a
sketch of such flow. Homogeneous shear flow appears to reach an equilibrium state with k
and growing in such a manner that the turbulent time-scale k/ approaches an approximately
constant value. The governing equations are
kDk
PDt
, 1 k 2c P cD
Dt k /
(2.33)
which can be combined with the assumption of a constant turbulent time-scale to yield the
following relations. Assuming D/Dt=0 we arrive at:
2
21 k 2k
2
k2 1
D(k / ) Dk 1 k D
Dt Dt Dt
c P cP k1 ( )
k k
Pc 1 (c 1) 0
(2.34)
which leads to
21
k
c 1c 1
P /
(2.35)
Using 2c =1.83 and the shear flow data of Tavoularis and Corrsin (1981), where

16
kP / 1.8 and k / constant, the value 1c 1.46 results. Again, Jones and Launder take
the somewhat different value 1c 1.44 by numerical optimisation.
Figure 7. Flow in 2D mixing shear layer.
The diffusion coefficient σk is a priori taken to unity, since it governs the turbulent
diffusion of the turbulent kinetic energy by the turbulent motion itself.
The second diffusion coefficient σε comes from consideration of the diffusion of ε in the
logarithmic zone of the boundary layer. The following equations can be written in a zero
pressure gradient boundary layer flow:
2t t w
u u0 ( ) cons tan t u
y y y
(2.36)
2 t
tk
u k0 ( ) ( )
y y y
(2.37)
2
2 t1 t 2
u0 c ( ) c ( )
k y k y y
(2.38)
In the log-layer,
udu
dy y
(2.39)
From Eq. (2.36) and (2.39) we obtain
yut (2.40)
If we assume Pk= and a constant k-profile in the logarithmic part of the turbulent boundary

17
layer (no diffusion of k) Eq. (2.40) reduces to:
2k t
2 2t
u uP u 'v ' ( )
y y
uu( ) u y( )
y y
3u
y
(2.41)
Taking the definition of the turbulent viscosity given by Eq. (2.18) and introducing it into Eq.
(2.36) we obtain:
22
w t
22 22
3 2
uu ku u 'v ' c
y y
c ku uk ku c c y
y yu u
2u
kc
(2.42)
Introducing Eq. (2.39), (2.41), (2.42) i (2.18) into Eq. (2.38) we obtain:
3 2 6 3
1 22 2 2 2 2
4 4 4
1 22 2
41 2 2 2
c cu u u u y u0 c u y c ( )
y yu ( y) ( y) u y
u c u c uc c ( )
y y( y) ( y)
c 1 1(c c ) u
( y) y
This results in
2
2 1(c c ) c
(2.43)
It is important that relation (2.43) is satisfied to allow the law of the wall to be predicted
correctly. In standard k-, the values 1c = 1.44, 2c = 1.92, c = 0.09 and = 1.3 are used,
which following (2.43) implies = 0.43, which is a somewhat larger value than what is
usually assumed for the Von Karman constant ( = 0.40-0.41). Again, this difference comes
from the numerical optimisation by Jones and Launder.
One of the shortcoming of the standard k- model is its inability to reproduce a correct

18
level of the turbulent shear stress in the near-wall region. Figure 8 shows the predicted by the
k- model (dashed line) and computed using DNS (solid line) profiles of the turbulent
viscosity inside the boundary layer for simulation of the channel flow. As shown the k-
model overestimates the turbulent viscosity in the near-wall region. In order to limit this
shortcoming some damping functions are employed in front of the eddy-viscosity formula
(2.18). The other approach consists in using separate turbulence model, which shows better
performance than the classic k- model in the near-wall region, and its blending with standard
k- further away from walls. This technique is available in ANSYS Fluent (Enhancement
Wall Treatment). This obviously complicates the modeling approach using the standard k-
model.
Figure 8. Predicted using the k- model (dashed line) and computed using DNS (solid line)
profiles of the turbulent viscosity inside the boundary layer for simulation of the channel flow
at Re=590. Durbin and Pettersson Reif, (2003).
2.7. The k- model
As already mentioned, the scale determining equation does not necessarily have to be the
ε-equation. An equation for any combination of k and ε serves the same purpose. An
alternative for the dissipation rate is the specific dissipation rate ω ~ ε/k. Although this choice
can be traced back to Kolmogorov, the present popularity of the k- model is mainly due to
the work done by Wilcox (1988, 1993, 2006). The developers of the k- model claim that the
main advantage of this model as compared to the k- model, lies in a more natural treatment
of the near-wall region (discussed later).
The quantity can be also be seen as an inverse time-scale of the turbulent eddies. The
dissipation is modelled as
c k or c k
(2.44)
The model by Wilcox (1993) reads:

19
* *k t
i i
Dk kP k [( ) ]
Dt x x
(2.45)
2ij ij t
i i
D2 S S [( ) ]
Dt x x
(2.46)
The eddy-viscosity relation is given by
tk
(2.47)
The model coefficients are (Wilcox, 1993):
* *5 3
9 40, , 0.09, 0.5, 0.5 (2.48)
As mentioned the k- model shows advantages, with respect to the k- model, in resolving
the boundary layer flows. Figure 9 shows the predicted with the k- (lines) model and
computed using DNS (symbols) mean velocity, turbulent kinetic energy and dissipation
=Ck profiles for simulation of the channel flow. In DNS the dissipation has non-zero
values at the walls. The k- model, in contrast to DNS, returns a zero value at the wall and
shows a high peak value at distance y+=10. This peak value is responsible for a too strong
reduction of the turbulent kinetic energy in the near-wall region. Interestingly, this does not
mean that the resulting shear stress is underpredicted with the k- model. The shear stress is
captured well with the k- model. It means that the turbulent viscosity profile reproduced
with the k- model will agree well with DNS data shown in Fig. 8 (comparison not shown
here). This is a clear advantage with respect to the k- model since an accurate determination
of the shear stress is of particular importance for the RANS equations (1.15). It means that in
case of the k- model there is no necessity to introduce the damping function in front of the
eddy-viscosity relation (Eq. 2.47).
Figure 9. The mean velocity, turbulent kinetic energy and dissipation =Ck profiles
predicted with the k- (lines) model and computed using DNS (symbols) for simulation of the
channel flow. Durbin i Pettersson Reif, (2003).

20
2.8. The k- SST model
From the discussion in the previous section, we understand that the k-ω model has a clear
advantage in near-wall treatment. The standard k- model (Wilcox, 1993) has however a
serious drawback. The model has a spurious sensitivity to the free-stream values for the
turbulent quantities. One has to note however that the problem of spurious model sensitivity
to the free-stream values has been recently resolved by Wilcox (2006) by adding an
appropriate cross-diffusion term to the -equation. Figure 10 shows the profile of the
turbulent viscosity inside the boundary layer obtained with the standard k- (left) and k-
(right) models (the k- model is transformed to the k- formulation). In Fig. 10 the distance
y/=1 corresponds to the edge of the boundary layer. For large values of free-stream both
profiles show similar behavior. By setting the small values of leads to spurious
modification of the to the shear stress in the outer boundary layer. On the other hand the k-
model shows no sensitivity to the free-stream values.
It has taken a rather long time before an explanation of this phenomenon could be found.
The answer lies in considering the set of diffusion equations and study the disturbance front
propagation towards the boundary layer. An analysis of this type was proposed for the k-ε
system by Cazalbou et al. (1994) and then applied to the k-ω system by Kok (2000) and
Hellsten (2005). From such an analysis, it can be seen that the solution of a k-ε model is not
dependent on free-stream values, but the solution of the basic k-ω model is.
Figure 10. Turbulent viscosity profiles obtained with the standard k- model (left) and the k-
model (transformed to the k- formulation). Menter (1994).
A technical solution for this deficiency was suggested by Menter (1994) by combining the
k-ω model in wall vicinity with the k-ε model away from walls. The k-ε model is first
transformed to k-ω form. This form deviates from the basic one by the occurrence of a cross
diffusion term in the ω-equation. Another difference is that the constants are not the same.
In the SST k- ω model the k-equation reads:
ik k k t
i i i
k U k kP D
t x x x
(2.49)

21
where
2 *k tP min( S ,10 k ) , kD k
with β* = 0.09, σk = 0.85*F1 + (1.0-F1).
The -equation reads:
it 2 1
i i i i i
U 1 kP D 2 1 F
t x x x x x
(2.50)
where 2
kt
1P P , D
(2.51)
and t2
1 0.31kMIN ,
SF
(2.52)
where ijijSS2S for Sij given by (1.16)
α = 0.553*F1 + 0.44*(1-F1), β = 0.075*F1 + 0.0828*(1-F1),
σω = 0.5*F1 + 0.856*(1-F1) for σω2 = 0.856.
The blending functions are used in the cross term in (2.50), in the stress limiter (2.52) and in
the blending of the constants of the transformed k-ε model and the k-ω model.
The blending functions are
4
1 1tanh argF
with 21 2 2
SST
4 kk 500arg min max , ,
0.09 y y CD y
SST 2i i
1 kCD max 2 ,1.0e 10
x x
where 2 = 0.856. The term arg1 is based on the turbulent length scale
22 2F tanh arg with 2 2
k 500arg max 2 ,
0.09 y y

22
Remark that the eddy viscosity (2.52) has a limiter. This limiter prevents the shear stress to
become higher than 0.31 k. This limiter cures the tendency of the original model to produce
high shear stress in adverse pressure gradient flows and separated flows. The name SST
(Shear Stress Transport) refers to this stress limiter.
The functions F1 and F2 are zero far away from walls and become unity in wall vicinity.
The k-ω SST model can be considered as a practical best compromise of eddy viscosity
modelling technology with the status of knowledge of, say, about 20 years ago. It is still is
very valuable.
References:
J.B. Cazalbou, P.R. Spalart and P. Bradshaw. On the behaviour of two-equation models at the
edge of a turbulent region. Physics of fluids, 6(5):1797-1804, 1994.
G. Comte-Bellot and S. Corrsin. The use of a contraction to improve the isotropy of grid-
generated turbulence. J. Fluid. Mech., 25:657-682, 1966.
C. De Langhe, B. Merci and E. Dick. Hybrid RANS/LES modelling with an approximate
renormalization group. I. Model development. Journal of Turbulence, 6(13), 2005.
C. De Langhe, B. Merci, K. Lodefier and E. Dick. Hybrid RANS/LES modelling with an
approximate renormalization group. II. Applications. Journal of Turbulence, 6(14), 2005.
Y. Dubief and F. Delcayre, On coherent-vortex identification in turbulence, Journal of
Turbulence, 1, N11, 2000.
P.A. Durbin and B.A. Pettersson Reif. Statistical Theory and Modeling for Turbulent Flows.
John Wiley, 2001.
M. J. Giles. Turbulence renormalization group calculations using statistical mechanics
methods. Physics of Fluids, 6(2): 595–604, 1994.
M. J. Giles. Statistical mechanics renormalization group calculations for inhomogeneous
turbulence. Physics of Fluids, 6(11):3750–3764, 1994.
A. Hellsten. New advanced k-ω turbulence model for high-lift aerodynamics. AIAA J.,
43(9):1857-1869, 2005.
W.P. Jones and B.E. Launder. The prediction of laminarization with a two-equation model of
turbulence. AIAA J., 15:301-314,1972.
J.C. Kok. Resolving the dependence on free-stream values for the k-ω turbulence model.
AIAA J., 38(7):1292-1295, 2000.
23
B.E. Launder and B.I. Sharma. Application of the Energy Dissipation Model of Turbulence to
the Calculation of Flow Near a Spinning Disc. Letters in Heat and Mass Transfer, 1(2):131-
138, 1974.
C. Laurent, I. Mary, V. Gleize, A. Lerat, D. Arnal, DNS database of a transitional separation
bubble on a flat plate and application to RANS modeling validation, Computers & Fluids 61:
21–30, 2012.
F.R. Menter. Two-Equation Eddy-Viscosity Turbulence Models for Engineering
Applications. AIAA J., 32(8):1598-1605, 1994.
Tavoularis and Corrsin., Experiments in Nearly Homogeneous Turbulent Shear Flow with a
Uniform Mean Temperature Gradient. J. of Fluid Mechanics, 104:311-347, 1981.
D.C. Wilcox. Reassessment of the Scale Determining Equation for Advanced Turbulence
Models. AIAA J., 26(11):1299-1310, 1988.
D.C. Wilcox. Comparison of Two-Equation Turbulence Models for Boundary Layers with
Pressure Gradient. AIAA J., 31(8):1414-2031, 1993.
D.C. Wilcox. Turbulence Modeling for CFD. Griffin Printing, Glendale, California, 1993.
D.C. Wilcox. Turbulence Modeling for CFD. DCW Industries, 2006.
D.C. Wilcox, Formulation of the k- turbulence model revisited. AIAA J., 46: 2823-2837,
2008.

24
Appendix A
Multiplying Eq. (2.1) by the fluctuating velocity ju
and adding this term to a similar term
with the indexes interchanged and averaging we obtain:
(A.1)
After some algebra we obtain:
(A.2)
Assuming the Reynolds decomposition (mean plus fluctuation):
(A.3)
and putting Eq. (A.3) to (A.2) we obtain several terms which are discussed below:
1. Local time derivative
(A.4)
The property (1.10) was used in order to simplify Eq. (A.4) (second line). The following
relation was used to derive the last term in Eq. (A.4)

25
(A.5)
2. Convective term
(A.6)
3. Pressure gradient term
(A.7)
4. Viscous term
(A.8)
Finally, putting Eq. (A.4), (A.6), (A.7) and (A.8) to Eq. (A.2) we obtain the exact form of the
Reynolds-stress equation:

26
(A.9)
Note that Eq. (A.9) can be rewritten in the form given by Eq. (19) using the following
relations:
(A.10)