lectures in microeconomics-charles w. upton the firm’s supply curve
Post on 22-Dec-2015
221 views
TRANSCRIPT

Lectures in Microeconomics-Charles W. Upton
The Firm’s Supply Curve

The Firm’s Supply Curve
The Key Rule
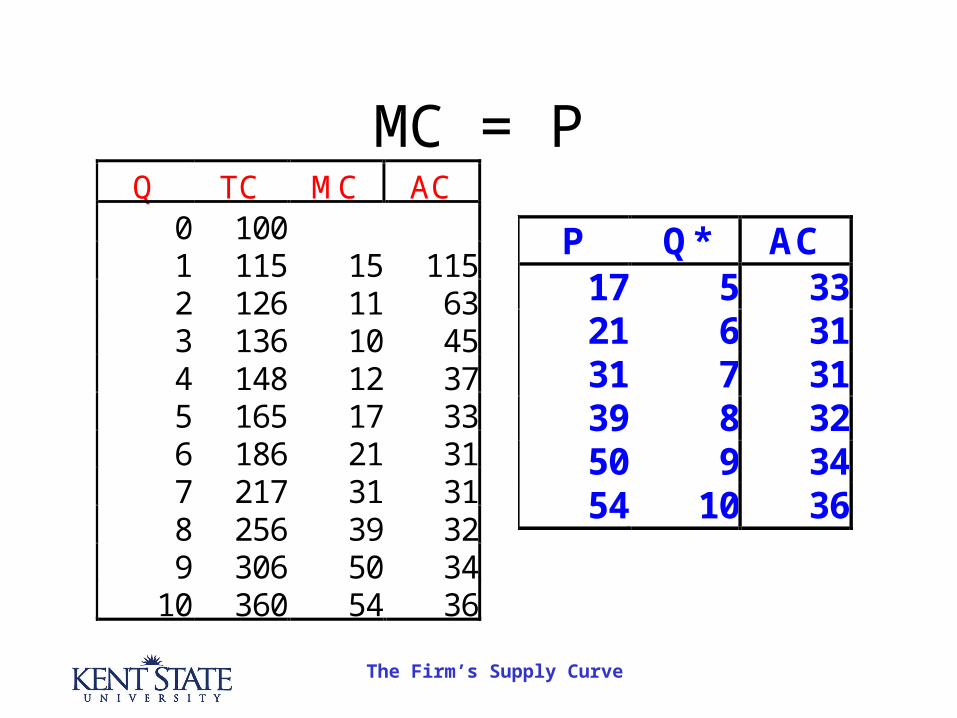
Set Q where
MC = price
The Firm’s Supply Curve
MC = PQ TC MC AC
0 100 1 115 15 115 2 126 11 63 3 136 10 45 4 148 12 37 5 165 17 33 6 186 21 31 7 217 31 31 8 256 39 32 9 306 50 34
10 360 54 36
P Q* AC 17 5 33 21 6 31 31 7 31 39 8 32 50 9 34 54 10 36

The Firm’s Supply Curve
The Supply CurveQ TC MC AC
0 100 1 115 15 115 2 126 11 63 3 136 10 45 4 148 12 37 5 165 17 33 6 186 21 31 7 217 31 31 8 256 39 32 9 306 50 34
10 360 54 36
P Q* AC 17 5 33 21 6 31 31 7 31 39 8 32 50 9 34 54 10 36
This looks like a supply curve

The Firm’s Supply Curve
The Minimum PriceQ TC MC AC
0 100 1 115 15 115 2 126 11 63 3 136 10 45 4 148 12 37 5 165 17 33 6 186 21 31 7 217 31 31 8 256 39 32 9 306 50 34
10 360 54 36
P Q* AC 17 5 33 21 6 31 31 7 31 39 8 32 50 9 34 54 10 36

The Firm’s Supply Curve
The Minimum PriceQ TC MC AC
0 100 1 115 15 115 2 126 11 63 3 136 10 45 4 148 12 37 5 165 17 33 6 186 21 31 7 217 31 31 8 256 39 32 9 306 50 34
10 360 54 36
P Q* AC 17 5 33 21 6 31 31 7 31 39 8 32 50 9 34 54 10 36
P 31 or < 0

The Firm’s Supply Curve
A Graphical InterpretationMC
ATCAVC
P1
P2
Q2 Q1

The Firm’s Supply Curve
A Graphical InterpretationMC
ATCAVC
P1
P2
Q2 Q1
Unless P> P1, the firm cannot cover
ATC

The Firm’s Supply Curve
A Graphical InterpretationMC
ATCAVC
P1
P2
Q2 Q1
Unless P> P2, the firm cannot cover
AVC

The Firm’s Supply Curve
The Supply CurveMC
ATCAVC
P1
P2
Q2 Q1
SLR

The Firm’s Supply Curve
The Supply CurveMC
ATCAVC
P1
P2
Q2 Q1
SLR
P3
P4
Q3 Q4

The Firm’s Supply Curve
A Graphical InterpretationMC
ATCAVC
P1
P2
Q2 Q1
SSR
The Firm’s Supply Curve
A Graphical InterpretationMC
ATCAVC
P1
P2
Q2 Q1
SSR
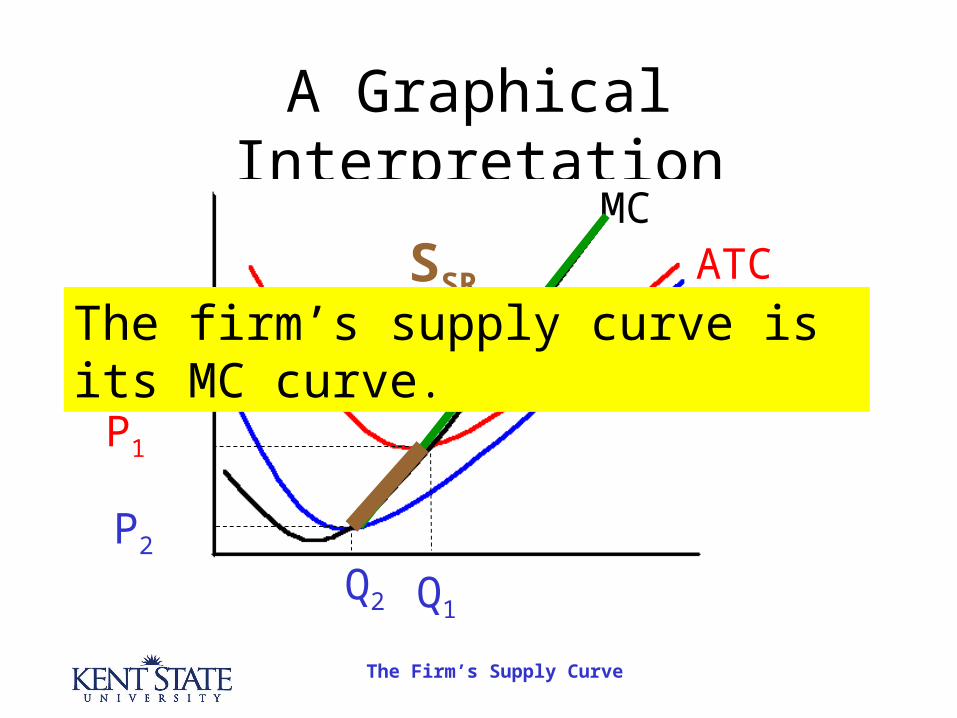
The firm’s supply curve is its MC curve.
The Firm’s Supply Curve
A Graphical InterpretationMC
ATCAVC
P1
P2
Q2 Q1
SSR
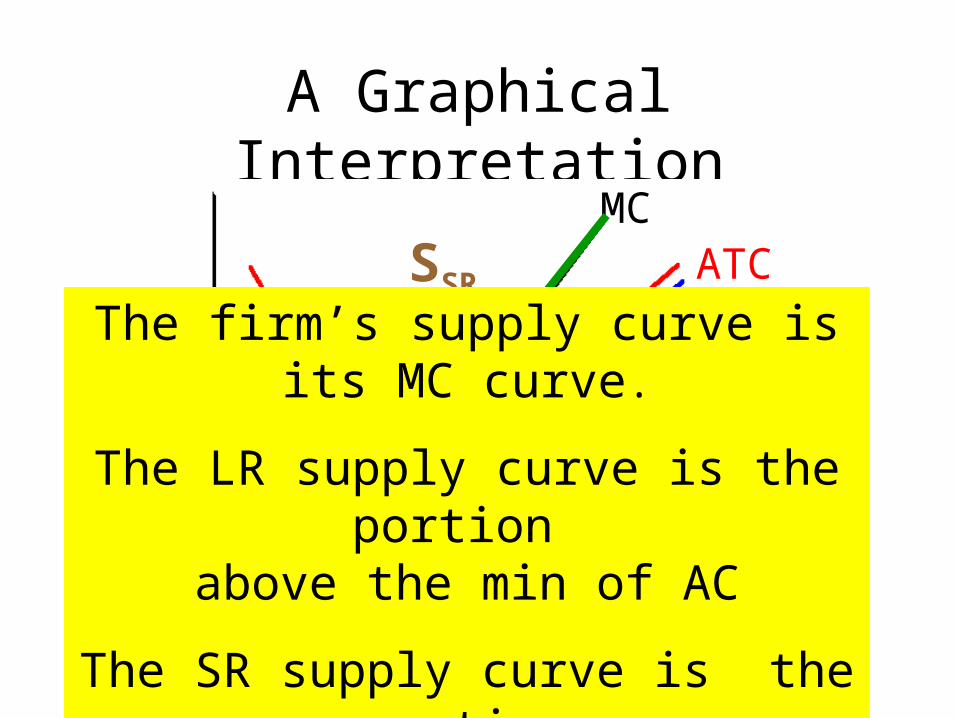
The firm’s supply curve is its MC curve.
The LR supply curve is the portion above the min of AC
The SR supply curve is the portionabove the min of AVC

The Firm’s Supply Curve
A Mathematical Interpretation
C = 4 +5q+q2

The Firm’s Supply Curve
Solving for the Supply Curve
C = 4 +5q+q2
MC = 5 + 2q
q = (½) – 2.5P

The Firm’s Supply Curve
Now for the Minimum
C = 4 +5q+q2
MC = 5 + 2q
q = (½) – 2.5P
AC = 4/q + 5 +q

The Firm’s Supply Curve
Now for the Minimum
C = 4 +5q+q2
MC = 5 + 2q
AC = 4/q + 5 +q
MC = AC

The Firm’s Supply Curve
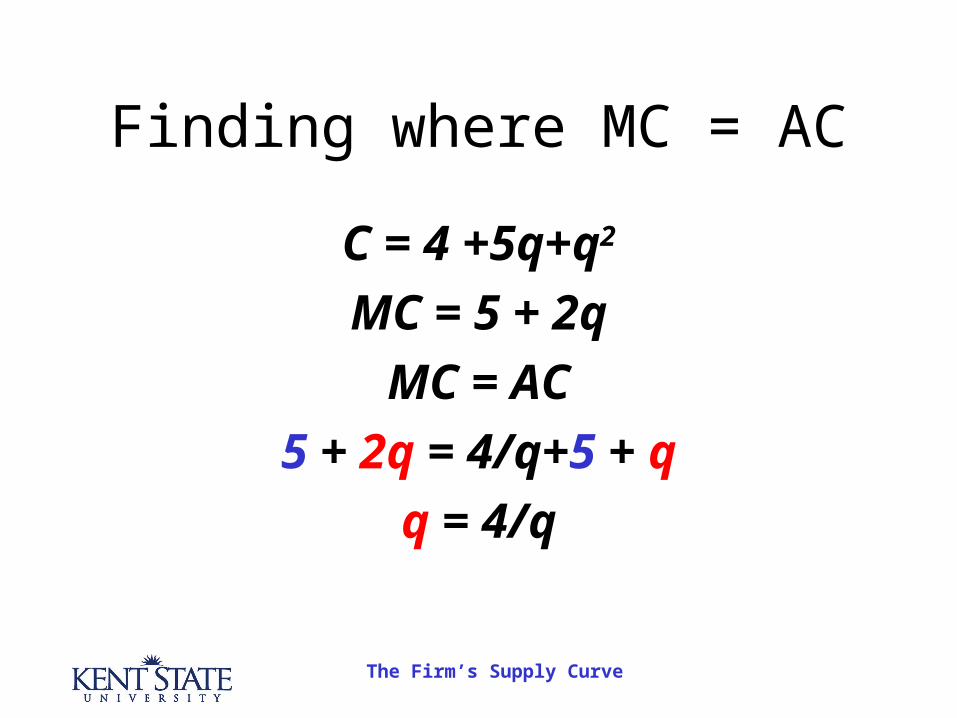
Finding where MC = AC
C = 4 +5q+q2
MC = 5 + 2q
AC = 4/q + 5 +q
MC = AC
5 + 2q = 4/q+5 + q
The Firm’s Supply Curve
Finding where MC = AC
C = 4 +5q+q2
MC = 5 + 2q
MC = AC
5 + 2q = 4/q+5 + q
q = 4/q

The Firm’s Supply Curve
Finding where MC = AC
C = 4 +5q+q2
MC = 5 + 2qAC = 4/q + 5 +q
MC = ACq = 4/qq2 = 4
q=2

The Firm’s Supply Curve
Finding the Minimum Price
C = 4 +5q+q2
MC = 5 + 2q
AC = 4/q + 5 +q
MC = AC
q = 2
p = MC = 5 +2(q) = 5+2 (2) = 9

The Firm’s Supply Curve
The Short Run Minimum
C = 4 +5q+q2
MC = 5 + 2q
AC = 4/q + 5 +q
MC = AVC
5 +2q = 4/q + 5 + q

The Firm’s Supply Curve
The Short Run Minimum
C = 4 +5q+q2
MC = 5 + 2q
AC = 4/q + 5 +q
MC = AVC
5 +2q = 4/q + 5 + q
5+2q = 5 + q

The Firm’s Supply Curve
The Short Run Minimum
C = 4 +5q+q2
MC = 5 + 2qAC = 4/q + 5 +q
MC = AVC5 +2q = 4/q + 5 + q
5+2q = 5 + q
q=0
The Firm’s Supply Curve
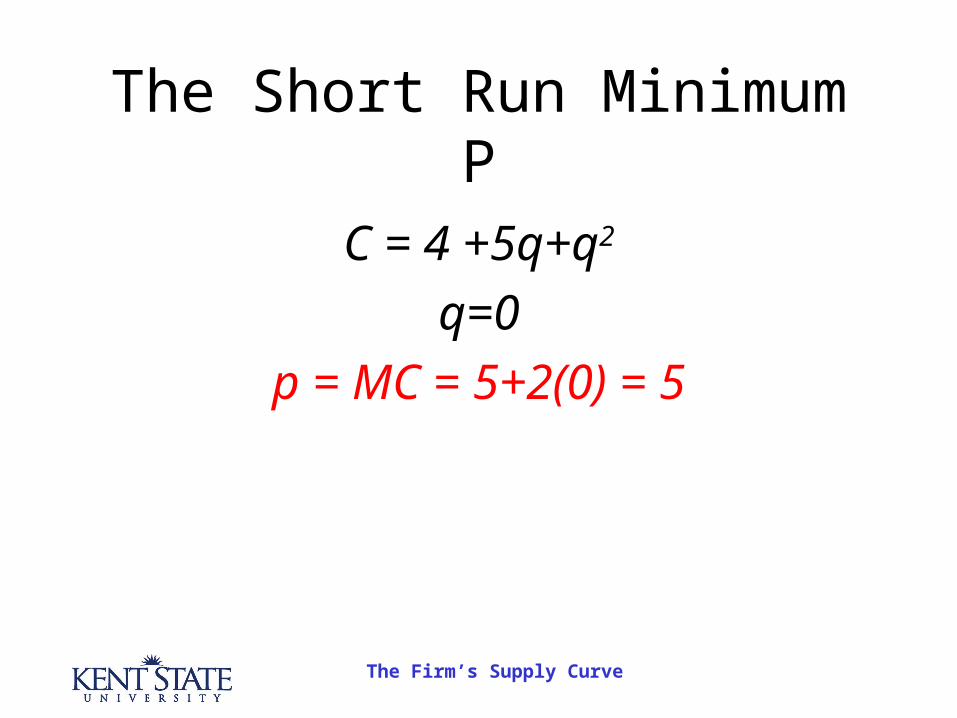
The Short Run Minimum P
C = 4 +5q+q2
q=0
p = MC = 5+2(0) = 5
The Firm’s Supply Curve
The General Rules
• Produce widgets until the marginal cost equals the market price.

The Firm’s Supply Curve
The General Rules
• Produce widgets until the marginal cost equals the market price.
• If I cannot cover my variable costs, shut down immediately

The Firm’s Supply Curve
The General Rules
• Produce widgets until the marginal cost equals the market price.
• If I cannot cover my variable costs, shut down immediately
• If I cannot cover my variable and fixed costs, continue producing but start shedding my fixed costs. Then shut down.
The Firm’s Supply Curve
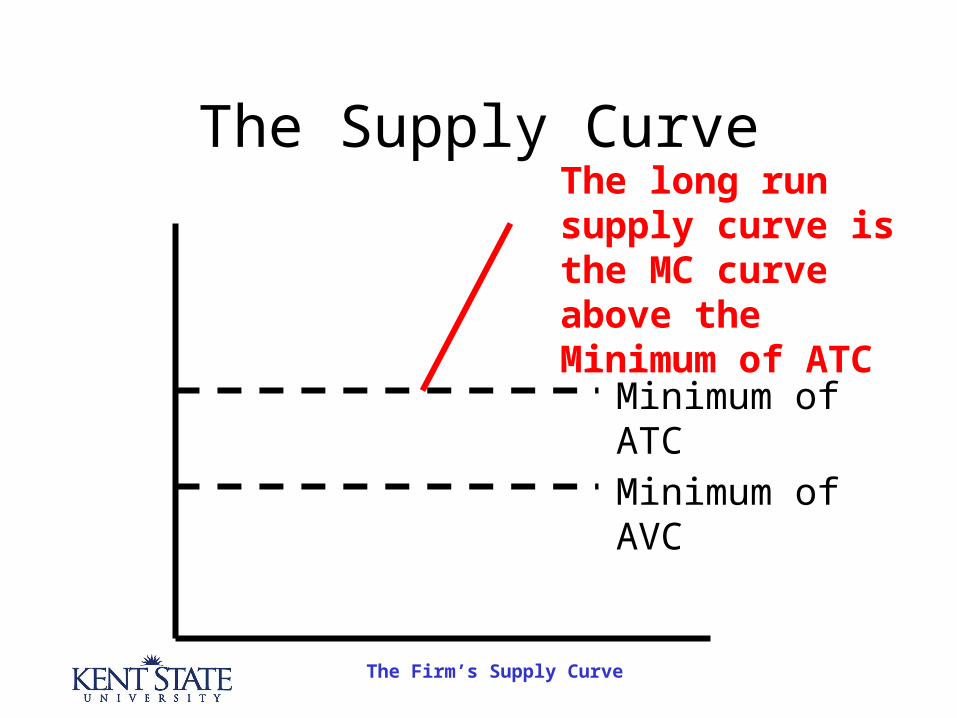
The Supply Curve
Minimum of AVC
Minimum of ATC
The long run supply curve is the MC curve above the Minimum of ATC

The Firm’s Supply Curve
The Supply Curve
Minimum of AVC
Minimum of ATC
The short run supply curve is the MC curve above the Minimum of AVC

The Firm’s Supply Curve
End
©2003 Charles W. Upton