led vs. fluorescent lighting: an rsmeans life cycle cost ... · led vs. fluorescent lighting: an...
TRANSCRIPT

A trusted name in construction costs for more than 70 years, RSMeans offers cost data you can depend on – annually updated construction cost information available in convenient book, eBook, CD and online format – always current and always at your fingertips.
Using RSMeans cost data as well as computerized modeling software and methods, this study compared the life cycle costs of LED lighting against fluorescent lighting over a 20-year period of time. The costs for the 2-story, 150,000 square foot college in Boston, Massachusetts, included the initial cost of the fixtures, energy consumption costs and, for the fluorescent fixtures, the relamping and lamp recycling costs. The study included two relamping methods: the group method, where all lamps are replaced at one time, and the spot method, where individual lamps are replaced as required.
The results found that LED fixtures had a break-even point of 14 ½ years when relamping with the spot method and a breakeven point of 19 years with the group method. The findings indicate that facilities investing in LED lighting will see a return in their investment somewhere between 14 ½ and 19 years, depending on their relamping method. Additionally, the study found that the market share of LED lighting is gradually increasing as technology continues to mature, resulting in less expensive and even brighter fixtures that are an even more desirable lighting alternative to fluorescent.
Executive summary
LED vs. Fluorescent Lighting: An RSMeans life cycle cost comparison
November 2013
Adrian Charest, PE, LEED AP BD+CEngineer / EditorRSMeans

LED vs. Fluorescent Lighting: An RSMeans life cycle cost comparison . 2
History and justificationLight emitting diodes (LEDs) are a moving target in the world of lighting. They are a revolutionary chip-based technology in the process of evolving from a simple indicator on our appliances to a major player in illumination.1 LEDs still face a few challenges, such as upfront costs and some quality of light issues – not to mention the extreme variability in the quality of the fixtures themselves, which means they have a little way to go in terms of meeting full potential. Innovations, however, continue to happen at a faster and faster pace, and the market share for LEDs is constantly expanding.2,3
Major factors, including reduced energy and maintenance requirements, are driving LED acceptance into the market. LEDs recently passed the 200 lumen to watt threshold (100 for fluorescent and 15 for incandescent), and the technology is even going so far as to have an impact on energy codes.4,5
In addition, LED fixtures do not have bulbs to relamp as they degrade or burn out. In the right conditions, LEDs can be essentially maintenance-free for as many as 50,000 hours.6
LED technology is highly evolving. It still has some maturity issues to work out, but predictions indicate a prominent role over fluorescent lighting may occur in just a few short years.7 When will this happen? How long does it take for the life cycle costs of fluorescent fixtures to exceed LEDs?
This study looks to answer these questions by comparing the construction, energy, relamping and lamp recycling costs between the two technologies over a 20-year time period.8 The goal of this study is to complement existing research and further develop these predictions to provide greater insight into this developing technology.
Study overviewThe 20-year study used a 2-story, 150,000 square foot college classroom structure in Boston to compare the life cycle costs of LED fixtures to fluorescents in two relamping situations – group and spot. This facility type was selected because of the unique relamping challenges it faces. At some institutions, a well-scheduled maintenance monitoring program exists and all the relamping across the facility occurs as one group event. In others, lighting maintenance is dependent on the facility’s occupants to indicate issues, and
spot relamping occurs one bulb at a time. The location was selected to develop an accurate model of an actual facility using localized RSMeans costs and to use local weather files enabling energy modeling of the facility. The parameters of this study were the initial fixture costs, which include the cost of the fixture, the cost to install the fixture and the accompanying overhead and profit costs. The electrical costs from the local provider to operate the fixtures were also included and, for the fluorescent fixtures, the relamping costs as well as the costs for recycling the spent lamps.
The study is a snapshot in time of a rapidly-changing technology, and parameters deemed outside its scope exist. The quality of light was considered acceptable for group relamping; however, this would need to be accounted for in a spot relamping situation.9 As a result, aspects such as the color, temperature and intensity of the fixtures over time were not included. While these are real variables related to an occupant’s comfort, this study focused on costs with the intent that the reader will make the proper adjustments.
In addition, the study assumes the costs of washing or dusting, as well as selective demolition and disposal of the fixtures for both technologies would be approximately equal and, therefore, cancel each other out.10 The replacement of ballasts and drivers for the fluorescent and LED fixtures, respectively, were also not included; the mortality of these items exceeded the duration of the study, and their salvage value was deemed negligible. Finally, all costs are present day, and economic considerations, such as inflation, the decreasing costs of fixtures, and changes in electrical energy rates were not included.
Facility informationVarious aspects of the facility were determined, modeled, and analyzed through the use of industry accepted software. RSMeans Online, an easy-to-use product for generating construction estimates, was used to calculate the initial costs using the 2-3 story college classroom model from the Square Foot Costs dataset.11 Selecting a decorative concrete block with a steel frame construction resulted in an overall facility cost of $32.7 million. A foot candle analysis was performed using Visual, a software package for performing lighting calculations, to fine tune the facility’s lighting
www.reedconstructiondata.com

LED vs. Fluorescent Lighting: An RSMeans life cycle cost comparison . 3
fixture quantities according to the Illuminating Engineering Society of North America’s lighting equations.12 The fixtures included in the study were three-lamp fluorescent and LED troffers with rated lamp lives of 15,500 hours and 50,000 hours, respectively.13,14,15 Using standard reflectances, photometric files and recommended light loss factors resulted in 684 LED fixtures. The calculations also resulted in 684 fluorescent fixtures with a total of 2,052 lamps.16
Being an academic institution, the facility was assumed to operate in one in-session period and one out-session period. The in-session period, from September to May, operated at full lighting capacity from 8 a.m. to 6 p.m., at 25% lighting capacity from 6 p.m. to 9 p.m., at 10% lighting capacity from 9 p.m. to 12 a.m. during the week and at 25% lighting capacity from 8 a.m. to 6 p.m. during the weekends for a monthly operating hourly total of 241 hours. The out-session period was from 8 a.m. to 4 p.m. at 25% lighting capacity during the week and at 10% capacity during the weekend, which resulted in a monthly operating hourly total of 46.4 hours.
Energy modelingThe overall facility and lighting energy demand was determined using eQuest, an energy analysis software application with a matching college classroom model.17 This was done by applying the foot candle calculation results of 0.45 watts per square foot for the fluorescent fixtures and 0.27 watts per square foot for the LEDs in the modeling software.18 Using the facility’s operating periods and the respective lighting loads with the other default settings for this building type provided an overall yearly electric consumption for the fluorescent analysis as 738,000 kilowatt hours and the LED analysis as 654,000 kilowatt hours. At the time of writing, the electrical supplier for Boston’s rate resulted in a total yearly cost of $74k and $65k for the fluorescent and LEDs, respectively.19
RelampingRelamping is the process of changing an existing lamp in a fixture with a new one. It can be done by group relamping, where workers replace all lamps at a particular point of the rated lamp life, or by individual or spot relamping, where workers replace individual expired lamps upon request.20
Group relamping is the recommended method, due to lower labor and disposal costs and, if planned properly, reduced disruption to occupants through off-time scheduling.21,22,23 Spot relamping has great variability in the number of lamps requiring replacement and the timing when relamping is needed, making scheduling a difficult task.
The study modeled group relamping through the use of a lamp mortality curve, which displays the percent lamps surviving against the percent of the lamp’s life.24 In other words, the curve indicates the anticipated number of lamps that will burn out as time progresses. According to the curve, a batch of lamps at 100% of their rated life (15,500 hours in this case) would see half of them expire and half of them remain operational. Using this curve and a random number generator, a specific life – as short as 6,200 hours and as long as 24,800 hours – was assigned to each lamp. The lamps were then deteriorated according to the monthly operating hours of the facility. An initial set of lives was assigned at the beginning of the study and each month the operating hours of the facility reached 70% of the rated lamp life for the duration of the study. The lamp mortality curve indicates that 70% of the rated lamp life corresponds with a 90% survival rate and a 10% mortality rate, which is a recommended increment for group relamping.
The study modeled spot relamping in a way similar to the previously-described group method, including the initial assignment of lamp lives. The spot relamping method differs by assigning a new random life to only the expired lamps when the facility’s lamp mortality exceeded 5%. The new lamps are then deteriorated in the same manner as the existing ones. The process was repeated each month the lamp mortalities exceed 5%.
The study included costs for recycling the collected lamps during the group and spot processes.25 Different recycling rates and pickup charges were applied to the two methods because of the economy of scale relationship with the quantity of lamps. The pickup charge was increased for the group relamping events because of the larger quantity of lamps; however, the recycling costs per lamp were reduced for the same reasons.
www.reedconstructiondata.com
LED vs. Fluorescent Lighting: An RSMeans life cycle cost comparison . 4
The study did not include the costs of relamping or replacing the LED fixtures. The mortality of this fixture type differs from fluorescent in that they don’t burn out; rather they become progressively dimmer over time. LEDs, however, are rated by their useful life or when the fixture is emitting at least 70% of its rated output. Typical rated useful lives for LED fixtures is 50,000 hours and the total operating hours of the facility after the 20-year span was 46,164 hours.26
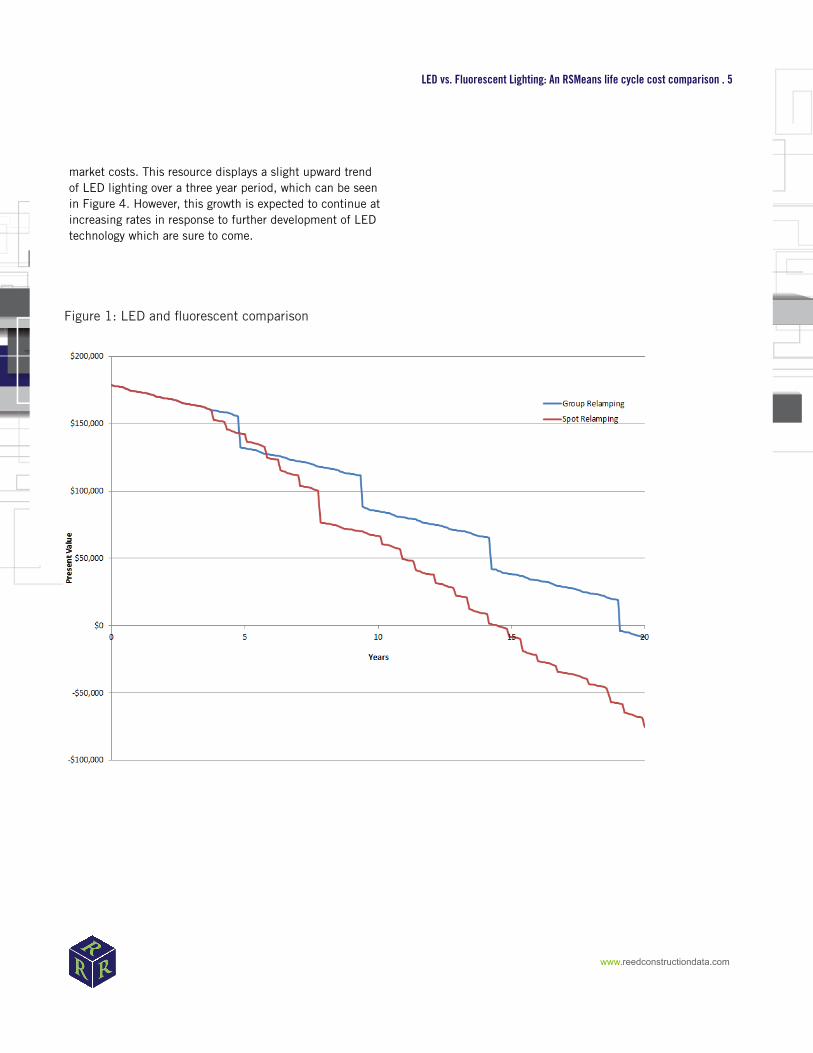
ResultsThe construction costs for the two fixture types differed dramatically. Using the Electrical Cost Data set from RSMeans Online, the LED and fluorescent fixtures extended out to $321K and $143K, respectively. The costs included the material, labor and equipment for installation, as well as the overhead and profit the contractor would charge localized to Boston, Massachusetts. The difference between these costs is $178K, and an economy of scale reduction was applied to the calculations to reflect the increased buying power due to the size of the project.27 This initial difference can be found in Figure 1 as the starting point of the lines at Year 0.
The difference in energy usage for the fluorescent and LED lighting fixtures was calculated by subtracting the LED usage from the fluorescent, which varied in relation to the in- and out-sessions. There was not a variation due to the different relamping methods. The monthly minimum value corresponded with an out-session and was 2,050 kilowatt hours; conversely, the monthly maximum value occurred during an in-session and was 8,080 kilowatt hours. These differences resulted in additional monthly costs ranging from $261.02 to $687.17 for the fluorescent fixtures. These additional costs resulted in a downward trend for the comparison lines, indicating that the operational costs of the LED fixtures is less than the fluorescent, and is evident in Figure 1 for both the group and spot relamping methods.
The results of the relamping effort can be found in Figures 2 and 3, including the number of mortalities per span of time between events, as well as the total number of replaced lamps. Figure 2 displays the group method and indicates that relamping occurred in approximately equal intervals with one event occurring in less time than the others, resulting in an increase in the mortality per time for that increment. In
addition, the total number of lamps replaced in the 20-year time span was 8,208 lamps. Using the Facility Construction Cost dataset in RSMeans Online, the extended cost of group relamping for each event was $22,800. Figure 3 shows the spot method and indicates that relamping occurred in a variety of time intervals, resulting in dramatic changes in the mortalities per time. Additionally, the total number of lamps replaced was 5,372 – 2,836 fewer lamps than the group method. The extended cost of spot relamping ranged from $3,800 to $23,100 and was calculated using the Facility Construction Cost dataset in RSMeans Online.
ConclusionsThe results show that despite the increased upfront costs of LED lighting, the operation and maintenance is significantly lower than fluorescent fixtures, making LED a cost effective option for both group and spot relamping situations. The cost comparison included both relamping methods to provide facilities that perform a mix of both relamping techniques the ability to interpolate between the lines. A facility that relamps by means of the spot method would find their investment payoff closer to the 14 ½ year mark, while the payoff would be closer to 19 years for the group using relamping method.
Advancements and improvements in LED technology will continue to reshape the lines. The decreasing cost will lower the upfront investment, thus shifting the curves downward. The increasing lumen output could decrease the number of fixtures required, which would lower the total cost and also shift the lines downward. The increasing energy efficiency of the fixtures could decrease their operational costs, resulting in a steeper slope of the curves. These factors will have a positive effect on the payoff period for LED lighting and decrease the number of years to reach the $0 mark. Thus, extrapolation from these curves to the left is an acceptable adjustment as the technology continues to mature.
The presence of LED lighting in the market is increasing as these factors continue to develop. Reed Construction Data’s cūbus + Demand View product is a tool that displays the market share of materials and project costs from architectural specifications and RSMeans square foot models.28 This information is based on projects that have gone through the bidding process and are representing
www.reedconstructiondata.com
LED vs. Fluorescent Lighting: An RSMeans life cycle cost comparison . 5
market costs. This resource displays a slight upward trend of LED lighting over a three year period, which can be seen in Figure 4. However, this growth is expected to continue at increasing rates in response to further development of LED technology which are sure to come.
www.reedconstructiondata.com
Figure 1: LED and fluorescent comparison

LED vs. Fluorescent Lighting: An RSMeans Life Cycle Cost Comparison . 6
www.reedconstructiondata.com
Figure 2: Group Relamping
Figure 3: Spot Relamping

LED vs. Fluorescent Lighting: An RSMeans Life Cycle Cost Comparison . 7
www.reedconstructiondata.com
Figure 4: Market Trend
References
1. Eveleth, Rose. “How It’s Made.” EcoStructure Fall 2013: 23. Print. 2. Brodrick, James. “Solid-State Lighting: Technology at a Turning Point.” Electro Industry February 2013: 12. Print. 3. Hamilton, Rae. “21st Century Lighting.” Electrical Contractor April 2013: 32-34. Print. 4. Hardesty, Linds. “Philips Creates LED Tube Lamp Delivering 200 Lumens Per Watt.” Energy Manager Today 16 April 2013. Web. 2 October 2013. 5. “Cree Reaches LED Industry Milestone with 200 Lumen-Per-Watt LED.” Cree. Press Release, Web. 18 December 2012. 6. Corum, Lyn. “Lighting the Way to Efficiency.” Business Energy September/October 2012: 32-37. Print. 7. Brzozowski, Carol. “Illuminated Savings.” Distributed Energy May 2013: 10-19. Print. 8. Dell’Isola, Kirk. Life Cycle Costing for Facilities. Kingston: RSMeans, 2003. Print. 9. “Lighting: Spot Versus Group Relamping.” Reliant. Energy Savings Center, Web. 24 April 2014. 10. RSMeans. Facility Maintenance – Frequency Table. Kingston: RSMeans, 2014. Print. 11. Reed Construction Data. RSMeans Online. Computer software, Web. 2014. 12. Acuity Brands Lighting, Inc. Visual, Basic Edition. Computer software, Workstation. 2006. 13. “Lighting Answers.” RPI. Lighting Research Center, Web. June 2006. 14. Brigagliano, James. “Replacing the Fluorescent Lamp with Linear LED Luminaires.” Building Media. McGraw Hill Construction, Web. November 2012. 15. Madsen, Jana J. “Fluorescent Lamps 101.” Buildings. n. p. Web. May 2008. 16. Benya, James R. “Lighting Calculations in the LED Era.” Cree. n. p. Web. 30 June 2011. 17. James J. Hirsch. eQuest. Computer software, workstation. 1998-2006. 18. “LED Lighting: Getting It Right.” Colorkinetics. Phillps, Web. 2010. 19. “Electric Business Rates.” NStar. n. p. Web. 2013. 20. RSMeans. Cost Planning & Estimating for Facilities Maintenance. Kingston: RSMeans, 1996. Print. 21. Audin, Lindsay. “Group Relamping: All Together Now.” FacilitiesNet. n. p. Web. April 2007. 22. “The Advantages of Group Relamping.” Sylvania. 23. “Shining a Light on Lighting Maintenance.” ESource. n. p. Web. 2006 24. RSMeans. Facilities Operations & Engineering Reference. Kingston: RSMeans, 1999. Print. 25. “Help reduce mercury contamination!” Clean Water Services. n. p. Web. 2013 26. Dilouie, Craig. “Light It and Forget About It? What it takes to maintain LEDs.” Electrical Contractor April 2013: 40. Print. 27. RSMeans. Square Foot Project Size Modifier. Kingston: RSMeans, 2014. Print. 28. Reed Construction Data. cūbus + Demand View. Computer software, Web. 2014.

RSMeans700 Longwater DriveNorwell, GA 02061800.787.9876www.reedconstructiondata.com