lee w. schruben - isaac newton institute · 220 220 - 240 240+ release time ... th dli h i e...
TRANSCRIPT

ll (l d )Savings Millions (lives and money) with Simulation Experiments
• Biopharmaceutical production and supply chainsp p pp y
• Self‐simulating systems (Activity Interaction)Bio G implementation (Data and Expert Driven)– Bio‐G implementation (Data and Expert Driven)
– CITRIS project: UC Berkeley/Davis EMD project
• Integrated Discrete Event Simulation Experiments
• Input Modeling: Multivariate Time Series (Agents) p g ( g )
• Model Accreditation (Turing tests)
9/16/2011 1
Lee W. SchrubenUniversity of California at Berkeley

MedicineP d d/
Biopharmaceutical Production and Supply Chains
Produced/yr
Biopharma Plant: Employees 1200Biopharma Plant: Employees,1200Amino Acids in Molecule, 2300Annual production, 200 gmsLives saved (mostly children and young adults)
Ref: Berkeley Bayer Bio Annual Report

Some BioPharma CharacteristicsSome BioPharma Characteristics• Highly regulated processesMany National “FDAs”Many National FDAs
ISO 14001 (environmental EU) cGMP‐FDA e.g. FDA approved batch sizes ‐ “the boutique problem”
long change cycle (up to 9 years), 3 yrs to approve new freeze‐dryer sizeg g y ( p y ), y pp y
• QC/QA – long delays, quarantines, etc. “production‐at‐risk”
• Significant Variability

1. Long Production and QA/QC Lead Times1. Long Production and QA/QC Lead Times
0 35
0.4
0.45
0.5Target release cycle
time of 70 days. Average cycle time ~85 days, standard deviation 30 days
0.2
0.25
0.3
0.35
erce
nt o
f val
ues
Company 1Company 2
No target release cycle time. Average
time ~60 days, standard deviation
of 70 days
0
0.05
0.1
0.15
P
80% of batches take less than 120
days
Some batches require more
than ½ a year…
00 - 20 20 - 40 40 - 60 60 - 80 80 -
100100 -120
120 -140
140 -160
160 -180
180 -200
200 -220
220 -240
240+
Release time (days)
* Indicative times only, data based on a number of biopharmaceutical firms. Comparative durations for times
9/16/2011 4
retained, X and Y scales altered. Rejected batches removed from dataset. Courtesy Bio-G

2. High Regulatory Requirements / h lHigh Service Levels
“N P ti t Sh ll G With t”“No Patient Shall Go Without”
9/16/2011 5

3 High Variability Evolving3. High Variability, Evolving Processes
CIP Ti 2002 2008CIP Times, 2002 ‐ 2008
Hou
rsH
9/16/2011

Topics Discussed (please try to hold me to about 5 min. each)(please try to hold me to about 5 min. each)
• Biopharmaceutical production and supply chainsp p pp y
• Self‐simulating systems (Activity Interaction)– Bio‐G implementation (Data and Expert Driven)Bio G implementation (Data and Expert Driven)– Citris UC Davis EMD project
• Integrated Discrete Event Simulation ExperimentsIntegrated Discrete Event Simulation Experiments
• Input Modeling: Multivariate Time Series (Agents)
• Model Accreditation (Turing tests)
9/16/2011 7

Most off‐the‐shelf “simulation languages” are designed using a process “flow” view ‐ for animation, not analysis.
Short loops pwith “decoration”!
Ref: WK Chan, RPI


4 server queue with Jockeying

Resident vs Transient Entity Arena ModelsResident Entity vs Transient Entity Models (Arena)
2500
1500
200000
K jo
bs)
TransientEntity Model
Resident
1000
un ti
me
(10 Resident
Entity Model
0
500
0.20 0.50 0.75 0.80 0.91 1.00 1.05 1.10 1.25
Ru
Surge intensity

(AI = Activity Interaction) Manages concurrency and contention or parallel Activities
(System entities describe what they do)(System entities describe what they do)
(rate/continue/flow
(start)concentration, etc.Using CROSSWALK) (finish)
Activity Duration
Model has to be correct, current, and credible…

(AI = Activity Interaction) d l dModels concurrency and contention
9/16/2011 13

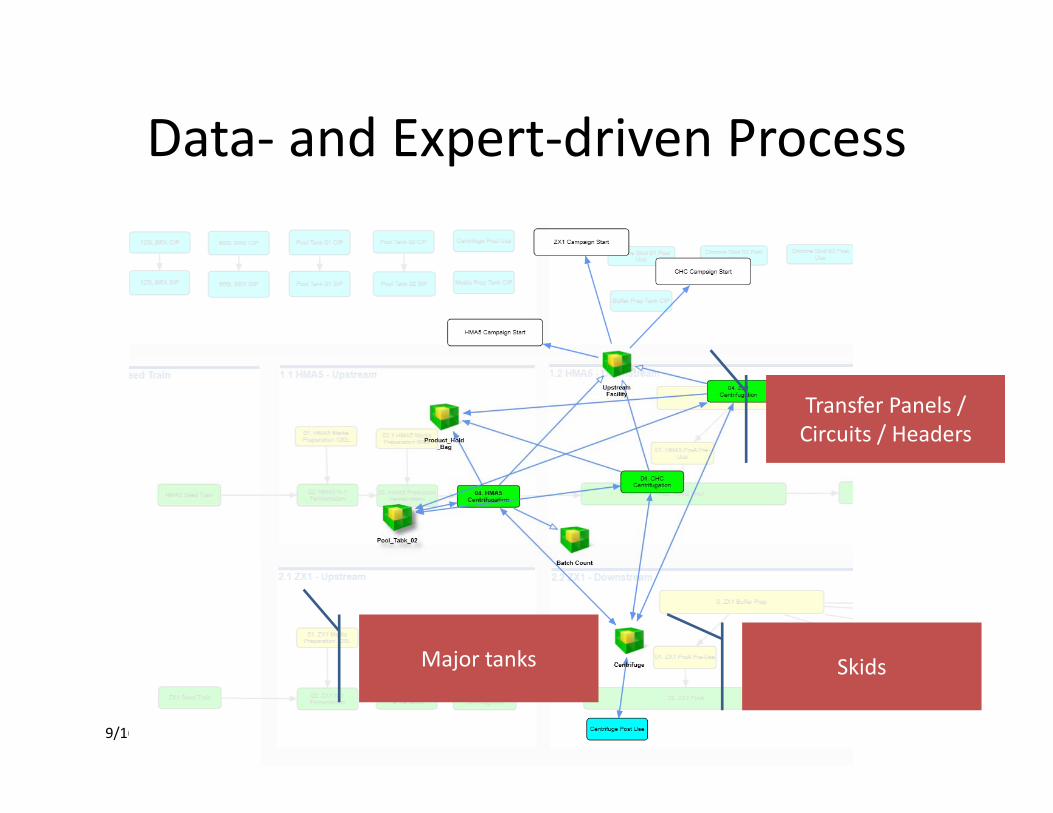
Data‐ and Expert‐driven ProcessData and Expert driven Process
9/16/2011 14
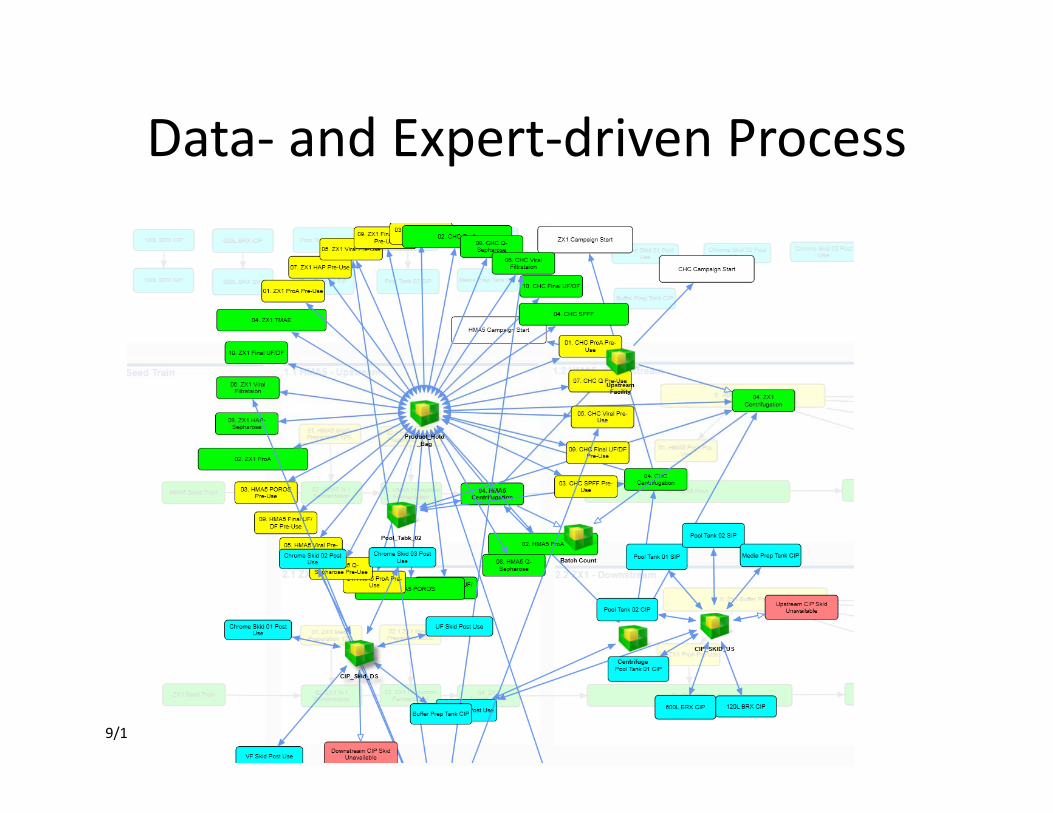
Data‐ and Expert‐driven ProcessData and Expert driven Process
Transfer Panels / Circuits / Headers
SkidsMajor tanks
9/16/2011 15
SkidsMajor tanks

Data‐ and Expert‐driven ProcessData and Expert driven Process
9/16/2011 16
Data‐ and Expert‐driven ProcessData and Expert driven Process
9/16/2011 17

I t R l ti d t i l diIncorporate Real‐time data, including in‐range and out‐of‐range
9/16/2011 18

All f t d t tAllow for non‐steady state processes, like chromatography
Overlay an ideal batch profile over the top of batches
See the deviations from the Golden Batch
9/16/2011 19

Deal with excursions
General Electric / Western Electric Rules

Relate quality attributes to process parametersProcess ParametersProcess Parameters
Outcomes
Qua
lity O
Heat map that relates critical process parameters and their
July, 2011 21
p p pimportance to quality outcomes

Perform Process Optimization / Design of Experiments
Current best objective
One DOE pointOne DOE point (‘simulation’)
9/16/2011 22
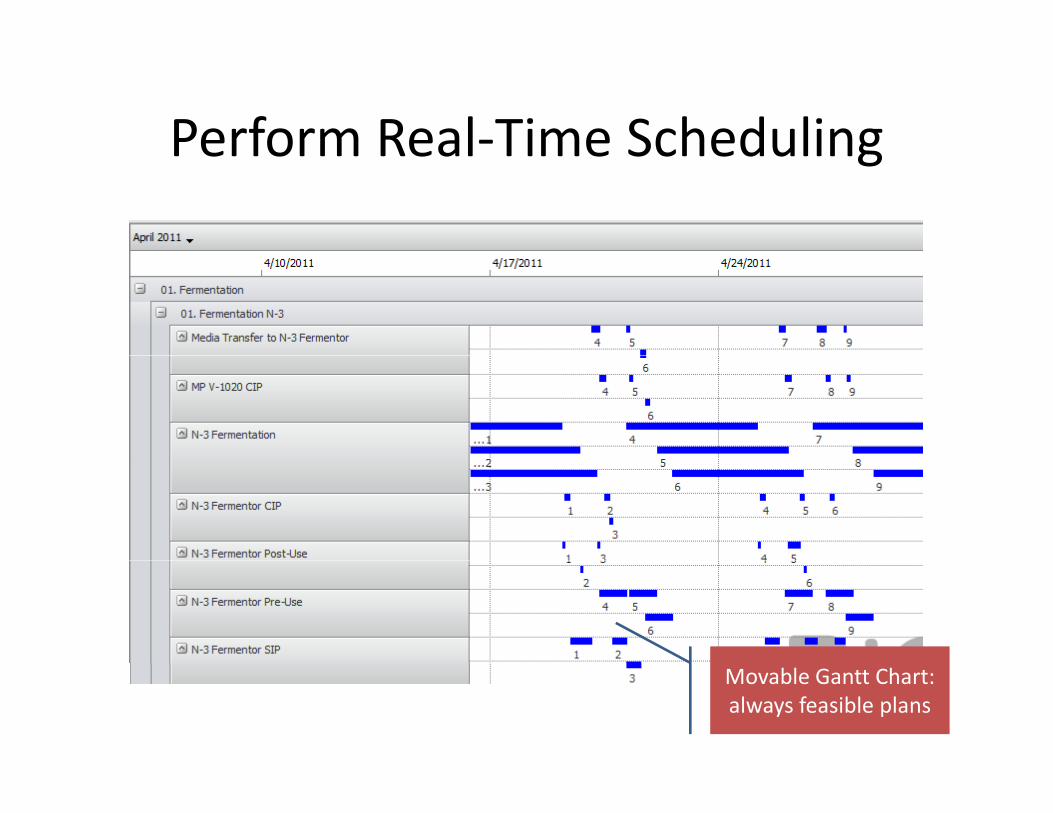
Perform Real‐Time SchedulingPerform Real Time Scheduling
Movable Gantt Chart: always feasible plans

Output Results to Outlook or GoogleOutput Results to Outlook or Google
Show Views only relevant to a single functional area
(e.g. Fermentation)

Visually see impact of changes to planVisually see impact of changes to planNo impact
Large impact
Impact quantifiedquantified

CITRIS S3 project at UC Davis Emergency Medicine Dept.

Topics Discussed (please try to hold me to about 5 min. each)(please try to hold me to about 5 min. each)
• Biopharmaceutical production and supply chains
• Self‐simulating systems (Activity Interaction)– Bio‐G implementation (Data and Expert Driven)– Citris UC Davis EMD project
• Integrated Discrete Event Simulation Experiments
• Input Modeling: Multivariate Time Series (Agents)
• Model Accreditation (Turing tests)
9/16/2011 27

Integrated Simulation ExperimentsIntegrated Simulation ExperimentsBackground – ERG modeling
Exploiting the simulated environmentSpeed – asymptotic theory “works”Observability/Control (FDE, TD, MM output)Uncertainty (Corr. Ind., Bayesian bootstrap)Recourse (Retrospective optimization)Model Resolution (Implicit tagging, M4s)( p gg g, )Explicit Causality (LP models of DEDS,
Virtual resources queueing duality)Virtual resources, queueing duality)

INTEGRATED SIMULATION MODELS/EXPERIMENTS/ANALYSIS
In Simulations Everything is Observable
MODELS/EXPERIMENTS/ANALYSIS
Can Compute Sample Path Derivatives
Can Estimate Known Parameters
For Control Variates
For Stratified Sampling
and Everything is Controllable
Can Change Factor Settings During a RunCan Change Factor Settings During a Run
Can Change Time Scaling During a Run
Can Change Laws During Run (Importance Sampling)

Discrete Event Dynamic Systems( )
Will use the language of Event Relationship Graphs (ERGs).ERGs allow different model structures to be expressed and
(DEDS)
compared without reference to a computer language or world view.
(i)t/ BA BA
After event A occurs, if condition (i) is true, then event B will be scheduled to occur after a delay of t.
Notation from Askin and Standridge

G/G/R queuePending arrival
G/G/R queue
Q = # customers in system
Data:R = 3 Servers ta = (random) interarrival timests = (random) service times
State for BANK2.MOD
s

ERG model for G/G/R queue
(Q≥R)
ERG model for G/G/R queue
(Q R)
(Q≥R)
ta ts
/
Q ‐ ‐ENTERQ++(Q≤R) s
ts/
note: run speed is insensitive to congestion

ERG model for G/G/R queue
(Q≥R)
ERG model for G/G/R queue
(Q R)
(Q≥R)
ta ts
/
ENTER Q+PUTQ+PUT
(Q≤R) sts
/
note: run speed is not insensitive to congestion
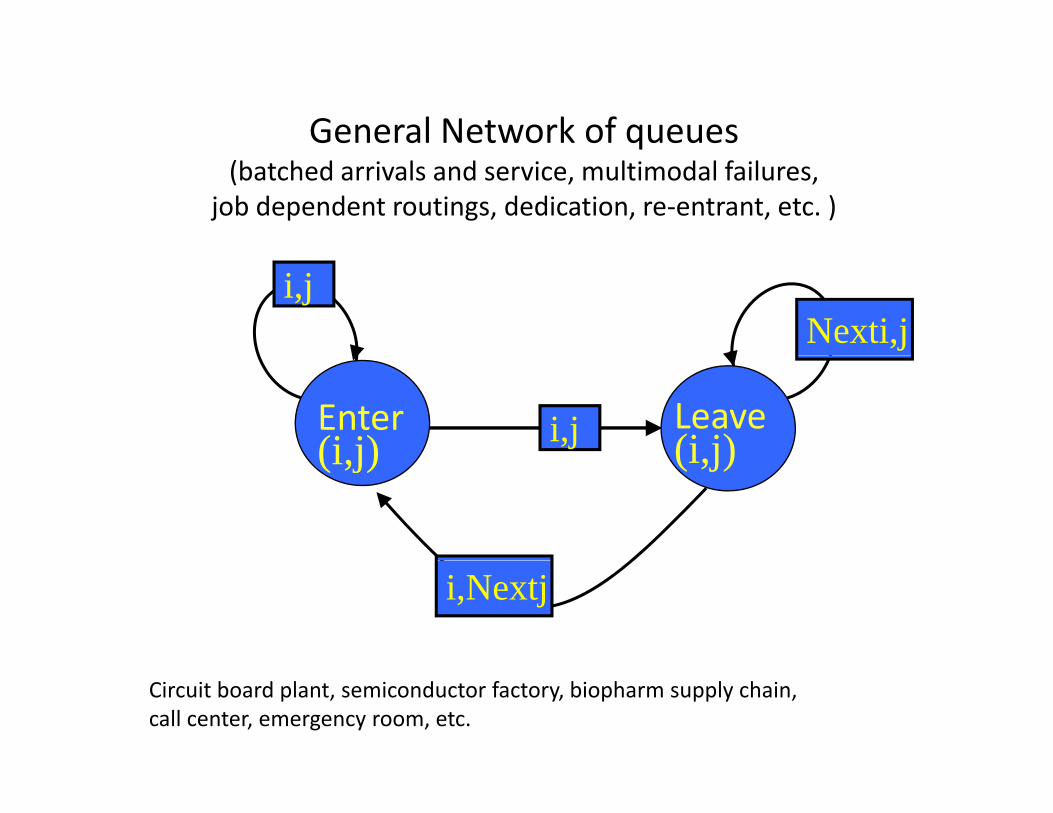
General Network of queues(batched arrivals and service, multimodal failures,
job dependent routings, dedication, re‐entrant, etc. )
Nexti,ji,j
Enter(i j) i,j Leave
(i j)(i,j) (i,j)
i,Nextj
Circuit board plant, semiconductor factory, biopharm supply chain, call center, emergency room, etc.

Experimental Analogyp gy
eg: Want to find out about the fastest car… g f(have several drivers, types of tires, and fuel mixtures, etc.)
Road Tests Simulation DOE
1. Time Trials. 1. Conventional Runs2. Several Races.3. Clone drivers and tires.4. Time Lapse Recording.
2. Simultaneous Repl.3. Event parameters.4 Importance sampling4. Time Lapse Recording.
5. Run more with fastest car.4. Importance sampling.5. Time Dilation

Experimental Methodologyp gy
eg: Want to find out which car is fastest.g(have several drivers, types of tires, and fuel mixtures.)
Road Test Simulation DOE
1. Time Trials. 1. Conventional Runs2. Several Races.3. Clone drivers and tires.4. Time Lapse Recording.
2. Simultaneous Repl.3. Event parameters.4 Importance sampling4. Time Lapse Recording.
5. Replicate the fastest car.4. Importance sampling.5. Time Dilation

Experimental MethodologyExperimental Methodology
x2y1,2
(two copies of
y2,2
(two copies ofsubmodel for X2)
y2,1y1,1
(two copies ofsubmodel for X1)
x1
submodel for X1)

12
Q[i]‐‐ Q[i]‐‐
2
12
Q++
34 34
Q[i]‐‐Q[i]‐‐
34
Single ERG for a 22 factorial design for service systems (using a common stream of job arrivals)

ERG model/design ( for any experiment)
(Q≥R)
ERG model/design ( for any experiment)
(Q R)
(Q≥R)
ta ts
/i*
ENTER Q[i]+PUTQ+PUT
(Q≤R) sts
/ i
*NHP arrivals? – Boolean thinning w.p. Q[i]=Q[i]+((i)/>RND))
note: run speed is insensitive to congestion

Meta‐model GenerationMeta model GenerationSince
k k n n1 1
R li t f ll i t i i l
j j
k k n n( p ) ( p ) ( p ) ( p )
j i , j ij 1 j 1 i 1 i 1
1 1ˆ ˆY Yn n
• Replicate full experiment in single run.
i j{Y }
k( p ) ( p )ˆ Y
• Generate time series of meta‐model parameters.
( p )ˆ{ }
i , j{ }
i
( p ) ( p )j i , j
j 1Y
:
Th d l i h
( p )i{ }
The meta‐model is the output , not computed from the output.

Time Dilation OverviewTime Dilation Overview
Run simultaneous replications at variousdesign points
Ch h i l d l iChange the time scale to spend less timeat uninteresting factor settings
Spawn new factor settings when it makes sense

Comparison with commercial “optimization” routines
• Law and McComas (2000): manufacturing system with serial work stations and AMHS transport pbuffers.
• Objective: choose optimal number of machines andObjective: choose optimal number of machines and buffers. – Every machine costs $25,000/month – Every transport buffer costs $1,000/month – Each unit produced is worth $200.
A t f d l i $4 000/10k t i l t d– Assume cost of delay is $4,000/10k parts simulated.
• Total of 34 103=81,000 possible configurations.
Law, A. M. and M. G. McComas. 2000. Simulation-based optimization. Proceedings of the 2000 Winter Simulation Conference, 46-49.
Hyden, P. 2003, Time dilation: decreasing time to decision with discrete-event simulation, PhD thesis, ORIE, Cornell Univ.

Speed to DecisionSpeed to Decision
Parts Ratio of parts Cost of Parts required
Ratio of parts required comp. to time dilation
Cost of decision
Arena 325,00 10 $130,000
ProModel 2,600,000 80 $1,040,000ProModel 2,600,000 80 $1,040,000
Witness 330,000 10 $132,000
ProModel, new version
760,000 23 $304,000
Expanding Grid Time Dilation experiments cost $ 8,790.

Topics Discussed (please try to hold me to about 5 min. each)(please try to hold me to about 5 min. each)
• Biopharmaceutical production and supply chains. p p pp y
• Designing Discrete Event Simulation Experiments
• Self‐simulating systems (Activity Interaction)– Bio‐G implementation (Data and Expert Driven)– Citris UC Davis EMD project
• Input Modeling: Multivariate Time Series (Agents) p g ( g )
• Model Accreditation (Turing tests)
9/16/2011 45
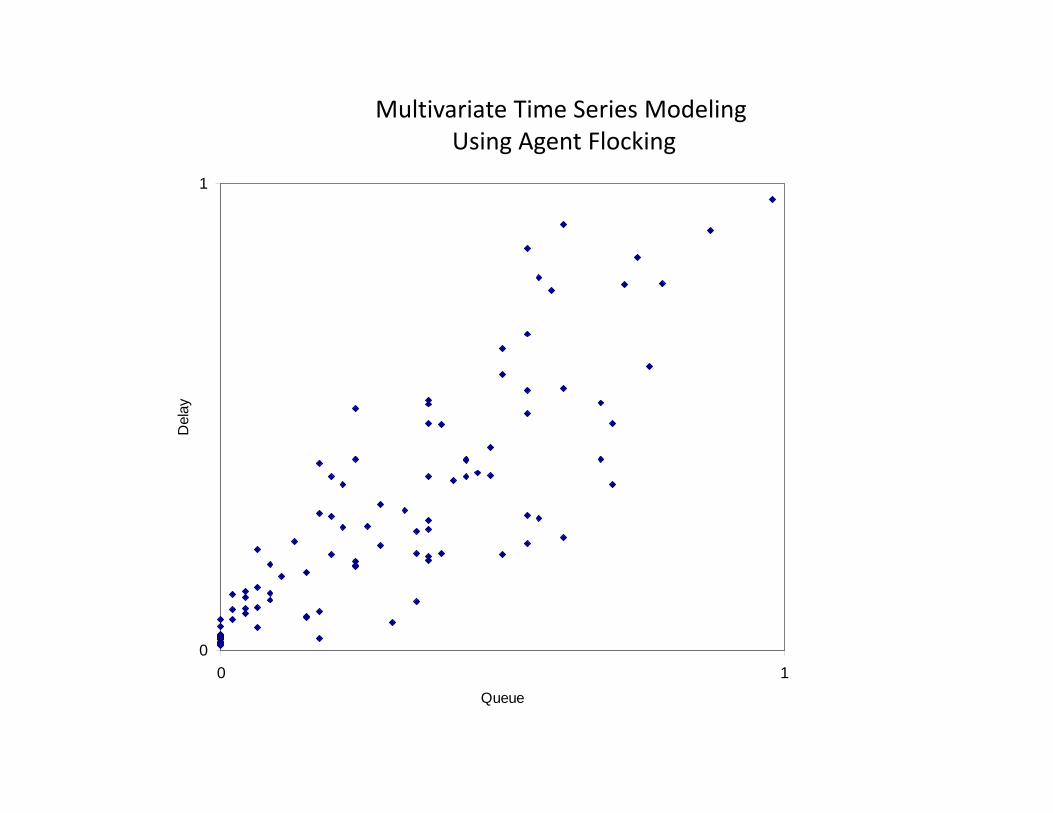
Multivariate Time Series Modeling Using Agent Flocking
1
g g gD
elay
00 1
Queue

Bi‐variate output flight path
1D
elay
00 1
Queue

Generic AlgorithmGeneric Algorithm• Start with multivariate time series data (n series)• Map each series into a N‐rectangle (Quant into hypercube)(with barriers, gravity fields, reward fields, and gradients)• The points of this series form a path
• Example: Map a 2‐dim series into [0,1]2.• Call this path the alpha boid• Call this path the alpha boid
• Simulate a flock of boids that follow this path• Map the simulated paths back to the space of the original data.Map the simulated paths back to the space of the original data.


Meta‐replicationsMeta replications 11
00 1
00 1
11
00 1
00 1
Currently Modeling EMD ( Epic ) Medical Records Information System at UCD

Topics Discussed (please try to hold me to about 5 min. each)(please try to hold me to about 5 min. each)
• Biopharmaceutical production and supply chains. p p pp y
• Designing Discrete Event Simulation Experiments
• Self‐simulating systems (Activity Interaction)– Bio‐G implementation (Data and Expert Driven)– Citris UC Davis EMD project
• Input Modeling: Multivariate Time Series (Agents) p g ( g )
• Model Accreditation (Turing tests)
9/16/2011 52

Modeling Production Systems*Modeling Production Systems
• Modern Production Systems (MES) collect every activity thatevery activity that occurs at a plant
Th k h ll• The key challenge: get accurate data, and ensure that all the perceived complexity has been correctly modeled
• Model must be correct, current,
and credible
9/16/2011 *www.bio‐g.com 53
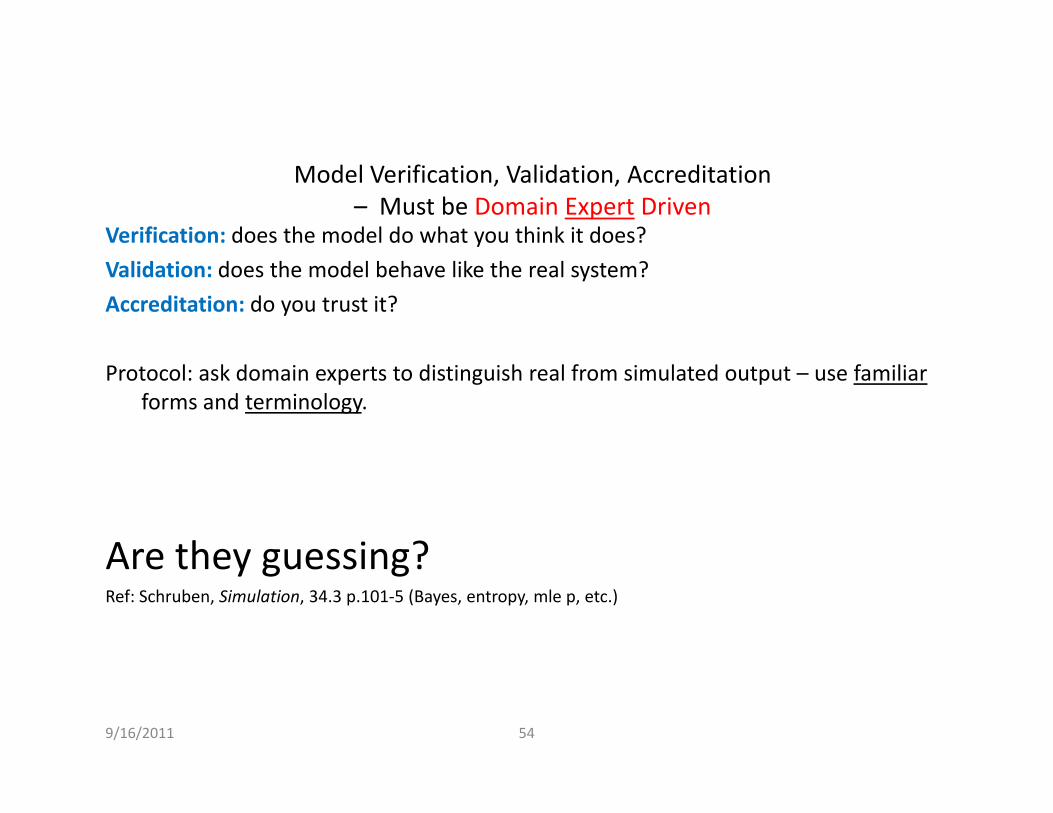
Model Verification, Validation, Accreditation – Must be Domain Expert Driven
Verification: does the model do what you think it does?Validation: does the model behave like the real system?Accreditation: do you trust it?
Protocol: ask domain experts to distinguish real from simulated output – use familiarforms and terminology.
Are they guessing?Are they guessing? Ref: Schruben, Simulation, 34.3 p.101‐5 (Bayes, entropy, mle p, etc.)
9/16/2011 54

Model AccreditationModel AccreditationGoals of an accreditation protocol:1. Design models that are ‘correct’2. Encourage user confidence in the model3 Involve users/”IS” in the model creation enrichment and maintenance3. Involve users/ IS in the model creation, enrichment, and maintenance…
All three things critical to the success of a model
9/16/2011 55

b l d lSubject Matter Expert Validation Protocol
What will happen:Key Steps
pp– Subject Matter experts are presented with a number of different
outputs from either the simulation OR from actual (historical) production datap
– Asked to choose whether the output is real or simulated, and why –written answers only, with discussion later.
“The data indicates that the 80L and 400L CIP happen at the same
“All the CIP activities often happen at once, therefore this is
b bl l d i d ”
Real?
9/16/2011 56
pptime, but we never do this”probably real production data”

Interpreting the outputs of the l d lvalidation protocol
How this helps:• If the output is real, the explanations help understand peculiarities or
other unusual patterns about the data which should be included• If the output is simulated, the explanations help improve the accuracy of p , p p p y
the simulation
User says:“Simulated” “Real”
Simulated Chance to improve
simulation
Sim may be accurate
a is
:
Real Sim may be accurate
Chance to improve
simulationThe
dat
9/16/2011 57

Users are told….Users are told….Your honest opinion is very important – it is not a competition
between the simulation and you!between the simulation and you!
In order to understand the issues properly, we would like an explanation for why you answered the way you did (this is more
)p y y y y (
important than the right or wrong answer)
First, write your answers and explanations, and then we will discuss (to prevent group‐think)prevent group think)
Getting the right and wrong answer is not the goal of the session: the goal is to help us enrich the simulation with details which we would th i h diffi lt ll tiotherwise have difficulty collecting
Guesses are perfectly fine
9/16/2011 58

Sample Questions: batch processing ftimes for a main operation
Ti (H )
Time (Hours)
Time (Hours)
Batch 1 11.72
Batch 2 12.50
Batch 3 10.93
Batch 4 13.4710.00
12.00
14.00
16.00
Batch 5 12.83
Batch 6 12.83
Batch 7 10.53
Batch 8 13.372.00
4.00
6.00
8.00
Batch 9 12.30
Batch 10 11.75
0.00Batch 1 Batch 2 Batch 3 Batch 4 Batch 5 Batch 6 Batch 7 Batch 8 Batch 9 Batch 10
Time (Hours)
Batch 1 7.58
Time (Hours)
8.20
8.40
Batch 2 7.85
Batch 3 7.25
Batch 4 7.80
Batch 5 8.03
Batch 6 7.25
7.40
7.60
7.80
8.00
9/16/2011 59
atc 6 5
Batch 7 8.28
Batch 8 8.15
Batch 9 7.856.60
6.80
7.00
7.20
Batch 1 Batch 2 Batch 3 Batch 4 Batch 5 Batch 6 Batch 7 Batch 8 Batch 9

Experimental Results: Round 1Experimental Results: Round 1
• Example: large Biopharmaceutical manufacturer
• A vertical cross‐section of people from the plant floor to the management level were simultaneously tested
G t i ll f 5 10 l l th j t d j t• Groups typically of 5‐10 people, plus the project manager and project sponsor (who did not participate in the test)
• When users found out they were getting to see outputs in familiar formats, they called another 4 people into the test (excitement!)
• Users were asked 16 questions, with no knowledge of whether each question used real or simulated information.q
9/16/2011 60

Experimental Results: Round 1Experimental Results: Round 1• Users started shouting out answers – need to keep responses to
h lthemselves• In the ‘consensus’ phase (after individual answers) many people changed
their answers to match their bosses (or bosses’ bosses)• Top level management scored lowest on the test statistically unable to• Top level management scored lowest on the test: statistically unable to
distinguish simulation from reality!• Most experienced ‘shop floor’ operators performed the best (those who
didn’t change their answers)didn t change their answers)
• Conclusion: people were able to tell the difference, even if the results p p ,were not statistically significant
9/16/2011 61
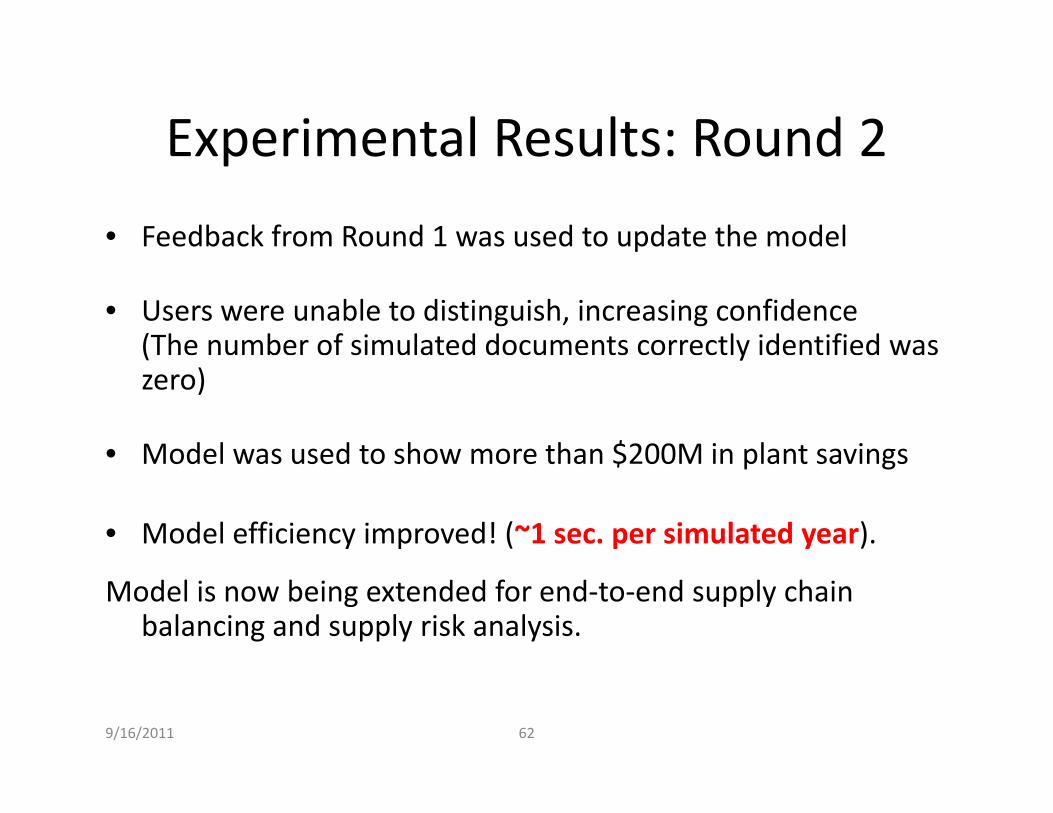
Experimental Results: Round 2Experimental Results: Round 2• Feedback from Round 1 was used to update the model
• Users were unable to distinguish, increasing confidence(The number of simulated documents correctly identified was ( yzero)
• Model was used to show more than $200M in plant savingsModel was used to show more than $200M in plant savings
• Model efficiency improved! (~1 sec. per simulated year).
Model is now being extended for end‐to‐end supply chain balancing and supply risk analysis.
9/16/2011 62
