leed gold certification cost analysis - alberta · leed gold certification cost analysis –...
TRANSCRIPT
LEED Gold Certification Cost Analysis Summary Report prepared for Alberta Infrastructure
July 30, 2008
© Deloitte & Touche LLP and affiliated entities. LEED Gold Certification Cost Analysis – Summary Report
Table of contents
Forward
Phase 1 Memo
Phase 2 Memo
Phase 3 Memo
Appendix 1 – Phase 2 Supporting Analysis
Appendix 2 – Phase 3 Supporting Analysis
Appendix 2A – Life Cycle Costing Analysis
Appendix 2B – Water Consumption Analysis
Appendix 2C – Energy Consumption Analysis
Appendix 2D – Report: 'Greening the Building and the Bottom Line'
Appendix 2E – Sustainable Building Case Studies
© Deloitte & Touche LLP and affiliated entities. LEED Gold Certification Cost Analysis – Summary Report
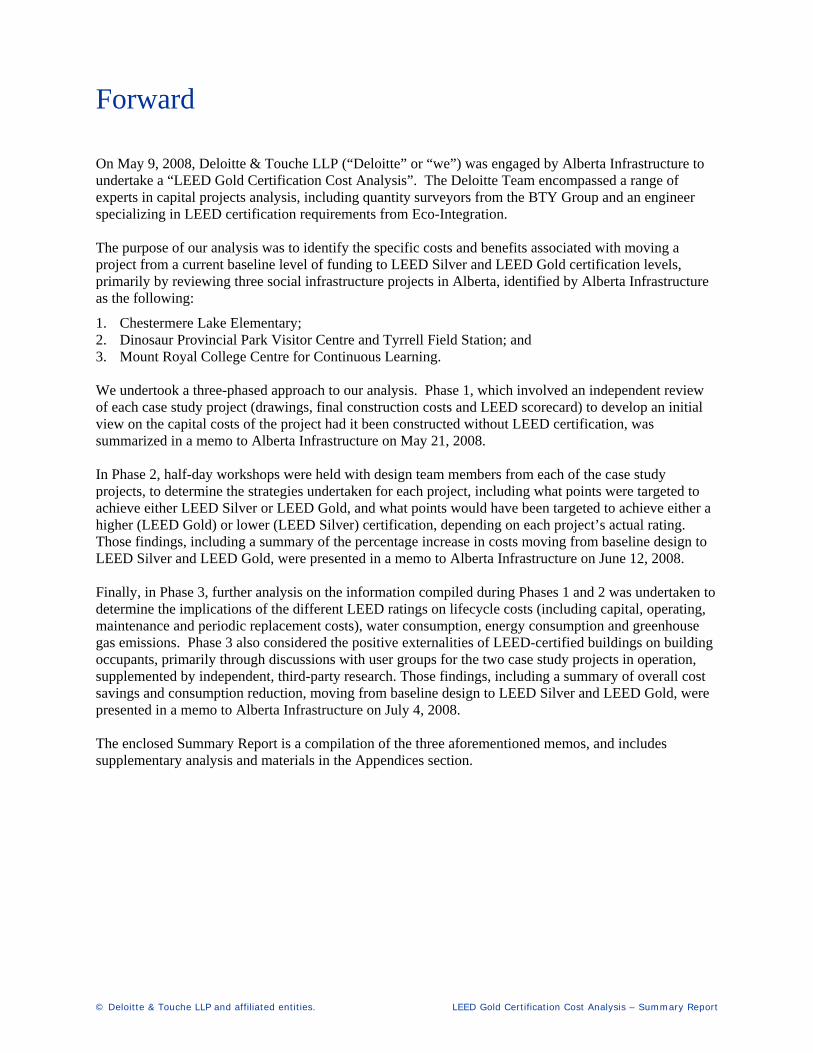
Forward
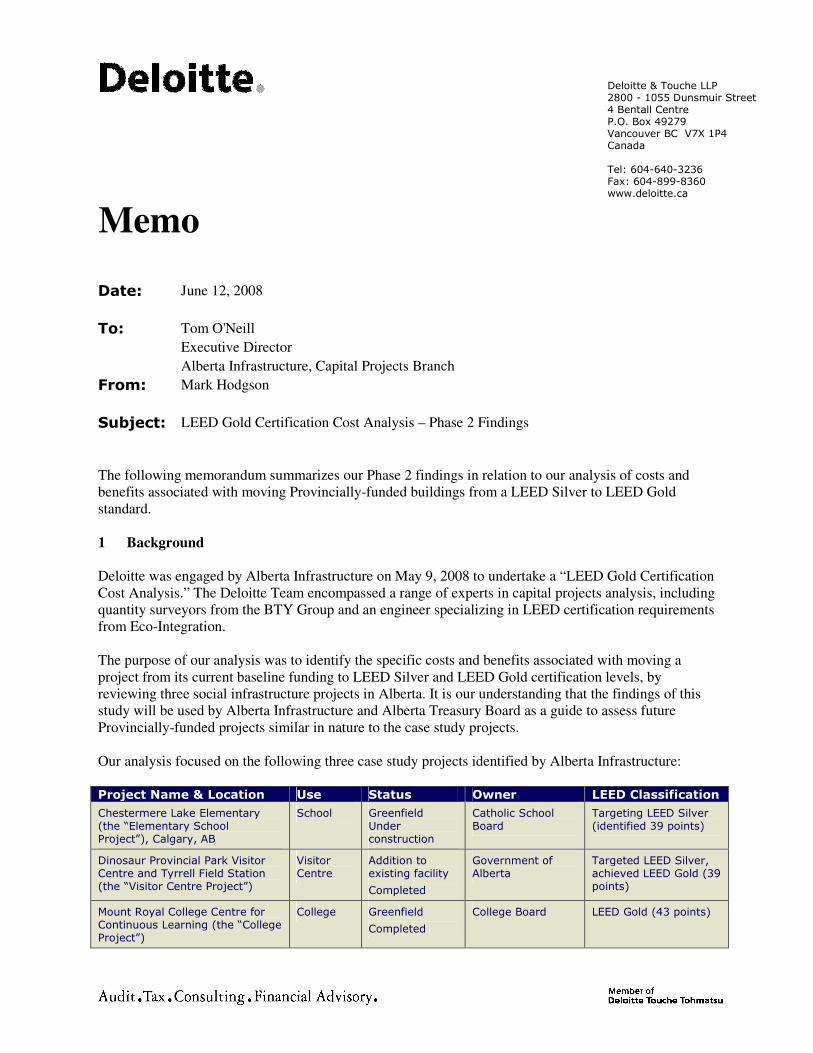
On May 9, 2008, Deloitte & Touche LLP (“Deloitte” or “we”) was engaged by Alberta Infrastructure to undertake a “LEED Gold Certification Cost Analysis”. The Deloitte Team encompassed a range of experts in capital projects analysis, including quantity surveyors from the BTY Group and an engineer specializing in LEED certification requirements from Eco-Integration. The purpose of our analysis was to identify the specific costs and benefits associated with moving a project from a current baseline level of funding to LEED Silver and LEED Gold certification levels, primarily by reviewing three social infrastructure projects in Alberta, identified by Alberta Infrastructure as the following:
1. Chestermere Lake Elementary; 2. Dinosaur Provincial Park Visitor Centre and Tyrrell Field Station; and 3. Mount Royal College Centre for Continuous Learning. We undertook a three-phased approach to our analysis. Phase 1, which involved an independent review of each case study project (drawings, final construction costs and LEED scorecard) to develop an initial view on the capital costs of the project had it been constructed without LEED certification, was summarized in a memo to Alberta Infrastructure on May 21, 2008. In Phase 2, half-day workshops were held with design team members from each of the case study projects, to determine the strategies undertaken for each project, including what points were targeted to achieve either LEED Silver or LEED Gold, and what points would have been targeted to achieve either a higher (LEED Gold) or lower (LEED Silver) certification, depending on each project’s actual rating. Those findings, including a summary of the percentage increase in costs moving from baseline design to LEED Silver and LEED Gold, were presented in a memo to Alberta Infrastructure on June 12, 2008. Finally, in Phase 3, further analysis on the information compiled during Phases 1 and 2 was undertaken to determine the implications of the different LEED ratings on lifecycle costs (including capital, operating, maintenance and periodic replacement costs), water consumption, energy consumption and greenhouse gas emissions. Phase 3 also considered the positive externalities of LEED-certified buildings on building occupants, primarily through discussions with user groups for the two case study projects in operation, supplemented by independent, third-party research. Those findings, including a summary of overall cost savings and consumption reduction, moving from baseline design to LEED Silver and LEED Gold, were presented in a memo to Alberta Infrastructure on July 4, 2008. The enclosed Summary Report is a compilation of the three aforementioned memos, and includes supplementary analysis and materials in the Appendices section.

© Deloitte & Touche LLP and affiliated entities. LEED Gold Certification Cost Analysis – Summary Report
Phase 1 Memo
Deloitte & Touche LLP
2800 - 1055 Dunsmuir Street
4 Bentall Centre
P.O. Box 49279
Vancouver BC V7X 1P4
Canada
Tel: 604-640-3236
Fax: 604-899-8360
www.deloitte.ca
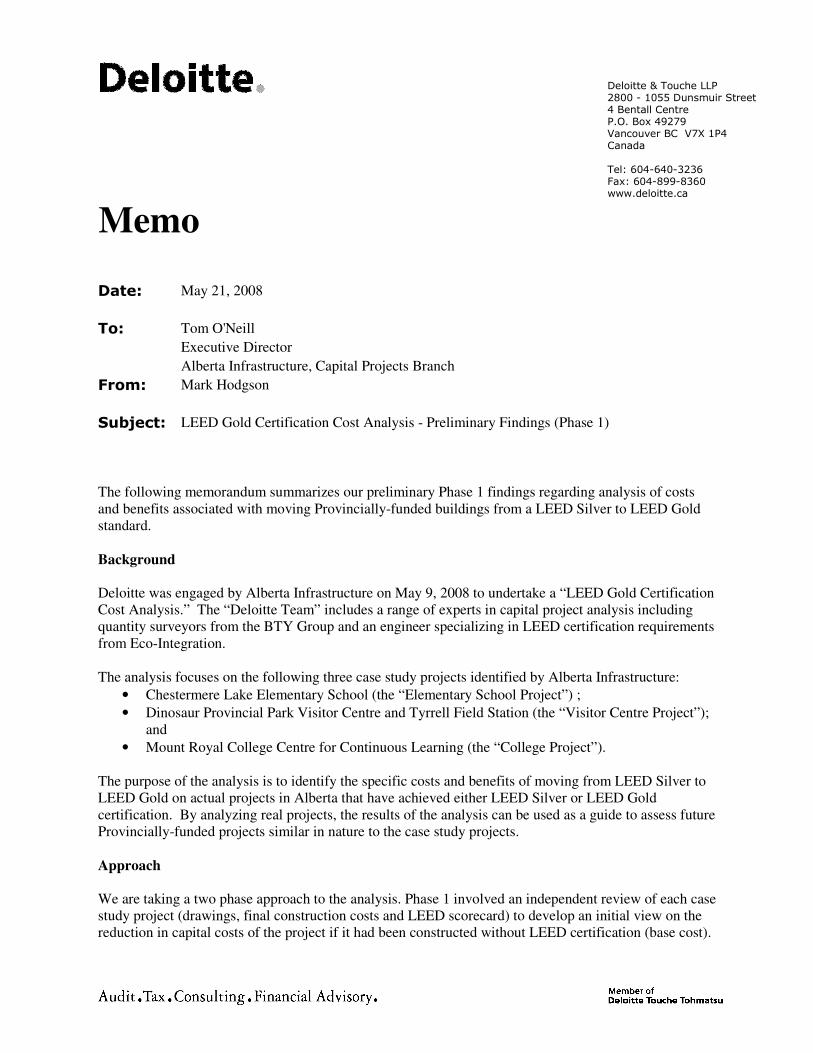
Date: May 21, 2008
To: Tom O'Neill
Executive Director
Alberta Infrastructure, Capital Projects Branch
From: Mark Hodgson
Subject: LEED Gold Certification Cost Analysis - Preliminary Findings (Phase 1)
The following memorandum summarizes our preliminary Phase 1 findings regarding analysis of costs
and benefits associated with moving Provincially-funded buildings from a LEED Silver to LEED Gold
standard.
Background Deloitte was engaged by Alberta Infrastructure on May 9, 2008 to undertake a “LEED Gold Certification
Cost Analysis.” The “Deloitte Team” includes a range of experts in capital project analysis including
quantity surveyors from the BTY Group and an engineer specializing in LEED certification requirements
from Eco-Integration.
The analysis focuses on the following three case study projects identified by Alberta Infrastructure:
• Chestermere Lake Elementary School (the “Elementary School Project”) ;
• Dinosaur Provincial Park Visitor Centre and Tyrrell Field Station (the “Visitor Centre Project”);
and
• Mount Royal College Centre for Continuous Learning (the “College Project”).
The purpose of the analysis is to identify the specific costs and benefits of moving from LEED Silver to
LEED Gold on actual projects in Alberta that have achieved either LEED Silver or LEED Gold
certification. By analyzing real projects, the results of the analysis can be used as a guide to assess future
Provincially-funded projects similar in nature to the case study projects.
Approach
We are taking a two phase approach to the analysis. Phase 1 involved an independent review of each case
study project (drawings, final construction costs and LEED scorecard) to develop an initial view on the
reduction in capital costs of the project if it had been constructed without LEED certification (base cost).
Memo
Alberta Infrastructure, Capital Projects Branch
May 21, 2008
Page 2
We also developed an initial view on design strategies or scenarios that could lead to a higher or lower
level of LEED rating by analyzing, for each case study project, each category of the LEED scorecard.
In Phase 2, half day workshops are planned with the relevant architects, LEED coordinators and
mechanical engineers that were directly involved with each of the case study projects. The workshops
will be used to confirm and/or refine the findings from Phase 1 as well as gather information relevant to
other areas of analysis such as implications of the different LEED ratings on:
• lifecycle costs;
• greenhouse gas emissions;
• water use; and
• externalities (air quality, productivity, etc).
Phase 2 will conclude with a memorandum that provides our findings on the costs and benefits of moving
Provincially-funded buildings from a LEED Silver to LEED Gold standard.
The target completion date for Phase 1 and Phase 2 is May 21, 2008 and mid June 2008 respectively.
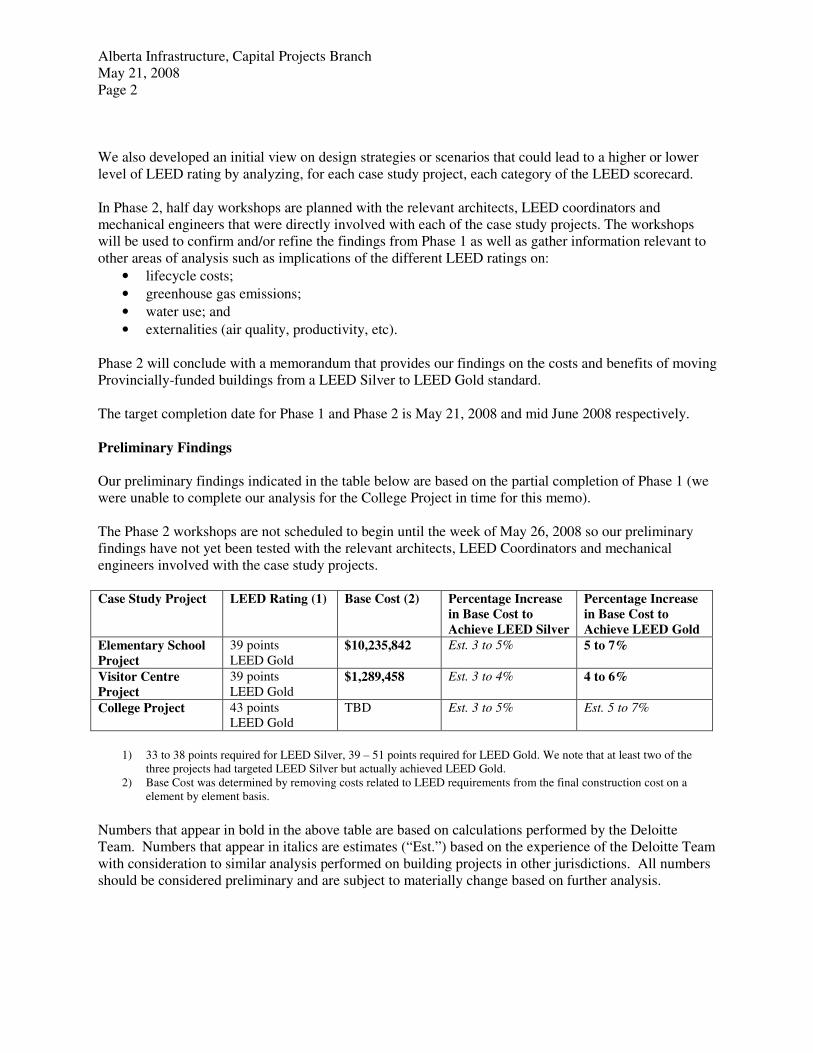
Preliminary Findings
Our preliminary findings indicated in the table below are based on the partial completion of Phase 1 (we
were unable to complete our analysis for the College Project in time for this memo).
The Phase 2 workshops are not scheduled to begin until the week of May 26, 2008 so our preliminary
findings have not yet been tested with the relevant architects, LEED Coordinators and mechanical
engineers involved with the case study projects.
Case Study Project LEED Rating (1) Base Cost (2) Percentage Increase
in Base Cost to Achieve LEED Silver
Percentage Increase in Base Cost to Achieve LEED Gold
Elementary School Project
39 points
LEED Gold $10,235,842 Est. 3 to 5% 5 to 7%
Visitor Centre Project
39 points
LEED Gold $1,289,458 Est. 3 to 4% 4 to 6%
College Project 43 points
LEED Gold
TBD Est. 3 to 5% Est. 5 to 7%
1) 33 to 38 points required for LEED Silver, 39 – 51 points required for LEED Gold. We note that at least two of the
three projects had targeted LEED Silver but actually achieved LEED Gold.
2) Base Cost was determined by removing costs related to LEED requirements from the final construction cost on a
element by element basis.
Numbers that appear in bold in the above table are based on calculations performed by the Deloitte
Team. Numbers that appear in italics are estimates (“Est.”) based on the experience of the Deloitte Team
with consideration to similar analysis performed on building projects in other jurisdictions. All numbers
should be considered preliminary and are subject to materially change based on further analysis.
Alberta Infrastructure, Capital Projects Branch
May 21, 2008
Page 3
Next Steps
After completing the base cost analysis for the College Project, the next step of the assignment involves
conducting the Phase 2 workshops.
We anticipate that the workshops will allow us to generate a much tighter range of results for the
percentage increase in base cost to move from base cost to each LEED rating. Phase 2 will also provide
the required information on the wider implications of the different LEED ratings.
Limitations
This memorandum was prepared for the exclusive use of Alberta Infrastructure, and is not to be
reproduced or used without written permission of Deloitte. No third party is entitled to rely, in any
manner or for any purpose, on this memorandum. Deloitte’s services may include advice or
recommendations, but all decisions in connection with the implementation of such advice and
recommendations shall be the responsibility of, and be made by, Alberta Infrastructure.
This memorandum relies on certain information provided by Alberta Infrastructure, and Deloitte has not
performed an independent review of this information. It does not constitute an audit conducted in
accordance with generally accepted auditing standards, an examination or compilation of, or the
performance of agreed upon procedures with respect to prospective financial information, an examination
of or any other form of assurance with respect to internal controls, or other attestation or review services
in accordance with standards or rules established by the CICA or other regulatory body.

© Deloitte & Touche LLP and affiliated entities. LEED Gold Certification Cost Analysis – Summary Report
Phase 2 Memo
Deloitte & Touche LLP 2800 - 1055 Dunsmuir Street 4 Bentall Centre P.O. Box 49279 Vancouver BC V7X 1P4 Canada Tel: 604-640-3236 Fax: 604-899-8360 www.deloitte.ca
Date: June 12, 2008
To: Tom O'Neill
Executive Director
Alberta Infrastructure, Capital Projects Branch
From: Mark Hodgson
Subject: LEED Gold Certification Cost Analysis – Phase 2 Findings
The following memorandum summarizes our Phase 2 findings in relation to our analysis of costs and
benefits associated with moving Provincially-funded buildings from a LEED Silver to LEED Gold
standard.
1 Background Deloitte was engaged by Alberta Infrastructure on May 9, 2008 to undertake a “LEED Gold Certification
Cost Analysis.” The Deloitte Team encompassed a range of experts in capital projects analysis, including
quantity surveyors from the BTY Group and an engineer specializing in LEED certification requirements
from Eco-Integration.
The purpose of our analysis was to identify the specific costs and benefits associated with moving a
project from its current baseline funding to LEED Silver and LEED Gold certification levels, by
reviewing three social infrastructure projects in Alberta. It is our understanding that the findings of this
study will be used by Alberta Infrastructure and Alberta Treasury Board as a guide to assess future
Provincially-funded projects similar in nature to the case study projects.
Our analysis focused on the following three case study projects identified by Alberta Infrastructure:
Project Name & Location Use Status Owner LEED Classification
Chestermere Lake Elementary (the “Elementary School Project”), Calgary, AB
School Greenfield Under construction
Catholic School Board
Targeting LEED Silver (identified 39 points)
Dinosaur Provincial Park Visitor Centre and Tyrrell Field Station (the “Visitor Centre Project”)
Visitor Centre
Addition to existing facility
Completed
Government of Alberta
Targeted LEED Silver, achieved LEED Gold (39 points)
Mount Royal College Centre for Continuous Learning (the “College Project”)
College Greenfield
Completed
College Board LEED Gold (43 points)
Memo
Alberta Infrastructure, Capital Projects Branch
June 12, 2008
Page 2
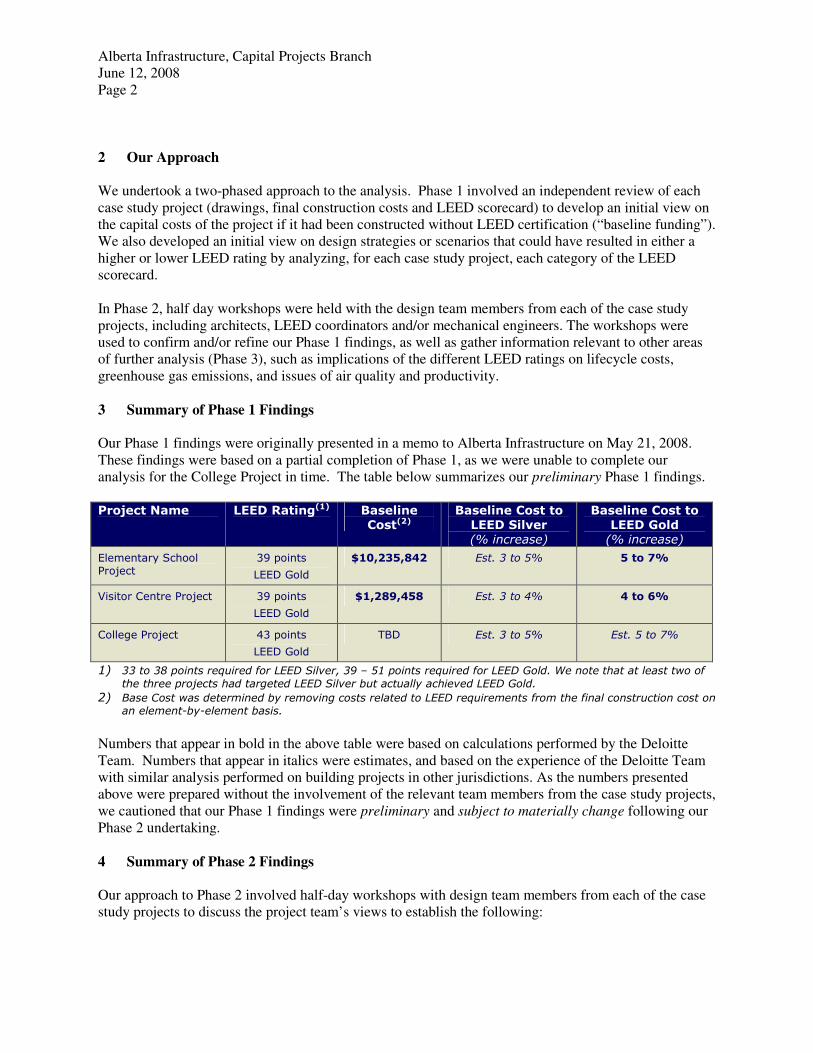
2 Our Approach
We undertook a two-phased approach to the analysis. Phase 1 involved an independent review of each
case study project (drawings, final construction costs and LEED scorecard) to develop an initial view on
the capital costs of the project if it had been constructed without LEED certification (“baseline funding”).
We also developed an initial view on design strategies or scenarios that could have resulted in either a
higher or lower LEED rating by analyzing, for each case study project, each category of the LEED
scorecard.
In Phase 2, half day workshops were held with the design team members from each of the case study
projects, including architects, LEED coordinators and/or mechanical engineers. The workshops were
used to confirm and/or refine our Phase 1 findings, as well as gather information relevant to other areas
of further analysis (Phase 3), such as implications of the different LEED ratings on lifecycle costs,
greenhouse gas emissions, and issues of air quality and productivity.
3 Summary of Phase 1 Findings
Our Phase 1 findings were originally presented in a memo to Alberta Infrastructure on May 21, 2008.
These findings were based on a partial completion of Phase 1, as we were unable to complete our
analysis for the College Project in time. The table below summarizes our preliminary Phase 1 findings.
Project Name LEED Rating(1) Baseline
Cost(2) Baseline Cost to LEED Silver (% increase)
Baseline Cost to LEED Gold
(% increase)
Elementary School Project
39 points
LEED Gold
$10,235,842 Est. 3 to 5% 5 to 7%
Visitor Centre Project 39 points
LEED Gold
$1,289,458 Est. 3 to 4% 4 to 6%
College Project 43 points
LEED Gold
TBD Est. 3 to 5% Est. 5 to 7%
1) 33 to 38 points required for LEED Silver, 39 – 51 points required for LEED Gold. We note that at least two of
the three projects had targeted LEED Silver but actually achieved LEED Gold.
2) Base Cost was determined by removing costs related to LEED requirements from the final construction cost on an element-by-element basis.
Numbers that appear in bold in the above table were based on calculations performed by the Deloitte
Team. Numbers that appear in italics were estimates, and based on the experience of the Deloitte Team
with similar analysis performed on building projects in other jurisdictions. As the numbers presented
above were prepared without the involvement of the relevant team members from the case study projects,
we cautioned that our Phase 1 findings were preliminary and subject to materially change following our
Phase 2 undertaking.
4 Summary of Phase 2 Findings Our approach to Phase 2 involved half-day workshops with design team members from each of the case
study projects to discuss the project team’s views to establish the following:
Alberta Infrastructure, Capital Projects Branch
June 12, 2008
Page 3
• Baseline design: what the project brief would have been if there was no LEED requirement (but
still within Alberta Infrastructure guidelines);
• LEED Silver: what strategies would have been undertaken for the project and what possible 36
points would have been targeted for LEED Silver (in some cases this meant eliminating
strategies to bring the project back to LEED Silver); and
• LEED Gold: what strategies would have been undertaken for the project and what possible 42
points would have been targeted for LEED Gold.
Workshop participants were also asked to discuss their views on the implications of different LEED
ratings on lifecycle costs, greenhouse gas emissions, and issues of air quality and productivity.
The half-day workshops were held in Calgary on May 27, June 3 and June 4. Following the half-day
workshops, the Deloitte Team used the information gathered during workshop sessions to refine the
preliminary Phase 1 findings. The results of our analyses are presented below.
4.1 Elementary School Project
The half-day workshop for the Elementary School Project was held on May 27, 2008. Workshop
attendees included the following:
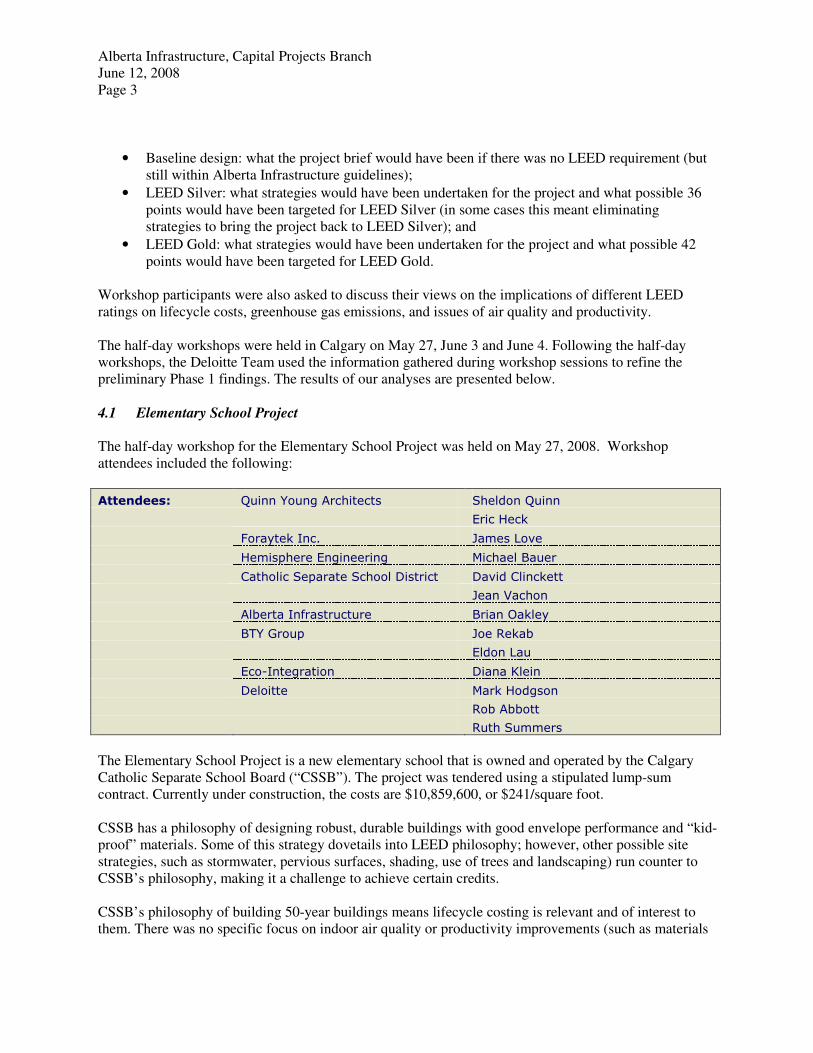
Attendees: Quinn Young Architects Sheldon Quinn
Eric Heck
Foraytek Inc. James Love
Hemisphere Engineering Michael Bauer
Catholic Separate School District David Clinckett
Jean Vachon
Alberta Infrastructure Brian Oakley
BTY Group Joe Rekab
Eldon Lau
Eco-Integration Diana Klein
Deloitte Mark Hodgson
Rob Abbott
Ruth Summers
The Elementary School Project is a new elementary school that is owned and operated by the Calgary
Catholic Separate School Board (“CSSB”). The project was tendered using a stipulated lump-sum
contract. Currently under construction, the costs are $10,859,600, or $241/square foot.
CSSB has a philosophy of designing robust, durable buildings with good envelope performance and “kid-
proof” materials. Some of this strategy dovetails into LEED philosophy; however, other possible site
strategies, such as stormwater, pervious surfaces, shading, use of trees and landscaping) run counter to
CSSB’s philosophy, making it a challenge to achieve certain credits.
CSSB’s philosophy of building 50-year buildings means lifecycle costing is relevant and of interest to
them. There was no specific focus on indoor air quality or productivity improvements (such as materials
Alberta Infrastructure, Capital Projects Branch
June 12, 2008
Page 4
with low VOC’s, green space, views, good ventilation, etc). Reduction of greenhouse gas emissions was
not identified as a goal for the project.
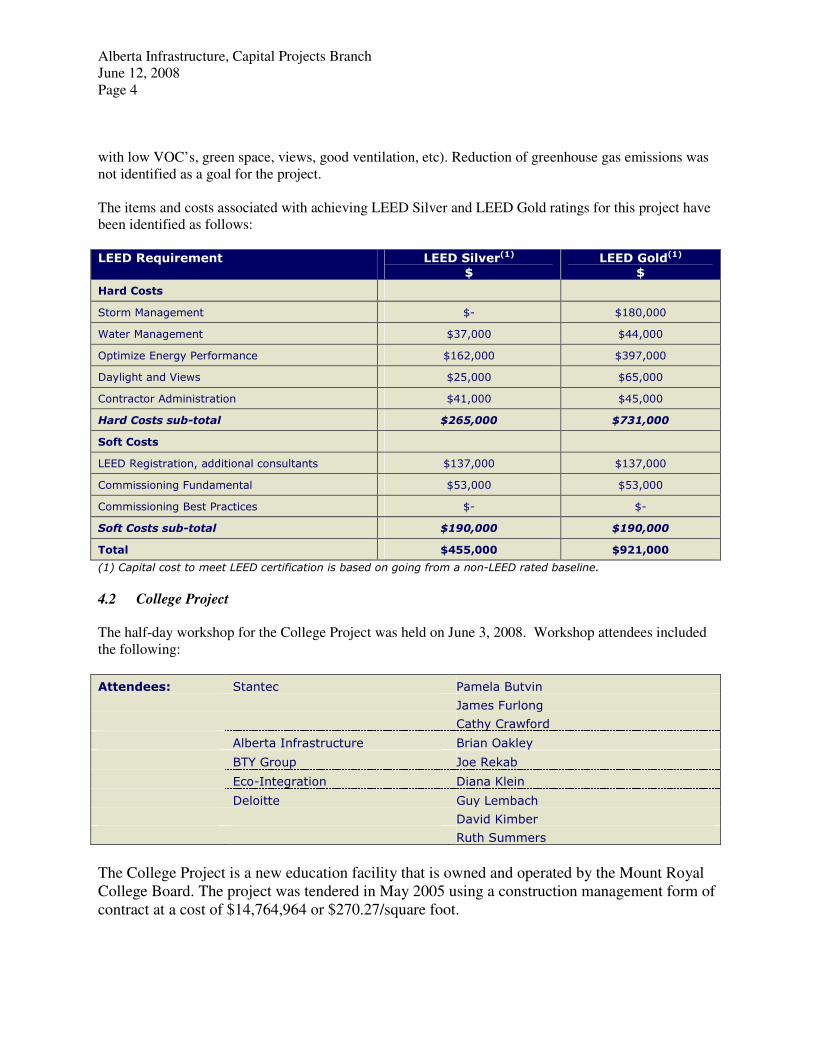
The items and costs associated with achieving LEED Silver and LEED Gold ratings for this project have
been identified as follows:
LEED Requirement LEED Silver(1)
$ LEED Gold(1)
$
Hard Costs
Storm Management $- $180,000
Water Management $37,000 $44,000
Optimize Energy Performance $162,000 $397,000
Daylight and Views $25,000 $65,000
Contractor Administration $41,000 $45,000
Hard Costs sub-total $265,000 $731,000
Soft Costs
LEED Registration, additional consultants $137,000 $137,000
Commissioning Fundamental $53,000 $53,000
Commissioning Best Practices $- $-
Soft Costs sub-total $190,000 $190,000
Total $455,000 $921,000
(1) Capital cost to meet LEED certification is based on going from a non-LEED rated baseline.
4.2 College Project
The half-day workshop for the College Project was held on June 3, 2008. Workshop attendees included
the following:
Attendees: Stantec Pamela Butvin
James Furlong
Cathy Crawford
Alberta Infrastructure Brian Oakley
BTY Group Joe Rekab
Eco-Integration Diana Klein
Deloitte Guy Lembach
David Kimber
Ruth Summers
The College Project is a new education facility that is owned and operated by the Mount Royal
College Board. The project was tendered in May 2005 using a construction management form of
contract at a cost of $14,764,964 or $270.27/square foot.
Alberta Infrastructure, Capital Projects Branch
June 12, 2008
Page 5
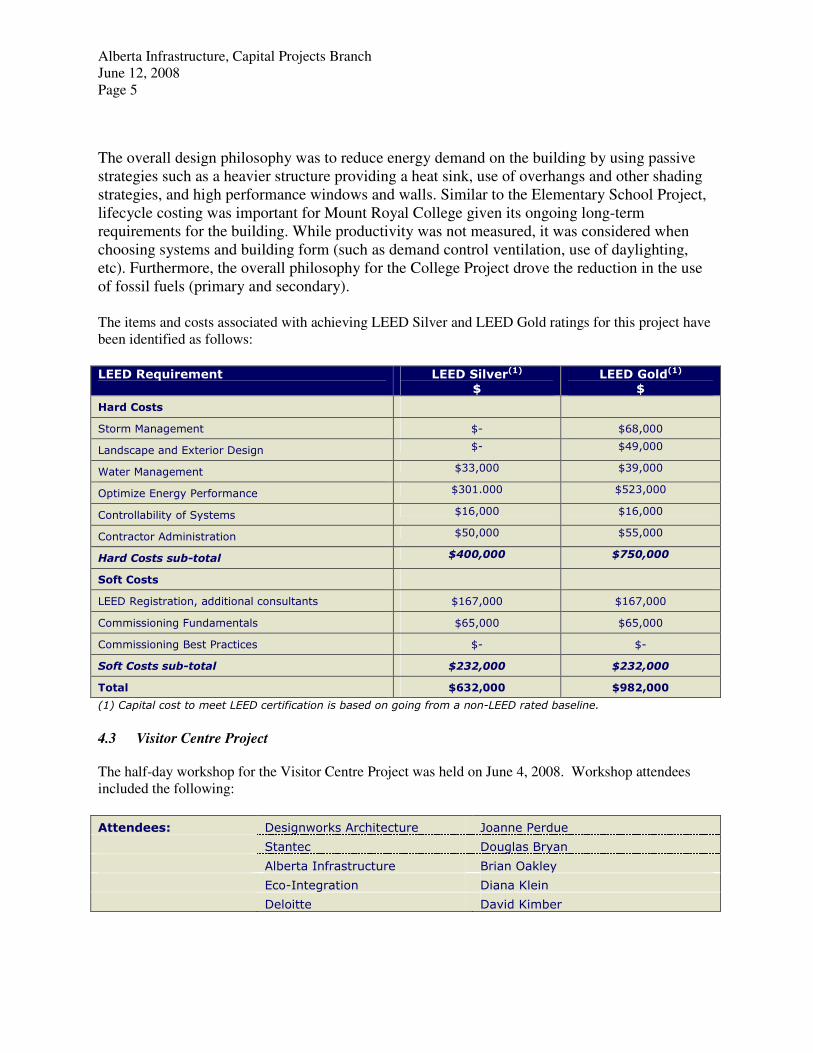
The overall design philosophy was to reduce energy demand on the building by using passive
strategies such as a heavier structure providing a heat sink, use of overhangs and other shading
strategies, and high performance windows and walls. Similar to the Elementary School Project,
lifecycle costing was important for Mount Royal College given its ongoing long-term
requirements for the building. While productivity was not measured, it was considered when
choosing systems and building form (such as demand control ventilation, use of daylighting,
etc). Furthermore, the overall philosophy for the College Project drove the reduction in the use
of fossil fuels (primary and secondary).
The items and costs associated with achieving LEED Silver and LEED Gold ratings for this project have
been identified as follows:
LEED Requirement LEED Silver(1)
$ LEED Gold(1)
$
Hard Costs
Storm Management $- $68,000
Landscape and Exterior Design $- $49,000
Water Management $33,000 $39,000
Optimize Energy Performance $301.000 $523,000
Controllability of Systems $16,000 $16,000
Contractor Administration $50,000 $55,000
Hard Costs sub-total $400,000 $750,000
Soft Costs
LEED Registration, additional consultants $167,000 $167,000
Commissioning Fundamentals $65,000 $65,000
Commissioning Best Practices $- $-
Soft Costs sub-total $232,000 $232,000
Total $632,000 $982,000
(1) Capital cost to meet LEED certification is based on going from a non-LEED rated baseline.
4.3 Visitor Centre Project
The half-day workshop for the Visitor Centre Project was held on June 4, 2008. Workshop attendees
included the following:
Attendees: Designworks Architecture Joanne Perdue
Stantec Douglas Bryan
Alberta Infrastructure Brian Oakley
Eco-Integration Diana Klein
Deloitte David Kimber

Alberta Infrastructure, Capital Projects Branch
June 12, 2008
Page 6
The Visitor Centre Project is a new addition to the existing Tyrrell Field Station in Dinosaur Provincial
Park, and is owned and operated by the Government of Alberta. The project was tendered in October
2004 using a stipulated lump sum form of contract with a tendered cost of $1,346,200 or $250/square
foot.
The Visitor Centre Project is situated in an ecologically sensitive area where protection of the
environment was paramount; subsequently, many of the LEED requirements were baseline requirements.
In addition, the area is a naturally eroding area and arid; therefore, minimizing the building footprint and
water usage were important considerations. As a result, baseline ecological and sustainability costs are
quite high.
Lifecycle costs were important considerations since the building is provincially owned and designed and
built to be operational for many years. Calculations for the payback of selected systems were undertaken
as part of the design modelling exercise, and factored into the decision-making process.
Materials and systems (natural ventilation, natural light, controls, etc) were selected to create a healthy
and comfortable indoor environment; however, they were not identified in such a way as to measure
success. In addition, the Visitor Centre Project has few staff; combined with many transient visitors, it
will be difficult to assess the long-term effects of being in the building. While greenhouse gas emissions
were not identified as a specific strategy, the design sought to maximize passive and natural systems
(natural ventilation, daylighting, etc) which, in turn, reduced the use of fossil fuels (primary and
secondary).
The items and costs associated with achieving LEED Silver and LEED Gold ratings for this project have
been identified as follows:
LEED Requirement LEED Silver(1)
$ LEED Gold(1)
$
Hard Costs
Water Management $6,000 $41,000
Minimum Energy Performance $41,000 $54,000
Measurement and Verification $- $-
Indoor Chemical and Pollutant Source Control $- $4,000
Construction Administration $18,000 $20,000
Hard Costs sub-total $65,000 $119,000
Soft Costs
Additional Project and Professional Design Coordinates
$111,000 $111,000
Commissioning Fundamentals $40,000 $40,000
Commissioning Best Practices $- $-
Soft Costs sub-total $151,000 $151,000
Total $216,000 $270,000
(1) Capital cost to meet LEED certification is based on going from a non-LEED rated baseline.
Alberta Infrastructure, Capital Projects Branch
June 12, 2008
Page 7
5 Conclusion
Based on the results of our undertakings in Phase 2, the following tables provide a summary of the
percentage increase in hard and soft costs, moving from baseline to LEED Silver to LEED Gold. We note
the baseline costs do not account for soft project costs, which is why the hard and soft costs associated
with the target LEED rating have been delineated in the following analyses.
Project Name LEED Rating Baseline
Cost(1) Baseline to LEED
Silver
(Hard Costs) ($/% increase)
Baseline to LEED Gold
(Hard Costs) ($/% increase)
Elementary School Project
39 points
LEED Gold
$10,594,600
$265,000/
2.5% of baseline
$731,000/
6.9% of baseline
Visitor Centre Project 39 points
LEED Gold
$1,227,200 $65,000/
5.3% of baseline
$119,000/
9.7% of baseline
College Project 43 points
LEED Gold
$14,014,964 $400,000/
2.9% of baseline
$750,000/
5.4% of baseline
1) Baseline costs were refined from the Phase 1 analysis, as a result of information provided during the half-day workshops.
Project Name LEED Rating Baseline
Cost(1) Baseline to LEED
Silver
(Soft Costs) ($/% increase)
Baseline to LEED Gold
(Soft Costs) ($/% increase)
Elementary School Project
39 points
LEED Gold
$10,594,600
$190,000/
1.8% of baseline
$190,000/
1.8% of baseline
Visitor Centre Project 39 points
LEED Gold
$1,227,200 $151,000/
12.3% of baseline
$151,000/
12.3% of baseline
College Project 43 points
LEED Gold
$14,014,964 $232,000/
1.7% of baseline
$232,000/
1.7% of baseline
1) Baseline costs were refined from the Phase 1 analysis, as a result of information provided during the half-day workshops.
6 Limitations
This memorandum was prepared for the exclusive use of Alberta Infrastructure, and is not to be
reproduced or used without written permission of Deloitte. No third party is entitled to rely, in any
manner or for any purpose, on this memorandum. Deloitte’s services may include advice or
recommendations, but all decisions in connection with the implementation of such advice and
recommendations shall be the responsibility of, and be made by, Alberta Infrastructure.
This memorandum relies on certain information provided by Alberta Infrastructure, and Deloitte has not
performed an independent review of this information. It does not constitute an audit conducted in
accordance with generally accepted auditing standards, an examination or compilation of, or the
performance of agreed upon procedures with respect to prospective financial information, an examination
of or any other form of assurance with respect to internal controls, or other attestation or review services
in accordance with standards or rules established by the CICA or other regulatory body.
© Deloitte & Touche LLP and affiliated entities. LEED Gold Certification Cost Analysis – Summary Report
Phase 3 Memo
Deloitte & Touche LLP 2800 - 1055 Dunsmuir Street 4 Bentall Centre P.O. Box 49279 Vancouver BC V7X 1P4 Canada Tel: 604-640-3236 Fax: 604-899-8360 www.deloitte.ca
Date: July 4, 2008
To: Tom O'Neill
Executive Director
Alberta Infrastructure, Capital Projects Branch
From: Mark Hodgson
Subject: LEED Gold Certification Cost Analysis – Phase 3 Findings
The following memorandum summarizes our Phase 3 findings in relation to our analysis of costs and
benefits associated with moving Provincially-funded buildings from a LEED Silver to LEED Gold
standard.
1 Background Deloitte was engaged by Alberta Infrastructure on May 9, 2008 to undertake a “LEED Gold Certification
Cost Analysis”. The Deloitte Team encompassed a range of experts in capital projects analysis, including
quantity surveyors from the BTY Group and an engineer specializing in LEED certification requirements
from Eco-Integration.
The purpose of our analysis was to identify the specific costs and benefits associated with moving a
project from its current baseline funding to LEED Silver and LEED Gold certification levels, by
reviewing three social infrastructure projects in Alberta. It is our understanding that the findings of this
study will be used by Alberta Infrastructure and Alberta Treasury Board as a guide to assess future
Provincially-funded projects similar in nature to the case study projects.
Our analysis focused on the following three case study projects identified by Alberta Infrastructure:
Project Name & Location Use Status Owner LEED Classification
Chestermere Lake Elementary (the “Elementary School Project”), Calgary, AB
School Greenfield Under construction
Catholic School Board
Targeting LEED Silver (identified 39 points)
Dinosaur Provincial Park Visitor Centre and Tyrrell Field Station (the “Visitor Centre Project”)
Visitor Centre
Addition to existing facility
Completed
Government of Alberta
Targeted LEED Silver, achieved LEED Gold (39 points)
Mount Royal College Centre for Continuous Learning (the “College Project”)
College Greenfield
Completed
College Board LEED Gold (43 points)
Memo
Alberta Infrastructure, Capital Projects Branch
July 4, 2008
Page 2
2 Our Approach
The following approach was undertaken to conduct our analysis. Phase 1 involved an independent review
of each case study project (drawings, final construction costs and LEED scorecard) to develop an initial
view on the capital costs of the project if it had been constructed without LEED certification (the
“Baseline” design). In Phase 2, half day workshops were held with the design team members from each of
the case study projects, to determine:
• Strategies undertaken for the project and what possible 36 points would have been targeted for
LEED Silver (in some of the project cases this meant eliminating strategies to bring the projects
back to LEED Silver); and
• Strategies were undertaken for the project and what possible 42 points would have been targeted
for LEED Gold.
The workshops allowed us to confirm and/or refine our Phase 1 findings, as well as gather information
relevant to other areas of further analysis (Phase 3).
Phase 3 involved analyzing the information compiled during Phases 1 and 2 to determine the implications
of the different LEED ratings on lifecycle costs (including capital, operating, maintenance and periodic
replacement costs), water consumption, energy consumption and greenhouse gas emissions. In some
cases, follow-up correspondence with workshop participants was required to obtain additional
information. Phase 3 also considered the positive externalities of LEED-certified buildings on building
occupants, primarily through discussions with user groups for two of the three case study projects (note
that the Elementary School Project was still being constructed at the time of this report). Third-party
independent research was also reviewed to complement and validate our findings.
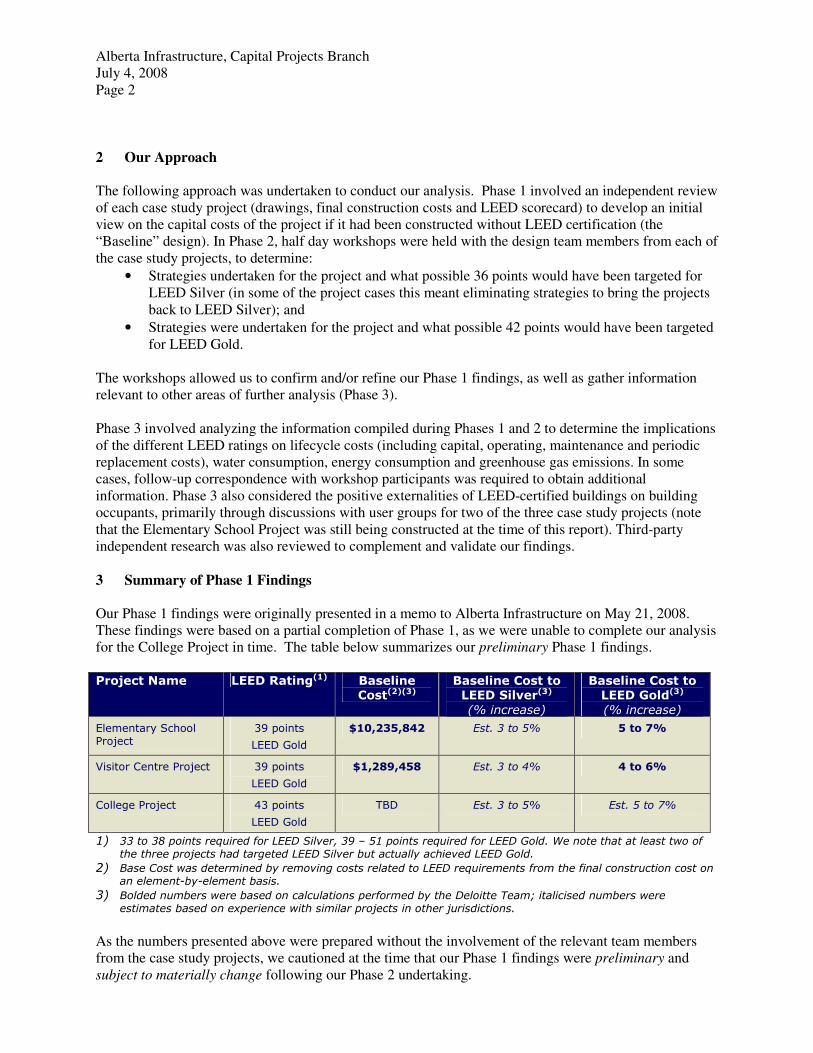
3 Summary of Phase 1 Findings
Our Phase 1 findings were originally presented in a memo to Alberta Infrastructure on May 21, 2008.
These findings were based on a partial completion of Phase 1, as we were unable to complete our analysis
for the College Project in time. The table below summarizes our preliminary Phase 1 findings.
Project Name LEED Rating(1) Baseline
Cost(2)(3) Baseline Cost to LEED Silver(3)
(% increase)
Baseline Cost to LEED Gold(3)
(% increase)
Elementary School Project
39 points
LEED Gold
$10,235,842 Est. 3 to 5% 5 to 7%
Visitor Centre Project 39 points
LEED Gold
$1,289,458 Est. 3 to 4% 4 to 6%
College Project 43 points
LEED Gold
TBD Est. 3 to 5% Est. 5 to 7%
1) 33 to 38 points required for LEED Silver, 39 – 51 points required for LEED Gold. We note that at least two of the three projects had targeted LEED Silver but actually achieved LEED Gold.
2) Base Cost was determined by removing costs related to LEED requirements from the final construction cost on an element-by-element basis.
3) Bolded numbers were based on calculations performed by the Deloitte Team; italicised numbers were estimates based on experience with similar projects in other jurisdictions.
As the numbers presented above were prepared without the involvement of the relevant team members
from the case study projects, we cautioned at the time that our Phase 1 findings were preliminary and
subject to materially change following our Phase 2 undertaking.
Alberta Infrastructure, Capital Projects Branch
July 4, 2008
Page 3
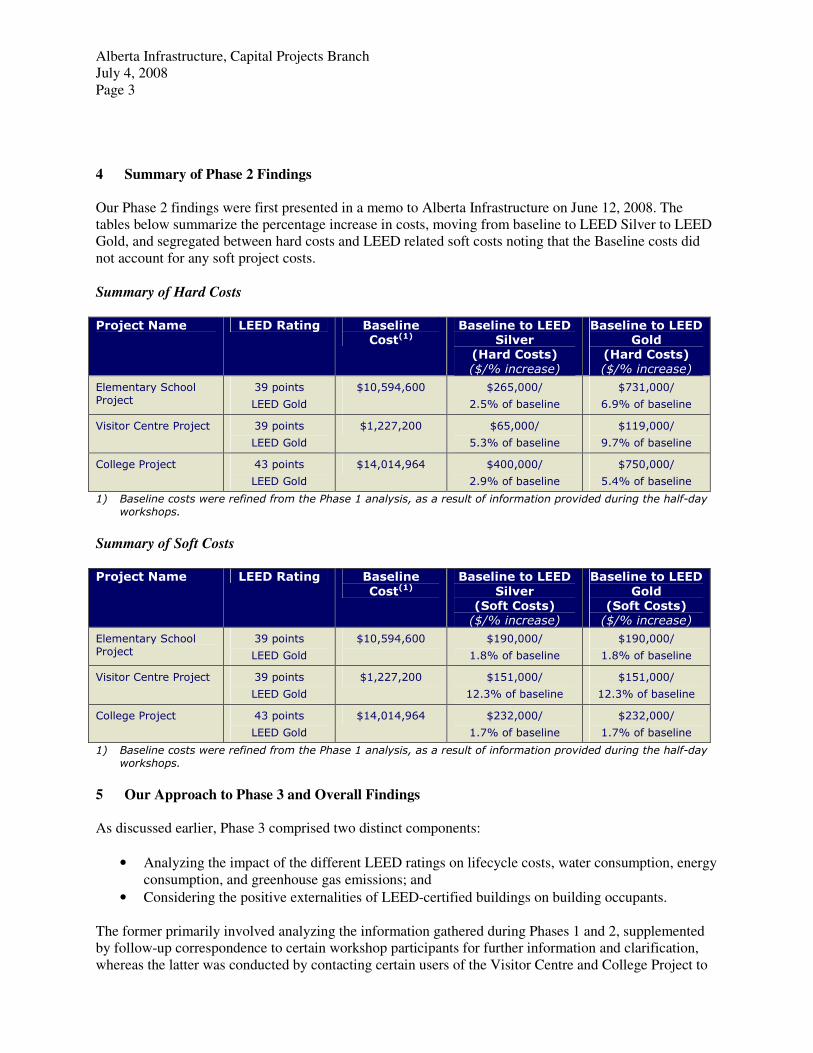
4 Summary of Phase 2 Findings Our Phase 2 findings were first presented in a memo to Alberta Infrastructure on June 12, 2008. The
tables below summarize the percentage increase in costs, moving from baseline to LEED Silver to LEED
Gold, and segregated between hard costs and LEED related soft costs noting that the Baseline costs did
not account for any soft project costs.
Summary of Hard Costs
Project Name LEED Rating Baseline
Cost(1) Baseline to LEED
Silver (Hard Costs) ($/% increase)
Baseline to LEED Gold
(Hard Costs) ($/% increase)
Elementary School Project
39 points
LEED Gold
$10,594,600
$265,000/
2.5% of baseline
$731,000/
6.9% of baseline
Visitor Centre Project 39 points
LEED Gold
$1,227,200 $65,000/
5.3% of baseline
$119,000/
9.7% of baseline
College Project 43 points
LEED Gold
$14,014,964 $400,000/
2.9% of baseline
$750,000/
5.4% of baseline
1) Baseline costs were refined from the Phase 1 analysis, as a result of information provided during the half-day workshops.
Summary of Soft Costs
Project Name LEED Rating Baseline
Cost(1)
Baseline to LEED
Silver (Soft Costs)
($/% increase)
Baseline to LEED
Gold (Soft Costs)
($/% increase)
Elementary School Project
39 points
LEED Gold
$10,594,600
$190,000/
1.8% of baseline
$190,000/
1.8% of baseline
Visitor Centre Project 39 points
LEED Gold
$1,227,200 $151,000/
12.3% of baseline
$151,000/
12.3% of baseline
College Project 43 points
LEED Gold
$14,014,964 $232,000/
1.7% of baseline
$232,000/
1.7% of baseline
1) Baseline costs were refined from the Phase 1 analysis, as a result of information provided during the half-day workshops.
5 Our Approach to Phase 3 and Overall Findings
As discussed earlier, Phase 3 comprised two distinct components:
• Analyzing the impact of the different LEED ratings on lifecycle costs, water consumption, energy
consumption, and greenhouse gas emissions; and
• Considering the positive externalities of LEED-certified buildings on building occupants.
The former primarily involved analyzing the information gathered during Phases 1 and 2, supplemented
by follow-up correspondence to certain workshop participants for further information and clarification,
whereas the latter was conducted by contacting certain users of the Visitor Centre and College Project to
Alberta Infrastructure, Capital Projects Branch
July 4, 2008
Page 4
obtain their views on positive building externalities. We also reviewed third party independent research
on “green” buildings and related productivity. The results of our undertakings are presented below.
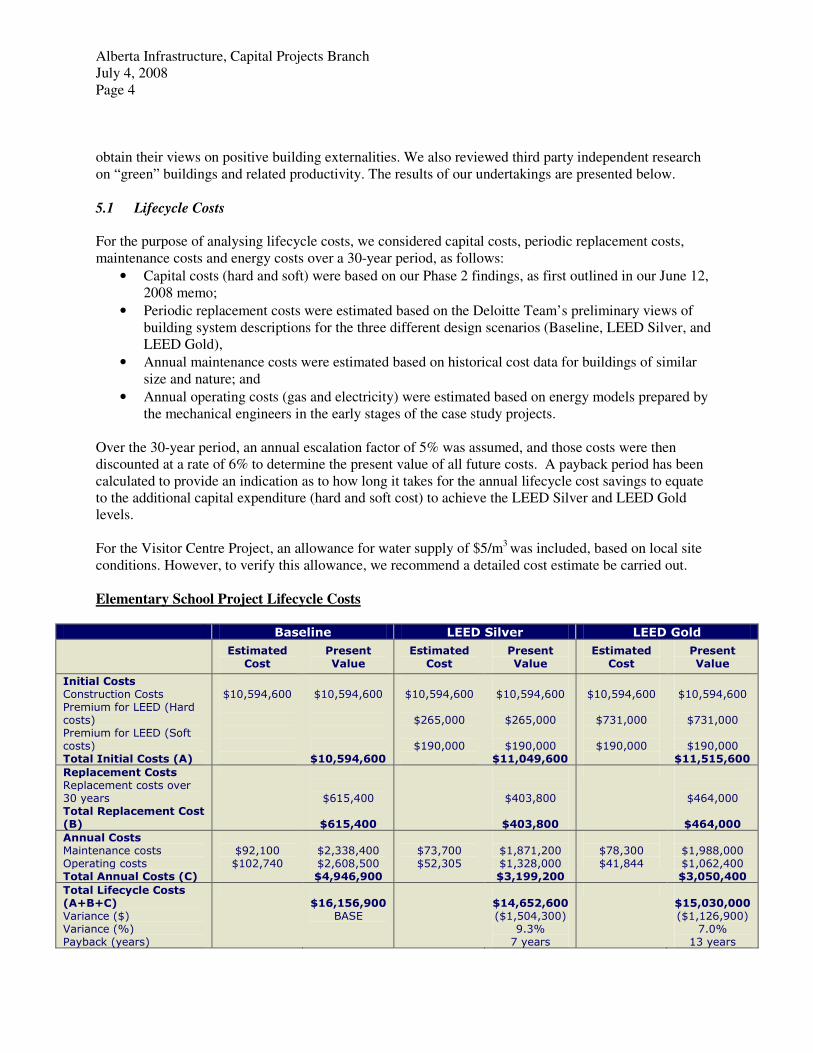
5.1 Lifecycle Costs
For the purpose of analysing lifecycle costs, we considered capital costs, periodic replacement costs,
maintenance costs and energy costs over a 30-year period, as follows:
• Capital costs (hard and soft) were based on our Phase 2 findings, as first outlined in our June 12,
2008 memo;
• Periodic replacement costs were estimated based on the Deloitte Team’s preliminary views of
building system descriptions for the three different design scenarios (Baseline, LEED Silver, and
LEED Gold),
• Annual maintenance costs were estimated based on historical cost data for buildings of similar
size and nature; and
• Annual operating costs (gas and electricity) were estimated based on energy models prepared by
the mechanical engineers in the early stages of the case study projects.
Over the 30-year period, an annual escalation factor of 5% was assumed, and those costs were then
discounted at a rate of 6% to determine the present value of all future costs. A payback period has been
calculated to provide an indication as to how long it takes for the annual lifecycle cost savings to equate
to the additional capital expenditure (hard and soft cost) to achieve the LEED Silver and LEED Gold
levels.
For the Visitor Centre Project, an allowance for water supply of $5/m3 was included, based on local site
conditions. However, to verify this allowance, we recommend a detailed cost estimate be carried out.
Elementary School Project Lifecycle Costs
Baseline LEED Silver LEED Gold
Estimated
Cost
Present
Value
Estimated
Cost
Present
Value
Estimated
Cost
Present
Value
Initial Costs Construction Costs Premium for LEED (Hard costs) Premium for LEED (Soft costs) Total Initial Costs (A)
$10,594,600
$10,594,600
$10,594,600
$10,594,600
$265,000
$190,000
$10,594,600
$265,000
$190,000
$11,049,600
$10,594,600
$731,000
$190,000
$10,594,600
$731,000
$190,000
$11,515,600
Replacement Costs Replacement costs over 30 years Total Replacement Cost (B)
$615,400
$615,400
$403,800
$403,800
$464,000
$464,000
Annual Costs Maintenance costs Operating costs Total Annual Costs (C)
$92,100 $102,740
$2,338,400 $2,608,500 $4,946,900
$73,700 $52,305
$1,871,200 $1,328,000 $3,199,200
$78,300 $41,844
$1,988,000 $1,062,400 $3,050,400
Total Lifecycle Costs (A+B+C) Variance ($) Variance (%) Payback (years)
$16,156,900
BASE
$14,652,600 ($1,504,300)
9.3% 7 years
$15,030,000 ($1,126,900)
7.0% 13 years
Alberta Infrastructure, Capital Projects Branch
July 4, 2008
Page 5
Based on the analysis undertaken, moving the Elementary School Project from the Baseline design to
LEED Silver results in a 7 year payback; moving the project to LEED Gold from the Baseline design
results in a 13 year payback.
Visitor Centre Project Lifecycle Costs
Baseline LEED Silver LEED Gold
Estimated Cost
Present Value
Estimated Cost
Present Value
Estimated Cost
Present Value
Initial Costs Construction Costs Premium for LEED (Hard costs)
Premium for LEED (Soft costs) Total Initial Costs (A)
$1,227,200
$1,227,200
$1,227,200
$1,227,200
$65,000
$151,000
$1,227,200
$65,000
$151,000
$1,443,200
$1,227,200
$119,000
$151,000
$1,227,200
$119,000
$151,000
$1,497,200
Replacement Costs Replacement costs over 30 years Total Replacement Cost (B)
$129,400
$129,400
$72,9700
$72,900
$83,400
$83,400
Annual Costs Maintenance costs Operating costs Yearly water costs Total Annual Costs (C)
$11,000 $10,452 $5,223
$279,300
$398,000 $677,300
$8,800 $6,925 $2,415
$223,400
$237,100 $460,500
$8,800 $6,295 $2,415
$223,400
$221,100 $444,500
Total Lifecycle Costs (A+B+C) Variance ($) Variance (%) Payback (years)
$2,033,900
BASE
$1,976,600 ($57,300) 2.8%
27 years
$2,025,100 ($8,800) 0.4%
28 years
Based on the analysis undertaken, moving the Visitor Centre Project from the Baseline design to LEED
Silver results in a 27 year payback; moving the project to LEED Gold from the Baseline Design results in
a 28 year payback.
College Project Lifecycle Costs
Baseline LEED Silver LEED Gold
Estimated Cost
Present Value
Estimated Cost
Present Value
Estimated Cost
Present Value
Initial Costs Construction Costs Premium for LEED (Hard costs) Premium for LEED (Soft costs) Total Initial Costs (A)
$14,014,964
$14,014,964
$14,014,964
$14,014,964
$400,000
$232,000
$14,014,964
$400,000
$232,000
$14,646,964
$14,014,964
$750,000
$232,000
$14,014,964
$750,000
$232,000
$14,996,964
Replacement Costs Replacement costs over 30 years
Total Replacement Cost (B)
$737,800
$737,800
$464,100
$464,100
$636,300
$636,300
Annual Costs Maintenance costs Operating costs Total Annual Costs (C)
$111,700 $141,155
$2,836,000 $3,583,900 $6,419,900
$89,400 $81,476
$2,269,800 $2,068,700 $4,338,500
$94,900 $70,849
$2,409,500 $1,798,800 $4,208,300
Total Lifecycle Costs
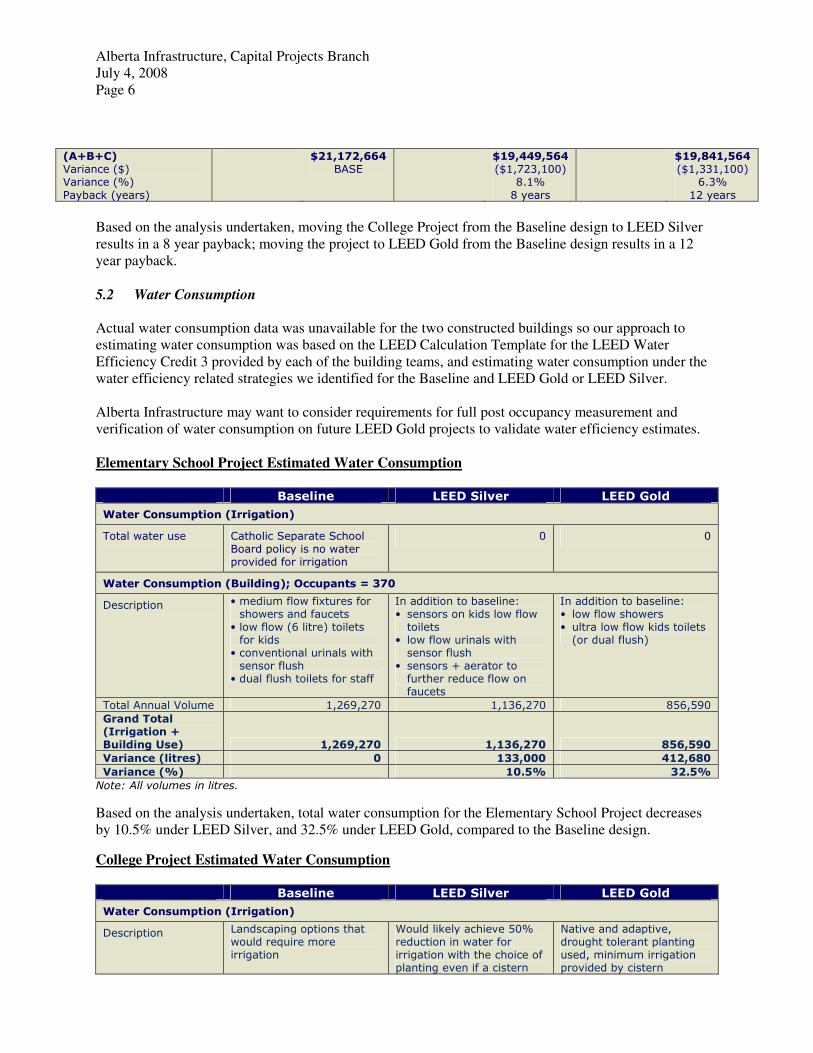
Alberta Infrastructure, Capital Projects Branch
July 4, 2008
Page 6
(A+B+C) Variance ($) Variance (%)
Payback (years)
$21,172,664 BASE
$19,449,564 ($1,723,100)
8.1%
8 years
$19,841,564 ($1,331,100)
6.3%
12 years
Based on the analysis undertaken, moving the College Project from the Baseline design to LEED Silver
results in a 8 year payback; moving the project to LEED Gold from the Baseline design results in a 12
year payback.
5.2 Water Consumption
Actual water consumption data was unavailable for the two constructed buildings so our approach to
estimating water consumption was based on the LEED Calculation Template for the LEED Water
Efficiency Credit 3 provided by each of the building teams, and estimating water consumption under the
water efficiency related strategies we identified for the Baseline and LEED Gold or LEED Silver.
Alberta Infrastructure may want to consider requirements for full post occupancy measurement and
verification of water consumption on future LEED Gold projects to validate water efficiency estimates.
Elementary School Project Estimated Water Consumption Baseline LEED Silver LEED Gold
Water Consumption (Irrigation)
Total water use Catholic Separate School Board policy is no water provided for irrigation
0 0
Water Consumption (Building); Occupants = 370
Description • medium flow fixtures for showers and faucets
• low flow (6 litre) toilets for kids
• conventional urinals with sensor flush
• dual flush toilets for staff
In addition to baseline: • sensors on kids low flow toilets
• low flow urinals with sensor flush
• sensors + aerator to further reduce flow on faucets
In addition to baseline: • low flow showers • ultra low flow kids toilets (or dual flush)
Total Annual Volume 1,269,270 1,136,270 856,590
Grand Total (Irrigation + Building Use) 1,269,270 1,136,270 856,590
Variance (litres) 0 133,000 412,680
Variance (%) 10.5% 32.5%
Note: All volumes in litres.
Based on the analysis undertaken, total water consumption for the Elementary School Project decreases
by 10.5% under LEED Silver, and 32.5% under LEED Gold, compared to the Baseline design.
College Project Estimated Water Consumption Baseline LEED Silver LEED Gold
Water Consumption (Irrigation)
Description Landscaping options that would require more irrigation
Would likely achieve 50% reduction in water for irrigation with the choice of planting even if a cistern
Native and adaptive, drought tolerant planting used, minimum irrigation provided by cistern
Alberta Infrastructure, Capital Projects Branch
July 4, 2008
Page 7
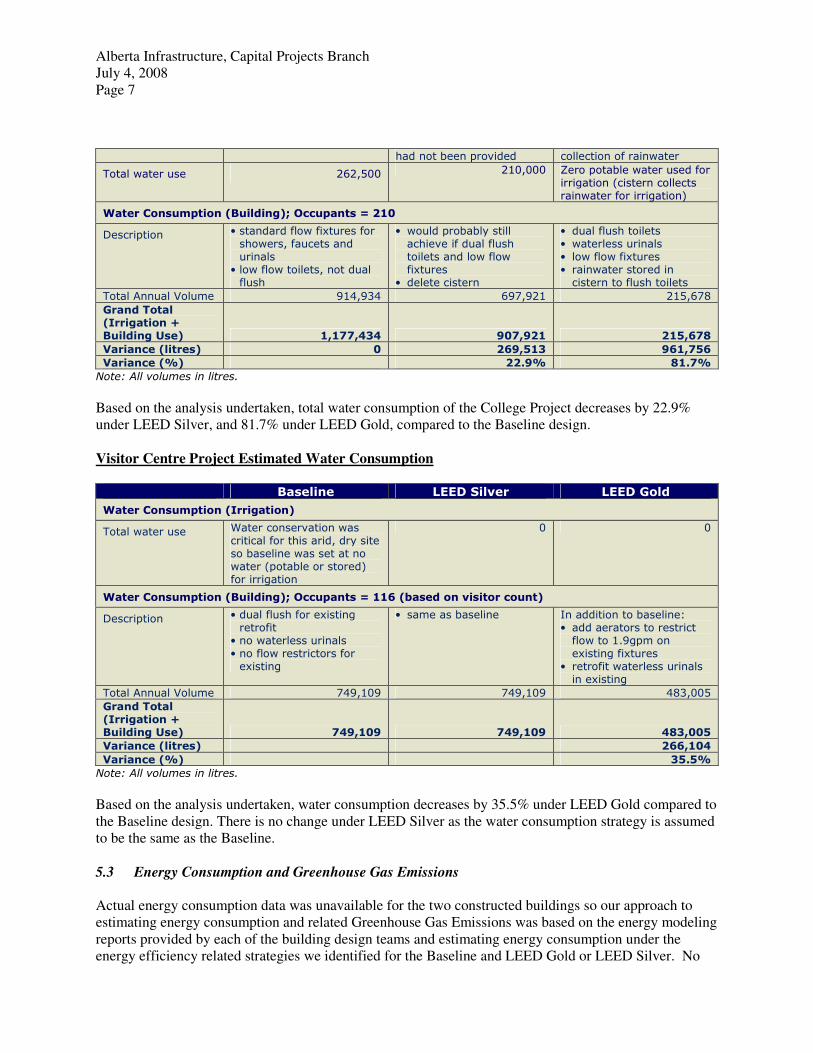
had not been provided collection of rainwater
Total water use 262,500 210,000 Zero potable water used for irrigation (cistern collects rainwater for irrigation)
Water Consumption (Building); Occupants = 210
Description • standard flow fixtures for showers, faucets and urinals
• low flow toilets, not dual flush
• would probably still achieve if dual flush toilets and low flow fixtures
• delete cistern
• dual flush toilets • waterless urinals • low flow fixtures • rainwater stored in cistern to flush toilets
Total Annual Volume 914,934 697,921 215,678
Grand Total (Irrigation + Building Use) 1,177,434 907,921 215,678
Variance (litres) 0 269,513 961,756
Variance (%) 22.9% 81.7%
Note: All volumes in litres.
Based on the analysis undertaken, total water consumption of the College Project decreases by 22.9%
under LEED Silver, and 81.7% under LEED Gold, compared to the Baseline design.
Visitor Centre Project Estimated Water Consumption Baseline LEED Silver LEED Gold
Water Consumption (Irrigation)
Total water use Water conservation was critical for this arid, dry site so baseline was set at no water (potable or stored) for irrigation
0 0
Water Consumption (Building); Occupants = 116 (based on visitor count)
Description • dual flush for existing retrofit
• no waterless urinals • no flow restrictors for existing
• same as baseline In addition to baseline: • add aerators to restrict flow to 1.9gpm on existing fixtures
• retrofit waterless urinals in existing
Total Annual Volume 749,109 749,109 483,005
Grand Total (Irrigation + Building Use) 749,109 749,109 483,005
Variance (litres) 266,104
Variance (%) 35.5%
Note: All volumes in litres.
Based on the analysis undertaken, water consumption decreases by 35.5% under LEED Gold compared to
the Baseline design. There is no change under LEED Silver as the water consumption strategy is assumed
to be the same as the Baseline.
5.3 Energy Consumption and Greenhouse Gas Emissions
Actual energy consumption data was unavailable for the two constructed buildings so our approach to
estimating energy consumption and related Greenhouse Gas Emissions was based on the energy modeling
reports provided by each of the building design teams and estimating energy consumption under the
energy efficiency related strategies we identified for the Baseline and LEED Gold or LEED Silver. No

Alberta Infrastructure, Capital Projects Branch
July 4, 2008
Page 8
energy modeling was performed although this could be conducted in the future to verify the estimates for
the three case study projects.
Alberta Infrastructure may want to consider requirements for full post occupancy measurement and
verification of energy consumption on future LEED Gold project to validate energy modeling results.
Furthermore, Alberta Infrastructure may want to consider specifying that future LEED Gold projects
target a certain number of energy points to ensure payback periods are reduced to the lowest level.
Elementary School Project Estimated Energy Consumption Baseline LEED Silver LEED Gold
Energy Consumption
Electricity (MJ) 1,193,400 967,980 835,000
Natural Gas (MJ) 4,165,091 2,689,200 2,010,000
Total 5,358,491 3,657,180 2,845,000
Energy Savings (Electricity MJ)
0 225,420 358,400
GHG Savings (Electricity tonnes of CO2)
0 62 99
Energy Savings (Natural Gas MJ)
0 1,475,891 2,155,091
GHG Savings (Natural Gas tonnes of CO2)
0 73 106
Total GHG Savings (tonnes of CO2)
0 135 206
Tonnes of CO2/sqm Savings
0.032 0.049
College Project Estimated Energy Consumption Baseline LEED Silver LEED Gold
Energy Consumption
Electricity (MJ) 3,146,057 2,416,982 1,987,763
Natural Gas (MJ) 6,264,734 3,980,181 2,807,334
Total 9,410,791 6,397,163 4,795,097
Energy Savings (Electricity MJ)
0 729,075 1,158,294
GHG Savings (Electricity tonnes of CO2)
0 202 321
Energy Savings (Natural Gas MJ)
0 2,284,553 3,457,400
GHG Savings (Natural Gas tonnes of CO2)
0 113 171
Total GHG Savings (tonnes of CO2)
0 315 492
Tonnes of CO2/sqm Savings
0.062 0.097
Alberta Infrastructure, Capital Projects Branch
July 4, 2008
Page 9
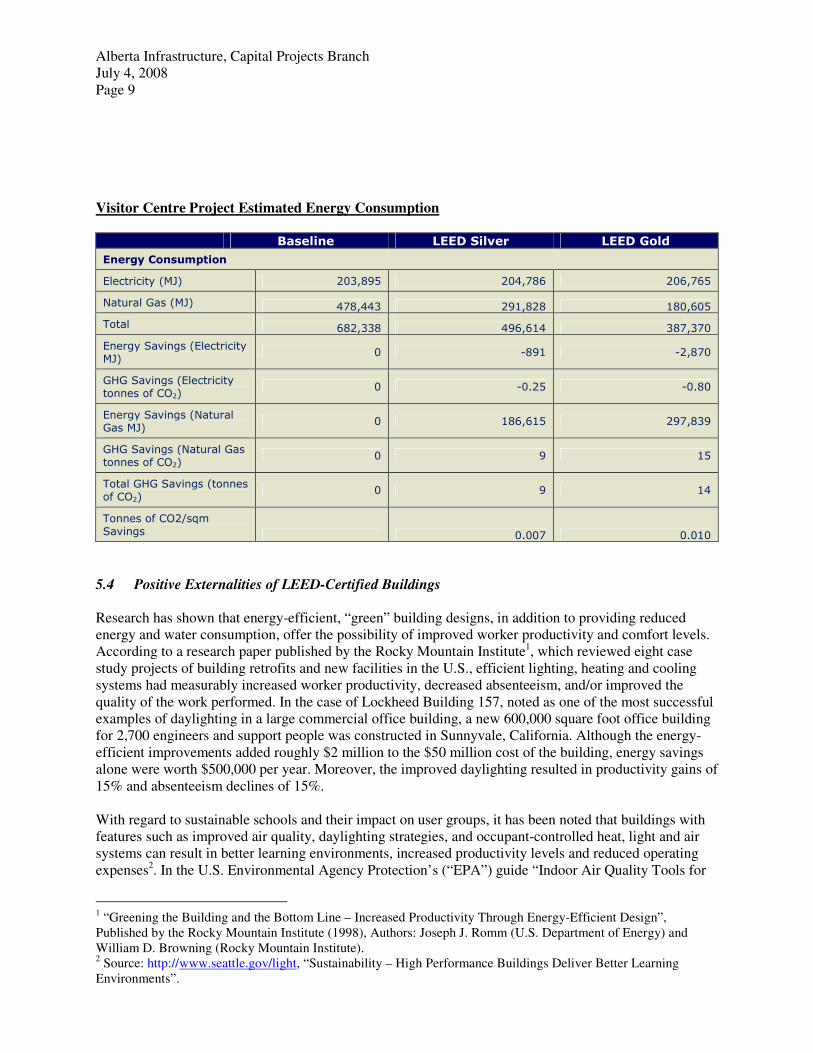
Visitor Centre Project Estimated Energy Consumption Baseline LEED Silver LEED Gold
Energy Consumption
Electricity (MJ) 203,895 204,786 206,765
Natural Gas (MJ) 478,443 291,828 180,605
Total 682,338 496,614 387,370
Energy Savings (Electricity MJ)
0 -891 -2,870
GHG Savings (Electricity tonnes of CO2)
0 -0.25 -0.80
Energy Savings (Natural Gas MJ)
0 186,615 297,839
GHG Savings (Natural Gas tonnes of CO2)
0 9 15
Total GHG Savings (tonnes of CO2)
0 9 14
Tonnes of CO2/sqm Savings 0.007 0.010
5.4 Positive Externalities of LEED-Certified Buildings
Research has shown that energy-efficient, “green” building designs, in addition to providing reduced
energy and water consumption, offer the possibility of improved worker productivity and comfort levels.
According to a research paper published by the Rocky Mountain Institute1, which reviewed eight case
study projects of building retrofits and new facilities in the U.S., efficient lighting, heating and cooling
systems had measurably increased worker productivity, decreased absenteeism, and/or improved the
quality of the work performed. In the case of Lockheed Building 157, noted as one of the most successful
examples of daylighting in a large commercial office building, a new 600,000 square foot office building
for 2,700 engineers and support people was constructed in Sunnyvale, California. Although the energy-
efficient improvements added roughly $2 million to the $50 million cost of the building, energy savings
alone were worth $500,000 per year. Moreover, the improved daylighting resulted in productivity gains of
15% and absenteeism declines of 15%.
With regard to sustainable schools and their impact on user groups, it has been noted that buildings with
features such as improved air quality, daylighting strategies, and occupant-controlled heat, light and air
systems can result in better learning environments, increased productivity levels and reduced operating
expenses2. In the U.S. Environmental Agency Protection’s (“EPA”) guide “Indoor Air Quality Tools for
1 “Greening the Building and the Bottom Line – Increased Productivity Through Energy-Efficient Design”,
Published by the Rocky Mountain Institute (1998), Authors: Joseph J. Romm (U.S. Department of Energy) and
William D. Browning (Rocky Mountain Institute). 2 Source: http://www.seattle.gov/light, “Sustainability – High Performance Buildings Deliver Better Learning
Environments”.
Alberta Infrastructure, Capital Projects Branch
July 4, 2008
Page 10
Schools”3, it states that “Good indoor air quality contributes to a favourable learning environment for
students, productivity for teachers and staff, and a sense of comfort, health and well-being. These
elements combine to assist a school in its core mission – educating children”.
For the purpose of our analysis, our approach to assessing positive externalities entailed seeking feedback
from select occupants/users of the Visitor Centre and College projects on various features, including
indoor air quality, lighting and productivity. In some cases, the view expressed is that of the individual
contacted; in other cases, the view is one that the individual has heard from other users of the facility. As
the Elementary School Project was still under construction during the time of our report, our comments
for that case study project are based on feedback received during the half-day workshop. The results of
our findings are presented below.
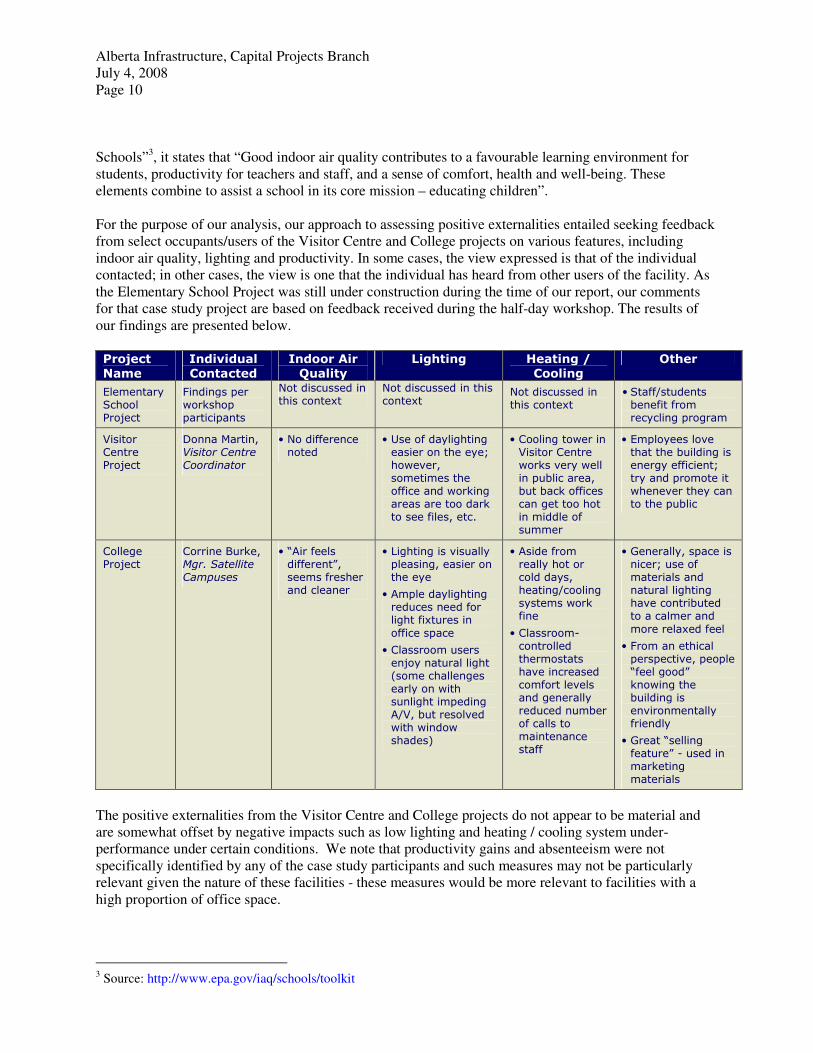
Project Name
Individual Contacted
Indoor Air Quality
Lighting Heating / Cooling
Other
Elementary School Project
Findings per workshop participants
Not discussed in this context
Not discussed in this context
Not discussed in this context
• Staff/students benefit from recycling program
Visitor Centre Project
Donna Martin, Visitor Centre Coordinator
• No difference noted
• Use of daylighting easier on the eye; however, sometimes the office and working areas are too dark to see files, etc.
• Cooling tower in Visitor Centre works very well in public area, but back offices can get too hot in middle of summer
• Employees love that the building is energy efficient; try and promote it whenever they can to the public
College Project
Corrine Burke, Mgr. Satellite Campuses
• “Air feels different”, seems fresher and cleaner
• Lighting is visually pleasing, easier on the eye
• Ample daylighting reduces need for light fixtures in
office space
• Classroom users enjoy natural light (some challenges early on with sunlight impeding A/V, but resolved with window shades)
• Aside from really hot or cold days, heating/cooling systems work fine
• Classroom-controlled thermostats have increased comfort levels and generally reduced number of calls to maintenance staff
• Generally, space is nicer; use of materials and natural lighting have contributed to a calmer and
more relaxed feel
• From an ethical perspective, people “feel good” knowing the building is environmentally friendly
• Great “selling feature” - used in marketing materials
The positive externalities from the Visitor Centre and College projects do not appear to be material and
are somewhat offset by negative impacts such as low lighting and heating / cooling system under-
performance under certain conditions. We note that productivity gains and absenteeism were not
specifically identified by any of the case study participants and such measures may not be particularly
relevant given the nature of these facilities - these measures would be more relevant to facilities with a
high proportion of office space.
3 Source: http://www.epa.gov/iaq/schools/toolkit

Alberta Infrastructure, Capital Projects Branch
July 4, 2008
Page 11
To obtain more data on positive externalities for future projects, Alberta Infrastructure may want to
consider conducting user group surveys before and after occupation of a LEED-certified building.
Benchmarking absenteeism before and after may also be a useful measure. In both cases, interpretation of
the data gathered must be carefully considered to determine whether the positive externalities are related
to solely moving from an old to new building or indeed whether the specific LEED features are
contributing factors.
6 Summary Results
Cost Savings
LEED Silver LEED Gold
Project
$ Payback (years) $ Payback (years)
Elementary School 1,504,300 7 1,126,900 13
Visitor Centre Project 57,300 27 8,800 28
College Project 1,723,100 8 1,331,100 12
Consumption Reduction
LEED Silver LEED Gold
Project
% water (Litres)
% Energy (MJ)
% Water (Litres)
% Energy (MJ)
Elementary School 10.5 31.7 32.5 46.9
Visitor Centre Project 0.0 27.2 35.5 43.2
College Project 22.9 32.0 81.7 49.0
7 Limitations
This memorandum was prepared for the exclusive use of Alberta Infrastructure, and is not to be
reproduced or used without written permission of Deloitte. No third party is entitled to rely, in any
manner or for any purpose, on this memorandum. Deloitte’s services may include advice or
recommendations, but all decisions in connection with the implementation of such advice and
recommendations shall be the responsibility of, and be made by, Alberta Infrastructure.
This memorandum relies on certain information provided by Alberta Infrastructure, and Deloitte has not
performed an independent review of this information. It does not constitute an audit conducted in
accordance with generally accepted auditing standards, an examination or compilation of, or the
performance of agreed upon procedures with respect to prospective financial information, an examination
of or any other form of assurance with respect to internal controls, or other attestation or review services
in accordance with standards or rules established by the CICA or other regulatory body.

© Deloitte & Touche LLP and affiliated entities. LEED Gold Certification Cost Analysis – Summary Report
Appendix 1 – Phase 2 Supporting Analysis
Alberta Infrastructure Facilities LEED Study
June 11, 2008
t:\ss\o\6-5436\LEED Certification Report – June, 08.doc
4
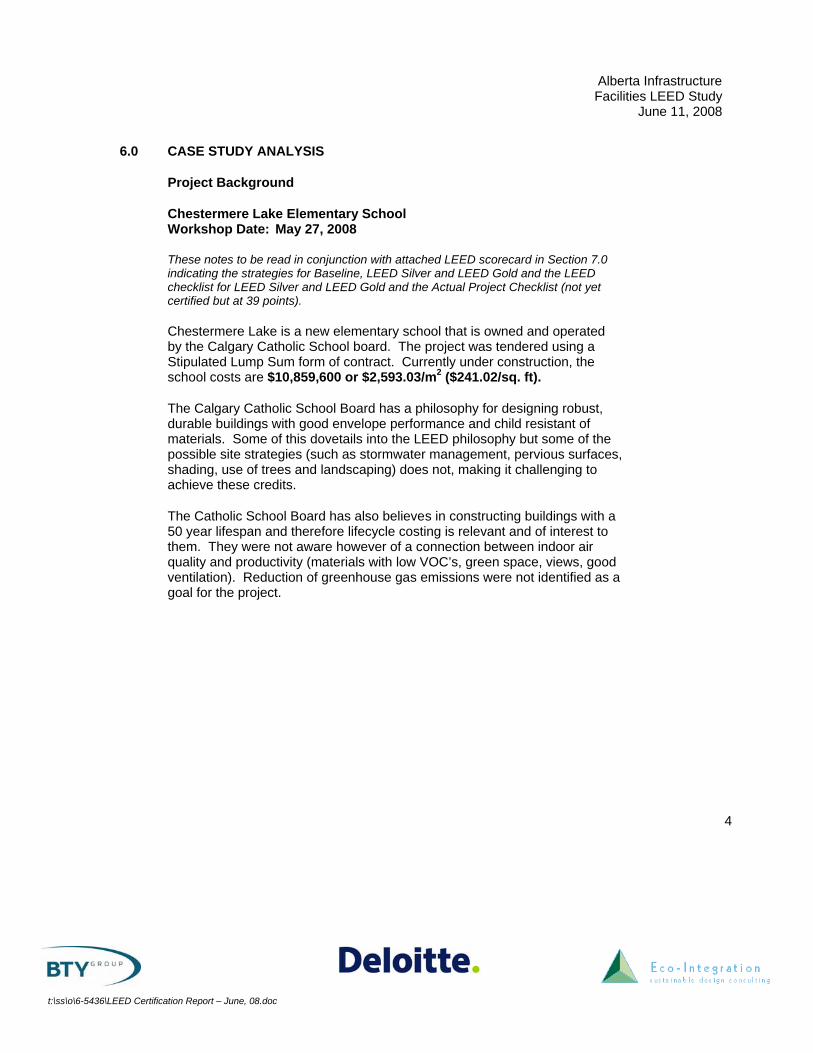
6.0 CASE STUDY ANALYSIS
Project Background
Chestermere Lake Elementary School Workshop Date: May 27, 2008
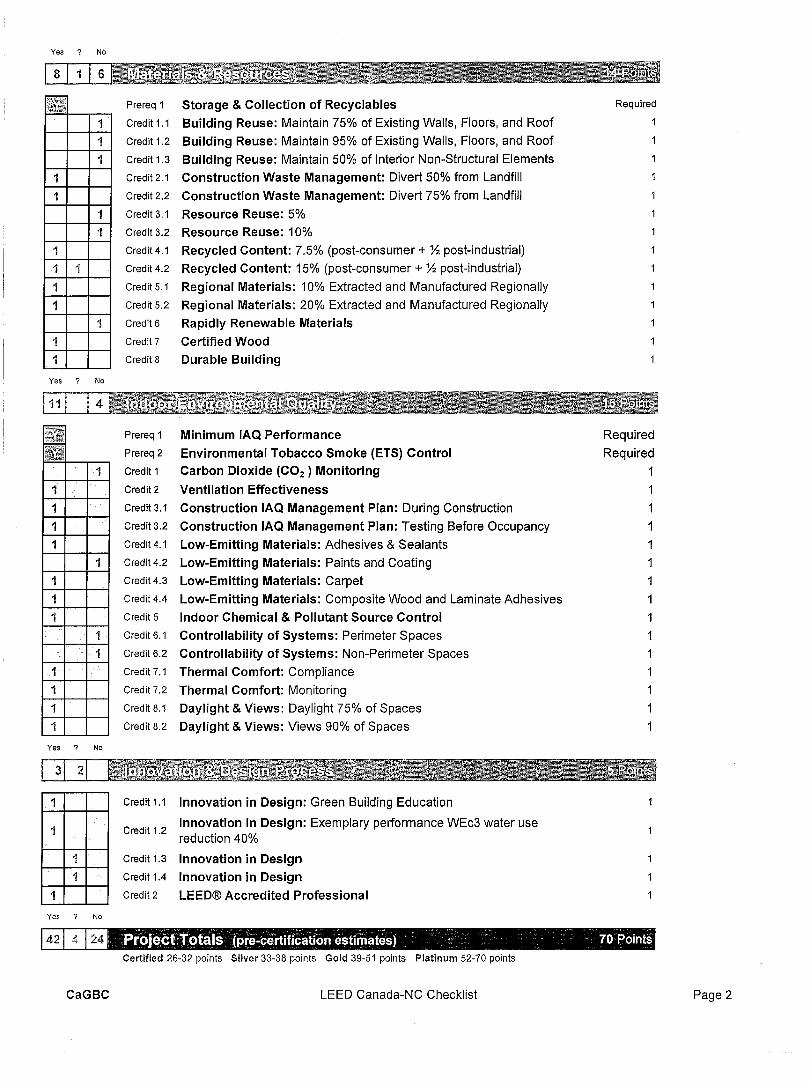
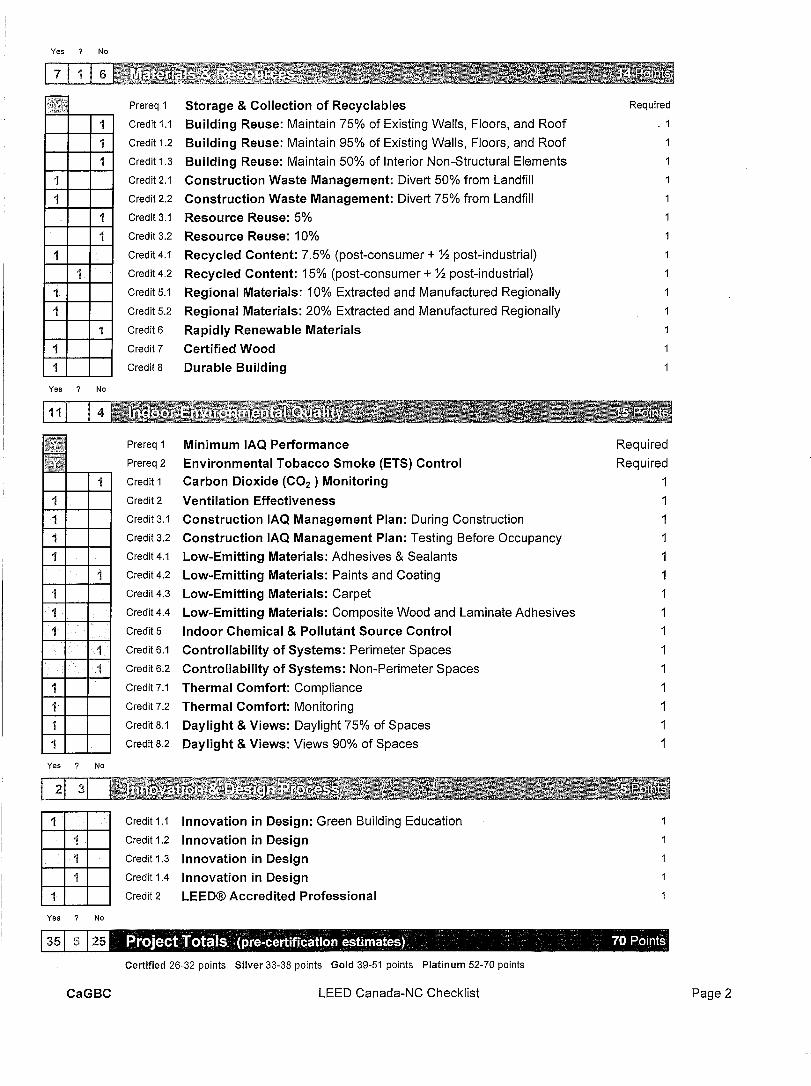
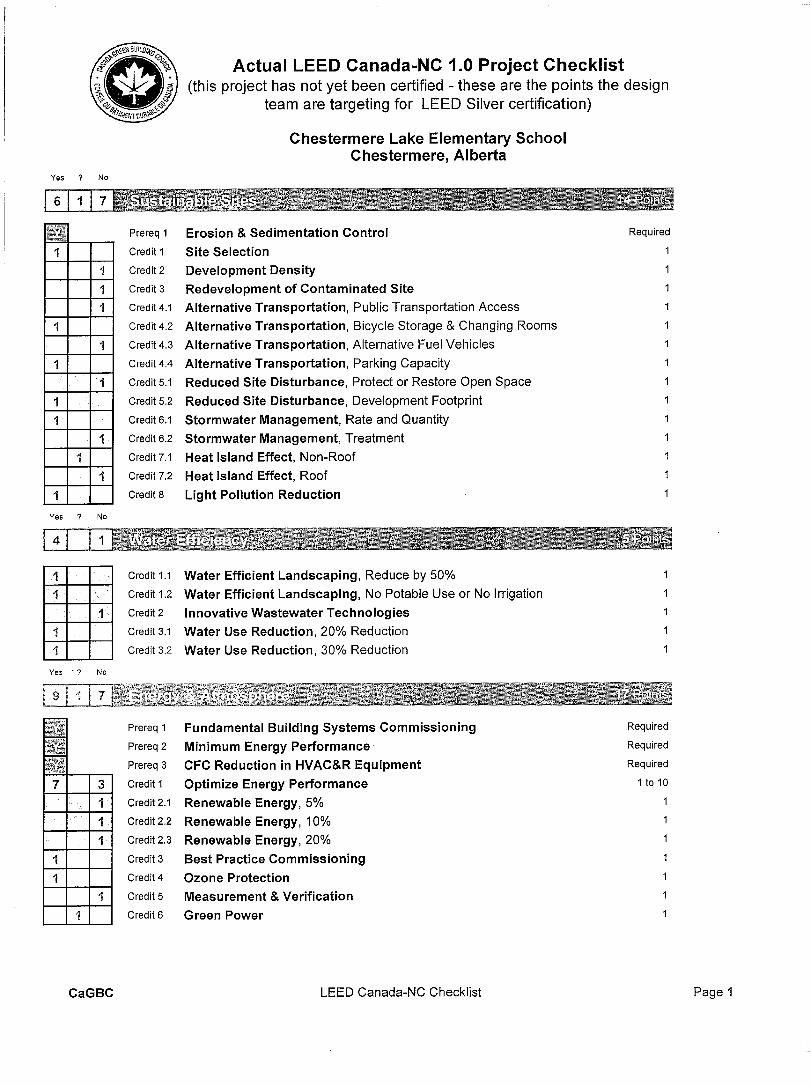
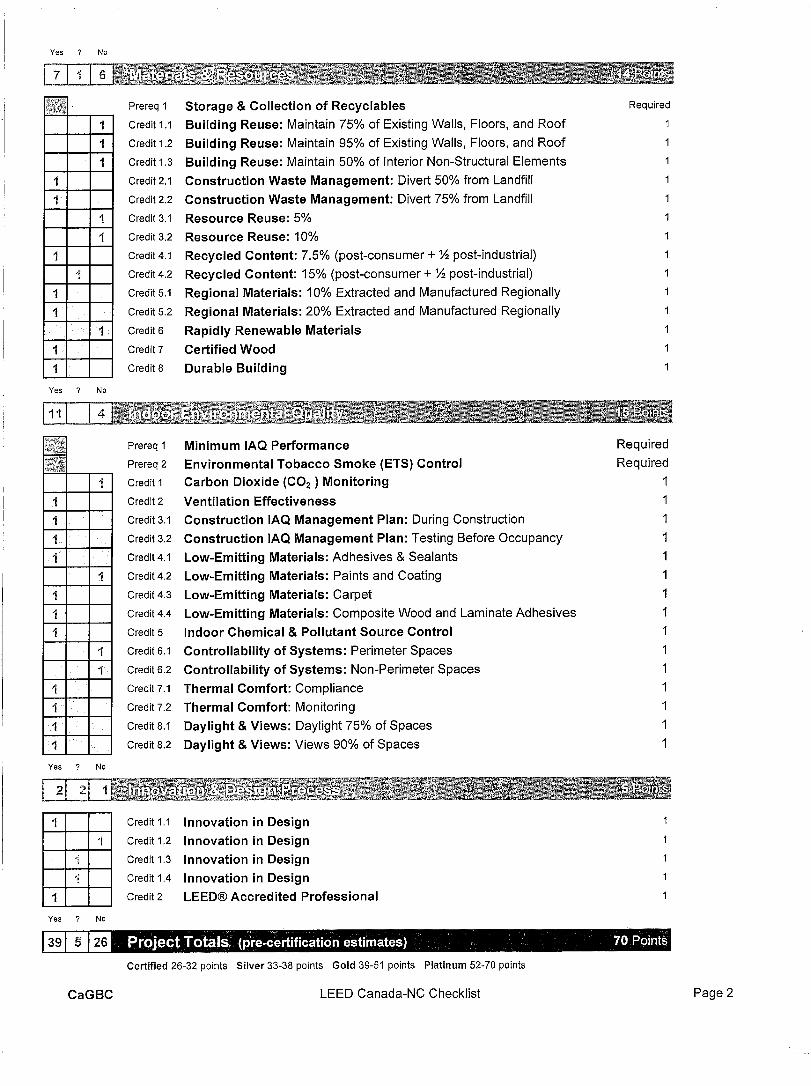
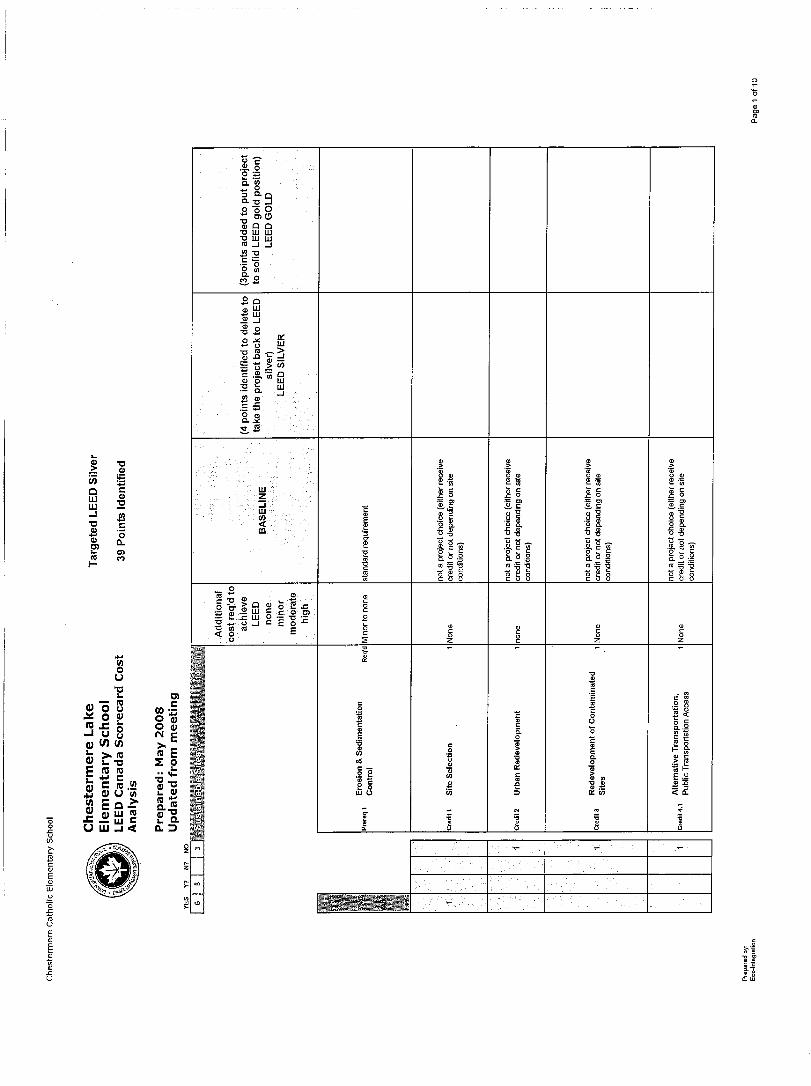
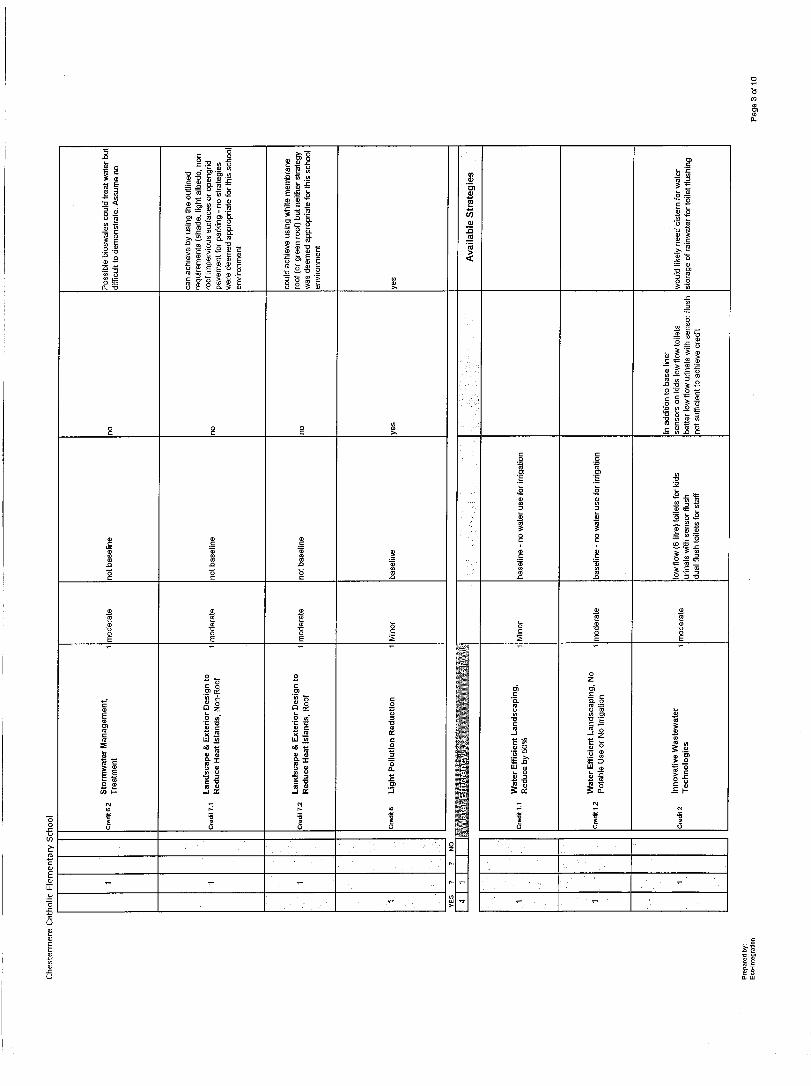
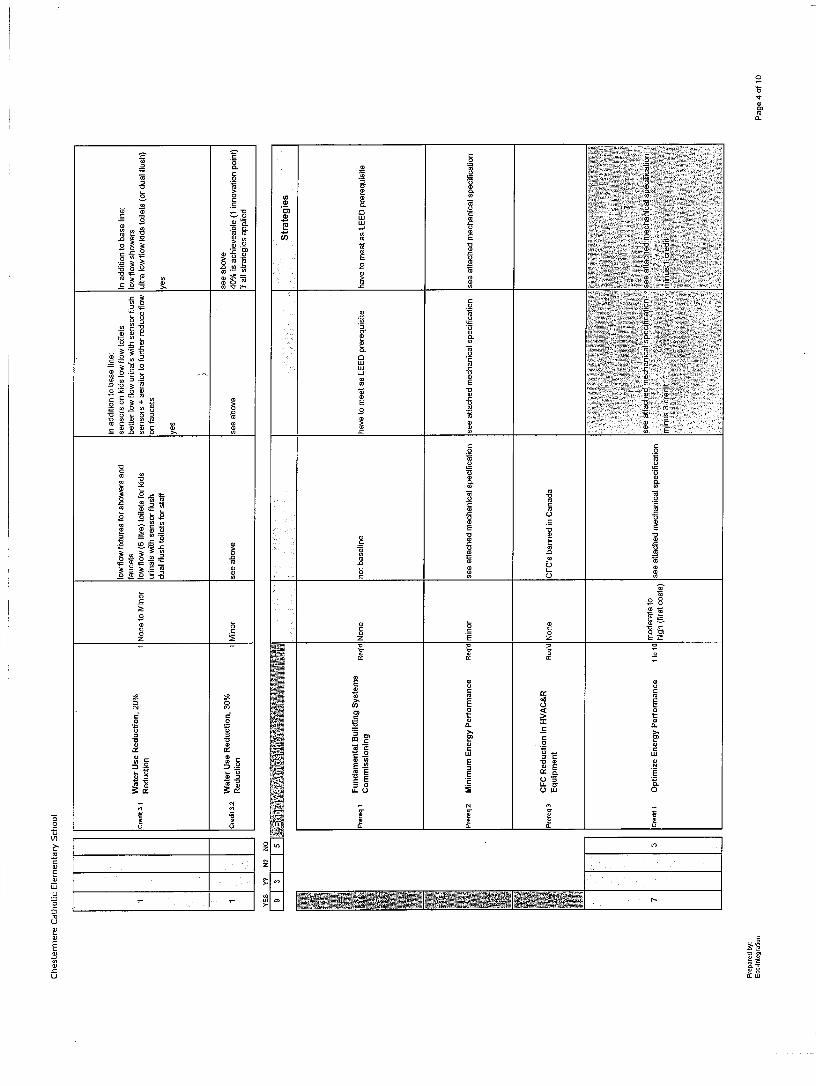
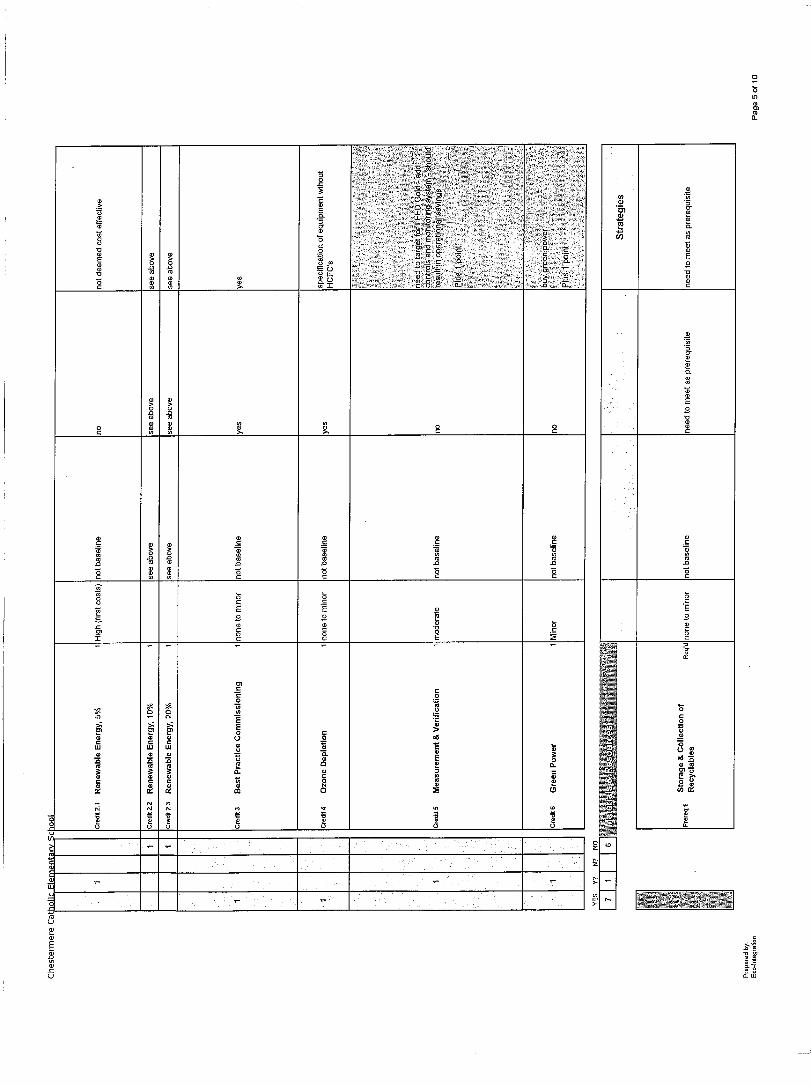
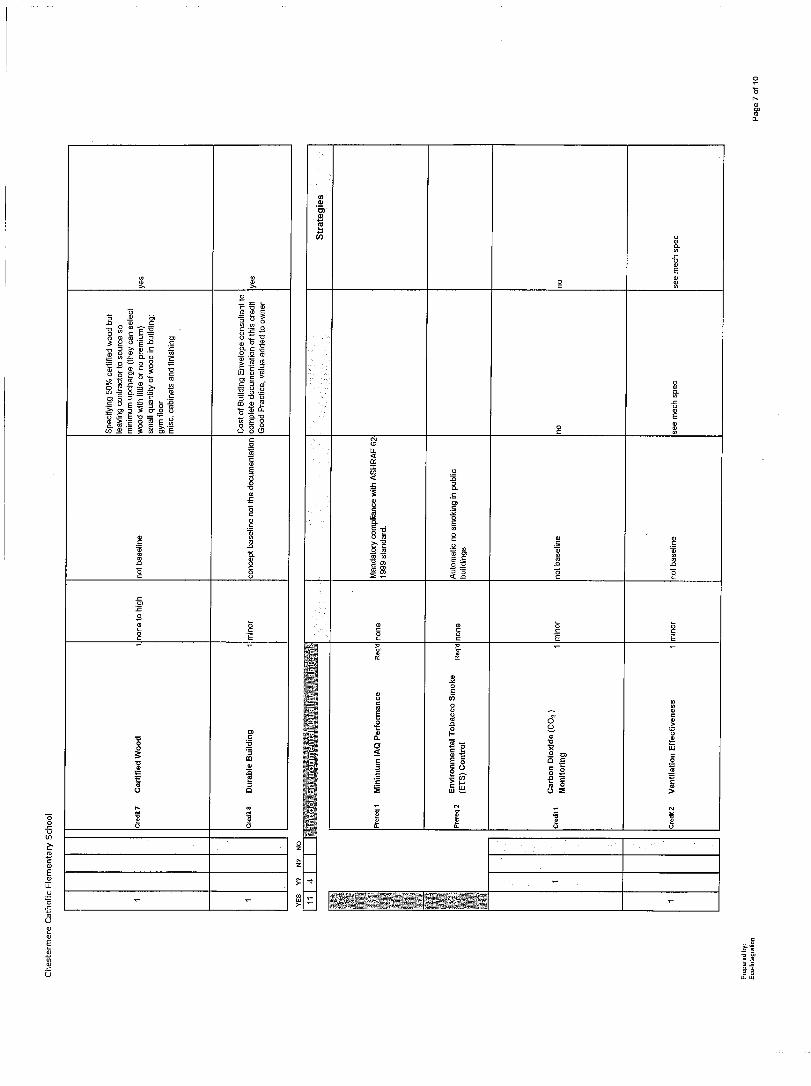
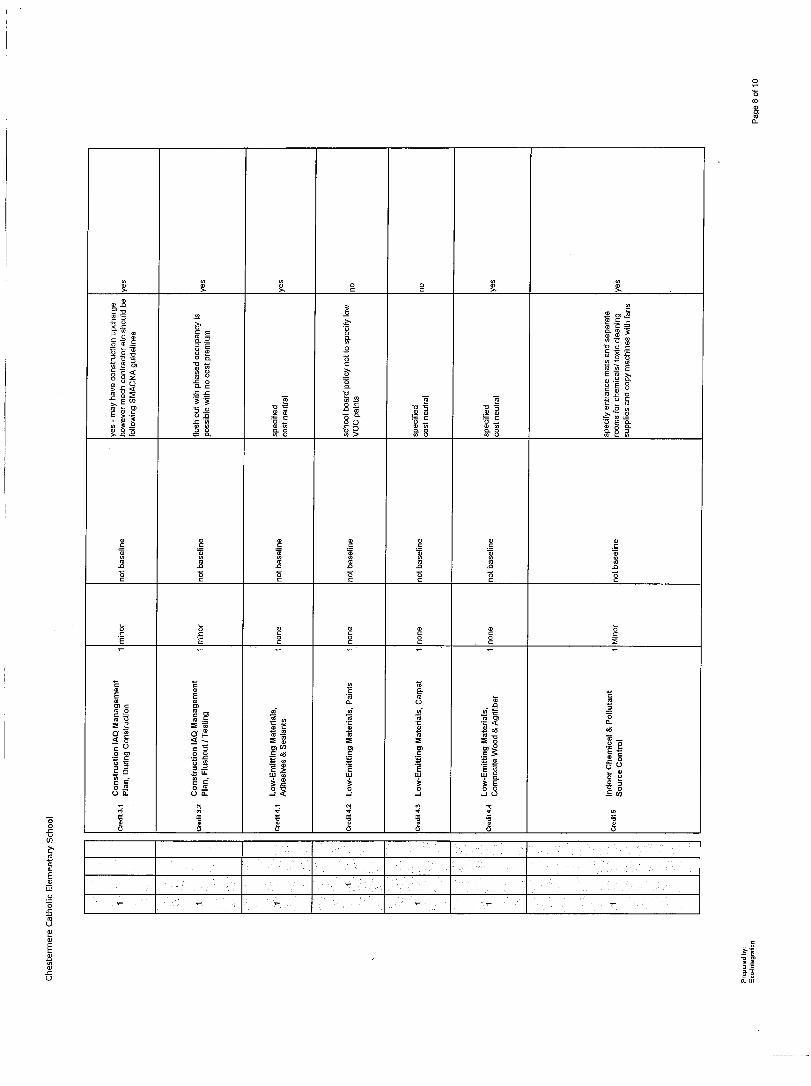
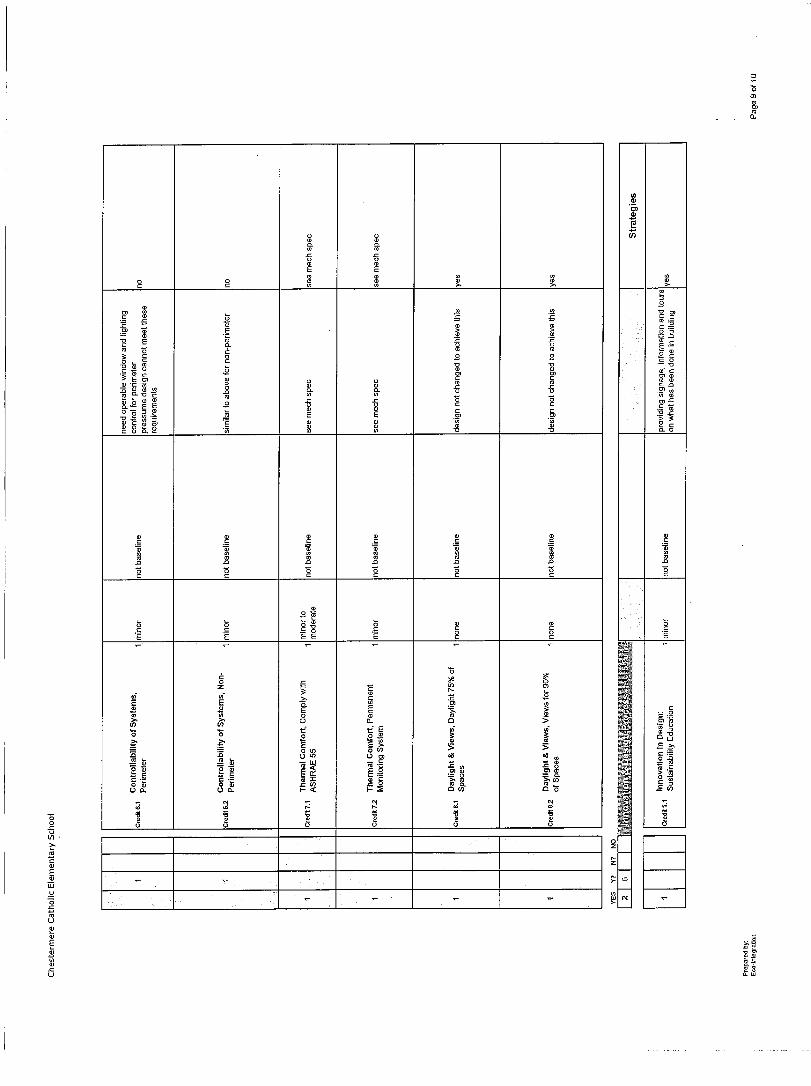
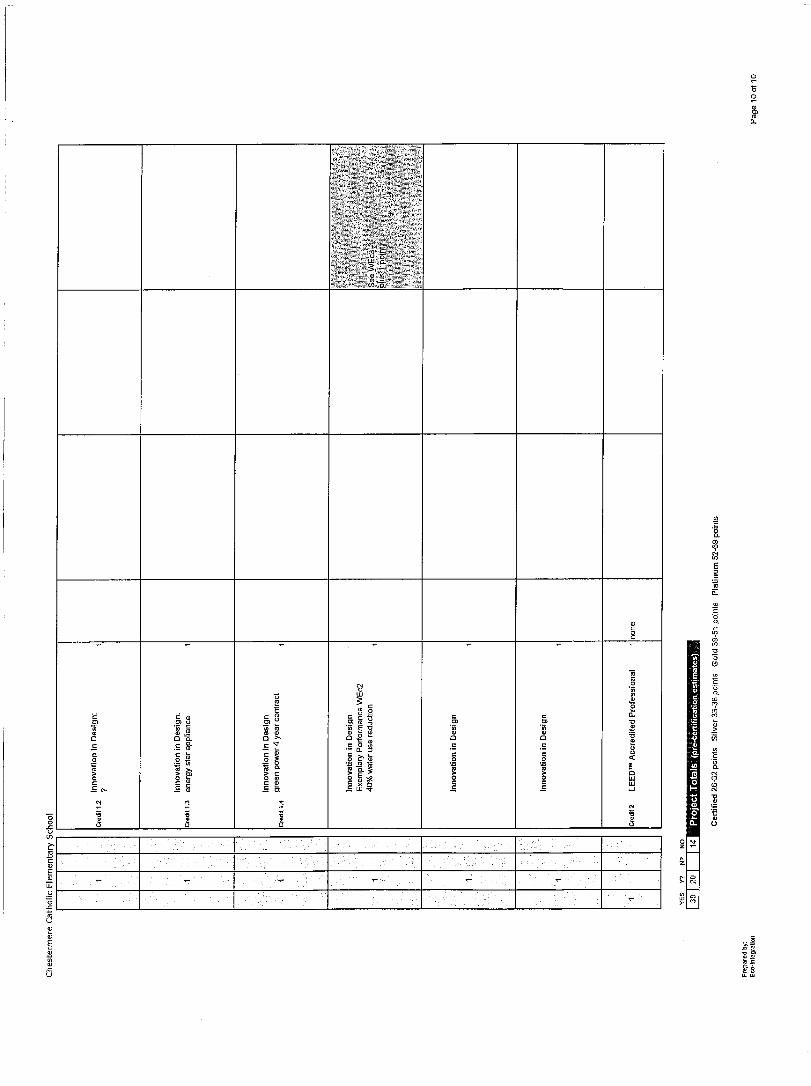
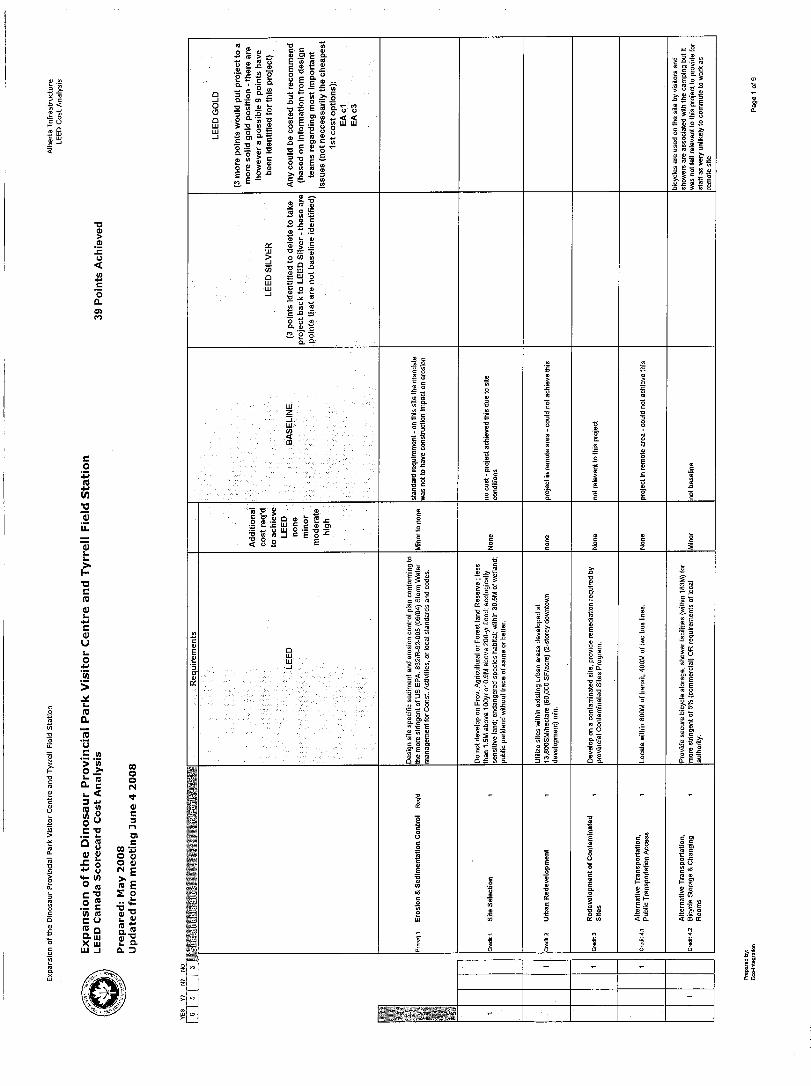
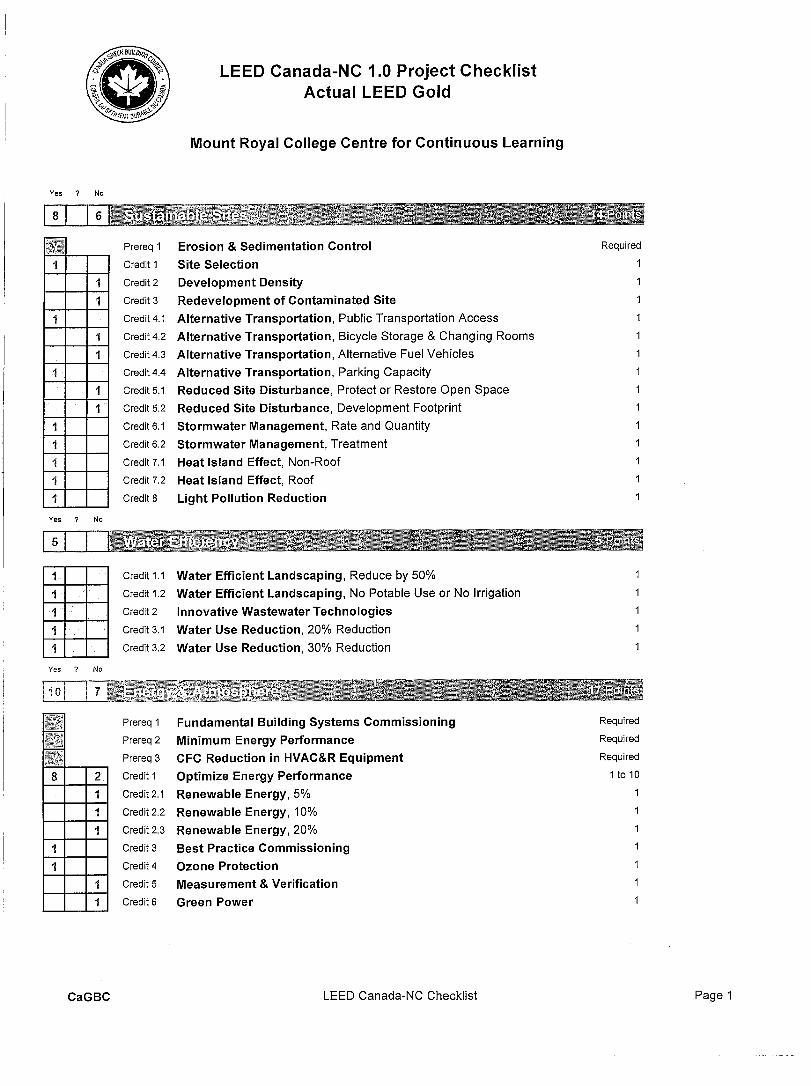
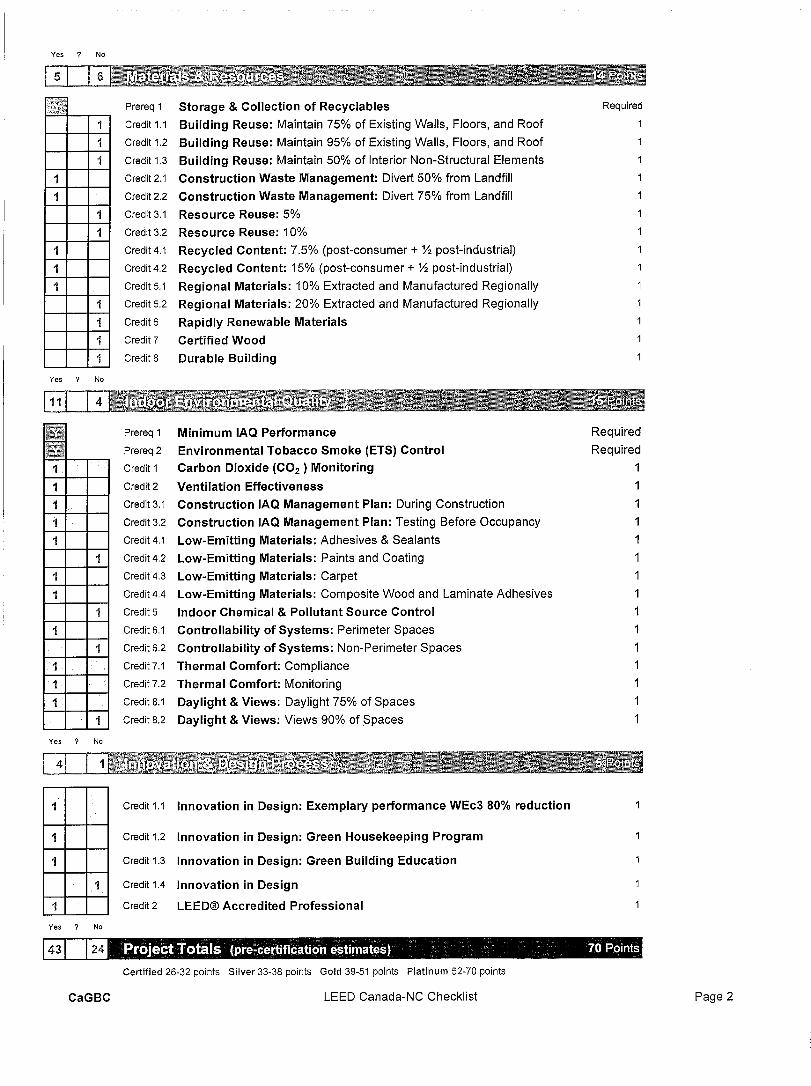
These notes to be read in conjunction with attached LEED scorecard in Section 7.0 indicating the strategies for Baseline, LEED Silver and LEED Gold and the LEED checklist for LEED Silver and LEED Gold and the Actual Project Checklist (not yet certified but at 39 points).
Chestermere Lake is a new elementary school that is owned and operated by the Calgary Catholic School board. The project was tendered using a Stipulated Lump Sum form of contract. Currently under construction, the school costs are $10,859,600 or $2,593.03/m2 ($241.02/sq. ft).
The Calgary Catholic School Board has a philosophy for designing robust, durable buildings with good envelope performance and child resistant of materials. Some of this dovetails into the LEED philosophy but some of the possible site strategies (such as stormwater management, pervious surfaces, shading, use of trees and landscaping) does not, making it challenging to achieve these credits.
The Catholic School Board has also believes in constructing buildings with a 50 year lifespan and therefore lifecycle costing is relevant and of interest to them. They were not aware however of a connection between indoor air quality and productivity (materials with low VOC’s, green space, views, good ventilation). Reduction of greenhouse gas emissions were not identified as a goal for the project.
Alberta Infrastructure Facilities LEED Study
June 11, 2008
t:\ss\o\6-5436\LEED Certification Report – June, 08.doc
5
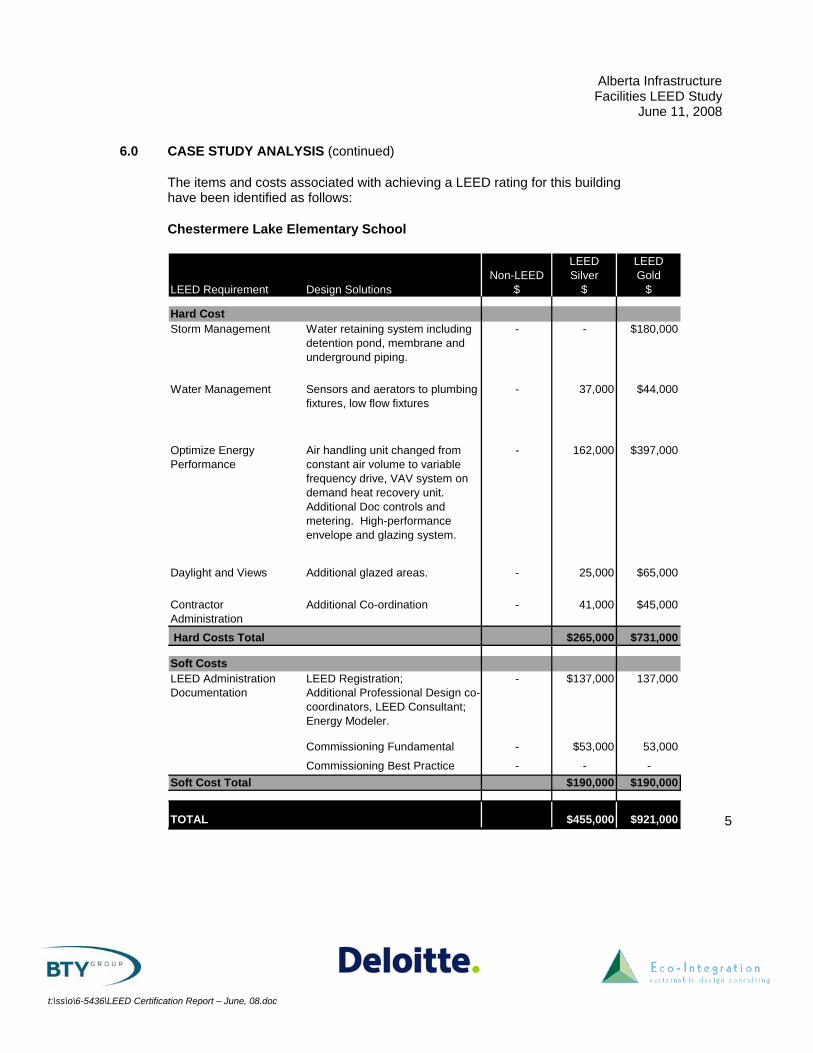
6.0 CASE STUDY ANALYSIS (continued)
The items and costs associated with achieving a LEED rating for this building have been identified as follows:
Chestermere Lake Elementary School
LEED Requirement Design SolutionsNon-LEED
$
LEEDSilver
$
LEEDGold
$
Hard CostStorm Management Water retaining system including
detention pond, membrane and underground piping.
- - $180,000
Water Management Sensors and aerators to plumbing fixtures, low flow fixtures
- 37,000 $44,000
Optimize EnergyPerformance
Air handling unit changed from constant air volume to variable frequency drive, VAV system on demand heat recovery unit. Additional Doc controls and metering. High-performance envelope and glazing system.
- 162,000 $397,000
Daylight and Views Additional glazed areas. - 25,000 $65,000
ContractorAdministration
Additional Co-ordination - 41,000 $45,000
Hard Costs Total $265,000 $731,000
Soft CostsLEED AdministrationDocumentation
LEED Registration;Additional Professional Design co-coordinators, LEED Consultant; Energy Modeler.
- $137,000 137,000
Commissioning Fundamental - $53,000 53,000
Commissioning Best Practice - - -Soft Cost Total $190,000 $190,000
TOTAL $455,000 $921,000

Alberta Infrastructure Facilities LEED Study
June 11, 2008
t:\ss\o\6-5436\LEED Certification Report – June, 08.doc
6
6.0 CASE STUDY ANALYSIS (continued)
Project Background
Dinosaur Provincial Park Visitor Centre and Tyrrell Field Station Workshop Date: June 4, 2008
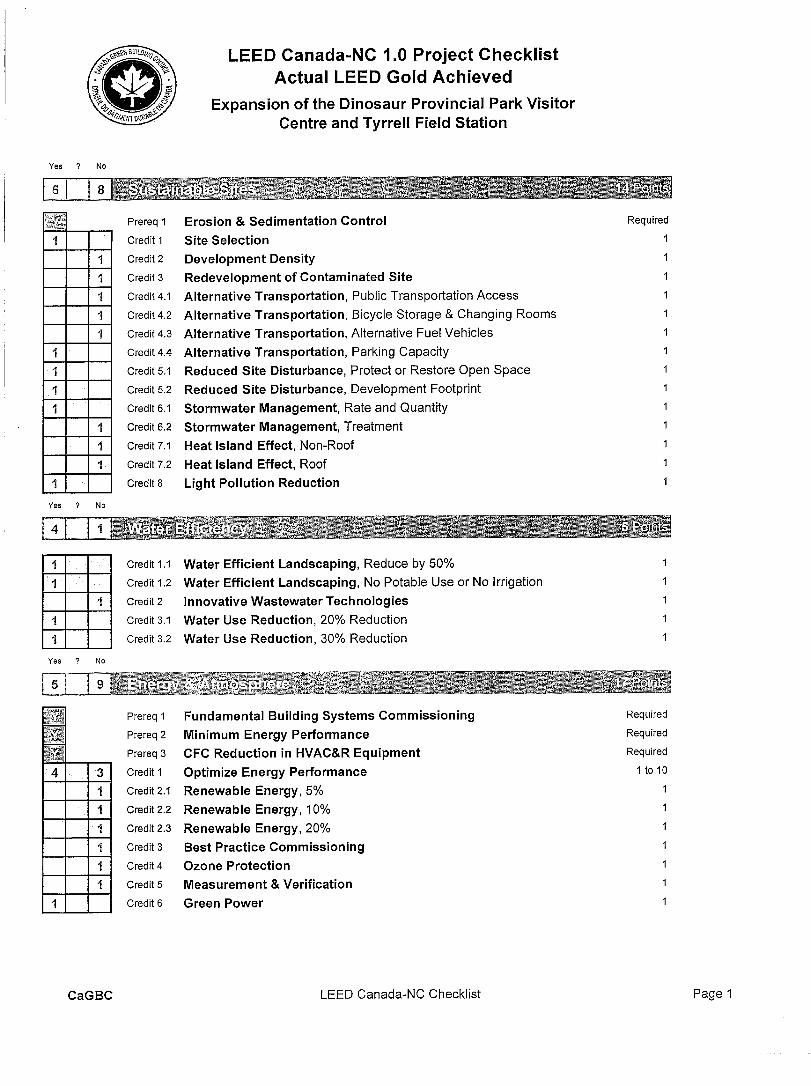
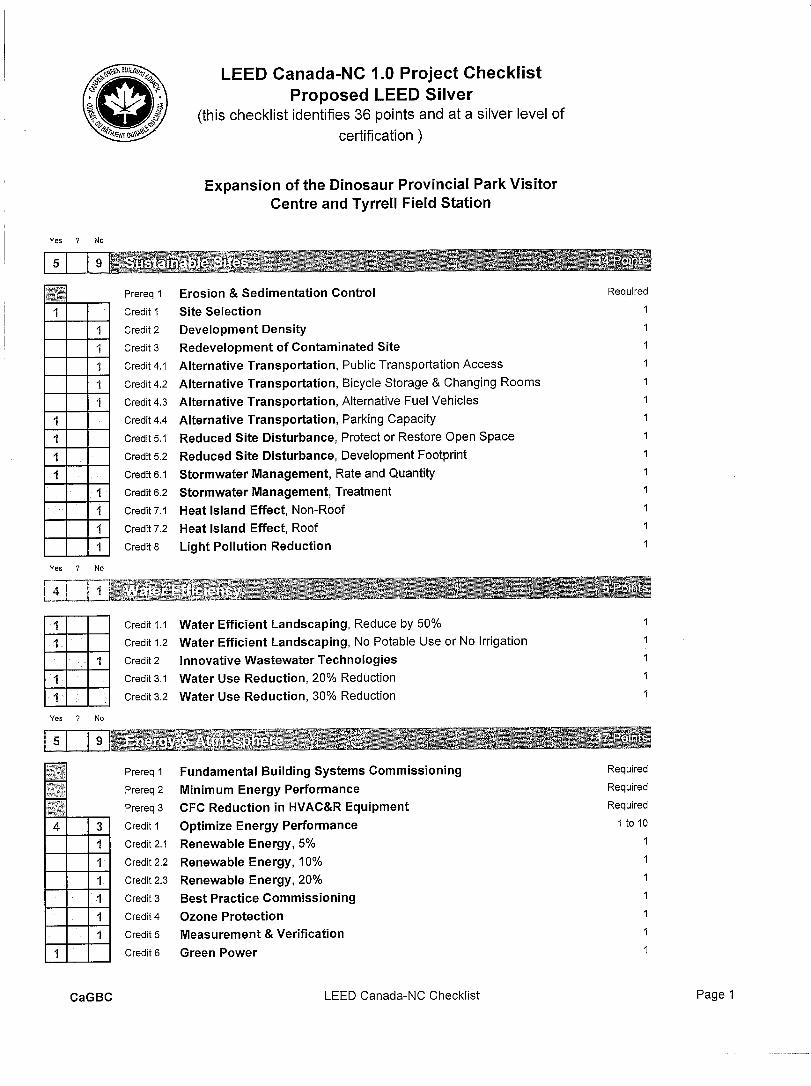
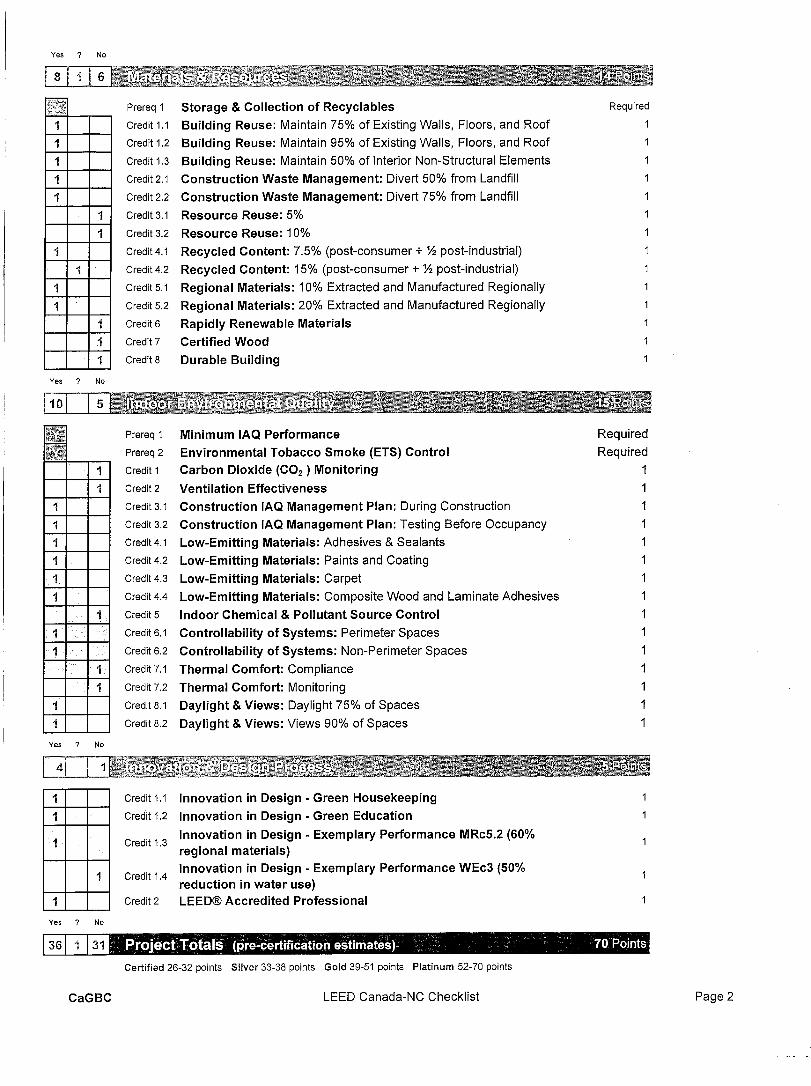
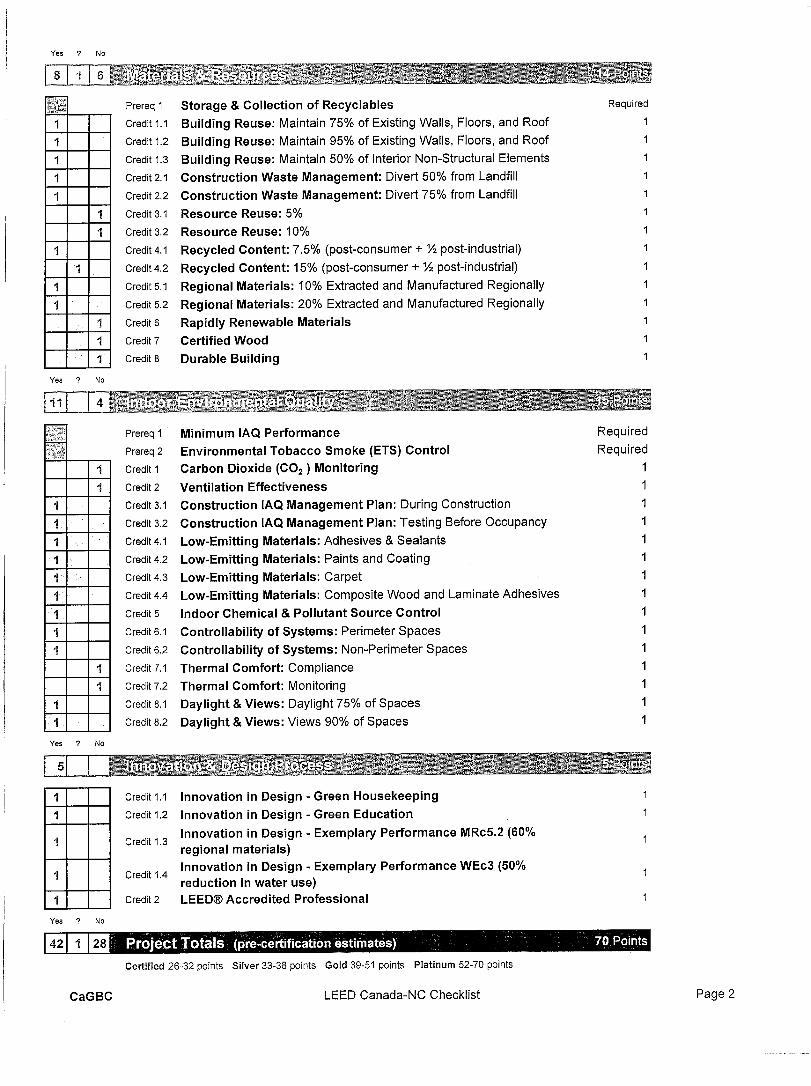
These notes to be read in conjunction with attached LEED scorecard indicating the strategies for Baseline, LEED Silver and LEED Gold and LEED checklists for LEED Silver and LEED Gold and the Actual Project Checklist (certified Gold at 39 points).
The Visitor Centre Project is a new addition to the existing Tyrrell Field Station. Owned and operated by the Government of Alberta, the project was tendered in October 2004 using a Stipulated Lump Sum form of contract with a tendered cost of $1,346,200 or $2,692.40/m2 ($250.13/sq/ft.).
The Tyrrell Field Station project is situated in an ecologically sensitive area where protection of the environment was paramount; subsequently many of the LEED requirements were baseline requirements. The area is a naturally eroding area and arid; therefore minimizing the building footprint and water usage were very important. The baseline ecological and sustainability costs for this project are therefore higher than many other projects.
Lifecycle costs were important considerations since the building is provincially owned and designed and built to be operational for many years. Calculations for the payback of the selected systems were undertaken as part of the design modeling exercise and to assist informed decision making.
Materials and systems (natural ventilation, natural light, controls) were selected to create a healthy and comfortable indoor environment; however they were not identified in a way to measure how it was successful. The Visitor Centre has few staff and many transient visitor; thus long term effects of being within the building are hard to assess. Whilst greenhouse gas emissions were not identified as a specific strategy the design sought to maximize passive and natural system (natural ventilation, daylighting) which in turn reduced the use of fossil fuels (primary and secondary).
Alberta Infrastructure Facilities LEED Study
June 11, 2008
t:\ss\o\6-5436\LEED Certification Report – June, 08.doc
7
6.0 CASE STUDY ANALYSIS (continued)
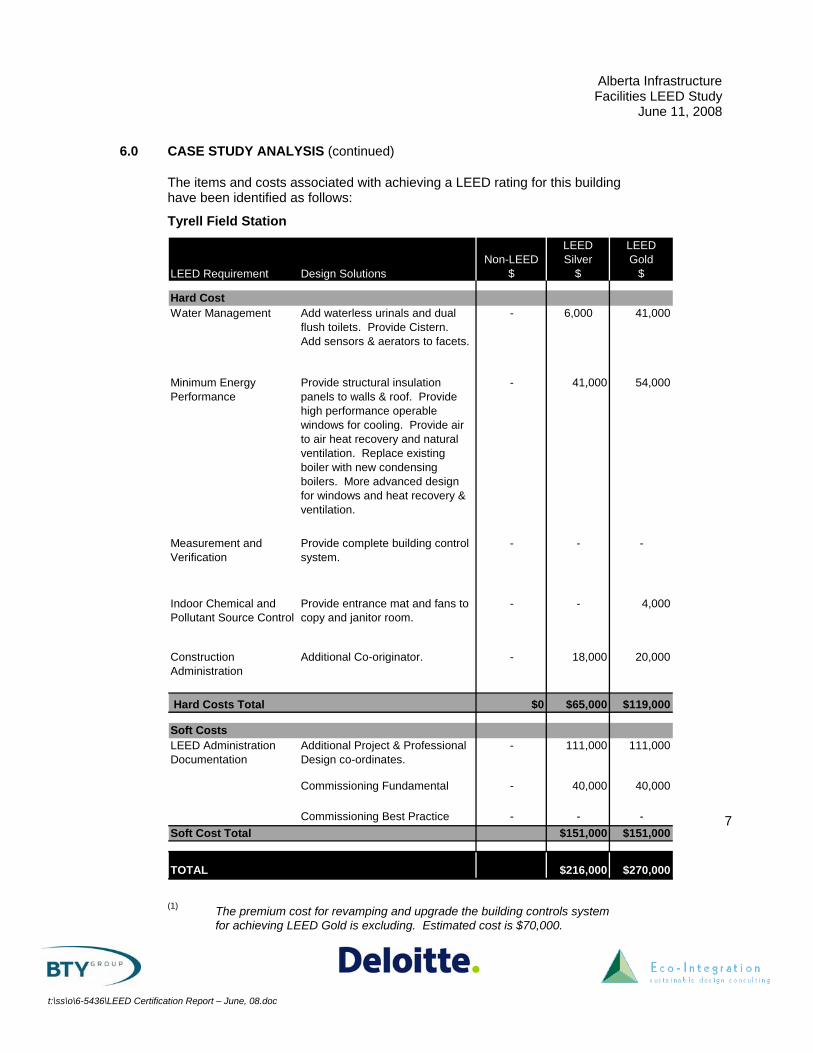
The items and costs associated with achieving a LEED rating for this building have been identified as follows:
Tyrell Field Station
LEED Requirement Design SolutionsNon-LEED
$
LEEDSilver
$
LEEDGold
$
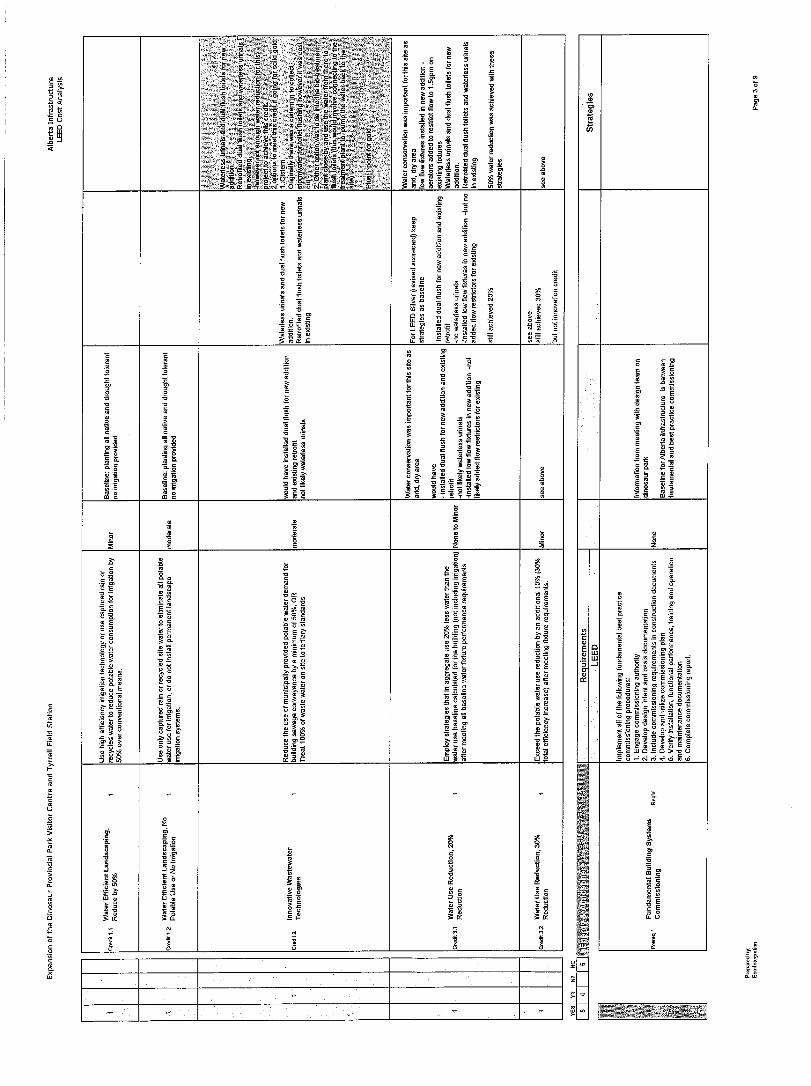
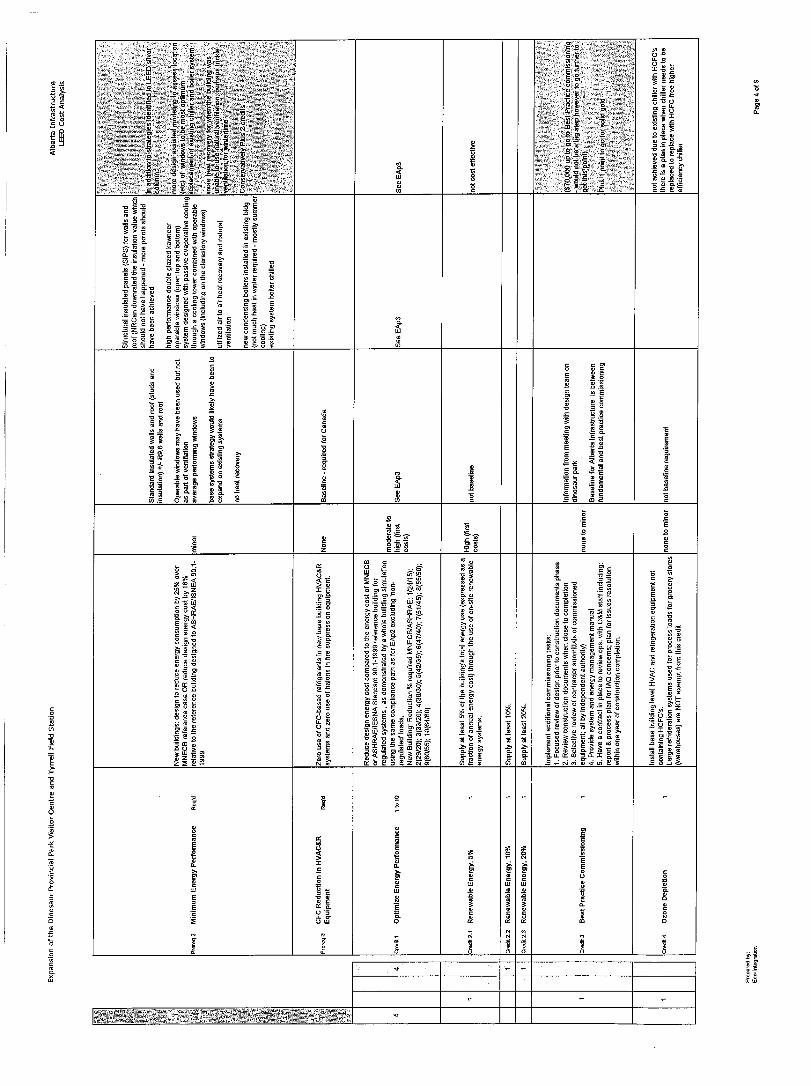
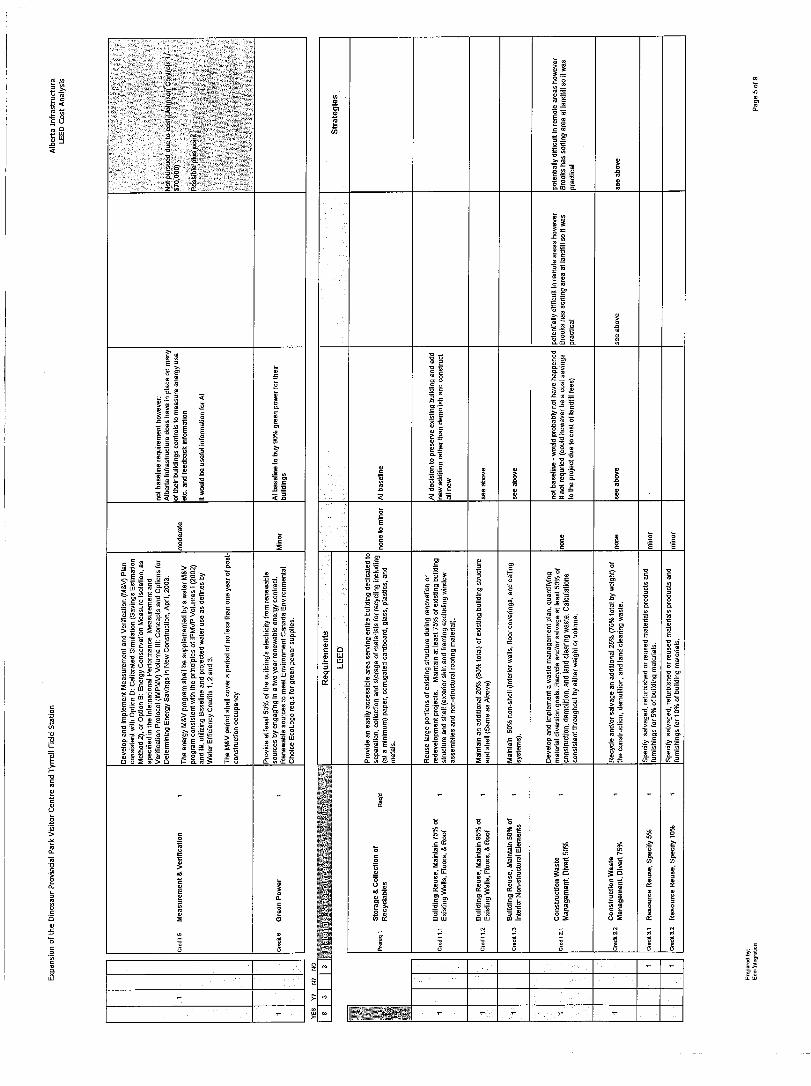
Hard CostWater Management Add waterless urinals and dual
flush toilets. Provide Cistern. Add sensors & aerators to facets.
- 6,000 41,000
Minimum Energy Performance
Provide structural insulation panels to walls & roof. Provide high performance operable windows for cooling. Provide air to air heat recovery and natural ventilation. Replace existing boiler with new condensing boilers. More advanced design for windows and heat recovery & ventilation.
- 41,000 54,000
Measurement andVerification
Provide complete building control system.
- - -
Indoor Chemical andPollutant Source Control
Provide entrance mat and fans to copy and janitor room.
- - 4,000
Construction Administration
Additional Co-originator. - 18,000 20,000
Hard Costs Total $0 $65,000 $119,000
Soft CostsLEED AdministrationDocumentation
Additional Project & Professional Design co-ordinates.
- 111,000 111,000
Commissioning Fundamental - 40,000 40,000
Commissioning Best Practice - - -Soft Cost Total $151,000 $151,000
TOTAL $216,000 $270,000 (1) The premium cost for revamping and upgrade the building controls system
for achieving LEED Gold is excluding. Estimated cost is $70,000.
Alberta Infrastructure Facilities LEED Study
June 11, 2008
t:\ss\o\6-5436\LEED Certification Report – June, 08.doc
8
6.0 CASE STUDY ANALYSIS (continued)
Project Background
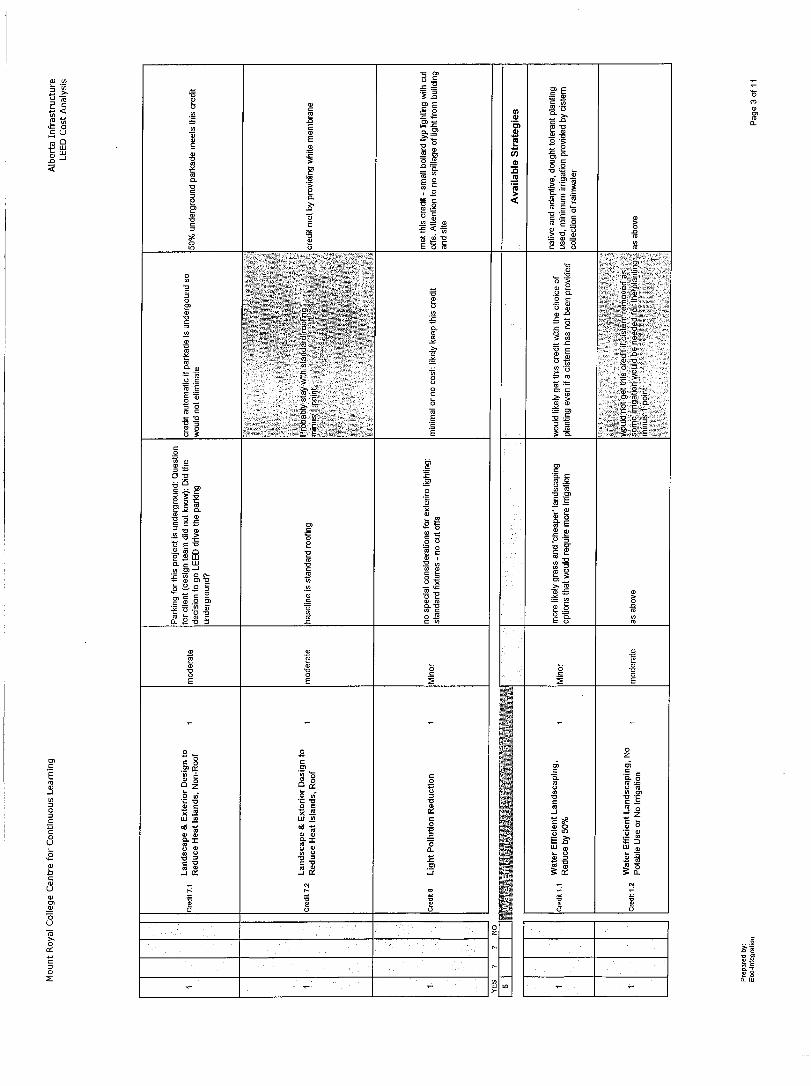
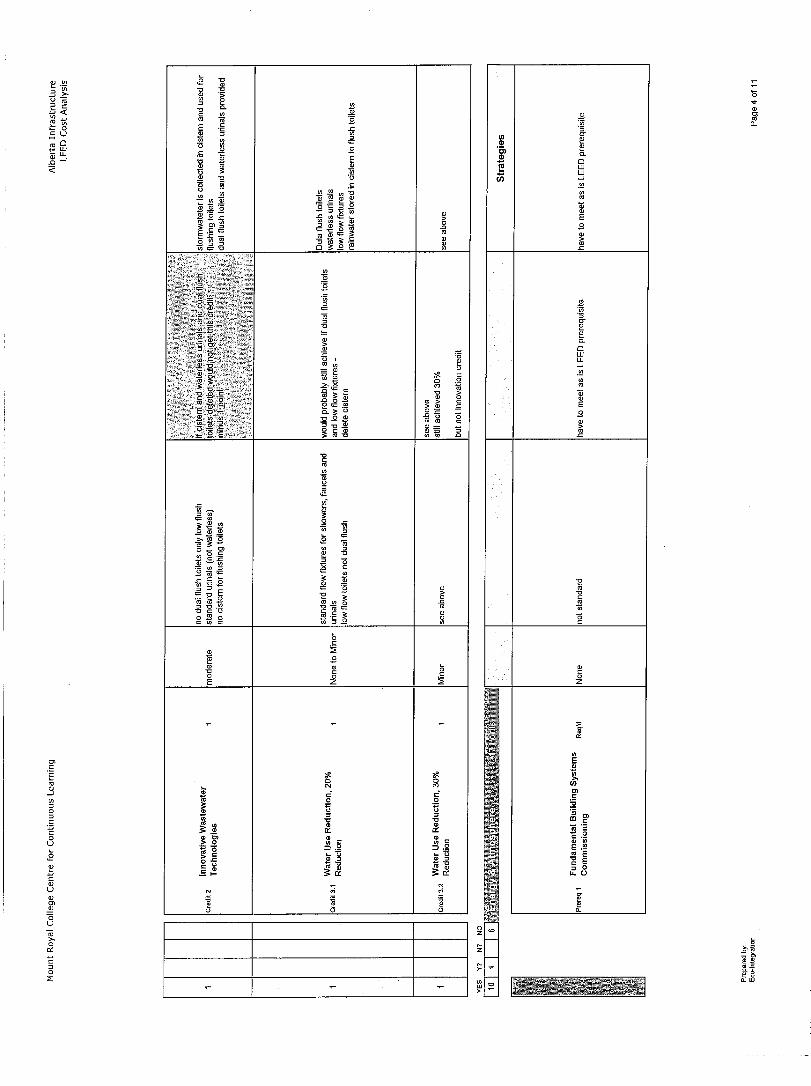
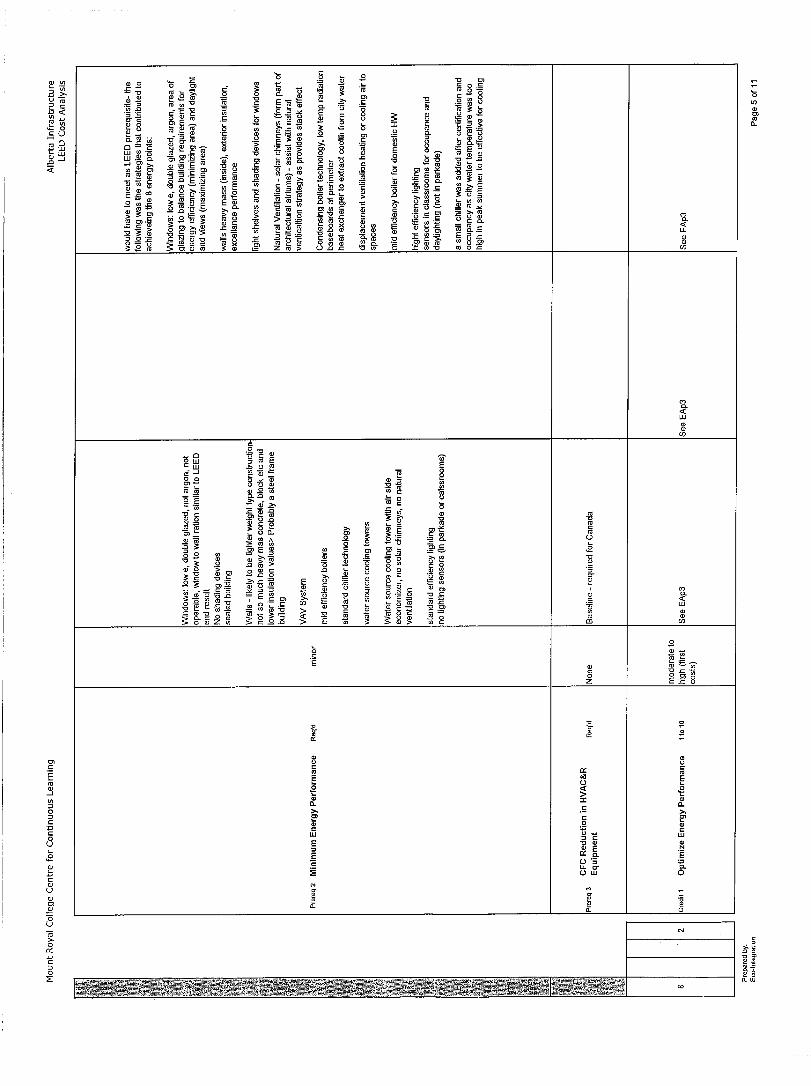
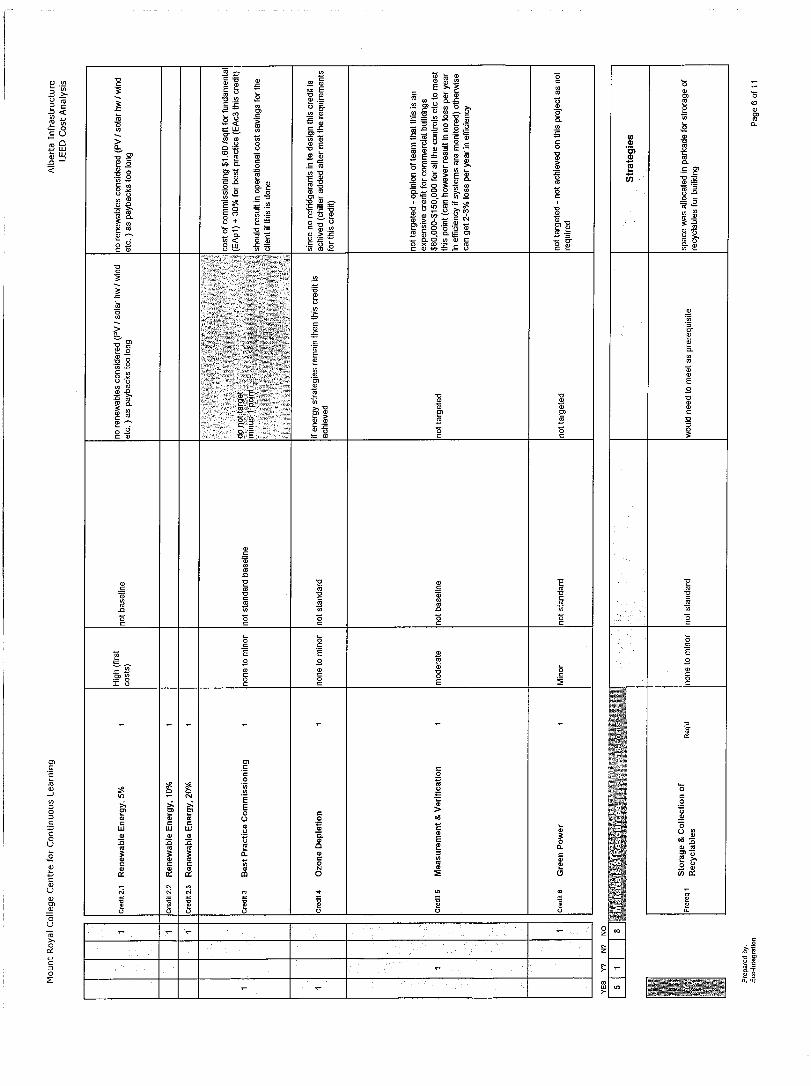
Mount Royal College Centre for Continuous Learning Workshop Date: June 3, 2008
These notes to be read in conjunction with attached LEED scorecard indicating the strategies for Baseline, LEED Silver and LEED Gold and LEED checklists for LEED Silver and LEED Gold and the Actual Project Checklist (certified Gold at 43 points).
Mount Royal College Centre for Continuous Learning is a new learning facility that is owned and operated by the Mount Royal College Board. The project was tendered in May 2005 using a Construction Management form of contract at a cost of $14,764,964 or $2,907.63/m2 ($270.27/sq.ft.).
The overall design philosophy for this project was to reduce energy demand on the building by the use of passive strategies such as heavier structure providing a heat sink, use of overhangs and other shading strategies, high performance windows and walls. Again, lifecycle costing was important since the project program considers that the college will operate the buildings over a long period of time.. Whilst productivity was not measured it was considered in the choice of the systems and building form (such as demand control ventilation, use of daylighting etc.). The overall philosophy for the project drove the reduction in the use of fossil fuels (primary and secondary).
Alberta Infrastructure Facilities LEED Study
June 11, 2008
t:\ss\o\6-5436\LEED Certification Report – June, 08.doc
9
6.0 CASE STUDY ANALYSIS (continued)
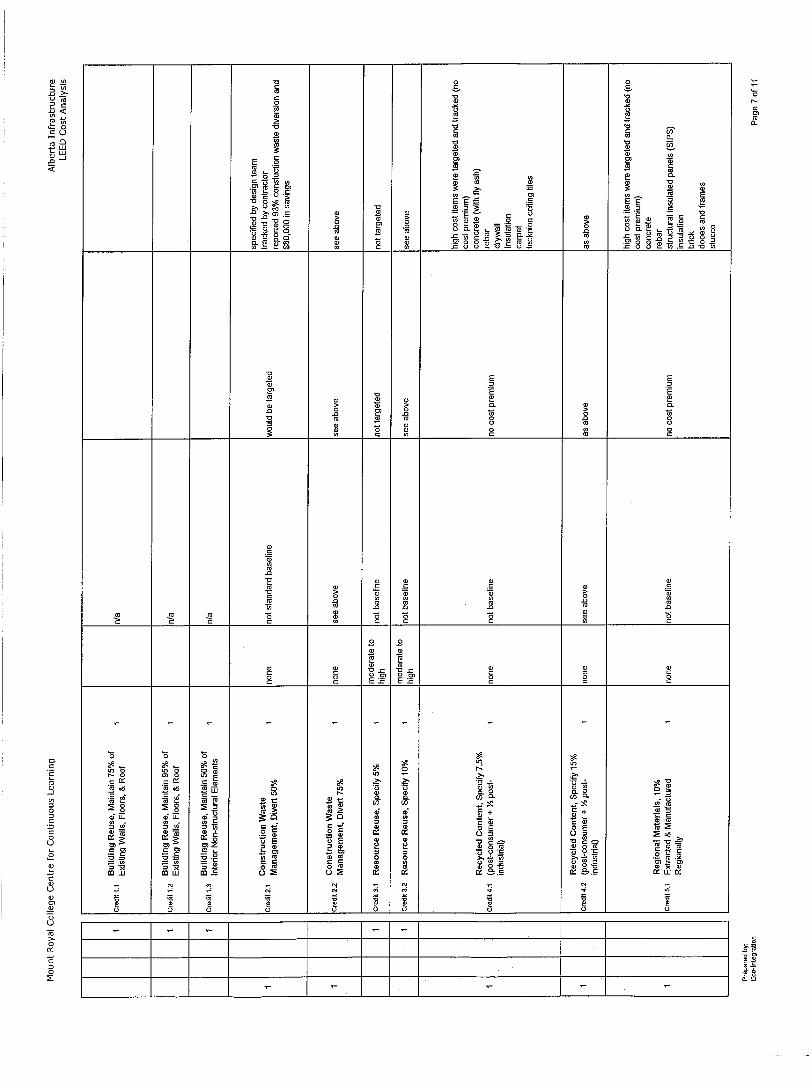
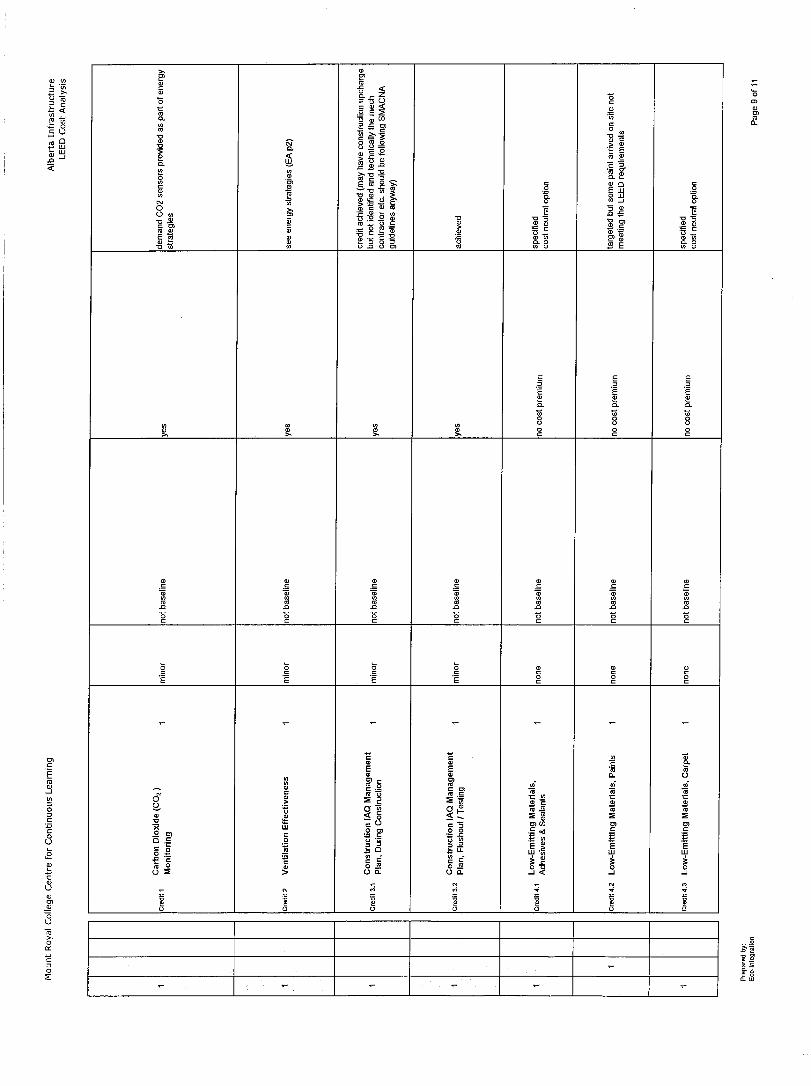
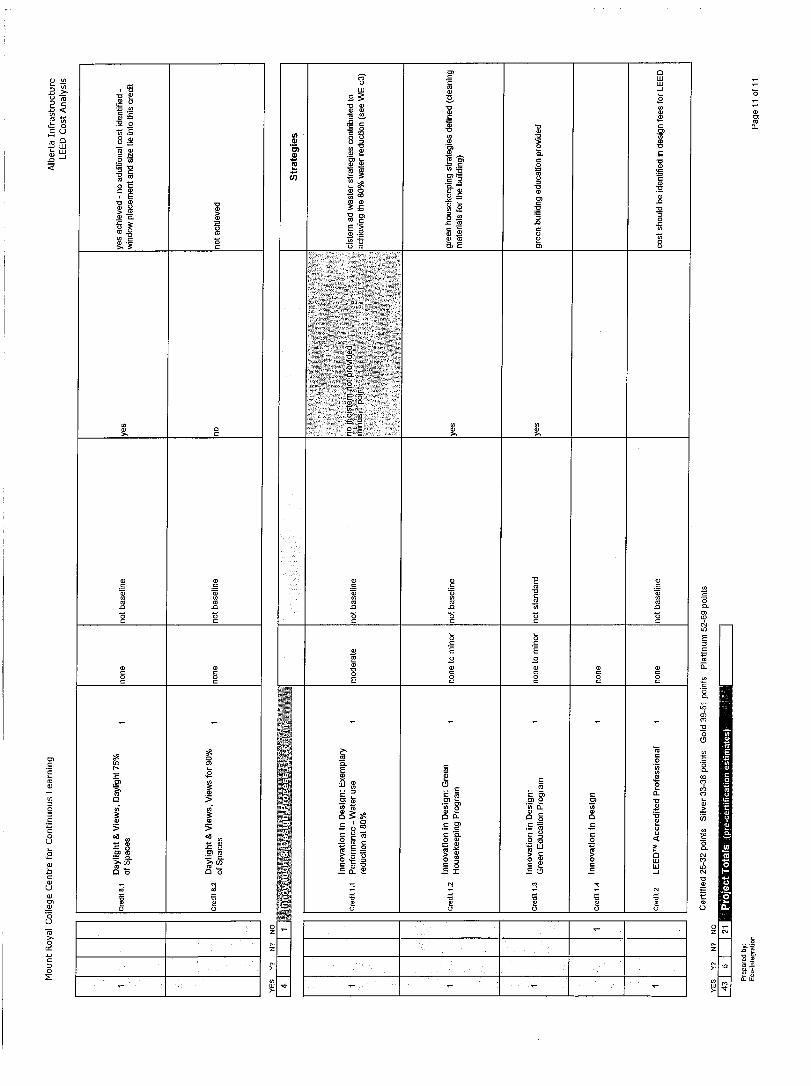
The items and costs associated with achieving a LEED rating for this building have been identified as follows:
Mount Royal College Centre for Continuous Learning
LEED Requirement Design SolutionsNon-LEED
$
LEEDSilver
$
LEEDGold
$
Hard CostStorm Management Water retaining system including
detention pond, memrane and underground piping.
- - 68,000
Landscape andExterior Design
Reduction of heat islands by use of white roof membrane.
- - 49,000
Water Management Use of local plants using less irrigation and of low flow fixtures and waterless urinals.
- 33,000 39,000
Optimize EnergyPerformance
Use of Argon-filled windows, additional glazed areas, light shelves high performance walls, displacement ventilation condensing boilers, high efficiency chiller, cooling tower and heat recovery unit. Gold Certification required demand control ventilation (CO2 sensors) natural ventilation and solar chimneys; high efficiency lighting, occupancy sensors and daylight sensors.
- 301,000 523,000
Controllability of Systems One operable window and one lighting control for 18.5m within 5m of perimeter wall.
- 16,000 16,000
Contractor Administration Additional Co-ordination - 50,000 55,000
Hard Costs Total $400,000 $750,000
Soft CostsLEED AdministrationDocumentation
LEED Registration;Additional Professional Design co-ordinators, LEED Consultant; Energy Modeler.
- 167,000 167,000
Commissioning Fundemental - 65,000 65,000Commissioning Best Practice - - -
Soft Cost Total $232,000 $232,000
TOTAL $632,000 $982,000

7.0 LEED CHECKLIST
-Chestermere Lake Elementary School


© Deloitte & Touche LLP and affiliated entities. LEED Gold Certification Cost Analysis – Summary Report
Appendix 2 – Phase 3 Supporting Analysis

© Deloitte & Touche LLP and affiliated entities. LEED Gold Certification Cost Analysis – Summary Report
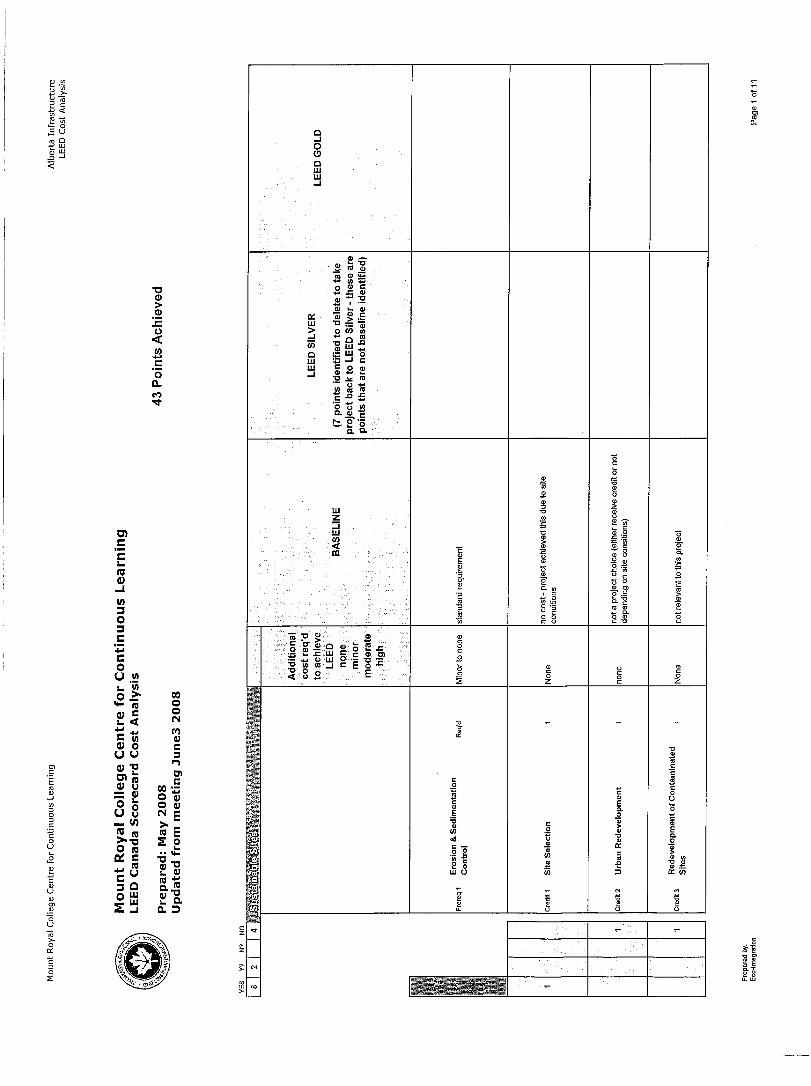
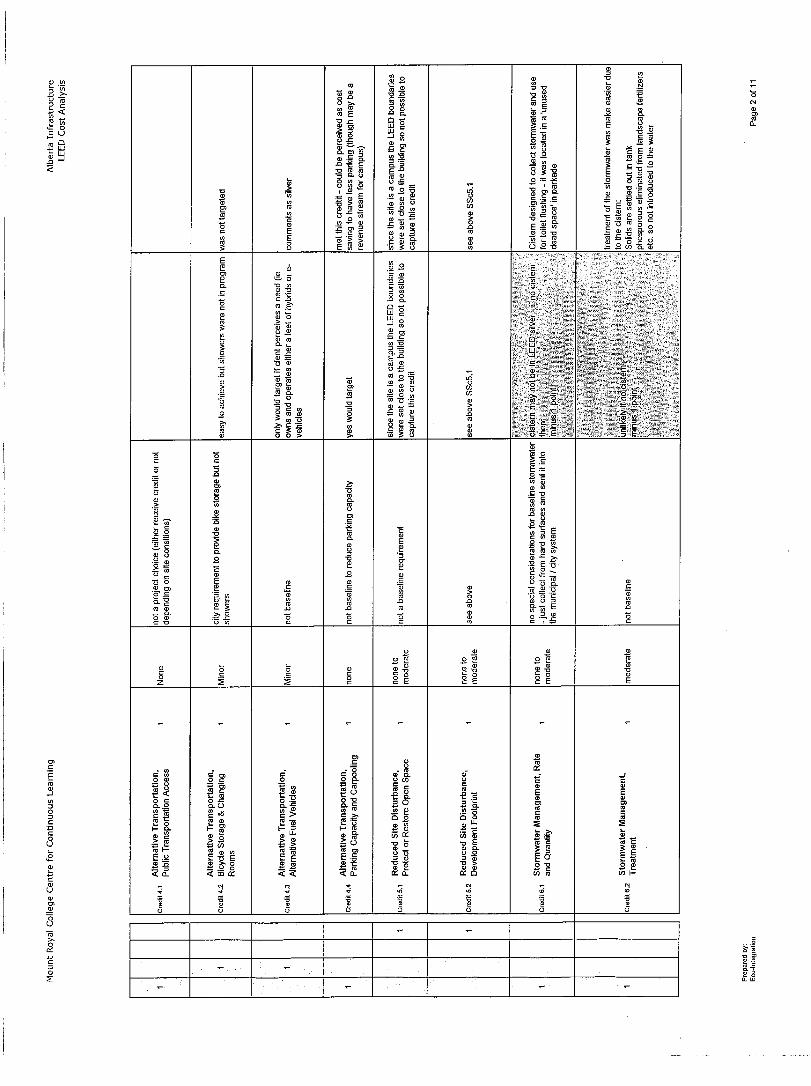
Appendix 2A – Life Cycle Costing Analysis
ALBERTA INFRASTRUCTURE Facilities LEED Study July 4, 2008
Life Cycle Costing
Alberta Infrastructure Facilities LEED Study – Life Cycle Costing
July 4, 2008
t:\ss\o\6-5436\LEED Certification Report – June, 08.doc
1
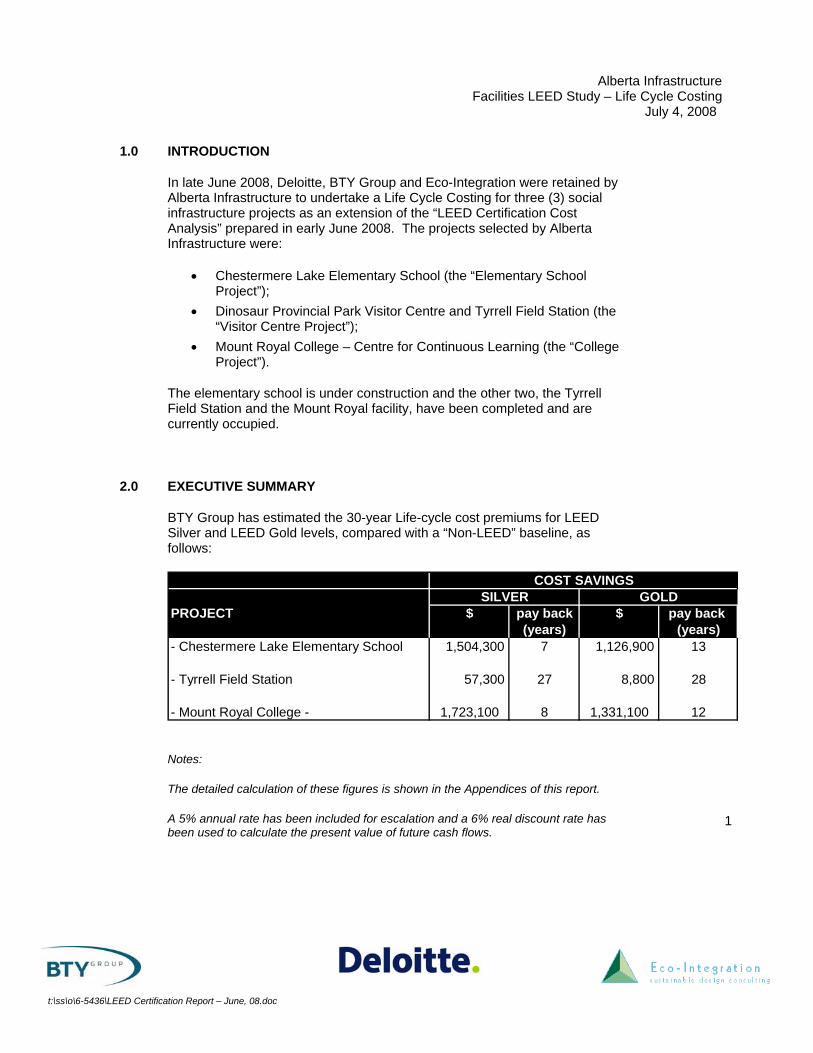
1.0 INTRODUCTION
In late June 2008, Deloitte, BTY Group and Eco-Integration were retained by Alberta Infrastructure to undertake a Life Cycle Costing for three (3) social infrastructure projects as an extension of the “LEED Certification Cost Analysis” prepared in early June 2008. The projects selected by Alberta Infrastructure were:
• Chestermere Lake Elementary School (the “Elementary School Project”);
• Dinosaur Provincial Park Visitor Centre and Tyrrell Field Station (the “Visitor Centre Project”);
• Mount Royal College – Centre for Continuous Learning (the “College Project”).
The elementary school is under construction and the other two, the Tyrrell Field Station and the Mount Royal facility, have been completed and are currently occupied.
2.0 EXECUTIVE SUMMARY
BTY Group has estimated the 30-year Life-cycle cost premiums for LEED Silver and LEED Gold levels, compared with a “Non-LEED” baseline, as follows:
PROJECT $ pay back $ pay back (years) (years)
- Chestermere Lake Elementary School 1,504,300 7 1,126,900 13
- Tyrrell Field Station 57,300 27 8,800 28
- Mount Royal College - 1,723,100 8 1,331,100 12
SILVER GOLDCOST SAVINGS
Notes:
The detailed calculation of these figures is shown in the Appendices of this report.
A 5% annual rate has been included for escalation and a 6% real discount rate has been used to calculate the present value of future cash flows.
Alberta Infrastructure Facilities LEED Study – Life Cycle Costing
July 4, 2008
t:\ss\o\6-5436\LEED Certification Report – June, 08.doc
2
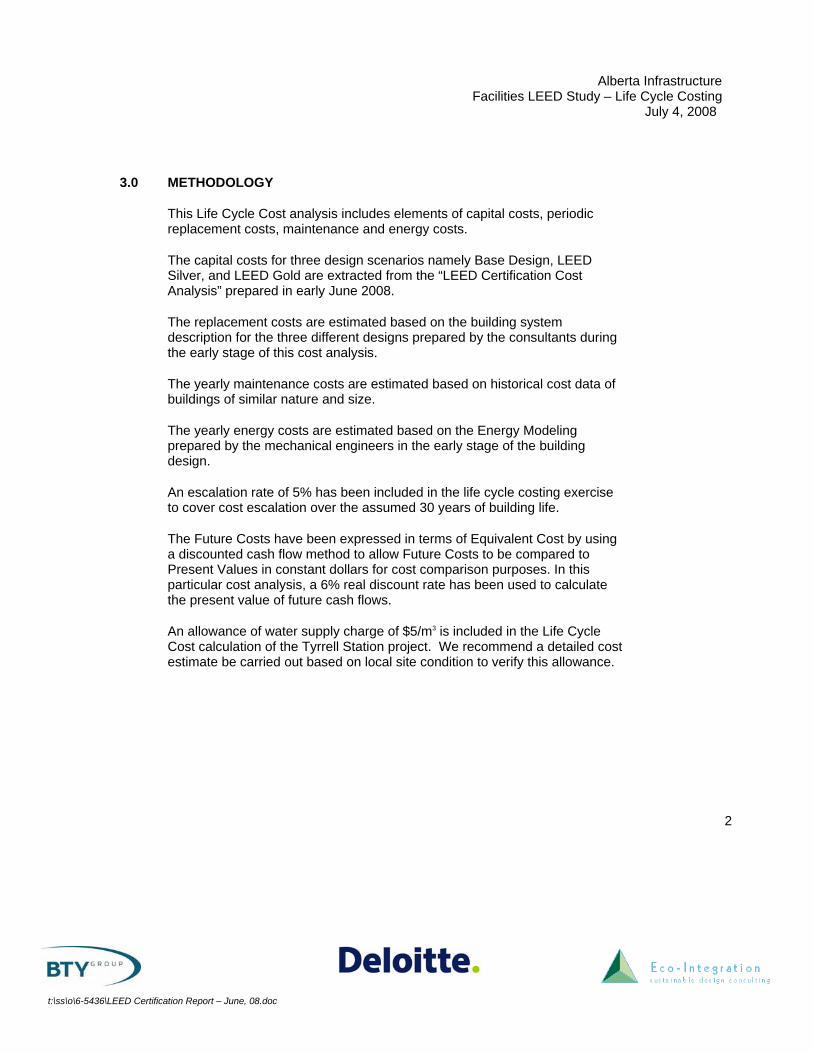
3.0 METHODOLOGY
This Life Cycle Cost analysis includes elements of capital costs, periodic replacement costs, maintenance and energy costs.
The capital costs for three design scenarios namely Base Design, LEED Silver, and LEED Gold are extracted from the “LEED Certification Cost Analysis” prepared in early June 2008.
The replacement costs are estimated based on the building system description for the three different designs prepared by the consultants during the early stage of this cost analysis.
The yearly maintenance costs are estimated based on historical cost data of buildings of similar nature and size.
The yearly energy costs are estimated based on the Energy Modeling prepared by the mechanical engineers in the early stage of the building design.
An escalation rate of 5% has been included in the life cycle costing exercise to cover cost escalation over the assumed 30 years of building life.
The Future Costs have been expressed in terms of Equivalent Cost by using a discounted cash flow method to allow Future Costs to be compared to Present Values in constant dollars for cost comparison purposes. In this particular cost analysis, a 6% real discount rate has been used to calculate the present value of future cash flows.
An allowance of water supply charge of $5/m3 is included in the Life Cycle Cost calculation of the Tyrrell Station project. We recommend a detailed cost estimate be carried out based on local site condition to verify this allowance.

APPENDIX 1
-Chestermere Lake Elementary School

Alberta Infrastructure ProjectsChestermere School
Order of Magnitude Estimate #1July 4, 2008
LIFE CYCLE COST ANALYSIS
Element : Overall BuildingGross Floor Area:Discount Rate: 6%Escalation Rate: 5%Life Cycle Period : 30 years
Estimated Present Estimated Present Estimated PresentCost Worth Cost Worth Cost Worth
$ $ $ $ $ $1.0 INITIAL COSTS
Construction Cost 10,594,600 10,594,600 10,594,600 10,594,600 10,594,600 10,594,600Premium for LEED (Hard Cost) 0 0 265,000 265,000 731,000 731,000Premium for LEED (Soft Cost) 0 0 190,000 190,000 190,000 190,000
TOTAL INITIAL COST (A) : $10,594,600 $11,049,600 $11,515,6002.0 REPLACEMENT COSTS
Replacement cost over 30 years: 615,400 403,800 464,000
TOTAL REPLACEMENT COST (B) : $615,400 $403,800 $464,0003.0 ANNUAL COSTS
Maintenance cost : - yearly capital expenditure on 92,100 2,338,400 73,700 1,871,200 78,300 1,988,000 maintenanceOperating cost : - yearly energy cost (Gas & Electricity) 102,740 2,608,500 52,305 1,328,000 41,844 1,062,400
TOTAL ANNUAL COST (C) : $4,946,900 $3,199,200 $3,050,4004.0 SUMMARY
Total Life Cycle Cost (A+B+C) ($) $16,156,900 $14,652,600 $15,030,000Variance ($) (LEED - Base) base ($1,504,300) ($1,126,900)Pay back (years) 7 13
Base Design LEED Silver LEED Gold
4,188 m²

APPENDIX 2
-Dinosaur Provincial Park Visitor Centre and
Tyrrell Field Station
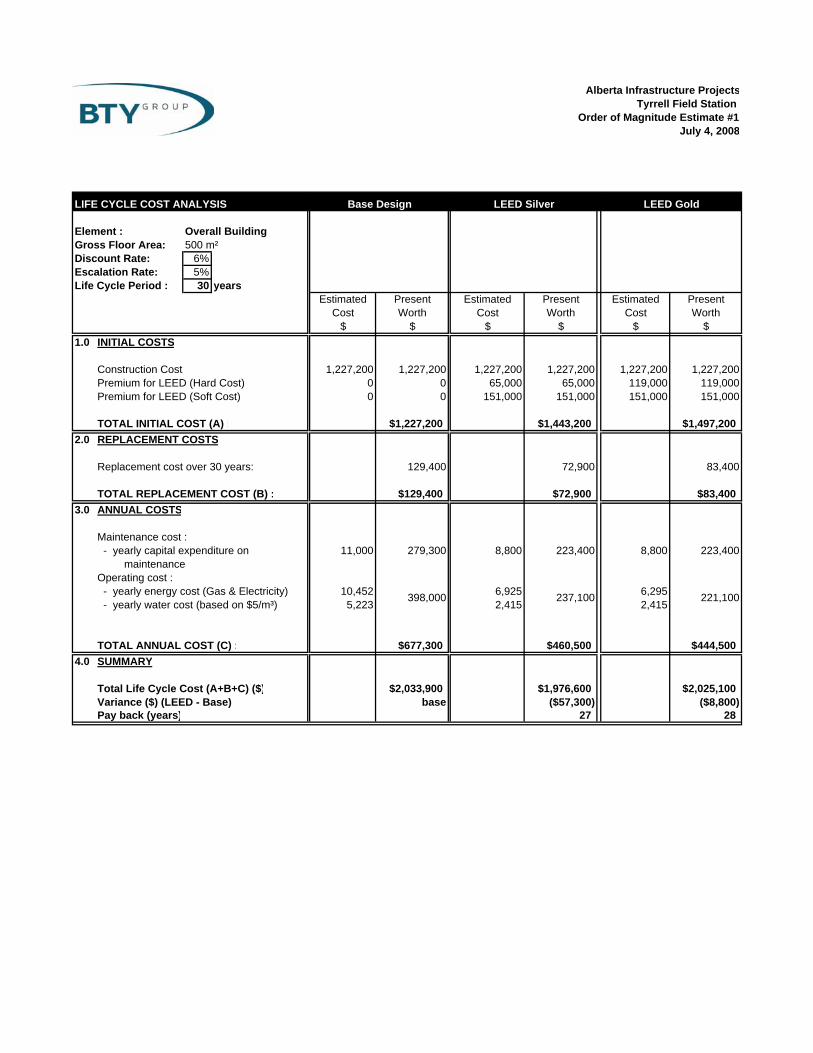
Alberta Infrastructure ProjectsTyrrell Field Station
Order of Magnitude Estimate #1July 4, 2008
LIFE CYCLE COST ANALYSIS
Element : Overall BuildingGross Floor Area:Discount Rate: 6%Escalation Rate: 5%Life Cycle Period : 30 years
Estimated Present Estimated Present Estimated PresentCost Worth Cost Worth Cost Worth
$ $ $ $ $ $1.0 INITIAL COSTS
Construction Cost 1,227,200 1,227,200 1,227,200 1,227,200 1,227,200 1,227,200Premium for LEED (Hard Cost) 0 0 65,000 65,000 119,000 119,000Premium for LEED (Soft Cost) 0 0 151,000 151,000 151,000 151,000
TOTAL INITIAL COST (A) : $1,227,200 $1,443,200 $1,497,2002.0 REPLACEMENT COSTS
Replacement cost over 30 years: 129,400 72,900 83,400
TOTAL REPLACEMENT COST (B) : $129,400 $72,900 $83,4003.0 ANNUAL COSTS
Maintenance cost : - yearly capital expenditure on 11,000 279,300 8,800 223,400 8,800 223,400 maintenanceOperating cost : - yearly energy cost (Gas & Electricity) 10,452 6,925 6,295 - yearly water cost (based on $5/m³) 5,223 2,415 2,415
TOTAL ANNUAL COST (C) : $677,300 $460,500 $444,5004.0 SUMMARY
Total Life Cycle Cost (A+B+C) ($) $2,033,900 $1,976,600 $2,025,100Variance ($) (LEED - Base) base ($57,300) ($8,800)Pay back (years) 27 28
500 m²
398,000 237,100 221,100
Base Design LEED Silver LEED Gold

APPENDIX 3
-Mount Royal College for Continuous Learning

Alberta Infrastructure ProjectsMount Royal College Centre for Continuous
Order of Magnitude Estimate #1July 4, 2008
LIFE CYCLE COST ANALYSIS
Element : Overall BuildingGross Floor Area:Discount Rate: 6%Escalation Rate: 5%Life Cycle Period : 30 years
Estimated Present Estimated Present Estimated PresentCost Worth Cost Worth Cost Worth
$ $ $ $ $ $1.0 INITIAL COSTS
Construction Cost 14,014,964 14,014,964 14,014,964 14,014,964 14,014,964 14,014,964Premium for LEED (Hard Cost) 0 0 400,000 400,000 750,000 750,000Premium for LEED (Soft Cost) 0 0 232,000 232,000 232,000 232,000
TOTAL INITIAL COST (A) : $14,014,964 $14,646,964 $14,996,9642.0 REPLACEMENT COSTS
Replacement cost over 30 years: 737,800 464,100 636,300
TOTAL REPLACEMENT COST (B) : $737,800 $464,100 $636,3003.0 ANNUAL COSTS
Maintenance cost : - yearly capital expenditure on 111,700 2,836,000 89,400 2,269,800 94,900 2,409,500 maintenanceOperating cost : - yearly energy cost (Gas & Electricity) 141,155 3,583,900 81,476 2,068,700 70,849 1,798,800
TOTAL ANNUAL COST (C) : $6,419,900 $4,338,500 $4,208,3004.0 SUMMARY
Total Life Cycle Cost (A+B+C) ($) $21,172,664 $19,449,564 $19,841,564Variance ($) (LEED - Base) base ($1,723,100) ($1,331,100)Pay back (years) 8 12
Base Design LEED Silver LEED Gold
5,078 m²
© Deloitte & Touche LLP and affiliated entities. LEED Gold Certification Cost Analysis – Summary Report
Appendix 2B – Water Consumption Analysis
Diana Klein B.Sc., P.Eng., LEED® AP Sustainable Design Consultant 5096 Dennison Drive Delta, BC V4M 1R8
Building Designs to Enhance Life
Eco- In teg ra t ion s u s t a i n a b l e d e s i g n c o n s u l t i n g
604.992.5939 [email protected]
www.eco-integration.com
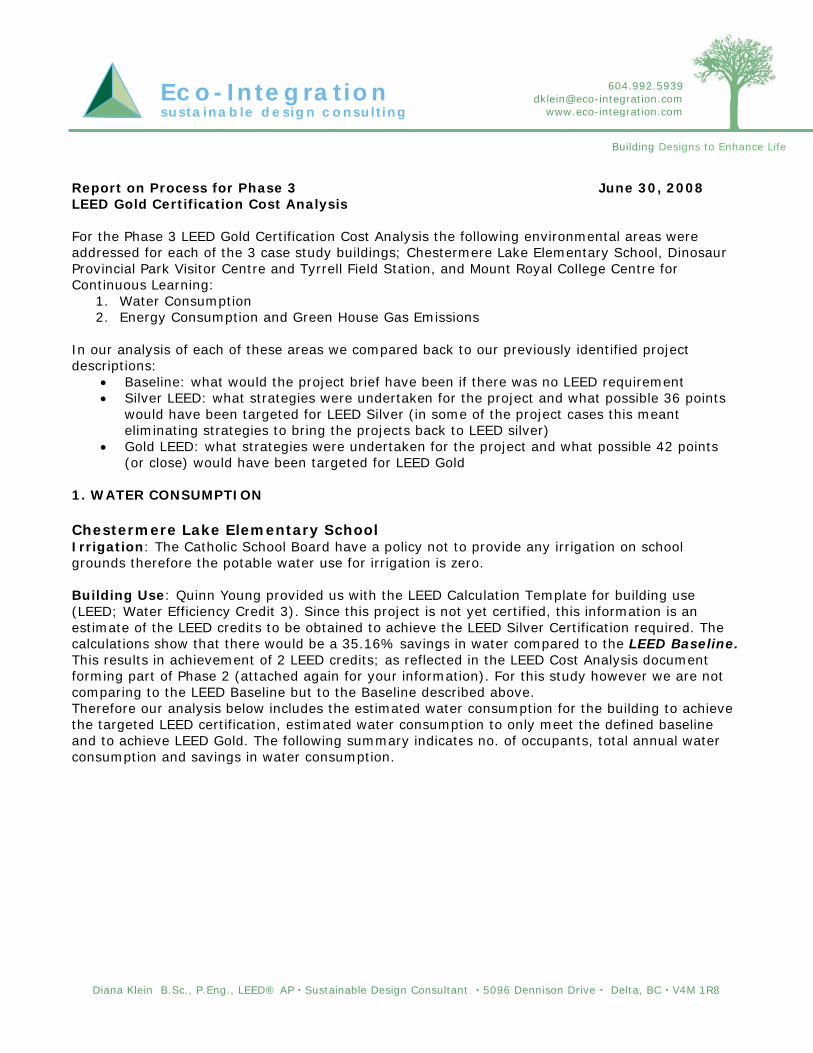
Report on Process for Phase 3 June 30, 2008 LEED Gold Certification Cost Analysis For the Phase 3 LEED Gold Certification Cost Analysis the following environmental areas were addressed for each of the 3 case study buildings; Chestermere Lake Elementary School, Dinosaur Provincial Park Visitor Centre and Tyrrell Field Station, and Mount Royal College Centre for Continuous Learning:
1. Water Consumption 2. Energy Consumption and Green House Gas Emissions
In our analysis of each of these areas we compared back to our previously identified project descriptions:
• Baseline: what would the project brief have been if there was no LEED requirement • Silver LEED: what strategies were undertaken for the project and what possible 36 points
would have been targeted for LEED Silver (in some of the project cases this meant eliminating strategies to bring the projects back to LEED silver)
• Gold LEED: what strategies were undertaken for the project and what possible 42 points (or close) would have been targeted for LEED Gold
1. WATER CONSUMPTION Chestermere Lake Elementary School Irrigation: The Catholic School Board have a policy not to provide any irrigation on school grounds therefore the potable water use for irrigation is zero. Building Use: Quinn Young provided us with the LEED Calculation Template for building use (LEED; Water Efficiency Credit 3). Since this project is not yet certified, this information is an estimate of the LEED credits to be obtained to achieve the LEED Silver Certification required. The calculations show that there would be a 35.16% savings in water compared to the LEED Baseline. This results in achievement of 2 LEED credits; as reflected in the LEED Cost Analysis document forming part of Phase 2 (attached again for your information). For this study however we are not comparing to the LEED Baseline but to the Baseline described above. Therefore our analysis below includes the estimated water consumption for the building to achieve the targeted LEED certification, estimated water consumption to only meet the defined baseline and to achieve LEED Gold. The following summary indicates no. of occupants, total annual water consumption and savings in water consumption.
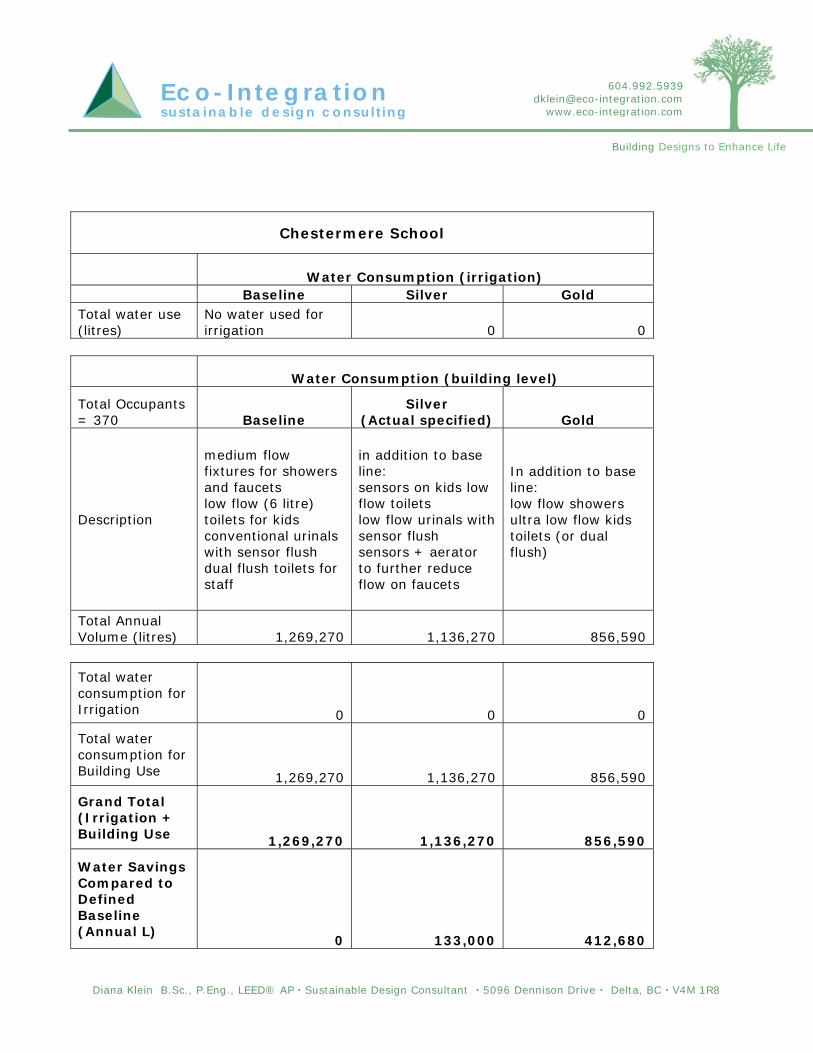
Diana Klein B.Sc., P.Eng., LEED® AP Sustainable Design Consultant 5096 Dennison Drive Delta, BC V4M 1R8
Building Designs to Enhance Life
Eco- In teg ra t ion s u s t a i n a b l e d e s i g n c o n s u l t i n g
604.992.5939 [email protected]
www.eco-integration.com
Chestermere School
Water Consumption (irrigation) Baseline Silver Gold Total water use (litres)
No water used for irrigation 0 0
Water Consumption (building level)
Total Occupants = 370 Baseline
Silver (Actual specified) Gold
Description
medium flow fixtures for showers and faucets low flow (6 litre) toilets for kids conventional urinals with sensor flush dual flush toilets for staff
in addition to base line: sensors on kids low flow toilets low flow urinals with sensor flush sensors + aerator to further reduce flow on faucets
In addition to base line: low flow showers ultra low flow kids toilets (or dual flush)
Total Annual Volume (litres) 1,269,270 1,136,270 856,590
Total water consumption for Irrigation 0 0 0
Total water consumption for Building Use 1,269,270 1,136,270 856,590
Grand Total (Irrigation + Building Use 1,269,270 1,136,270 856,590
Water Savings Compared to Defined Baseline (Annual L)
0 133,000 412,680
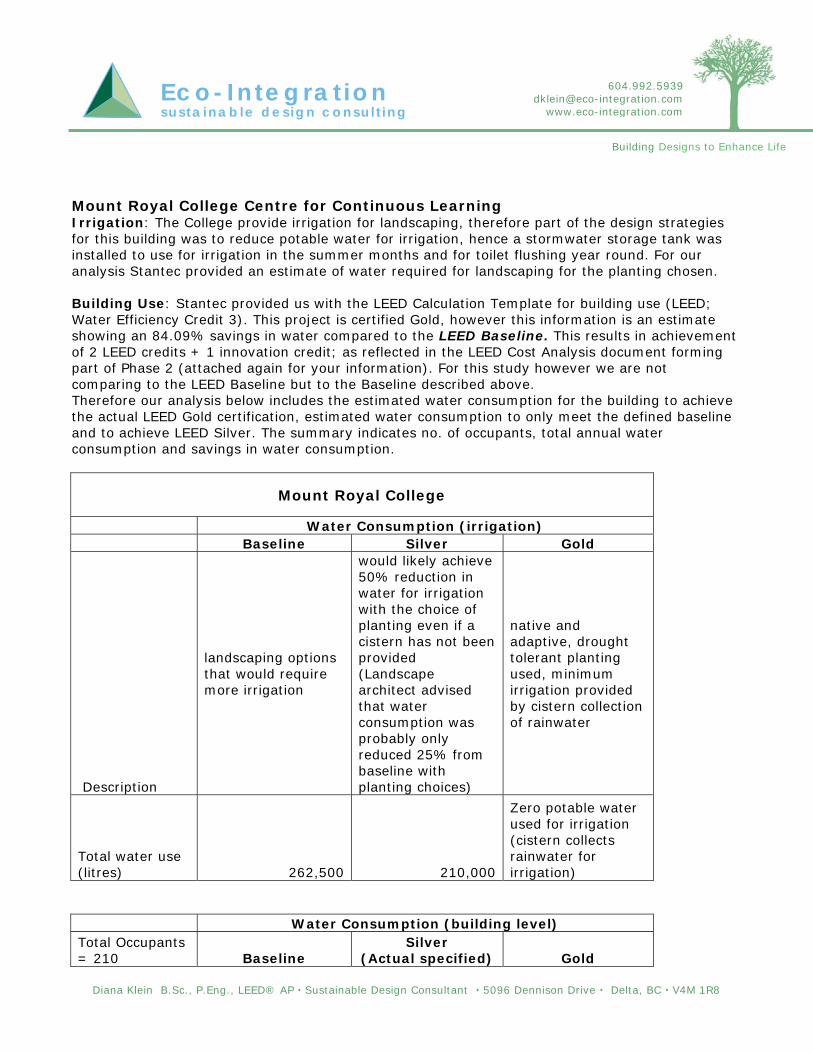
Diana Klein B.Sc., P.Eng., LEED® AP Sustainable Design Consultant 5096 Dennison Drive Delta, BC V4M 1R8
Building Designs to Enhance Life
Eco- In teg ra t ion s u s t a i n a b l e d e s i g n c o n s u l t i n g
604.992.5939 [email protected]
www.eco-integration.com
Mount Royal College Centre for Continuous Learning Irrigation: The College provide irrigation for landscaping, therefore part of the design strategies for this building was to reduce potable water for irrigation, hence a stormwater storage tank was installed to use for irrigation in the summer months and for toilet flushing year round. For our analysis Stantec provided an estimate of water required for landscaping for the planting chosen. Building Use: Stantec provided us with the LEED Calculation Template for building use (LEED; Water Efficiency Credit 3). This project is certified Gold, however this information is an estimate showing an 84.09% savings in water compared to the LEED Baseline. This results in achievement of 2 LEED credits + 1 innovation credit; as reflected in the LEED Cost Analysis document forming part of Phase 2 (attached again for your information). For this study however we are not comparing to the LEED Baseline but to the Baseline described above. Therefore our analysis below includes the estimated water consumption for the building to achieve the actual LEED Gold certification, estimated water consumption to only meet the defined baseline and to achieve LEED Silver. The summary indicates no. of occupants, total annual water consumption and savings in water consumption.
Mount Royal College
Water Consumption (irrigation) Baseline Silver Gold
Description
landscaping options that would require more irrigation
would likely achieve 50% reduction in water for irrigation with the choice of planting even if a cistern has not been provided (Landscape architect advised that water consumption was probably only reduced 25% from baseline with planting choices)
native and adaptive, drought tolerant planting used, minimum irrigation provided by cistern collection of rainwater
Total water use (litres) 262,500 210,000
Zero potable water used for irrigation (cistern collects rainwater for irrigation)
Water Consumption (building level) Total Occupants = 210 Baseline
Silver (Actual specified) Gold
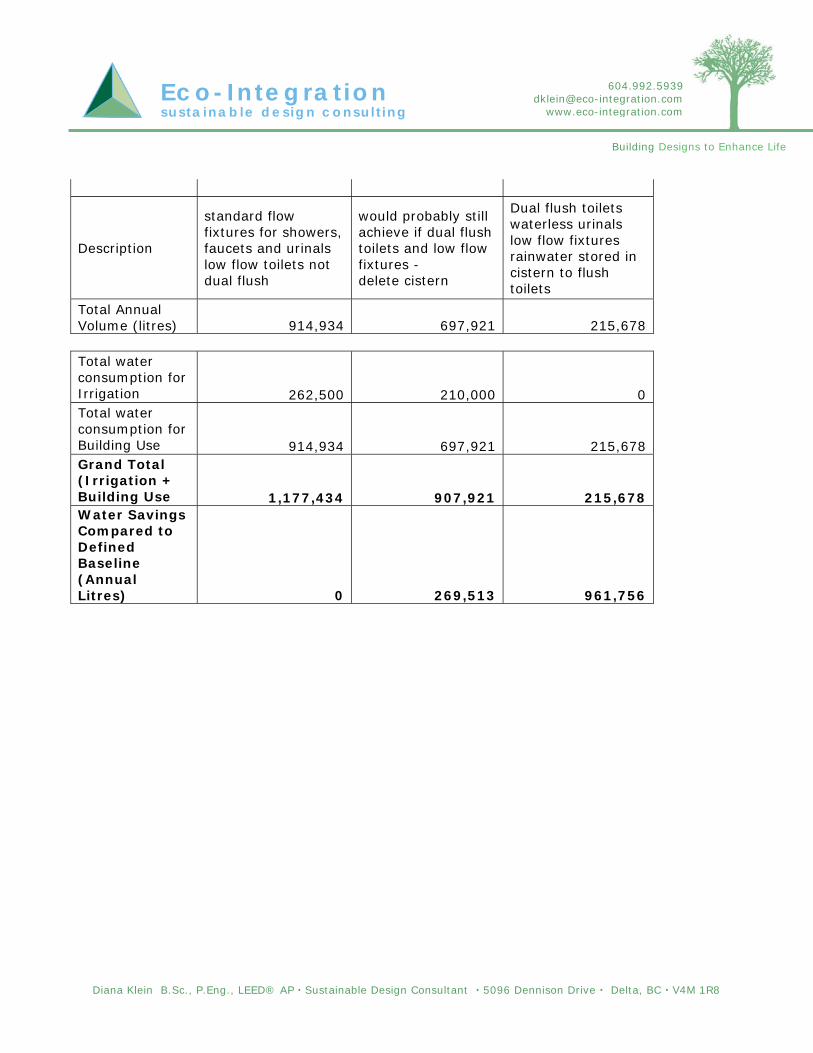
Diana Klein B.Sc., P.Eng., LEED® AP Sustainable Design Consultant 5096 Dennison Drive Delta, BC V4M 1R8
Building Designs to Enhance Life
Eco- In teg ra t ion s u s t a i n a b l e d e s i g n c o n s u l t i n g
604.992.5939 [email protected]
www.eco-integration.com
Description
standard flow fixtures for showers, faucets and urinals low flow toilets not dual flush
would probably still achieve if dual flush toilets and low flow fixtures - delete cistern
Dual flush toilets waterless urinals low flow fixtures rainwater stored in cistern to flush toilets
Total Annual Volume (litres) 914,934 697,921 215,678 Total water consumption for Irrigation 262,500 210,000 0 Total water consumption for Building Use 914,934 697,921 215,678 Grand Total (Irrigation + Building Use 1,177,434 907,921 215,678 Water Savings Compared to Defined Baseline (Annual Litres) 0 269,513 961,756
Diana Klein B.Sc., P.Eng., LEED® AP Sustainable Design Consultant 5096 Dennison Drive Delta, BC V4M 1R8
Building Designs to Enhance Life
Eco- In teg ra t ion s u s t a i n a b l e d e s i g n c o n s u l t i n g
604.992.5939 [email protected]
www.eco-integration.com
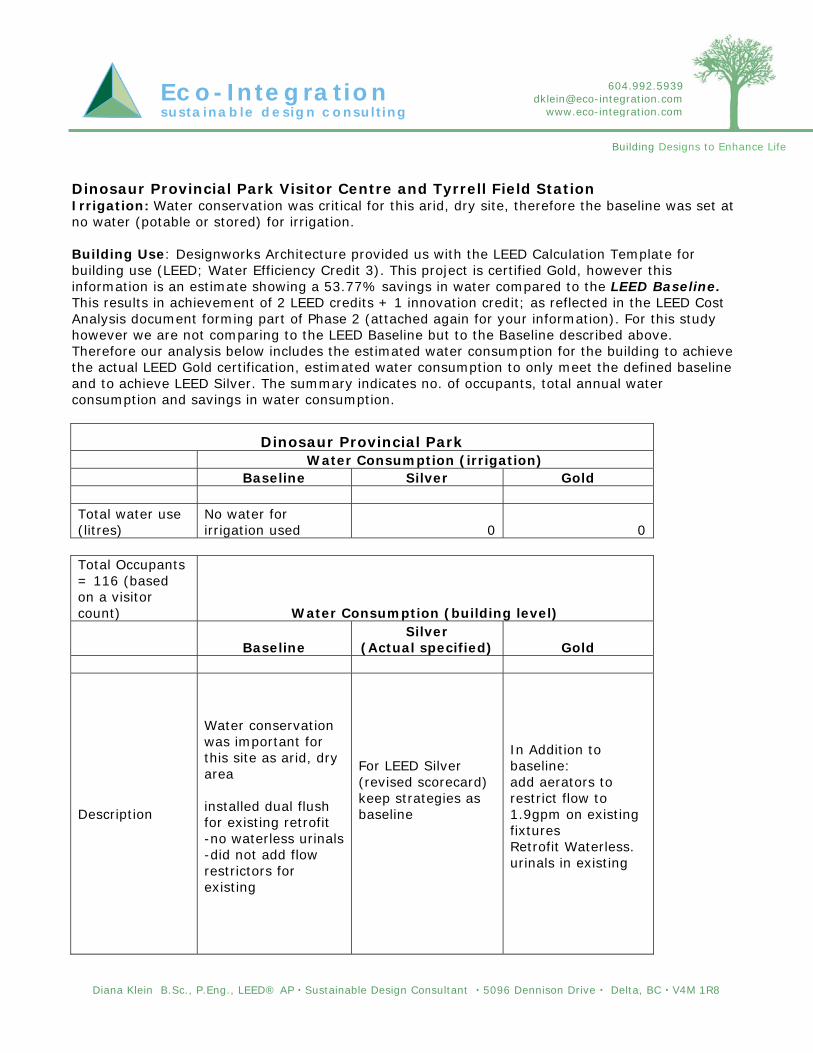
Diana Klein B.Sc., P.Eng., LEED® AP Sustainable Design Consultant 5096 Dennison Drive Delta, BC V4M 1R8
Building Designs to Enhance Life
Eco- In teg ra t ion s u s t a i n a b l e d e s i g n c o n s u l t i n g
604.992.5939 [email protected]
www.eco-integration.com
Dinosaur Provincial Park Visitor Centre and Tyrrell Field Station Irrigation: Water conservation was critical for this arid, dry site, therefore the baseline was set at no water (potable or stored) for irrigation. Building Use: Designworks Architecture provided us with the LEED Calculation Template for building use (LEED; Water Efficiency Credit 3). This project is certified Gold, however this information is an estimate showing a 53.77% savings in water compared to the LEED Baseline. This results in achievement of 2 LEED credits + 1 innovation credit; as reflected in the LEED Cost Analysis document forming part of Phase 2 (attached again for your information). For this study however we are not comparing to the LEED Baseline but to the Baseline described above. Therefore our analysis below includes the estimated water consumption for the building to achieve the actual LEED Gold certification, estimated water consumption to only meet the defined baseline and to achieve LEED Silver. The summary indicates no. of occupants, total annual water consumption and savings in water consumption.
Dinosaur Provincial Park Water Consumption (irrigation) Baseline Silver Gold Total water use (litres)
No water for irrigation used 0 0
Total Occupants = 116 (based on a visitor count) Water Consumption (building level)
Baseline Silver
(Actual specified) Gold
Description
Water conservation was important for this site as arid, dry area installed dual flush for existing retrofit -no waterless urinals -did not add flow restrictors for existing
For LEED Silver (revised scorecard) keep strategies as baseline
In Addition to baseline: add aerators to restrict flow to 1.9gpm on existing fixtures Retrofit Waterless. urinals in existing
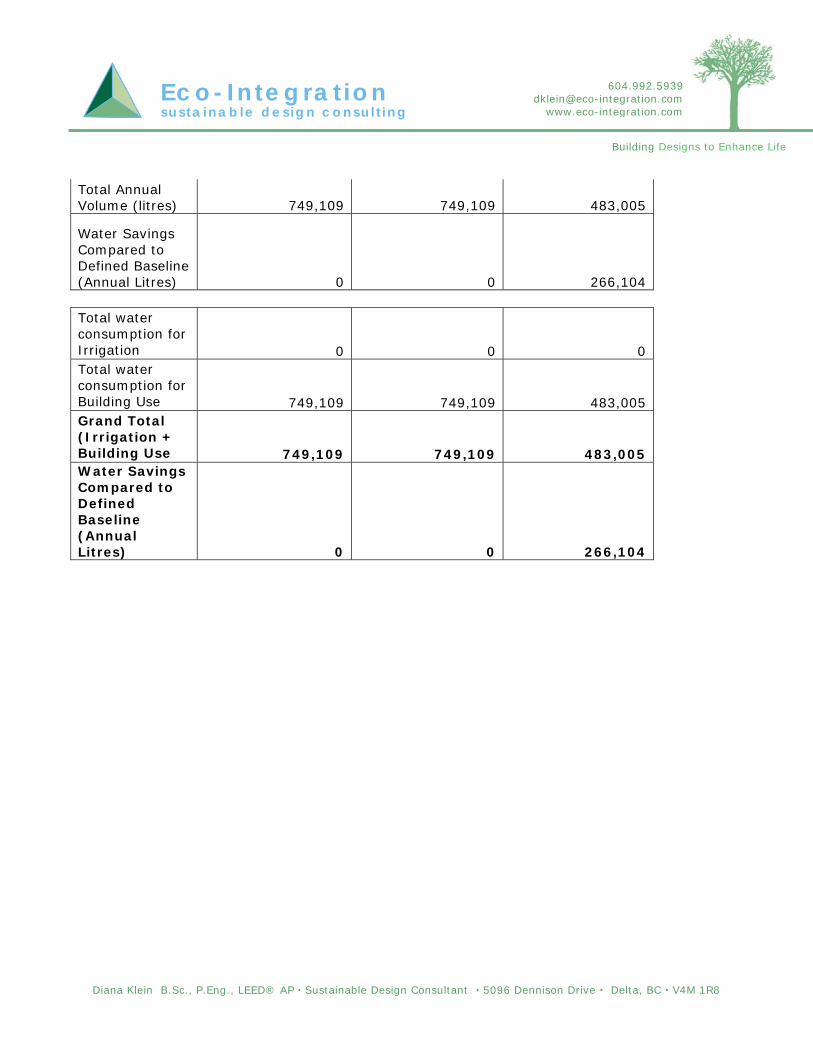
Diana Klein B.Sc., P.Eng., LEED® AP Sustainable Design Consultant 5096 Dennison Drive Delta, BC V4M 1R8
Building Designs to Enhance Life
Eco- In teg ra t ion s u s t a i n a b l e d e s i g n c o n s u l t i n g
604.992.5939 [email protected]
www.eco-integration.com
Total Annual Volume (litres) 749,109 749,109 483,005
Water Savings Compared to Defined Baseline (Annual Litres) 0 0 266,104 Total water consumption for Irrigation 0 0 0 Total water consumption for Building Use 749,109 749,109 483,005 Grand Total (Irrigation + Building Use 749,109 749,109 483,005 Water Savings Compared to Defined Baseline (Annual Litres) 0 0 266,104
Diana Klein B.Sc., P.Eng., LEED® AP Sustainable Design Consultant 5096 Dennison Drive Delta, BC V4M 1R8
Building Designs to Enhance Life
Eco- In teg ra t ion s u s t a i n a b l e d e s i g n c o n s u l t i n g
604.992.5939 [email protected]
www.eco-integration.com
2.0 ENERGY CONSUMPTION and GHG Energy modeling reports were provided by the design teams for each of the three case studies and these numbers have been used in the following analysis. The modeling results in the energy design reports are for the reference building (as defined by MNECB), and the proposed building (designed and outlined in the LEED Cost Analysis document). Energy modeling has not been done for our defined baseline, and a variety of LEED levels. We have therefore estimated the energy consumption based on number of assumed points for various levels of LEED. From these numbers we have then estimated the GHG emission savings for LEED Gold and LEED Silver compared to our defined baseline levels. The attached spreadsheet is a summary of these results.
© Deloitte & Touche LLP and affiliated entities. LEED Gold Certification Cost Analysis – Summary Report
Appendix 2C – Energy Consumption Analysis
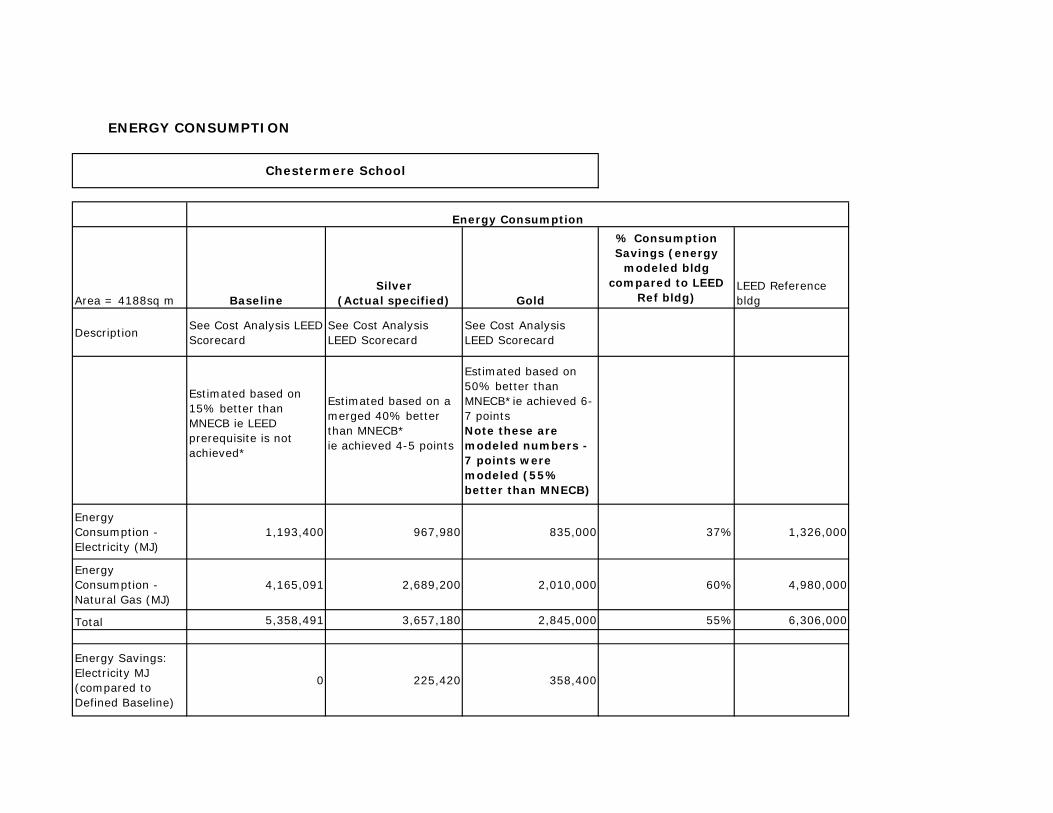
Area = 4188sq m BaselineSilver
(Actual specified) Gold
% Consumption Savings (energy
modeled bldg compared to LEED
Ref bldg)LEED Reference bldg
DescriptionSee Cost Analysis LEED Scorecard
See Cost Analysis LEED Scorecard
See Cost Analysis LEED Scorecard
Estimated based on 15% better than MNECB ie LEED prerequisite is not achieved*
Estimated based on a merged 40% better than MNECB* ie achieved 4-5 points
Estimated based on 50% better than MNECB*ie achieved 6-7 pointsNote these are modeled numbers - 7 points were modeled (55% better than MNECB)
Energy Consumption - Electricity (MJ)
1,193,400 967,980 835,000 37% 1,326,000
Energy Consumption - Natural Gas (MJ)
4,165,091 2,689,200 2,010,000 60% 4,980,000
Total 5,358,491 3,657,180 2,845,000 55% 6,306,000
Energy Savings: Electricity MJ (compared to Defined Baseline)
0 225,420 358,400
Chestermere School
ENERGY CONSUMPTION
Energy Consumption
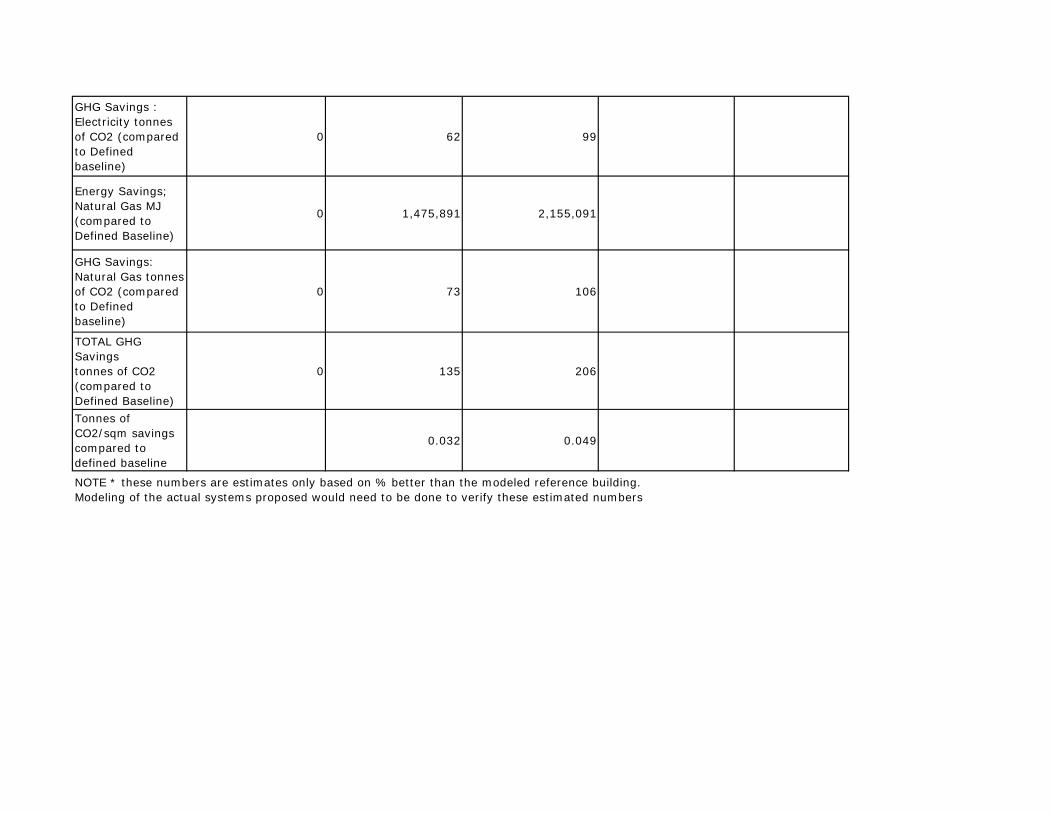
GHG Savings : Electricity tonnes of CO2 (compared to Defined baseline)
0 62 99
Energy Savings; Natural Gas MJ (compared to Defined Baseline)
0 1,475,891 2,155,091
GHG Savings: Natural Gas tonnes of CO2 (compared to Defined baseline)
0 73 106
TOTAL GHG Savingstonnes of CO2 (compared to Defined Baseline)
0 135 206
Tonnes of CO2/sqm savings compared to defined baseline
0.032 0.049
NOTE * these numbers are estimates only based on % better than the modeled reference building. Modeling of the actual systems proposed would need to be done to verify these estimated numbers
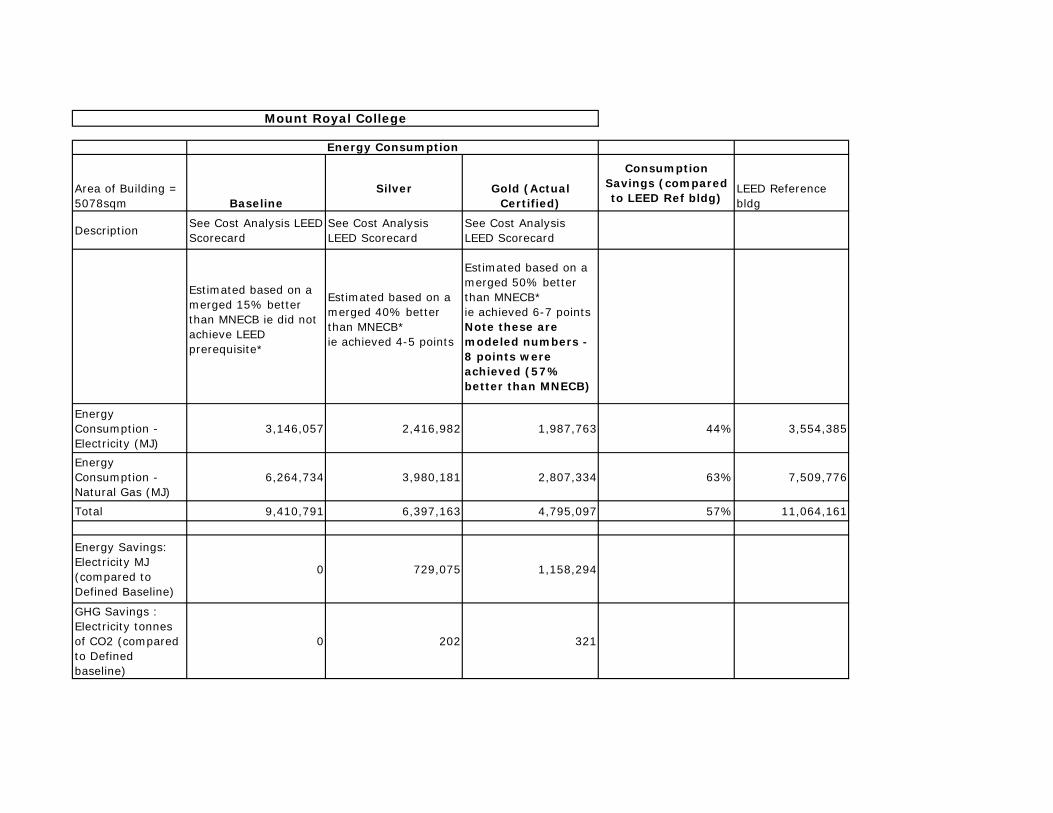
Area of Building = 5078sqm Baseline
Silver Gold (Actual Certified)
Consumption Savings (compared to LEED Ref bldg)
LEED Reference bldg
DescriptionSee Cost Analysis LEED Scorecard
See Cost Analysis LEED Scorecard
See Cost Analysis LEED Scorecard
Estimated based on a merged 15% better than MNECB ie did not achieve LEED prerequisite*
Estimated based on a merged 40% better than MNECB* ie achieved 4-5 points
Estimated based on a merged 50% better than MNECB* ie achieved 6-7 pointsNote these are modeled numbers - 8 points were achieved (57% better than MNECB)
Energy Consumption - Electricity (MJ)
3,146,057 2,416,982 1,987,763 44% 3,554,385
Energy Consumption - Natural Gas (MJ)
6,264,734 3,980,181 2,807,334 63% 7,509,776
Total 9,410,791 6,397,163 4,795,097 57% 11,064,161
Energy Savings: Electricity MJ (compared to Defined Baseline)
0 729,075 1,158,294
GHG Savings : Electricity tonnes of CO2 (compared to Defined baseline)
0 202 321
Mount Royal College
Energy Consumption

Energy Savings; Natural Gas MJ (compared to Defined Baseline)
0 2,284,553 3,457,400
GHG Savings: Natural Gas tonnes of CO2 (compared to Defined baseline)
0 113 171
TOTAL GHG Savingstonnes of CO2 (compared to Defined Baseline)
0 315 492
Tonnes of CO2/sqm savings compared to defined baseline
0.062 0.097
NOTE * these numbers are estimates only based on % better than the modeled reference building. Modeling of the actual systems proposed would need to be done to verify these estimated numbers
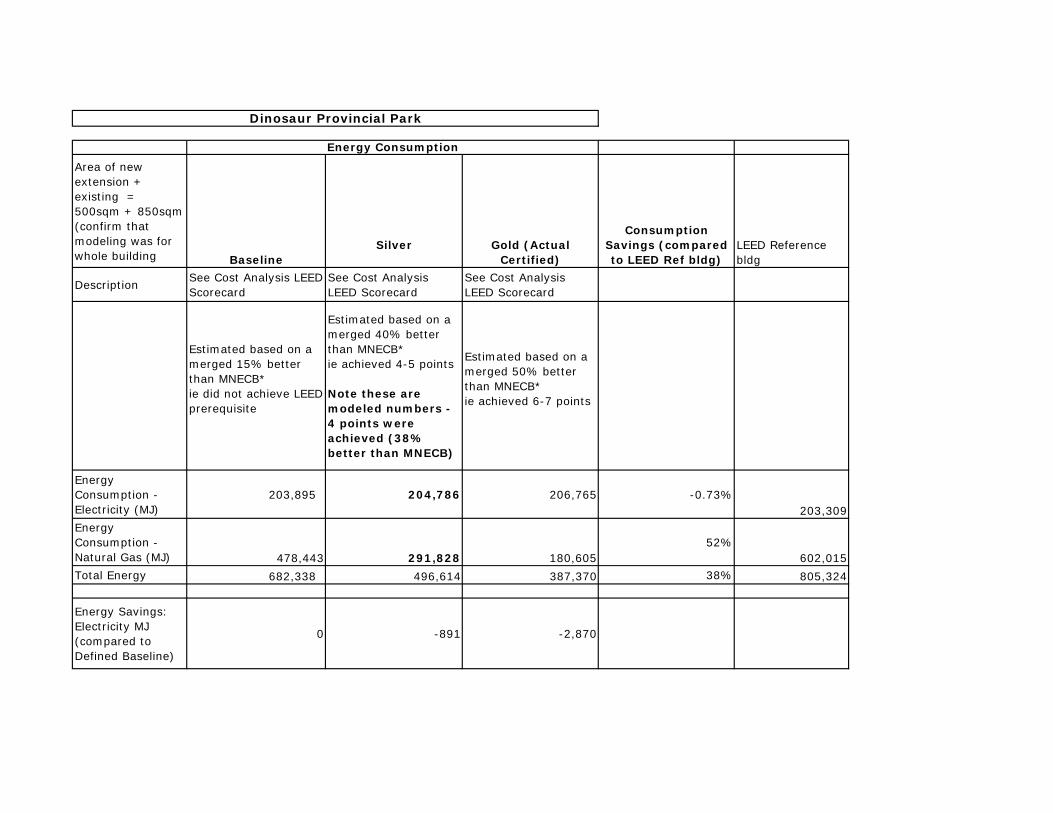
Area of new extension + existing = 500sqm + 850sqm (confirm that modeling was for whole building Baseline
Silver Gold (Actual Certified)
Consumption Savings (compared to LEED Ref bldg)
LEED Reference bldg
DescriptionSee Cost Analysis LEED Scorecard
See Cost Analysis LEED Scorecard
See Cost Analysis LEED Scorecard
Estimated based on a merged 15% better than MNECB*ie did not achieve LEED prerequisite
Estimated based on a merged 40% better than MNECB* ie achieved 4-5 points
Note these are modeled numbers - 4 points were achieved (38% better than MNECB)
Estimated based on a merged 50% better than MNECB* ie achieved 6-7 points
Energy Consumption - Electricity (MJ)
203,895 204,786 206,765 -0.73%203,309
Energy Consumption - Natural Gas (MJ) 478,443 291,828 180,605
52%602,015
Total Energy 682,338 496,614 387,370 38% 805,324
Energy Savings: Electricity MJ (compared to Defined Baseline)
0 -891 -2,870
Dinosaur Provincial Park
Energy Consumption

GHG Savings : Electricity tonnes of CO2 (compared to Defined baseline)
0 -0.25 -0.80
Energy Savings; Natural Gas MJ (compared to Defined Baseline)
0 186,615 297,839
GHG Savings: Natural Gas tonnes of CO2 (compared to Defined baseline)
0 9 15
TOTAL GHG Savingstonnes of CO2 (compared to Defined Baseline)
0 9 14
Tonnes of CO2/sqm savings compared to defined baselineassume 1350sqm total area of new and existing 0.007 0.010
GHG Emissions Electricity (coal fired generation) 1000 tons /GWh 277x10-6tonnes/MJNatural Gas 0.0494tonnes/GJ 49.4x10⁻⁶tonnes/MJ
References for GHG
NOTE * these numbers are estimates only based on % better than the modeled reference building. Modeling of the actual systems proposed would need to be done to verify these estimated numbers
Environment Canada(http://www.ec.gc.ca/pdb/ghg/inventory_report/2004_report/ann13_e.cfm#sa13_6_2)
Environment Canada: NATIONAL INVENTORY REPORT, 1990-2005: GREENHOUSE GAS SOURCES AND SINKS IN CANADAAlberta: 1000tons of CO2/GWH

© Deloitte & Touche LLP and affiliated entities. LEED Gold Certification Cost Analysis – Summary Report
Appendix 2D – Report
‘Greening the Building and the Bottom Line’
Rocky Mountain Institute (1998)
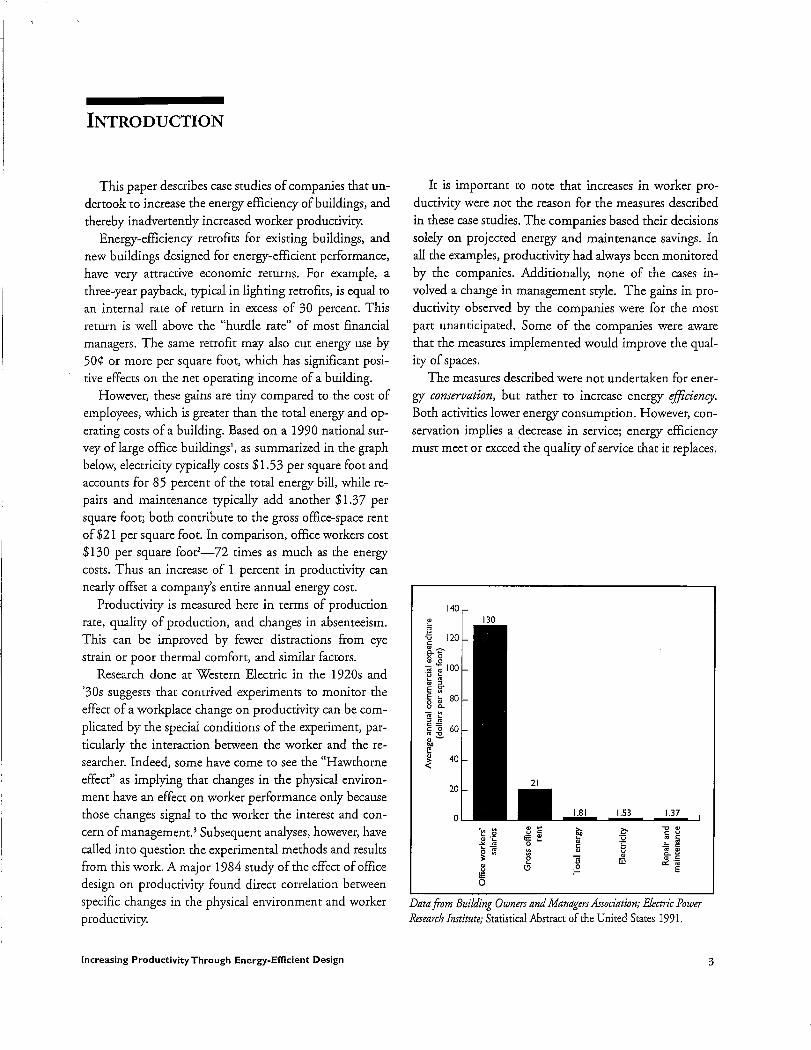
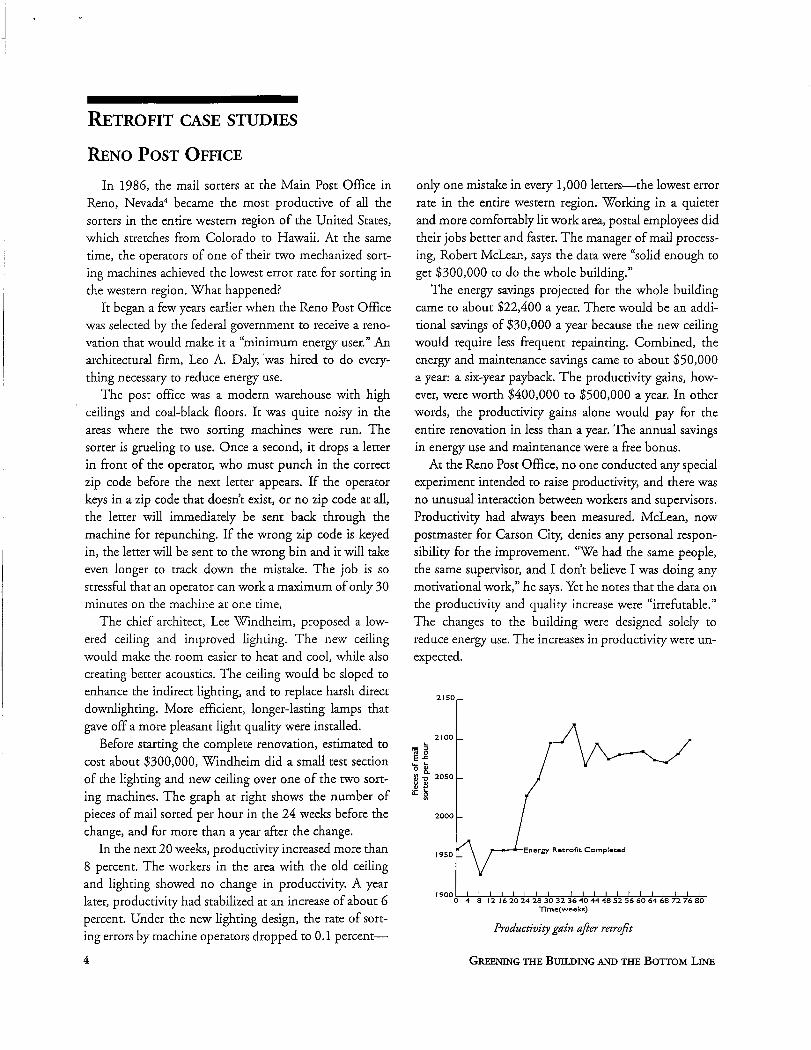
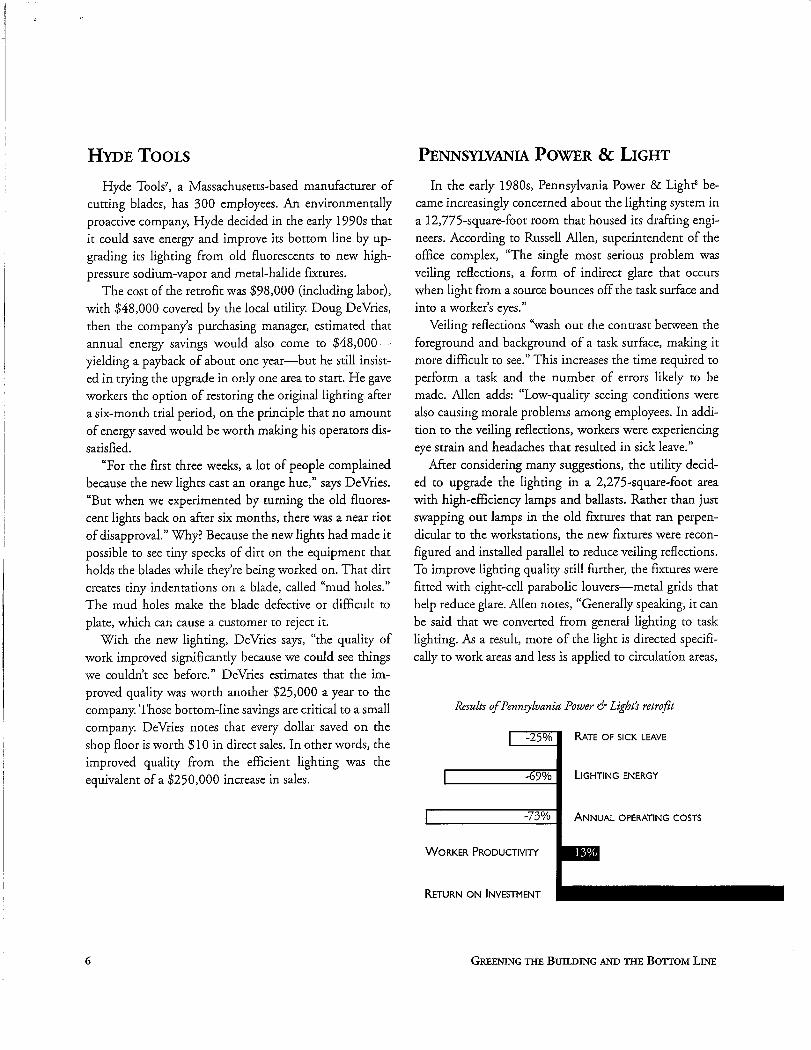

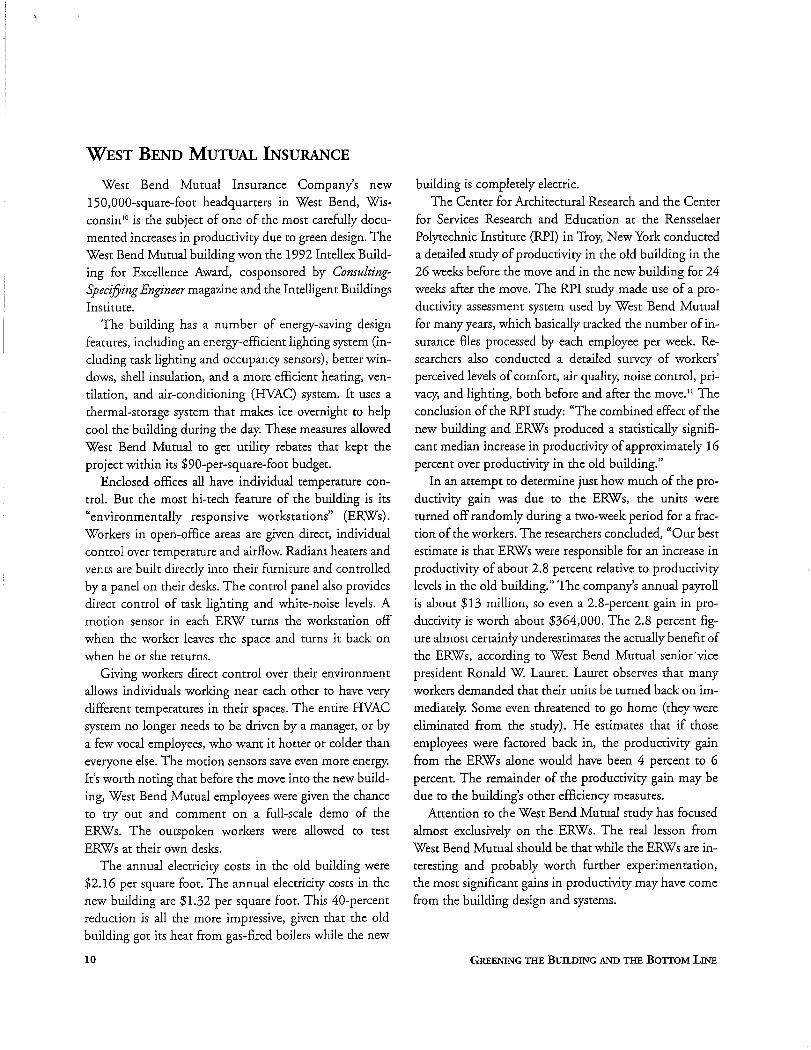
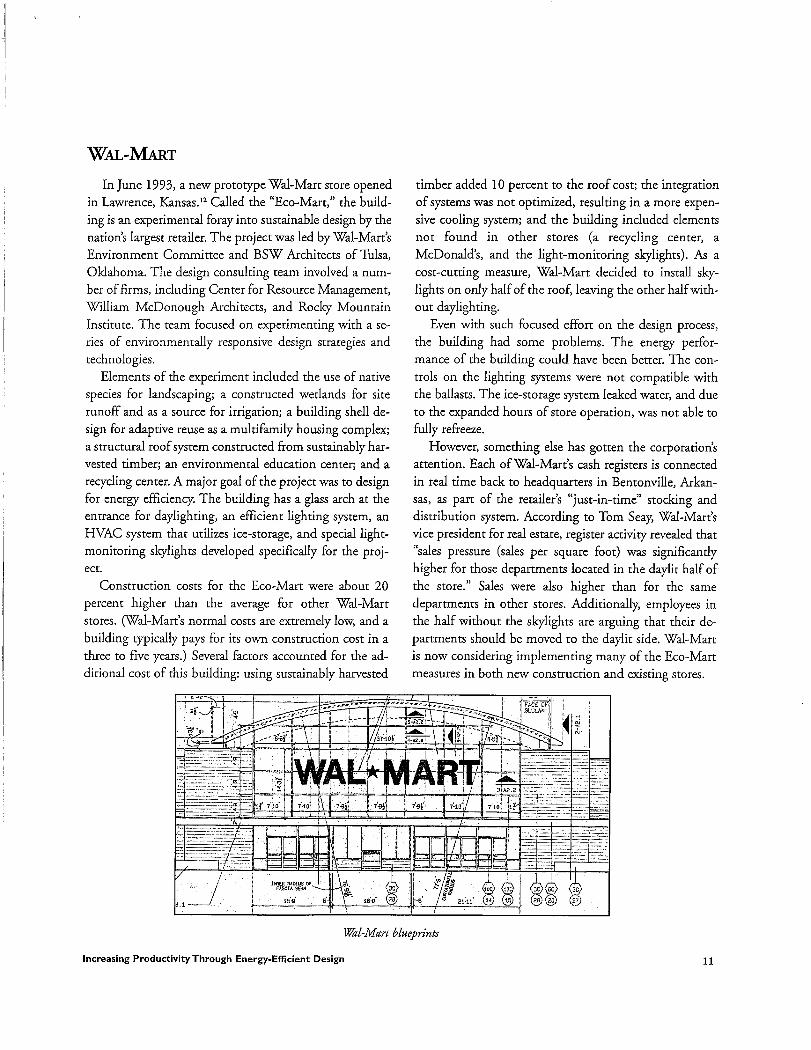
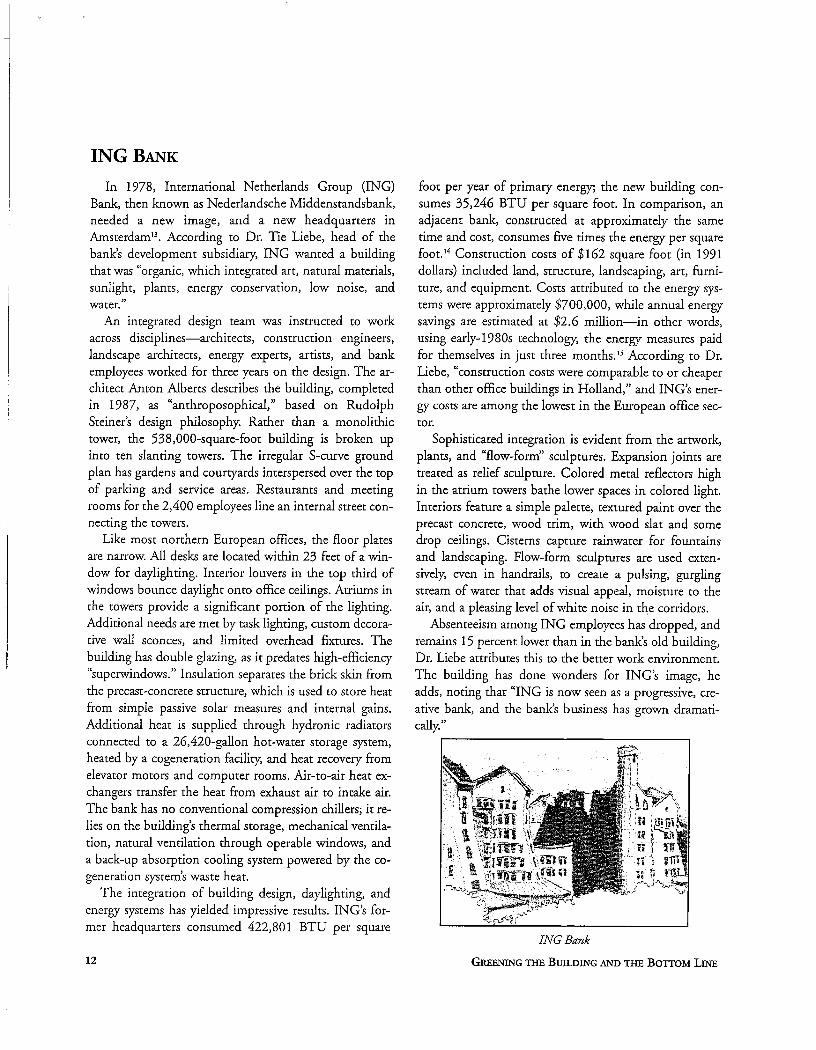
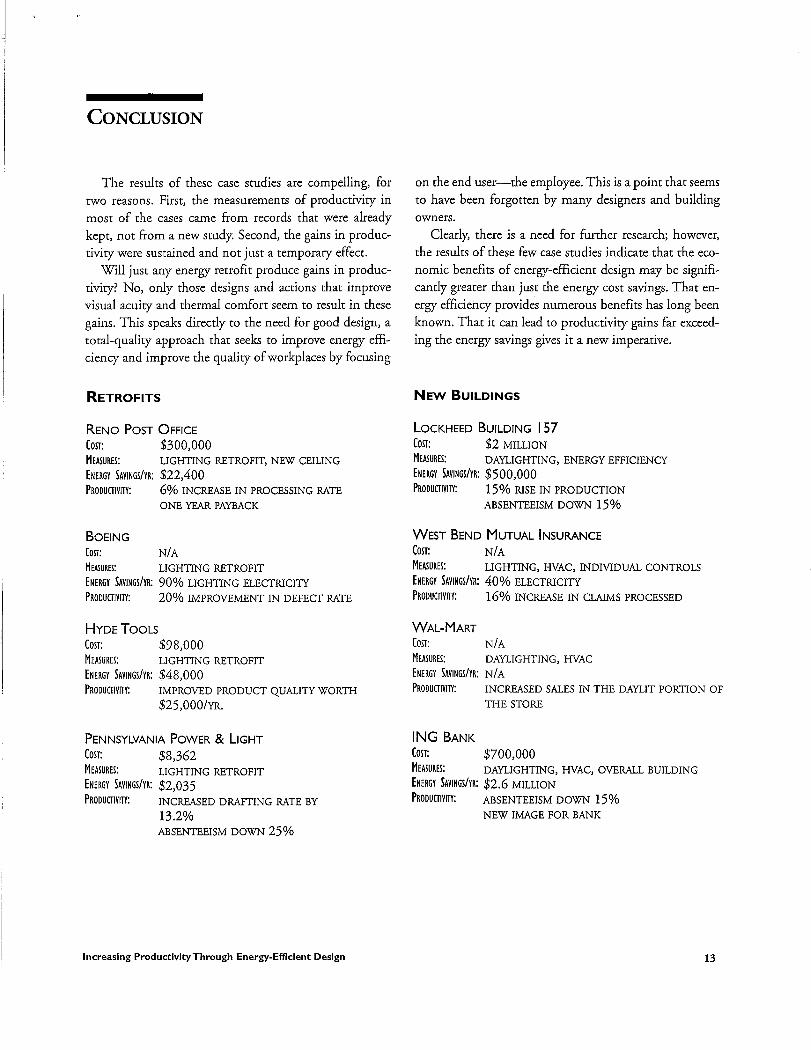

© Deloitte & Touche LLP and affiliated entities. LEED Gold Certification Cost Analysis – Summary Report
Appendix 2E – Sustainable Building Case Studies
‘Sustainability – High Performance Buildings Deliver Better Learning Environments’
www.seattle.gov/light
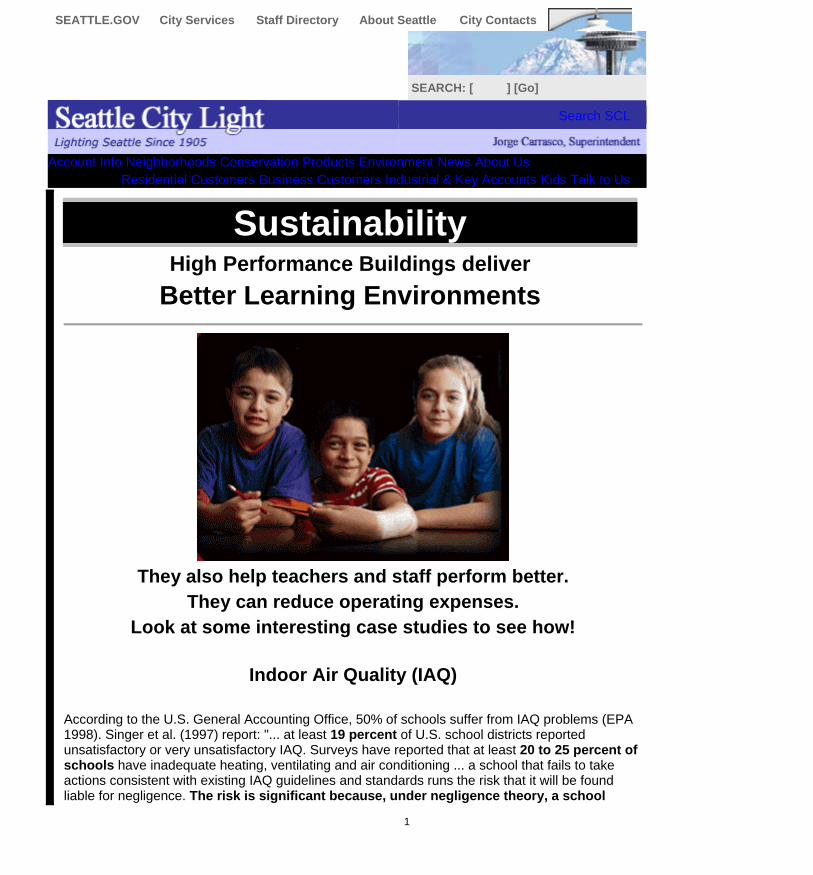
1
Grohs, Naarah (CA - Vancouver)
From: Saved by Windows Internet Explorer 7Sent: Monday, June 30, 2008 9:27 PMSubject: Sustainable Building | Case Study 01, SchoolsAttachments: ATT4220805.gif; ATT4220806.gif; ATT4220807.gif; ATT4220809.dat
SEATTLE.GOV City Services Staff Directory About Seattle City Contacts
SEARCH: [ ] [Go]
Search SCL
Account Info Neighborhoods Conservation Products Environment News About UsResidential Customers Business Customers Industrial & Key Accounts Kids Talk to Us
Sustainability High Performance Buildings deliver
Better Learning Environments
They also help teachers and staff perform better. They can reduce operating expenses.
Look at some interesting case studies to see how!
Indoor Air Quality (IAQ) According to the U.S. General Accounting Office, 50% of schools suffer from IAQ problems (EPA 1998). Singer et al. (1997) report: "... at least 19 percent of U.S. school districts reported unsatisfactory or very unsatisfactory IAQ. Surveys have reported that at least 20 to 25 percent of schools have inadequate heating, ventilating and air conditioning ... a school that fails to take actions consistent with existing IAQ guidelines and standards runs the risk that it will be found liable for negligence. The risk is significant because, under negligence theory, a school
2
board's liability is not limited to the costs of remedying the IAQ problem; the board also faces the threat of actual and punitive damages."
A Scoping Study on the Costs of Indoor Air Quality Illnesses: An Insurance Loss Reduction Perspective, Allan Chen and Edward L. Vine LBNL 41919
Indoor air problems can have consequences such as:
• increasing acute and chronic health problems for students and staff; such as cough, eye irritation, headache, asthma episodes, allergic reactions, and possibly life-threatening conditions such as severe asthma attacks or carbon monoxide poisoning
• spreading airborne infectious disease • reducing productivity and increasing discomfort, sickness and absenteeism for students
and staff • increasing the likelihood that the school or portion of the school will have to be closed and
occupants relocated • producing negative publicity which could damage the school's reputation and
effectiveness presenting potential liability problems
In an era of high education expectations but tight school budgets solving IAQ problems can be challenging.
Here's one solution: In the EPA' s recently published IAQ Tools for Schools guide it is stated that, "Good indoor air quality contributes to a favorable learning environment for students, productivity for teachers and staff, and a sense of comfort, health, and well-being. These elements combine to assist a school in its core mission -- educating children".
IAQ Tools for Schools Action Kit shows schools how to carry out a practical plan of action to improve indoor air quality at little or no cost using common-sense activities and in-house staff. The Kit provides simple-to-follow checklists, background information, sample memos and policies, and a recommended IAQ Management Plan.
http://www.epa.gov/iaq/schools/toolkit.html
What are High Performance Building Strategies? Case Studies show the following are some of the strategies that can make buildings healthy, comfortable and productive:
• daylighting • properly commissioned and maintained HVAC systems • narrow floor plans to optimize natural daylight • high benefit lighting upgrades • under floor air distribution and displacement ventilation • occupant control of heat, light and air • operable windows and mixed mode HVAC
What Improvements Do They Provide? Case Studies show the following benefits of High Performance Building strategies:
• office productivity increases up to 16% • absenteeism reductions to 40% • increased market value up to 100% • ROI up to 1000% • up to 90% decreased energy costs • up to 73% decreased O&M costs
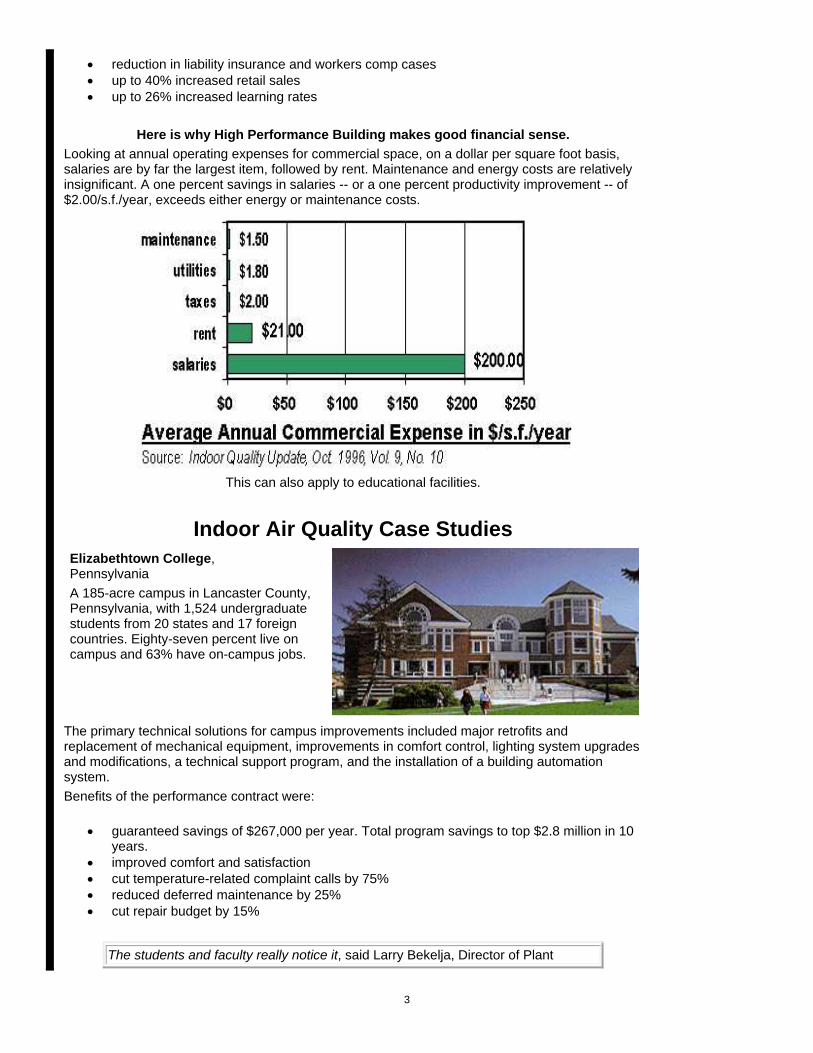
3
• reduction in liability insurance and workers comp cases • up to 40% increased retail sales • up to 26% increased learning rates
Here is why High Performance Building makes good financial sense. Looking at annual operating expenses for commercial space, on a dollar per square foot basis, salaries are by far the largest item, followed by rent. Maintenance and energy costs are relatively insignificant. A one percent savings in salaries -- or a one percent productivity improvement -- of $2.00/s.f./year, exceeds either energy or maintenance costs.
This can also apply to educational facilities.
Indoor Air Quality Case Studies Elizabethtown College, Pennsylvania A 185-acre campus in Lancaster County, Pennsylvania, with 1,524 undergraduate students from 20 states and 17 foreign countries. Eighty-seven percent live on campus and 63% have on-campus jobs.
The primary technical solutions for campus improvements included major retrofits and replacement of mechanical equipment, improvements in comfort control, lighting system upgrades and modifications, a technical support program, and the installation of a building automation system. Benefits of the performance contract were:
• guaranteed savings of $267,000 per year. Total program savings to top $2.8 million in 10 years.
• improved comfort and satisfaction • cut temperature-related complaint calls by 75% • reduced deferred maintenance by 25% • cut repair budget by 15%
The students and faculty really notice it, said Larry Bekelja, Director of Plant
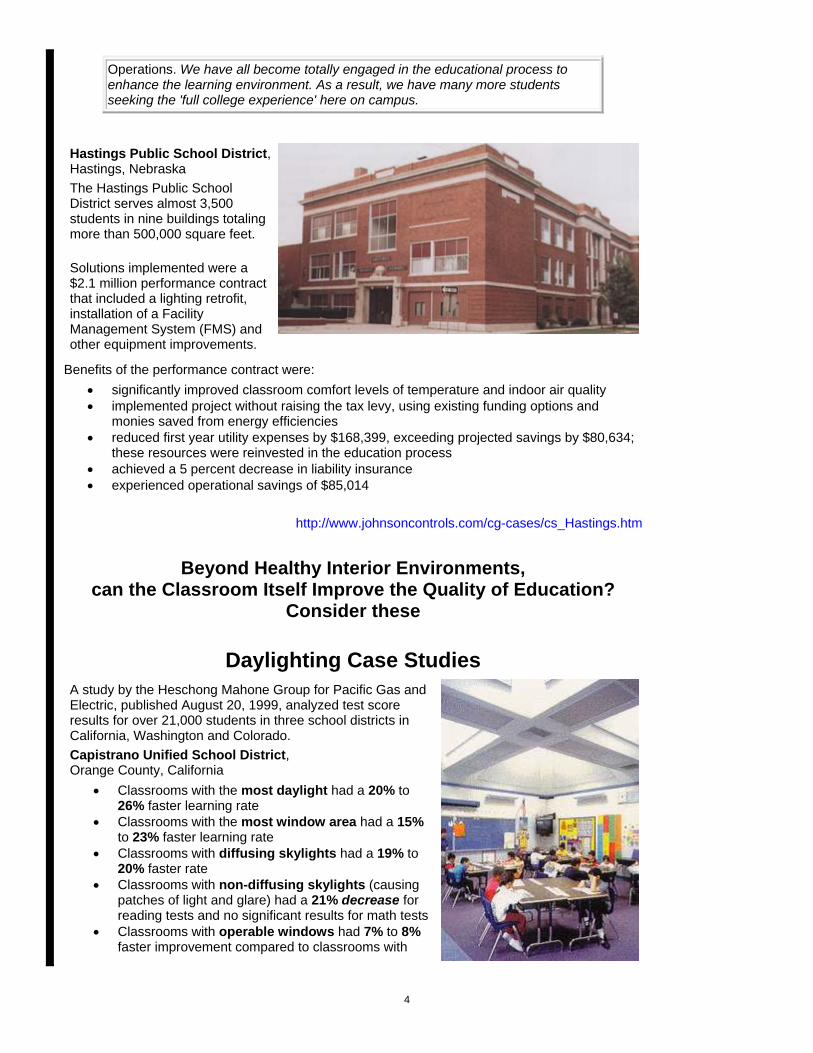
4
Operations. We have all become totally engaged in the educational process to enhance the learning environment. As a result, we have many more students seeking the 'full college experience' here on campus.
Hastings Public School District, Hastings, Nebraska The Hastings Public School District serves almost 3,500 students in nine buildings totaling more than 500,000 square feet.
Solutions implemented were a $2.1 million performance contract that included a lighting retrofit, installation of a Facility Management System (FMS) and other equipment improvements.
Benefits of the performance contract were: • significantly improved classroom comfort levels of temperature and indoor air quality • implemented project without raising the tax levy, using existing funding options and
monies saved from energy efficiencies • reduced first year utility expenses by $168,399, exceeding projected savings by $80,634;
these resources were reinvested in the education process • achieved a 5 percent decrease in liability insurance • experienced operational savings of $85,014
http://www.johnsoncontrols.com/cg-cases/cs_Hastings.htm
Beyond Healthy Interior Environments,
can the Classroom Itself Improve the Quality of Education? Consider these
Daylighting Case Studies A study by the Heschong Mahone Group for Pacific Gas and Electric, published August 20, 1999, analyzed test score results for over 21,000 students in three school districts in California, Washington and Colorado. Capistrano Unified School District, Orange County, California
• Classrooms with the most daylight had a 20% to 26% faster learning rate
• Classrooms with the most window area had a 15% to 23% faster learning rate
• Classrooms with diffusing skylights had a 19% to 20% faster rate
• Classrooms with non-diffusing skylights (causing patches of light and glare) had a 21% decrease for reading tests and no significant results for math tests
• Classrooms with operable windows had 7% to 8% faster improvement compared to classrooms with

5
fixed windows
Seattle Public School District, Seattle, Washington
• Students in classrooms with largest window area or the most daylight tested 9% to 15% higher than those with the least window area or daylighting
• Students in skylit classrooms tested 6% to 7% higher
Poudre School District, Fort Collins, Colorado • Results showed a 7% improvement in test scores in classrooms with the most
daylighting • Results also showed a 14% to 18% improvement for students in classrooms with the
largest window areas • There was a 3% effect for classrooms with roof top monitors for math scores but with no
significant effect on reading scores
Heshong Mahone Group. Daylighting In Schools. August 20, 1999. http://www.h-m-g.com/ http://www.pge.com/003_save_energy/003c_edu_train/pec/daylight/daylight.shtml
Daylit Schools Johnson County, North Carolina
Michael Nicklas and Gary B. Bailey of Innovative Design in Raleigh, North Carolina, prepared two papers, 'Energy Performance of Daylit Schools in North Carolina' and 'Analysis of the Performance of Students in Daylit Schools.'
The following conclusions are taken from those studies.
All three schools are designed with overhead daylighting in all classroom and assembly spaces. They are more energy efficient than other County schools, as shown by the graph of 'Annual Energy Costs/s.f.' to the right, and as shown below in the table of Annual Energy Savings.
6
$/s.f./yr savings school s.f. annual savings
Clayton Middle Slema Middle Four Oaks K-5
$0.28 $0.22 $.40
120,000 98,000 120,000
$ 33,600 $ 21,560 $ 48,000
Table of Annual Energy Savings
Further, square foot construction costs for the three schools were actually lower than other County schools. The three, built between 1990-1992, had an average cost of $64.06 per square foot. Eleven other County schools, built between 1992-1995, had an average construction cost of $82.88 per square foot. Studies of improvement in student test scores indicated relative improvement of 10% to 17% for the three schools when compared to the County average improvement in test score, as shown in the chart below.
It is significant to note that another new, non-daylit school, constructed in the same time period, actually exhibited negative test score improvement compared to the County norm.
www.innovativedesign.net/index.htm
With questions, contact Peter Dobrovolny:[email protected] or 206.615.1094.
The Seattle City Light Web Team: Seattle City Light -- 700 5th Avenue, Suite 3200, Seattle, WA 98104-5031 -- 206.684.3000
Mailing address: 700 5th Avenue, Suite 3200, P.O. Box 34023 Seattle, WA 98124-4023
SCL Home | Search SCL | Site Directory | Table of Contents | Contact Us | Top of Page News | Account Info | Conservation | Environment | Neighborhoods | Products | About Us
Residential Services | Business Services | New Construction Resources | Kids Exploring Energy Seattle.gov: Services | Departments | Staff Directory | Visiting | Mayor | City Council
News | Events | Traffic | Weather | Maps | Jobs | Get Involved | Seattle Channel Questions/Complaints | Privacy & Security Policy
Copyright © 1995-2008 City of Seattle

www.deloitte.ca
Deloitte, one of Canada’s leading professional services firms, provides audit, tax, consulting, and financial advisory services through more than 7,600 people in 56 offices. Deloitte operates in Québec as Samson Bélair/Deloitte & Touche s.e.n.c.r.l. The firm is dedicated to helping its clients and its people excel. Deloitte is the Canadian member firm of Deloitte Touche Tohmatsu. Deloitte refers to one or more of Deloitte Touche Tohmatsu, a Swiss Verein, its member firms, and their respective subsidiaries and affiliates. As a Swiss Verein (association), neither Deloitte Touche Tohmatsu nor any of its member firms have any liability for each other’s acts or omissions. Each of the member firms is a separate and independent legal entity operating under the names “Deloitte,” “Deloitte & Touche,” “Deloitte Touche Tohmatsu,” or other related names. Services are provided by the member firms or their subsidiaries or affiliates and not by the Deloitte Touche Tohmatsu Verein. © Deloitte & Touche LLP and affiliated entities.