leeds building society · portfolio arrears1 core residential buy to let shared ownership 31st dec...
TRANSCRIPT
Leeds Building Society2018 Annual ResultsMarch 2019

► Leeds Building Society
2018 Financial Highlights
2018 New Lending & the Mortgage Portfolio
Funding, Liquidity and Capital
Outlook for 2019
1

Executive Summary
Leeds Building Society has continued to build on its strengths and delivered annual growth of 5% and astrong post tax profit performance of £89 million in 2018
Gross mortgage lending was £3.8 billion and was above the Society’s natural market share, net lendingwas £1.0 billion
Issued £200 million of Tier 2 capital, increasing capital resources ahead of the expected future MRELrequirement
In June, the Prudential Regulation Authority (PRA) granted the Society an Internal Ratings Based (IRB)permission
Improved financial stability through further reducing legacy portfolios, via the sale of the Irish mortgageportfolio
Colleague engagement improved this year, and the Society’s leadership score was maintained. Itcontinues to be in the top quartile for the financial services industry. The Society gained a two-staraward in the Best Companies survey and is the 77th Best Mid Sized Company to work for
2

To be Britain’s most successful building society
Maintain ourYourVoice Engagement Indexat 80%
SecureGenerate strong, sustainableprofit levels by meeting the
needs of key segments
Customer CentredDeliver an outstanding
member and broker experience
SimpleDrive efficiency by
removing complexity
Future FacingInvest in our capabilities and
technology to meet the evolvingneeds of members
Our purpose is to help people save and have the home they want.We will continually adapt to anticipate our members’ changing needs and by doing
the things we do well, we will help our members get on with life.Mission
StrategicPillars &CorporatePriorities
2019Deliverables
People
1. Deliver net lending plan bydeveloping our segmentallending strategy, funded bystrong retail savings
2. Deliver a commercialadvantage by enhancingour pricing and balancesheet management
3. Improve the resilience ofour technology platform
4. Deliver profit target tosupport future investmentand growth
1. Embed Let’s be Superb toachieve our customerexperience aspirations
2. Improve customer andbroker experience in linewith the 2019 CustomerExperience plan
3. Increase awareness of ourbrand by delivering ourBrand Strategy
1. Drive agreed efficiencysavings to manage theSociety’s cost base
2. Complete all structuralwork and progress the fitout of our new Head Office
1. Deliver agreed steps ofProject Barney mortgageunderwriting solution andensure operationalreadiness
2. Develop Digital roadmapand deliver 2019 elements
3. Begin to implement digitalself-serve functionality
4. Improve the flexibility andresponsiveness of ourtechnology
5. Implement our newapproach to the strategicorganisational roadmap
Our Future Strategy and 2019 DeliverablesVision
3

Leeds Building Society
► 2018 Financial Highlights
2018 New Lending & the Mortgage Portfolio
Funding, Liquidity and Capital
Outlook for 2019
4

2018 Business Highlights
Source: Leeds Building Society Annual Results, as of 31st December 2018
5
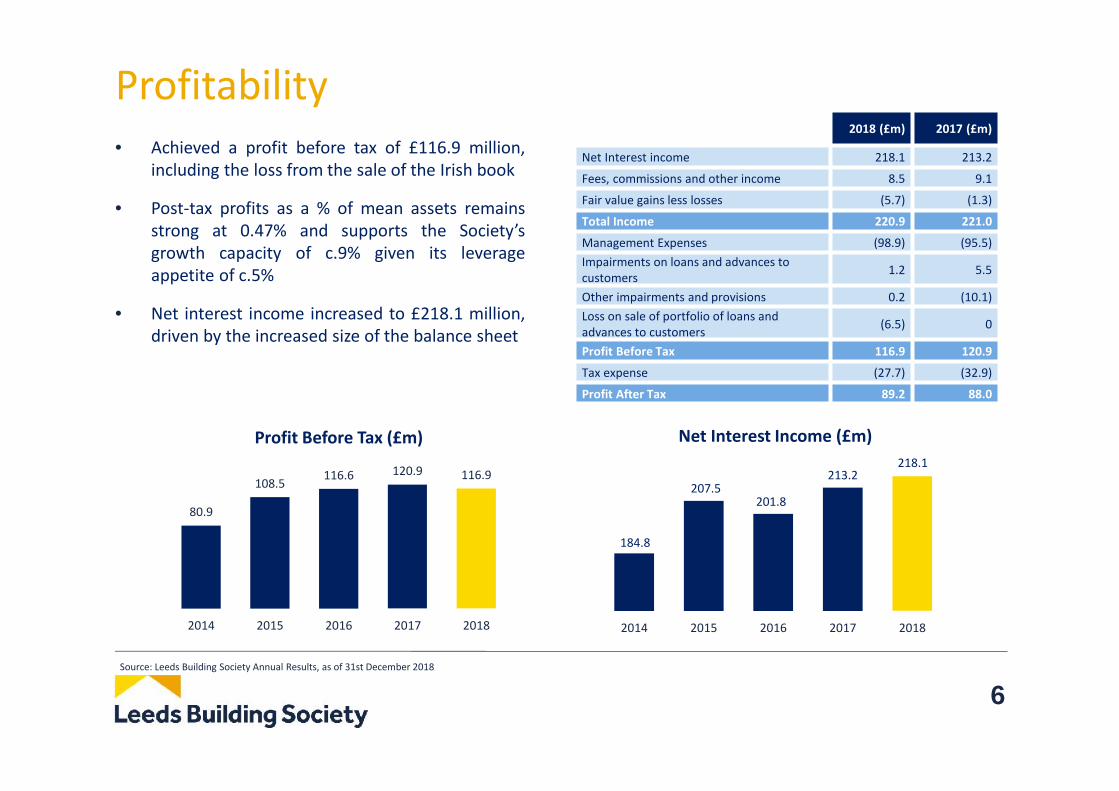
Profitability• Achieved a profit before tax of £116.9 million,
including the loss from the sale of the Irish book
• Post-tax profits as a % of mean assets remainsstrong at 0.47% and supports the Society’sgrowth capacity of c.9% given its leverageappetite of c.5%
• Net interest income increased to £218.1 million,driven by the increased size of the balance sheet
2018 (£m) 2017 (£m)
Net Interest income 218.1 213.2
Fees, commissions and other income 8.5 9.1
Fair value gains less losses (5.7) (1.3)
Total Income 220.9 221.0
Management Expenses (98.9) (95.5)Impairments on loans and advances tocustomers 1.2 5.5
Other impairments and provisions 0.2 (10.1)Loss on sale of portfolio of loans andadvances to customers (6.5) 0
Profit Before Tax 116.9 120.9
Tax expense (27.7) (32.9)
Profit After Tax 89.2 88.0
6Source: Leeds Building Society Annual Results, as of 31st December 2018
80.9
108.5 116.6 120.9 116.9
2014 2015 2016 2017 2018
Profit Before Tax (£m)
184.8
207.5201.8
213.2218.1
2014 2015 2016 2017 2018
Net Interest Income (£m)

Net Interest Margin• Net interest margin continues to reduce as
expected to 1.15%
• Reduction in NIM is due to lower margins on newbusiness, reflecting competition in the mortgagemarket and a reduction in the proportion ofbalances paying SVR
7
1.58% 1.62%
1.37%1.24%
1.15%
2014 2015 2016 2017 2018
Net Interest Margin as % of MeanAssets
Source: Leeds Building Society Annual Results and latest available annual results as of 31st December 2018
124115
4 6 5
6
2017 to 2018 Actual NIM% Bridge (bps)1.26%
1.11%
0.96%
1.09%1.15%
1.26%
NIM % versus Peers
*Figure from Q3 Interim Management Statement

Commercial Performance
• Mortgages and Loans increased by 6% to £15.8 billionwhilst improving key credit metrics and maintainingstrong capital ratios
• Savings balances increased by 6% to £13.9 billion
• Gross mortgage lending decreased to £3.8 billion, withthe Society targeting lower growth in a morecompetitive market. The Society’s market share is 1.4%,significantly higher than its natural market share of1.1%
• After two years of above average growth we grew moremodestly in 2018, in the face of strong competition andhigher redemptions from previous growth to maintaincapital ratios
8Source: Leeds Building Society Annual Results, as of 31st December 2018
9.8 11.113.1
14.9 15.8
2014 2015 2016 2017 2018
Mortgage Balances (£bn)
9.2 9.9 11.213.1 13.9
2014 2015 2016 2017 2018
Retail Savings (£bn)
2.7 3.14.0 4.1 3.8
-1.6 -1.7 -2.1 -2.3 -2.8
1.1 1.4 1.9 1.81.0
2014 2015 2016 2017 2018
Residential Lending (£bn)
Gross Lending Redemptions Net Lending

Costs and Efficiency
• The Society maintains close control on costs,balancing the need to maintain profitability andgrow capital with the need to invest in thebusiness in order to meet the changing needs ofmembers, continue to grow the business and meetthe requirements of the highly regulatedenvironment in which it operates
• Cost to income ratio is 45% and cost to mean assetratio is 0.52%, remaining among the best in thebuilding society sector
• Depreciation and amortisation have increasedreflecting the Society’s capital investment intechnology in recent years. This trend is expectedto continue
• Headcount dropped slightly, highlighting theswitch between human to technology solutions
9
33%36%
43% 43% 45%
0.57% 0.62% 0.62%0.56% 0.52%
-0.06%0.04%0.14%0.24%0.34%0.44%0.54%0.64%
30%35%40%45%50%55%60%
2014 2015 2016 2017 2018
Cost Ratios
Cost income ratio Cost asset ratio
66.2 77.0 91.9 95.5 98.9
9671,092
1,2211,322 1,308
2014 2015 2016 2017 2018
Management Expenses (£m)Average Headcount(FTE)
Source: Leeds Building Society Annual Results, as of 31st December 2018
Leeds Building Society
2018 Financial Highlights
► 2018 New Lending & the Mortgage Portfolio
Funding, Liquidity and Capital
Outlook for 2019
10

2018 New Lending
Source: December 2018 Internal Reports
• We remained focused on helping borrowers who are notwell served by the wider market by supporting first timebuyers, Shared Ownership, Affordable Housing, Help toBuy and Interest Only
• The Society maintains a conservative lending policy, whichis reflected in the distribution of LTV ratios. The averageLTV of new lending in 2018 was 62% (2017: 64%)
11
Margin Maximum LTV AverageLTV
Ow
ner O
ccup
ied
Mainstream Low -Medium Up to 95%. 73%
Assisted PurchaseShared ownership, Gov’t assisted,Right to Buy, Shared Equity
PremiumShared Ownership
– Up to 95% ofborrower share†
52%
Complex ConsumerInterest only
Premium Interest Only = Upto 60% 49%
BTL Investment & Wealth
BTL, Holiday Let, Second homeMedium -Premium
BTL = Up to 70%for standard BTL,
75% for HMO, 85%for 2nd Home
55%
† Maximum borrower share up to 75%
52%
18%
7%
5%
6%
8%4%
New lending LTV Distribution
<= 60%
<= 70%
<= 75%
<= 80%
<= 85%
<= 90%
> 90%
BTL37%
Mainstream41%
AssistedPurchase
14%
Other7%
OwnerOccupied
63%
2018 Lending by Segment
(34%)(67%)
(44%)
(9%)
(14%)

0%
20%
40%
60%
80%
100%
2014 2015 2016 2017 2018
Improving LTV Distribution of TotalPortfolio
<= 50% 50% - 60% 60% - 70%70% - 80% 80% - 90% > 90%Average LTV
Residential Mortgage Portfolio
Source: December 2018 Internal Reports 1 Average Indexed LTV weighted by balance
• Residential owner occupied balances now makeup less than half of UK residential mortgagebalances, with BTL increasing to 29% (25%: 2017)
• Proportion of the book above 90% fell to 2.2%(2.6%: 2017) the average indexed LTV fell to 55%(56%: 2017)
12
38%
22%
19%
12%
7%
2%
UK Mortgage Book LTVDistribution
<50%
50% - 60%
60% - 70%
70% - 80%
80% - 90%
>90%
47%
29%
15%
8%
UK Mortgage Book
Owner Occupied
Investment &Wealth
Assisted Purchase
Other
1
(25%)
(15%)
(7%)
(53%)

Arrears and Provisions
Source: December 2018 Internal Reports
13
• IFRS 9 was adopted by the Society at thebeginning of 2018. Calculation of impairment lossprovisions is now on an expected credit loss (ECL)basis
• The UK arrears ratio1 reduced to 0.41% comparedto 0.54% at the end of 2017
• Impairment losses before recoveries in the yearwere £4.2 million (2017: £3.6 million) and totalimpairment provisions at Dec-18 of £27.7 millionrepresent 6.6 years coverage
• The improvement in the arrears ratio is partlydue to the sale of the Irish mortgage portfolio
• Arrears have reduced but probability weightingsare more prudent to reflect the Brexituncertainty so the total level of coverage hasincreased
1 measured as those either in possession or arrears of more than 1.5% of the balance
0%
1%
2%
3%
2014 2015 2016 2017 2018
Portfolio Arrears1
Core Residential Buy To Let Shared Ownership
31st Dec2018
1st Jan2018
Stage 1 89.7% 89.4%
Stage 2 and <30 days past due 8.7% 8.5%
Stage 2 and 30+ days past due 0.5% 0.5%
Stage 3 1.1% 1.5%
Total 100% 100%

Leeds Building Society
2018 Financial Highlights
2018 New Lending & the Mortgage Portfolio
► Funding, Liquidity and Capital
Outlook for 2019
14

Sustained Retail Savings Performance• Retail savings from our members remain
at the heart of our funding strategy. Onaverage the Society paid 1.32% on itssavings range, compared to the marketaverage of 0.70%1, equating to an annualbenefit to our savers of £82 million
• Savings balances increased by 6% to arecord £13.9 billion (2017: £13.1 billion)
• During the year the Society successfullyenhanced its online savings propositionand will continue to focus on this area
• In 2018 we increased our market share2
of savings and grew deposits by £0.8billion
• Awarded the Moneyfacts ‘Best BuildingSociety Savings Provider’ award for thethird year running
151 Source: CACI CSDB, stock, January 2018 – December 2018, latest data available. CACI is an independent company that provides financialservices benchmarking data and covers 87% of the high street cash savings market.2 Savings market share defined as mutual sector net retail savings as published by the Building Societies Association
9.2 9.9 11.2 13.1 13.9
2.0 2.53.4
4.1 3.9
2014 2015 2016 2017 2018
Funding Profile (£bn)
Wholesale Retail
67%
16%
16%1%
Retail Funding - Channel Mix
Branch Network Direct OperationsInternet Other
24%
20%46%
9% 1%
Retail Funding - Product Mix
Administered Fixed Rate BondsISA - Fixed ISA - VariableOther

Stable Wholesale Funding Profile
Figures are all GBP equivalent and correct from 31st December 2017RMBS repayments modelled using current CPR expectationsTFS repayments are contractual
• The Society continues to access wholesale markets andhas a portfolio of wholesale funding, including TFS,totalling £3.9 billion (2017: £4.1 billion) which equatesto 20.3% of total funding
• The Society has raised £200 million in Tier 2 funding. Atotal of £1,225 million has been drawn under the TFS atthe end of 2018
• The Society’s NSFR is 145% (2017: 135%) compared toan expected regulatory minimum of 100%
16
16.9%20.3% 21.7% 22.2% 20.3%
2014 2015 2016 2017 2018
Wholesale Funding Ratio
32%
2%
25%6%
33%
2%
Wholesale Funding Composition
Covered Bonds
Securitisation
Senior Unsecured
Time Deposits
Term Funding Scheme
Other
9119
650440450 350
200
550
400275
Wholesale Funding Maturity Profile (£m)
RMBS Covered Bond Senior Unsecured Tier 2 TFS

High Quality Liquidity• Liquid assets at the end of 2018 were £2.8
billion compared to £2.7 billion at the end of2017
• 99% of the portfolio is High Quality LiquidAssets (HQLA) compared to 99% in 2017
• The Society also has access to contingentliquidity through the Bank of England’sSterling Monetary Framework
• The Society’s LCR is 214% (2017: 198%),compared to the regulatory minimum of100%
17Source: Leeds Building Society Annual Results, as of 31st December 2018
16.2%15.8%
14.0%
14.8% 15.1%
2014 2015 2016 2017 2018
Liquidity
54%
17%
10%
19%
Liquidity Portfolio
Cash and balances withBoE
UK GovernmentSecurities
Supranationals/GAD's
UK Covered Bonds andRMBS
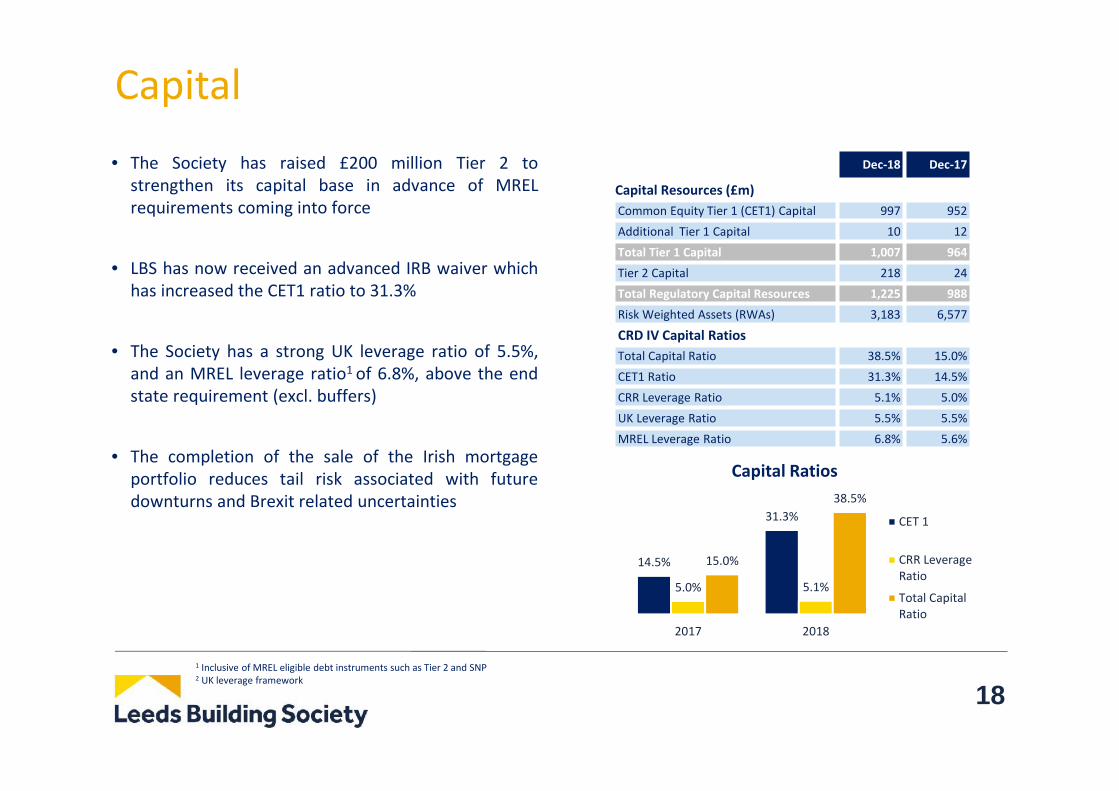
Capital• The Society has raised £200 million Tier 2 to
strengthen its capital base in advance of MRELrequirements coming into force
• LBS has now received an advanced IRB waiver whichhas increased the CET1 ratio to 31.3%
• The Society has a strong UK leverage ratio of 5.5%,and an MREL leverage ratio1 of 6.8%, above the endstate requirement (excl. buffers)
• The completion of the sale of the Irish mortgageportfolio reduces tail risk associated with futuredownturns and Brexit related uncertainties
Dec-18 Dec-17
Capital Resources (£m)Common Equity Tier 1 (CET1) Capital 997 952Additional Tier 1 Capital 10 12Total Tier 1 Capital 1,007 964Tier 2 Capital 218 24Total Regulatory Capital Resources 1,225 988Risk Weighted Assets (RWAs) 3,183 6,577
CRD IV Capital RatiosTotal Capital Ratio 38.5% 15.0%CET1 Ratio 31.3% 14.5%CRR Leverage Ratio 5.1% 5.0%UK Leverage Ratio 5.5% 5.5%MREL Leverage Ratio 6.8% 5.6%
1 Inclusive of MREL eligible debt instruments such as Tier 2 and SNP2 UK leverage framework
18
14.5%
31.3%
5.0% 5.1%
15.0%
38.5%
2017 2018
Capital Ratios
CET 1
CRR LeverageRatio
Total CapitalRatio

Leeds Building Society
2018 Financial Highlights
2018 New Lending & the Mortgage Portfolio
Funding, Liquidity and Capital
► Outlook for 2019
19

Outlook for 2019 and Beyond• Peter Hill retired as Chief Executive Officer in February 2019 after seven years in the position, during which time
the Society’s total assets and profits have more than doubled. Peter will be succeeded by Richard Fearon, whojoined the Society as Chief Commercial Officer in 2016
• 2018 has been another successful year for the Society and represents solid progress in delivering our vision to bethe UK’s most successful building society. Our strong performance over many years has resulted in recordretained capital and reserves and we have further consolidated our financial strength
• At the end of the year, the outlook for the UK economy is particularly uncertain, with the basis for and impact ofleaving the EU on 29 March 2019 unclear. Notwithstanding this, we are well placed to continue to act in the longterm interests of the Society and deliver sustainable growth for the benefit of our members
• It is expected that competition in the mortgage and savings markets will continue to intensify, both from existingparticipants and new technology driven entrants. This will drive continued downward pressure on margins. TheSociety will continue to look to mitigate this impact by targeting specific segments of the market which are lesswell served by the wider market
• The Society will continue to improve its digital capability as we strive to meet the changing needs of ourmembers. We’ve successfully enhanced our online savings proposition and focus on this important area willcontinue, as will our investment to improve our mortgage processing capability
• The Bank of England introduced changes to discontinue the use of LIBOR. We have already begun assessing thepossible impact so we can prepare for the changes, which come into effect in 2021
• We remain committed to maintaining our financial strength and ensuring we balance our appetite to grow withthe need to manage risk and create sufficient capital to support that growth
20

Key Contacts
Mark TaylorHead of Treasury Front Office
[email protected]+44 113 216 7415
Paul RileyDirector of Treasury
[email protected]+44 113 225 7525
Website: http://www.leedsbuildingsociety.co.uk/treasury/
Robin LittenChief Financial Officer
[email protected]+44 113 225 7506
21
Investor Relations
DisclaimerNOT FOR DISTRIBUTION TO ANY U.S. PERSON OR TO ANY PERSON OR ADDRESS IN THE U.S.
Important: You must read the following before continuing. The following applies to the presentation materials following this page, and you are therefore advised to read this carefullybefore reading, accessing or making any other use of the presentation materials. In accessing the presentation materials, you agree to be bound by the following terms and conditions,including any modifications to them any time you receive any information from us as a result of such access.
This presentation is the property of Leeds Building Society (“LBS”).
The investments and services contained herein are not available to private customers in the United Kingdom.
By receiving this presentation, each investor (i) acknowledges that any offering is being made only outside the United States to non-U.S. persons in reliance upon Regulation S underthe U.S. Securities Act of 1933 and (ii) is deemed to represent that it is not a U.S. person within the meaning of Regulation S and is not accessing the presentation from a location withinthe United States, its territories and possessions (including Puerto Rico, the U.S. Virgin Islands, Guam, America Samoa, Wake Island and the Northern Marina Islands or the district ofColumbia). If you are unable to agree to and confirm each of the items above, then you will not be eligible to view the presentation and you must destroy all copies of the presentationimmediately and notify us forthwith of having done so. By electing to receive this presentation, you represent, warrant and agree that you will not attempt to reproduce or re-transmit thecontents of this presentation by any means.
This presentation does not constitute a prospectus or other offering document (an “offering document”) in whole or in part. Information contained in this presentation is a summary only.Under no circumstances shall these presentation materials constitute an offer to sell or the solicitation of an offer to buy securities. In particular, nothing in this presentation constitutesan offer of securities for sale in the U.S. Recipients of these presentation materials who intend to subscribe for or purchase any securities are reminded that any subscription orpurchase may only be made on the basis of the information contained in any final offering document.
These presentation materials may only be communicated to persons in the United Kingdom in circumstances where section 21(1) of The Financial Services and Markets Act 2000 doesnot apply or to whom this document may otherwise be lawfully communicated. As such, this communication is made only to persons in the United Kingdom who (i) have professionalexperience in matters relating to investments or (ii) are high net worth entities falling within Article 49(2)(a) to (d) of the FSMA (Financial Promotion) Order 2005 or certified high networth individuals within Article 48 of the FMSA (Financial Promotion) Order 2005 (together, ”Relevant Persons”).
The information given in this presentation is not intended to be relied on either as particular advice or for making investment decisions. By receiving this presentation each investor isdeemed to represent that it is a sophisticated investor and possesses sufficient investment expertise to understand the risks involved in the offering. Investors must rely solely on theirown examinations of the offering document in making a determination as to whether to invest in securities offered.
Although the statements of fact in this presentation have been obtained from and are based upon sources that LBS believes to be reliable. LBS does not guarantee their accuracy, andany such information may be incomplete or condensed. All opinions and estimates including in this presentation constitute LBS’s judgement, as of the date of this presentation and aresubject to change without notice.
Certain statements in this presentation may constitute “forward-looking statements”. These statements reflect the LBS’ expectations and are subject to risks and uncertainties that maycause actual results to differ materially and may adversely affect the outcome and financial effects of the plan described herein. You are cautioned not to rely on such forward-lookingstatements. LBS disclaims any obligation to update their view of such risks and uncertainties or to publicly announce the result of any revisions to the forward looking statements madeherein, except where they should be required to do so under applicable law.
If these presentations materials have been sent to you in an electronic form, you are reminded that documents transmitted via this medium may be altered or changed during theprocess of electronic transmission and consequently neither LBS nor any person who controls it nor any director, officer, employee or agent of it or affiliate or any such person acceptsany liability or responsibility whatsoever in respect of any difference between the presentation materials distributed to you in electronic format and the hard copy version available to youon request from LBS.
22