leeds city region labour market analysis · pdf file2 leeds city region labour market analysis...
TRANSCRIPT

1 LEEDS CITY REGION LABOUR MARKET ANALYSIS 2016/2017
LEEDS CITY REGION LABOUR MARKET ANALYSIS2016/2017
WWW.THE-LEP.COM/SKILLSNOVEMBER 2016

2 LEEDS CITY REGION LABOUR MARKET ANALYSIS 2016/2017
INTRODUCTION
WHAT SKILLS ARE NEEDED TO SUPPORT GOOD GROWTH IN LEEDS CITY REGION?
The Leeds City Region Enterprise Partnership’s (LEP’s) labour market analysis seeks to provide a comprehensive assessment of our City Region’s skills needs based on a detailed analysis of the supply and demand of skills together with evidence of mismatch and market failure.
Labour markets work better when the different groups in the market can access information-rich data about jobs and skills. With this in mind, this document is intended to inform the planning and decision-making of a variety of groups. Alongside policy-makers we also hope to influence the thinking of learning providers, employers and individuals who are considering their career options.
The ultimate aim is to use intelligence to get the right people with the right skills in the right place to support economic growth and individual progression and well-being.
The LEP’s Employment and Skills Plan identifies three main priorities to contribute to the the central ambition outlined in our Strategic Economic Plan (SEP) to drive good growth. These priorities are:
• Great education connected to business.• Employability, accessing jobs and realising potential.• Building workforce skills and attracting talent.
It also prioritises raising the bar on high level skills alongside creating more and better apprenticeships. The plan also identifies three sector-specific challenges where a deficit of skills limits growth: gearing up to deliver major infrastructure schemes; developing digital skills across sectors; and addressing engineering and manufacturing skills shortages, whilst also acting on the importance of skills in developing employability, supporting the progression of individuals and the central role of workforce development in building skills. This labour market analysis seeks to align key evidence and insights to shed light on the challenges and solutions faced by our priority sectors.
GREAT EDUCATION CONNECTED
TO BUSINESSES
EMPLOYABILITY, ACCESSING JOBS AND REALISING
POTENTIAL
BUILDING WORK-FORCE SKILLS AND ATTRACTING
TALENT

3 LEEDS CITY REGION LABOUR MARKET ANALYSIS 2016/2017
WHY ARE SKILLS IMPORTANT TO THE CITY REGION?Leeds City Region has a level of prosperity (using the indicator of gross value added per head) that is relatively low, at 82% of the England average. We are ranked 24th out of 39 LEPs on this measure. The prosperity gap facing the City Region can be traced to two factors: a relatively low employment rate and underperformance on productivity.
FIGURE 1 EMPLOYMENT RATE AND PRODUCTIVITY PERFORMANCE OF LEPS RELATIVE TO UK AVERAGE
Source: Office for National Statistics
Compared with the UK average a lower proportion of people in the City Region are in employment and the value of output that workers produce is also lower.
Our productivity gap with the UK average is widening and productivity growth has been weaker than most other Core Cities. The City Region ranks 29th out of 39 LEPs with regard to its level of GVA per hour worked.
UNDERPERFOMANCE ON PRODUCTIVITY
LOW EMPLOYMENT RATE
4 LEEDS CITY REGION LABOUR MARKET ANALYSIS 2016/2017
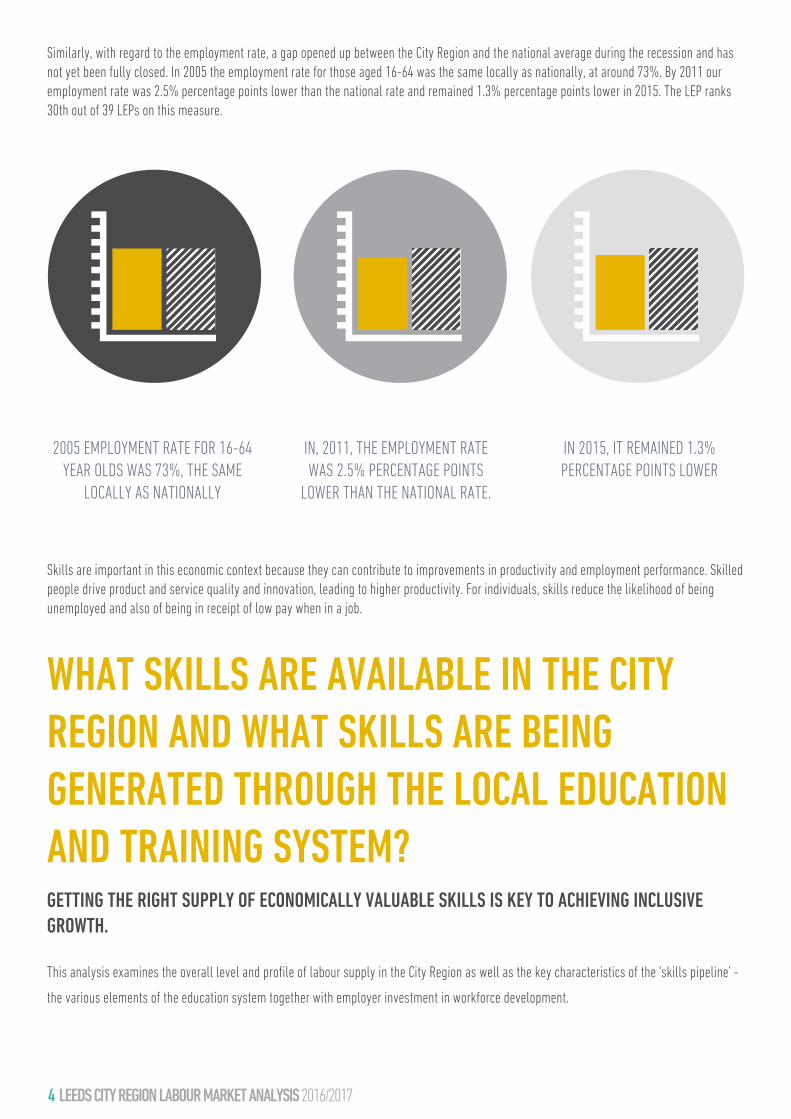
Similarly, with regard to the employment rate, a gap opened up between the City Region and the national average during the recession and has not yet been fully closed. In 2005 the employment rate for those aged 16-64 was the same locally as nationally, at around 73%. By 2011 our employment rate was 2.5% percentage points lower than the national rate and remained 1.3% percentage points lower in 2015. The LEP ranks 30th out of 39 LEPs on this measure.
Skills are important in this economic context because they can contribute to improvements in productivity and employment performance. Skilled people drive product and service quality and innovation, leading to higher productivity. For individuals, skills reduce the likelihood of being unemployed and also of being in receipt of low pay when in a job.
WHAT SKILLS ARE AVAILABLE IN THE CITY REGION AND WHAT SKILLS ARE BEING GENERATED THROUGH THE LOCAL EDUCATION AND TRAINING SYSTEM?GETTING THE RIGHT SUPPLY OF ECONOMICALLY VALUABLE SKILLS IS KEY TO ACHIEVING INCLUSIVE GROWTH.
This analysis examines the overall level and profile of labour supply in the City Region as well as the key characteristics of the ‘skills pipeline’ -
the various elements of the education system together with employer investment in workforce development.
IN, 2011, THE EMPLOYMENT RATE WAS 2.5% PERCENTAGE POINTS
LOWER THAN THE NATIONAL RATE.
IN 2015, IT REMAINED 1.3% PERCENTAGE POINTS LOWER
2005 EMPLOYMENT RATE FOR 16-64 YEAR OLDS WAS 73%, THE SAME
LOCALLY AS NATIONALLY

5 LEEDS CITY REGION LABOUR MARKET ANALYSIS 2016/2017
OUR LABOUR FORCE IS BECOMING BETTER QUALIFIED BUT STILL LAGS BEHIND THE ENGLAND AVERAGE.
There is a strong trend toward more people becoming better qualified in the City Region. The proportion of people qualified at tertiary level (level four and above) has grown from 24% to 31% in the last decade while the number of people with no formal qualifications has fallen from 16 to 10%. 74% of adults are qualified at level two or above (the qualification level that is often associated with basic employability).
Despite this improvement, the relative position of the area on level four qualifications offers room for improvement. Leeds City Region is ranked at 25th out of 39 LEPs on this measure.
However, even though it started from a superior position, the England average has improved more rapidly and recent data suggest that the gap has widened over time. With regard to the proportion qualified at level four, Leeds City Region has flattened out at around 31% in recent years while the national average position has continued to increase steadily.
THE PROPORTION OF PEOPLE QUALIFIED AT TERTIARY LEVEL (LEVEL FOUR AND ABOVE) HAS GROWN FROM 24% TO 31%

6 LEEDS CITY REGION LABOUR MARKET ANALYSIS 2016/2017
FIGURE 2 CHANGE IN HIGHEST QUALIFICATION HELD BY WORKING AGE POPULATION
Source: Annual Population Survey, Jan-Dec 2015
10% of the working age population in Leeds City Region hold no formal qualifications, with a further 17% holding their highest qualification at level one. Both are above the England average figures of 8% and 15% respectively.
The fact that more than a quarter of the adult population have no qualifications or are qualified at a low level represents a significant weakness for the City Region.
Performance at district level is highly variable. In the case of Barnsley and Wakefield, fewer than a quarter of the adult population are qualified at level four and above, in contrast with several districts in North Yorkshire where the figure is 40% or more. Indeed, Barnsley, Wakefield and Bradford have more people qualified below Level two than qualified at Level four.
THERE HAS BEEN A SIGNIFICANT REDUCTION IN RECENT YEARS IN THE VOLUME OF LEARNING FUNDED THROUGH THE FURTHER EDUCATION (FE) AND SKILLS SYSTEM.
Between 2011/2012 and 2014/2015, total starts on FE and Skills programmes fell by 14%, a volume reduction of close to 70,000. The biggest declines were registered for the Education and Training programme, with a reduction of 66,000 starts or 31%, and starts among 16-18 year olds, down by 67,000 or 30%. Conversely, starts on Community Learning saw an increase of around 5,000 or 11%.

7 LEEDS CITY REGION LABOUR MARKET ANALYSIS 2016/2017
FIGURE 3 STARTS ON FE AND SKILLS PROGRAMMES BY AGE IN LEEDS CITY REGION
Source: SFA Datacube
Between 2013/2014 and 2014/2015 starts fell by 4%, with education and training starts falling by 7%. Although apprenticeship starts grew by 12%.
APPRENTICESHIPS HAVE NOT SEEN SUSTAINED OVERALL GROWTH IN RECENT YEARS BUT THERE HAVE BEEN LARGE INCREASES IN STARTS AT ADVANCED AND HIGHER LEVELS.
The LEP is committed to supporting the creation of more and better apprenticeships as a means of opening up career opportunities for individuals and helping business to access and grow the future talent they need.
There were around 29,000 starts on the apprenticeship programme in the 2014/2015 academic year. This was a 12% increase on the previous year but still 10% lower than in 2011/2012.

8 LEEDS CITY REGION LABOUR MARKET ANALYSIS 2016/2017
The City Region performs positively on apprenticeship take-up in comparison with many other areas. In 2014/2015 it had the fourth highest level of starts of any LEP area with around 15 apprenticeship starts per 1,000 head of working population, slightly above the national average. Around 19% of employers offer formal apprenticeships: also higher than the England average of 15%.
Much of the growth in the last year has been for apprentices aged 19 and over rather than those aged 16-18. Advanced apprenticeship starts grew rapidly (by 25%) and higher apprenticeships starts doubled.
ICT APPRENTICESHIP STARTS ARE SMALL IN NUMBER AND BELOW THE NATIONAL AVERAGE.
Engineering and Manufacturing Technologies accounted for 14% of total apprenticeship starts in 2014/15, while the other priority skill areas were much smaller. Construction, Planning and the Built Environment contributed around 5% of total starts and Information and Communication Technology only 2%. The subject profile of apprenticeship starts is similar to the national picture but the comparison indicates that the level of Information and Communication Technology starts is relatively low in the City Region.
MIXED PICTURE FOR PRIORITY SUBJECTS IN TERMS OF RECENT TRENDS IN APPRENTICESHIP STARTS.
A number of subject areas have experienced a decline in starts in recent years, most notably Retail and Commercial Enterprise. However, apprenticeship starts in frameworks relating to Information and Communication Technology, one of the LEP’s priority skill areas, also saw a pronounced fall of 1,300, or 68%. Construction, Planning and the Built Environment, another priority area, remained fairly static with a fall of 2%. Engineering and Manufacturing Technologies, on the other hand, saw the greatest growth of any subject area of 550 starts or 15%.
15 APPRENTICESHIP STARTS PER 1,000 HEAD OF WORKING POPULATION
4TH HIGHEST LEVEL OF STARTS OF ANY LEP AREA

9 LEEDS CITY REGION LABOUR MARKET ANALYSIS 2016/2017
FIGURE 4 CHANGE IN APPRENTICESHIP STARTS BY SUBJECT AREA 2011/2012 TO 2014/2015 IN LEEDS CITY REGION
Source: SFA Data Cube

10 LEEDS CITY REGION LABOUR MARKET ANALYSIS 2016/2017
THERE ARE DIFFERENCES BETWEEN THE PROFILE OF FE AND SKILLS PROVISION AND LABOUR MARKET DEMAND.
HOW DOES EDUCATION AND TRAINING PROVISION ALIGN WITH THE NEEDS OF THE LOCAL LABOUR MARKET?
Although it does not provide a complete or definitive answer, a comparison of the broad subject profile of education and training provision with that of local job opportunities allows us to sense check current investment in learning and provides a basis for further exploration of the responsiveness of learning provision to the needs of the labour market.
In Figure 5 we have mapped the profile of FE and apprenticeship achievements against where we think future job openings will lie based on labour market projections. This involves mapping subject categories to occupations.
Generally, there is a strong match between the profile of apprenticeships and the profile of future job openings, although provision is strongly represented in Business, Admin and Law. One would expect a good match since apprentices, by definition, are in employment.

11 LEEDS CITY REGION LABOUR MARKET ANALYSIS 2016/2017
FIGURE 5 COMPARISON OF PROFILE OF FE AND SKILLS ACHIEVEMENTS IN THE CITY REGION VERSUS PROJECTED JOB OPENINGS IN RELATED OCCUPATIONS
Source: LEP calculations based on SFA data (2014/2015) and Working Futures
Education and training achievements (which broadly equate to mainstream further education) do not appear to align with labour market demand in the same way.
There are several subject areas in which achievements appear to be over-represented relative to job opportunities, most notably Arts, Media and Publishing and Leisure, Travel and Tourism.
On the other hand there are areas that seem to be under-represented in terms of achievements. The clearest examples are Business Administration and Law, Engineering and Manufacturing and Retail and Commercial Enterprise.

12 LEEDS CITY REGION LABOUR MARKET ANALYSIS 2016/2017
THE HE SECTOR IS A KEY ASSET FOR THE CITY REGION BUT A MINORITY OF GRADUATES REMAIN IN THE AREA.
Based on student numbers, the City Region has the second largest higher education sector in the UK behind London. There were 116,000 students enrolled at higher education providers in the area during the 2014/2015 academic year. This is clearly a key asset for the City Region, in terms of meeting the high level skills needs of local employers and of prospective inward investors.
The City Region is a net importer of students, as the number of students who studied in Leeds City Region (116,000) is significantly larger than the number of students who grew up here (77,000), giving a net inflow of 39,000.
Student numbers in local HE institutions have remained stable in the last three years, following a 7% fall in enrolments between 2011/2012 and 2012/2013.
Retention of HE students following graduation could be seen as an important issue with regard to maximising economic benefits for the locality. Based on the Higher Education Statistics Agency
THE NUMBER OF STUDENTS WHO STUDIED IN LEEDS CITY REGION : 116,000
THE NUMBER OF STUDENTS WHO GREW UP HERE: 77,000
NET INFLOW OF STUDENTS: 39,000
NUMBER OF STUDENTS WHO STUDIED IN LEED CITY REGION: 116,000

13 LEEDS CITY REGION LABOUR MARKET ANALYSIS 2016/2017
(HESA) Destination Survey, a minority (around two-fifths) of students at HE providers in the City Region who entered employment took up a job in the City Region following graduation.
It is likely that retention issues at least partly reflect relatively weak demand for high level skills across the City Region although destination data suggest that entry rates into professional level employment are similar to the national average.
The subject areas with the largest proportion of HE qualifiers in 2014/2015 were Business and Administrative Studies (18% of the total), Subjects Allied to Medicine (13%) and Education (11%). The largest subjects in the broad category of science were Biological Sciences (9%), Engineering and Technology (5%) and Physical Sciences (4%). With regard to priority skill areas, digital (Computer Science) and infrastructure (Architecture, Building and Planning) related disciplines are small at 3% and 2% respectively.
BUSINESS AND ADMINISTRATIVE STUDIES (18% OF THE TOTAL PROPORTION OF HE
QUALIFIERS)
SUBJECTS ALLIED TO MEDICINE (13% OF THE TOTAL PROPORTION OF HE
QUALIFIERS)
EDUCATION (11% OF THE TOTAL PROPORTION OF HE QUALIFIERS)
14 LEEDS CITY REGION LABOUR MARKET ANALYSIS 2016/2017
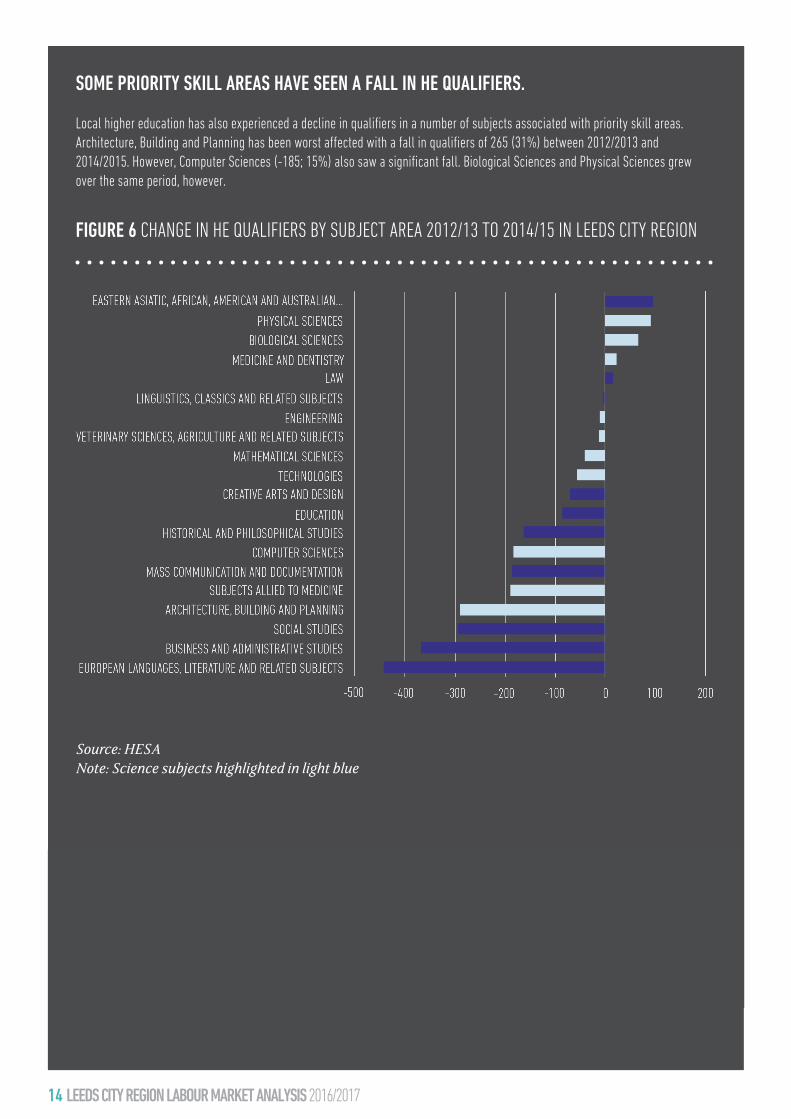
SOME PRIORITY SKILL AREAS HAVE SEEN A FALL IN HE QUALIFIERS.
Local higher education has also experienced a decline in qualifiers in a number of subjects associated with priority skill areas. Architecture, Building and Planning has been worst affected with a fall in qualifiers of 265 (31%) between 2012/2013 and 2014/2015. However, Computer Sciences (-185; 15%) also saw a significant fall. Biological Sciences and Physical Sciences grew over the same period, however.
FIGURE 6 CHANGE IN HE QUALIFIERS BY SUBJECT AREA 2012/13 TO 2014/15 IN LEEDS CITY REGION
Source: HESANote: Science subjects highlighted in light blue
15 LEEDS CITY REGION LABOUR MARKET ANALYSIS 2016/2017
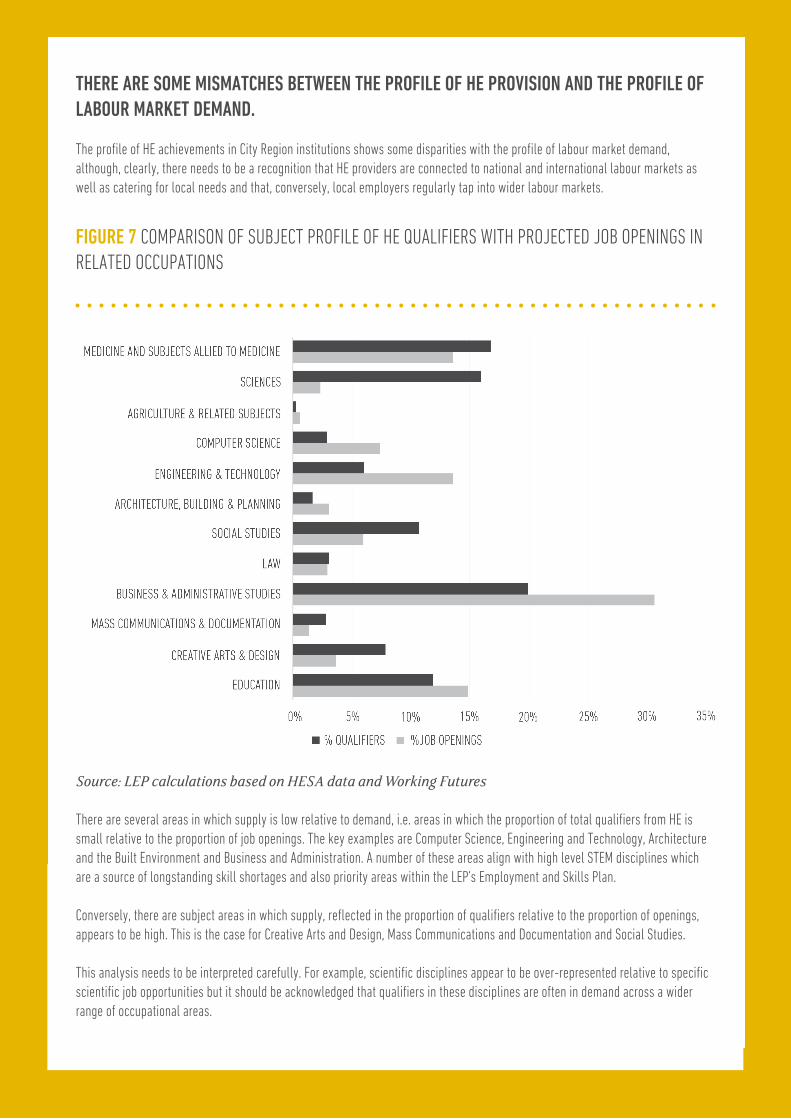
THERE ARE SOME MISMATCHES BETWEEN THE PROFILE OF HE PROVISION AND THE PROFILE OF LABOUR MARKET DEMAND.
The profile of HE achievements in City Region institutions shows some disparities with the profile of labour market demand, although, clearly, there needs to be a recognition that HE providers are connected to national and international labour markets as well as catering for local needs and that, conversely, local employers regularly tap into wider labour markets.
FIGURE 7 COMPARISON OF SUBJECT PROFILE OF HE QUALIFIERS WITH PROJECTED JOB OPENINGS IN RELATED OCCUPATIONS
Source: LEP calculations based on HESA data and Working Futures
There are several areas in which supply is low relative to demand, i.e. areas in which the proportion of total qualifiers from HE is small relative to the proportion of job openings. The key examples are Computer Science, Engineering and Technology, Architecture and the Built Environment and Business and Administration. A number of these areas align with high level STEM disciplines which are a source of longstanding skill shortages and also priority areas within the LEP’s Employment and Skills Plan.
Conversely, there are subject areas in which supply, reflected in the proportion of qualifiers relative to the proportion of openings, appears to be high. This is the case for Creative Arts and Design, Mass Communications and Documentation and Social Studies.
This analysis needs to be interpreted carefully. For example, scientific disciplines appear to be over-represented relative to specific scientific job opportunities but it should be acknowledged that qualifiers in these disciplines are often in demand across a wider range of occupational areas.

16 LEEDS CITY REGION LABOUR MARKET ANALYSIS 2016/2017
TRAINING LEVELS ARE BELOW AVERAGE IN THE CITY REGION BUT MANY EMPLOYERS WOULD LIKE TO INVEST MORE.
A key contributor to the skills development of the labour force is training arranged and or funded by employers.
HOW ARE EMPLOYERS RESPONDING TO THEIR OWN ORGANISATIONAL SKILLS NEEDS?
According to the Employer Skills Survey 2015, 64% of employers in the City Region undertook training in the previous year. This is slightly below the national average of 66%. 59% of staff received training that was arranged or funded by their employer, equivalent to around 750,000 workers. The proportion is below the England average of 63% and represents a fall in training levels from the 66% of staff who received training in 2013. Much of the training provided by employers focuses on job specific skills, induction and health and safety.
64% OF EMPLOYERS UNDERTOOK TRAINING JUST BELOW THE NATIONAL
AVERAGE OF 66%
59% OF STAFF (750,000 WORKERS) RECEIVED TRAINING PAID FOR BY
THEIR EMPLOYER
66% RECEIVED TRAINING IN 201364% RECEIVED TRAINING IN 2015
2013 2015
17 LEEDS CITY REGION LABOUR MARKET ANALYSIS 2016/2017
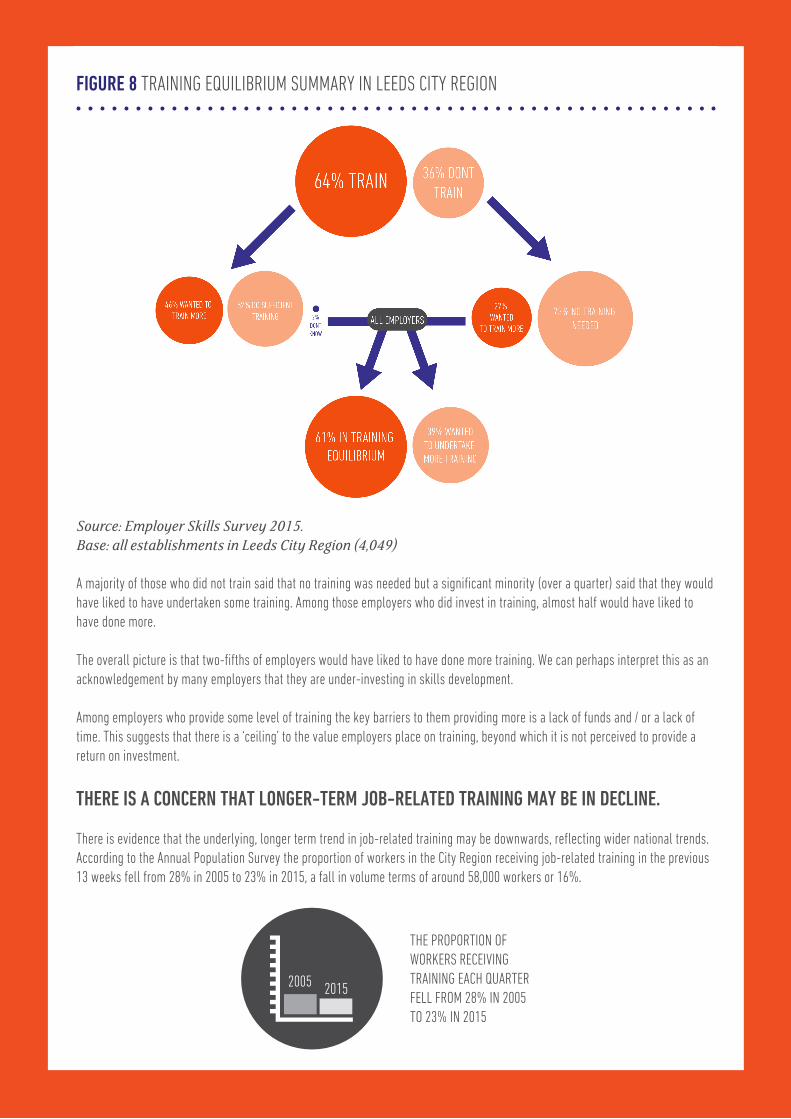
FIGURE 8 TRAINING EQUILIBRIUM SUMMARY IN LEEDS CITY REGION
Source: Employer Skills Survey 2015. Base: all establishments in Leeds City Region (4,049)
A majority of those who did not train said that no training was needed but a significant minority (over a quarter) said that they would have liked to have undertaken some training. Among those employers who did invest in training, almost half would have liked to have done more.
The overall picture is that two-fifths of employers would have liked to have done more training. We can perhaps interpret this as an acknowledgement by many employers that they are under-investing in skills development.
Among employers who provide some level of training the key barriers to them providing more is a lack of funds and / or a lack of time. This suggests that there is a ‘ceiling’ to the value employers place on training, beyond which it is not perceived to provide a return on investment.
THERE IS A CONCERN THAT LONGER-TERM JOB-RELATED TRAINING MAY BE IN DECLINE.
There is evidence that the underlying, longer term trend in job-related training may be downwards, reflecting wider national trends. According to the Annual Population Survey the proportion of workers in the City Region receiving job-related training in the previous 13 weeks fell from 28% in 2005 to 23% in 2015, a fall in volume terms of around 58,000 workers or 16%.
THE PROPORTION OF WORKERS RECEIVING TRAINING EACH QUARTER FELL FROM 28% IN 2005 TO 23% IN 2015
2005 2015

18 LEEDS CITY REGION LABOUR MARKET ANALYSIS 2016/2017
DEMAND FOR SKILLS: WHAT SKILLS DOES THE CITY REGION NEED, NOW AND IN THE FUTURE?Investing in skills only makes sense if jobs are available to make use of those skills. We now turn to the changing nature of jobs in the labour market, the skills that are associated with them and likely prospects for the future.
THE OVERALL DEMAND FOR LABOUR IS RELATIVELY WEAK IN THE CITY REGION.
In 2014, the latest year for which data are available, there were 1,496,000 jobs in Leeds City Region.1 The number of jobs in the City Region grew more rapidly than the national average before the recession but since 2009 the rate of growth has slowed to half that seen nationally.
The locality has a small stock of jobs relative to the size of its population. In 2014 Leeds City Region had a job density2 of 0.78, compared with a national average of 0.83. There has been no improvement locally in job density since 2000. Job density varies widely between districts like Harrogate, which have a high density (in this case 1.01), and districts like Barnsley, which have a low density (0.58).
FORECASTS SUGGEST THAT JOBS WILL GROW MORE SLOWLY IN THE CITY REGION COMPARED WITH NATIONALLY.
A number of economic models provide employment forecasts for the City Region giving an insight into the prospects for the future level of labour demand in the area, based on past patterns of performance and behaviour.
The Regional Economic Model forecasts that total employment will grow by 90,000 jobs between 2014 and 2024, an increase of 6%. This rate of growth is around one percentage point lower than the UK average forecast.
The Working Futures Model is more pessimistic about both local and national growth indicating that the jobs in the City Region will grow by around 60,000 or 4% between 2014 and 2024, compared with UK growth of 6%.
THE BROAD SECTORAL STRUCTURE OF EMPLOYMENT IS SIMILAR TO THE NATIONAL AVERAGE BUT WITH SPECIALISMS IN MANUFACTURING AND UNDER-REPRESENTATION IN SOME KEY SERVICE ACTIVITIES.
As is the case nationally employment in the City Region is dominated by services. Around 56% of total employment is accounted for by private sector services, which is then itself fairly equally split between business services (29%) and consumer-facing distributive services (27%).
The City Region is strongly represented in manufacturing, finance and public service activities. Its manufacturing specialisms include a diverse range of activities such as textiles, furniture and wood products in conjunction with higher value sectors such as chemicals, electrical equipment and beverages.
The local employment structure is under-represented in a number of, primarily service-based, sectors including media, professional services, information technology and arts and entertainment.
1 Source: ONS Jobs Density series. This is a workplace-based measure and comprises employee jobs, self-employed, government-supported trainees and HM Forces.2 Jobs density is defined as the number of jobs in an area divided by the resident population aged 16-64 in that area. For example, a job density of 1.0 would mean that there is one job for every resident aged 16-64.

19 LEEDS CITY REGION LABOUR MARKET ANALYSIS 2016/2017
ON CURRENT TRENDS, JOB GROWTH WILL BE CONCENTRATED IN PRIVATE SECTOR SERVICES BUT OVERALL RECRUITMENT NEED WILL BE MORE BROADLY BASED.
A key question relating to demand is: which industries do we expect to generate future job opportunities?
The analysis is based on the Working Futures Labour Market Model. This model provides us with a benchmark picture of what is likely to happen in future assuming that past patterns of performance and behaviour continue.
Figure 9 shows projected net change in employment by sector for the City Region; denoted by the blue segments of the bars and overall recruitment need, taking into account replacement demand, shown by the orange bars.
A large proportion of net growth is expected to occur in private sector services. Some of these service sectors are primarily lower skilled (such as accommodation and food) and some higher skilled like professional services.
Information technology, which is of interest from a digital skills perspective, is a medium sized sector that has one of the fastest forecast rates of growth of around 15% or 4,000 additional jobs.
(It should also be noted that there is a significant level of demand for digital skills across a wide range of other sectors).
FIGURE 9 PROJECTED JOB OPENINGS BY INDUSTRY SECTOR 2014-2024 IN LEEDS CITY REGION
Source: Working Futures
20 LEEDS CITY REGION LABOUR MARKET ANALYSIS 2016/2017
A large proportion of net growth is expected to occur in private sector services. Some of these service sectors are primarily lower skilled (such as accommodation and food) and some higher skilled like professional services.
Information technology, which is of interest from a digital skills perspective, is a medium sized sector that has one of the fastest forecast rates of growth of around 15% or 4,000 additional jobs.
(It should also be noted that there is a significant level of demand for digital skills across a wide range of other sectors).
When we look at the overall recruitment requirement by sector, private sector services are still important (wholesale and retail is ranked top) but other areas like health and education feature strongly.
In the case of manufacturing we expect to see a continuing net decline in employment but this is likely to be more than offset by replacement demands, leading to a significant recruitment need in the sector.
Moreover, in contrast to prospects for employment, output in manufacturing as a whole is expected to grow as productivity in the sector continues to increase. This implies a requirement for fewer but more highly skilled workers in manufacturing.
FUTURE RECRUITMENT NEEDS ARE EXPECTED TO BE GREATEST IN HIGH SKILLED AND SERVICE-INTENSIVE ROLES.
Projections by occupation give us a clearer idea about skills requirements in the future.
Figure 10 below ranks occupations according to the size of their expected recruitment requirement in the City Region over the next decade; this gives us a clearer idea about actual skills requirements.
I.T HAS ONE OF THE FASTEST FORECAST RATES OF GROWTH OF
AROUND 15%
21 LEEDS CITY REGION LABOUR MARKET ANALYSIS 2016/2017
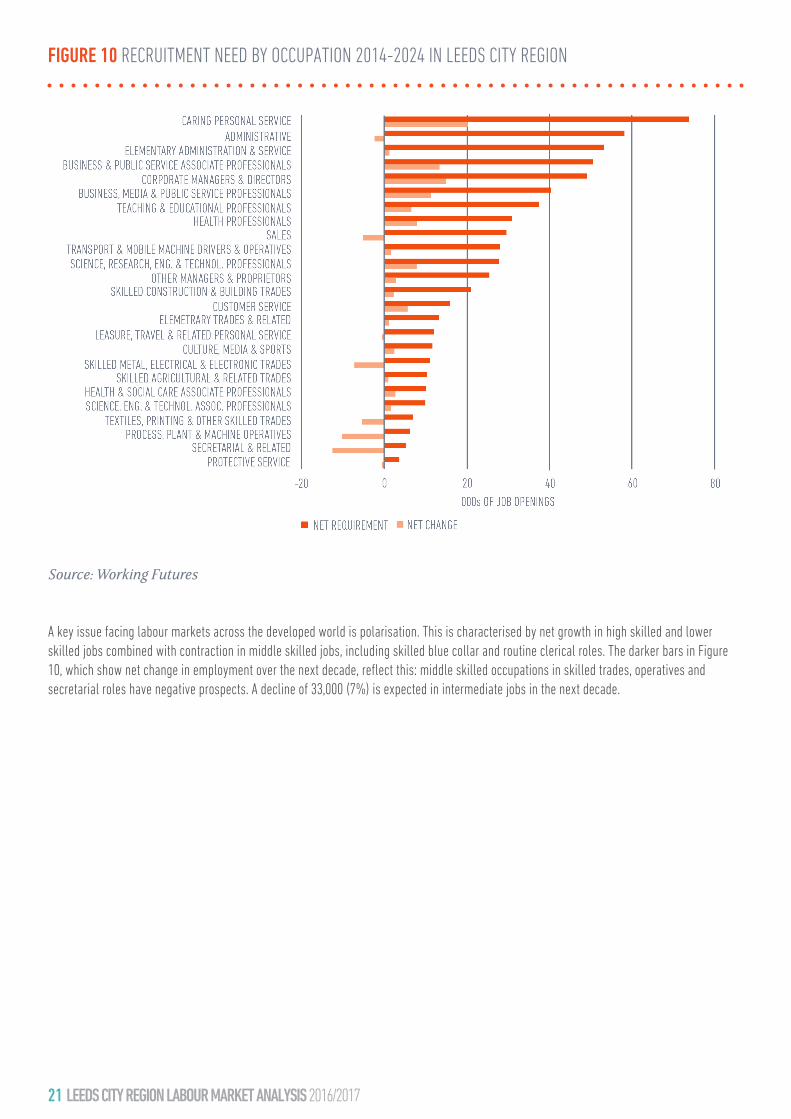
FIGURE 10 RECRUITMENT NEED BY OCCUPATION 2014-2024 IN LEEDS CITY REGION
Source: Working Futures
A key issue facing labour markets across the developed world is polarisation. This is characterised by net growth in high skilled and lower skilled jobs combined with contraction in middle skilled jobs, including skilled blue collar and routine clerical roles. The darker bars in Figure 10, which show net change in employment over the next decade, reflect this: middle skilled occupations in skilled trades, operatives and secretarial roles have negative prospects. A decline of 33,000 (7%) is expected in intermediate jobs in the next decade.

22 LEEDS CITY REGION LABOUR MARKET ANALYSIS 2016/2017
Significant growth is expected for higher level occupations, including managers, all professional occupations and most associate professional occupations. Projections suggest that high skilled occupations will see a combined growth rate of 12%, three times the average rate for all occupations. In the decade to 2024 the number of high skilled jobs in the City Region is expected to increase by approximately 71,000.
Lower-skilled ‘service-intensive’ roles are also expected to see pronounced growth. The most notable example of this is the category of caring personal services roles (which includes social care and childcare jobs) which is projected to grow by 20,000 (17%).
REPLACEMENT DEMANDS WILL CREATE JOB OPPORTUNITIES ACROSS THE OCCUPATIONAL SPECTRUM.
It is important to note that pattern of net job loss and decline gives only part of the picture. We get a different impression when replacement demand is factored in to give the overall recruitment requirement. This is because over the next decade replacement demands are expected to generate 10 times as many job openings as net growth. On this basis, all of the occupational groups are expected to see a positive requirement. The areas of greatest demand are again high skilled occupations together with lower skilled care and elementary roles.
HIGH SKILLED JOBS EXPECTED TO INCREASE BY
71,000
‘SERVICE-INTENSIVE’ ROLES SUCH AS CHILDCARE ARE EXPECTED TO
SEE PRONOUNCED GROWTH
23 LEEDS CITY REGION LABOUR MARKET ANALYSIS 2016/2017
THE NUMBER OF VACANCIES IN THE CITY REGION GREW STRONGLY IN RESPONSE TO THE ECONOMIC RECOVERY BUT PERFORMANCE MAY HAVE MODERATED IN RECENT MONTHS.
The most recent Employer Skills Survey for 2015 indicated a significant strengthening of labour demand in Leeds City Region, reflected in an increased volume of vacancies. The proportion of employers in the City Region with at least one vacancy increased from 14% to 19% between 2013 and 2015 but the volume of vacancies more than doubled, outstripping the national average growth rate of 42%. All occupational areas saw a growth in vacancies but the greatest increases in volume terms were for elementary, associate professional and administrative roles.
Whether this strong vacancy performance has continued since 2015 is difficult to say, in the absence of any reliable data for the intervening period. What the analysis does demonstrate is the continuing demand for labour across the occupational spectrum including for lower skilled jobs.
HIGHER SKILLED JOB POSTINGS DOMINATED BY SALES/BUSINESS AND DIGITAL ROLES.
We can examine the detailed profile of current labour demand at the current time using an analysis of job vacancies posted online.
Unlike analysis based on sample surveys we can look at the profile of job openings at a granular level for local areas without statistical limitations. However, this kind of analysis comes with the caveat that some jobs are more likely to be advertised online than others particularly higher skilled roles.
One of the LEP’s employment and skills priorities is to raise the bar on higher level skills. With this in mind it is useful to understand the profile of demand with regard to jobs that require high level skills.Figure 11 shows the job titles with the greatest number of online job postings over the last year, limited to the higher level occupational groups of managers, professionals and associate professionals.

24 LEEDS CITY REGION LABOUR MARKET ANALYSIS 2016/2017
FIGURE 11 TOP 10 HIGHER SKILLED JOB TITLES BY VOLUME OF JOB POSTINGS SEPT 2015-AUG 2016 IN LEEDS CITY REGION
Source: Labour Insight Jobs (Burning Glass Technologies)Note: Analysis limited to jobs classified to SOC major groups 1-3
The top 10 jobs are drawn from a range of areas but there is a strong representation of business jobs, particularly sales. This includes the titles of Sales Executive, Business Development Executive and Account Manager.
Digital jobs are also strong represented in the form of Business Analyst and two Developer roles.
In addition to this, two public sector jobs with high levels of employment, Nurse and Primary School Teacher, are present.
Overall, this demonstrates that business and sales skills, as well as digital skills, are a key component of current labour demand and need consideration as well as the priority skill areas that are prime focus of the Employment and Skills Plan.
BUILDING RELATIONSHIPS AND COMMUNICATION SKILLS ARE KEY FOR HIGH SKILLED JOBS.
Analysis of job titles also enables us to understand the skills that employers are looking for with regard to higher skilled jobs. Employers do not necessarily list their requirements in full in job postings; they are more likely to highlight those skills they expect will be difficult to obtain from candidates.
25 LEEDS CITY REGION LABOUR MARKET ANALYSIS 2016/2017
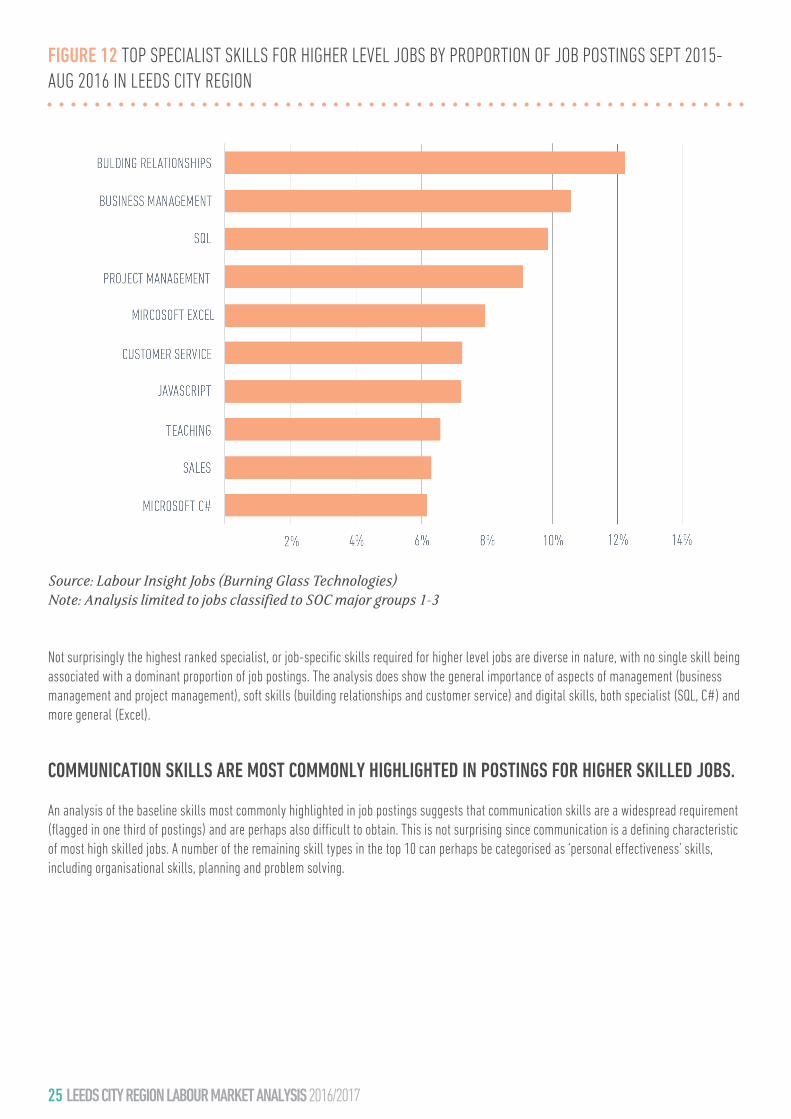
FIGURE 12 TOP SPECIALIST SKILLS FOR HIGHER LEVEL JOBS BY PROPORTION OF JOB POSTINGS SEPT 2015-AUG 2016 IN LEEDS CITY REGION
Source: Labour Insight Jobs (Burning Glass Technologies)Note: Analysis limited to jobs classified to SOC major groups 1-3
Not surprisingly the highest ranked specialist, or job-specific skills required for higher level jobs are diverse in nature, with no single skill being associated with a dominant proportion of job postings. The analysis does show the general importance of aspects of management (business management and project management), soft skills (building relationships and customer service) and digital skills, both specialist (SQL, C#) and more general (Excel).
COMMUNICATION SKILLS ARE MOST COMMONLY HIGHLIGHTED IN POSTINGS FOR HIGHER SKILLED JOBS.
An analysis of the baseline skills most commonly highlighted in job postings suggests that communication skills are a widespread requirement (flagged in one third of postings) and are perhaps also difficult to obtain. This is not surprising since communication is a defining characteristic of most high skilled jobs. A number of the remaining skill types in the top 10 can perhaps be categorised as ‘personal effectiveness’ skills, including organisational skills, planning and problem solving.

26 LEEDS CITY REGION LABOUR MARKET ANALYSIS 2016/2017
THE ANALYSIS DOES SHOW THE GENERAL IMPORTANCE OF ASPECTS OF MANAGEMENT
(BUSINESS MANAGEMENT AND PROJECT MANAGEMENT), SOFT SKILLS (BUILDING
RELATIONSHIPS AND CUSTOMER SERVICE) AND DIGITAL SKILLS, BOTH SPECIALIST (SQL, C#) AND
MORE GENERAL (EXCEL).

27 LEEDS CITY REGION LABOUR MARKET ANALYSIS 2016/2017
FIGURE 13 TOP “BASELINE” SKILLS FOR HIGHER LEVEL JOBS BY PROPORTION OF JOB POSTINGS SEPT 2015-AUG 2016 IN LEEDS CITY REGION
Source: Labour Insight Jobs (Burning Glass Technologies)Note: Analysis limited to jobs classified to SOC major groups 1-3
WHAT ARE THE AREAS OF MISMATCH BETWEEN SUPPLY AND DEMAND OF SKILLS?Skill mismatches are a signal of imbalance between supply and demand in the labour market, between the skills available and the skills required. They constrain organisations from being able to meet market needs, opportunities or public service objectives. Although such imbalances are typically short-term, in those cases where market failure becomes entrenched there may be a case for public intervention.
The current skills position of the City Region presents a complex picture. It is increasingly becoming a high skill economy but it shows signs of a skills surplus in some parts of the labour market, skills gaps and shortages in others but also evidence that the average position of the City is one of ‘low skills equilibrium’.
SKILL SHORTAGES ARE GROWING.
The City Region faces a significant and growing level of skills shortages. Skill shortage vacancies reflect a deficit of supply in the external labour market, which happen when employers are unable to fill their vacancies due to a lack of candidates with the required skills, qualifications or experience. The signs are that as the economy grows employers are finding it more difficult to recruit the skilled people that they need. Over the short period between 2013 and 2015 number of vacancies reported by employers doubled, whereas the number of skill shortages tripled.

28 LEEDS CITY REGION LABOUR MARKET ANALYSIS 2016/2017
FIGURE 14 VOLUME OF VACANCIES AND SKILL SHORTAGE VACANCIES IN LEEDS CITY REGION SOURCE: EMPLOYER SKILLS SURVEY.
Base: all vacancies
This means that 25% of vacancies are difficult to fill due to a lack of skilled people, a marked increase over 17% seen in 2013 and higher than England average of 23%.
The pattern of change is also different to the England average where the volume of skill shortages has grown in proportion to the growth of vacancies in general.
SHORTAGES ARE CONCENTRATED IN HIGHER SKILLED AND SKILLED TRADES OCCUPATIONS.
The occupational pattern of shortages suggests that there are particular problems in generating intermediate and high-level vocational / technical skills. The incidence of skill shortages is greatest in professional, associate professional roles along with skilled trades.

29 LEEDS CITY REGION LABOUR MARKET ANALYSIS 2016/2017
FIGURE 15 INCIDENCE OF SKILL SHORTAGE VACANCIES BY OCCUPATION IN LEEDS CITY REGION
Base: all establishments with vacancies in Leeds City Region (1,086)Source: Employer Skills Survey 2015
Detailed occupational data on shortages are not available from the Employer Skills Survey for the City Region but analysis for Yorkshire and the Humber indicates that shortages are most acute in three occupational sub-major groups:
• Science, research, engineering and technology professionals • Science, engineering and technology associate professionals• Skilled metal, electrical and electronic trades.
Each of these groups has a shortage density of over 40% across the region. A common denominator is a requirement for STEM skills at a relatively high level. Although we do not have a long time-series of local data for shortages, national data consistently indicates that these occupations are the focus for shortages that have persisted for a number of years.
JOB-SPECIFIC TECHNICAL SKILLS ARE THE MAIN DEFICIT AND WORKPLACE DEVELOPMENT IS THE KEY TO ADDRESSING THEM.
Job-specific technical skills are known to be the most common area of deficit with regard to skill shortages. The technical skills associated with the occupations most affected by shortages are best gained, and can sometimes only be gained, in a workplace setting, illustrating the critical role that employers hold in tackling skills shortages.

30 LEEDS CITY REGION LABOUR MARKET ANALYSIS 2016/2017
SKILLS GAPS ARE MORE NUMEROUS THAN SHORTAGES AND TEND TO AFFECT LOWER-SKILLED OCCUPATIONS BUT ALSO MANAGEMENT ROLES.
Skill gaps occur when existing workers within an organisation are not fully proficient in their jobs and lack the full range of skills needed to meet business objectives. They can be an indicator of the need for workforce development by employers.
Skills gaps are more widespread and numerous than skill shortages. There were 63,000 skills gaps in 2015, equivalent to approximately 5% of total employment in the City Region. Around 17%, or one in six, of employers are affected by gaps.
They also differ from shortages in that employers are more likely to report gaps in respect of lower skilled and semi-skilled occupations. The occupations with the highest incidence are elementary occupations and sales and customer service roles, but also clerical jobs.
63,000 SKILLS GAPS IN 2015, EQUIVALENT TO APPROXIMATELY 5% OF TOTAL EMPLOYMENT
1 IN 6 OF EMPLOYERS ARE AFFECTED BY SKILLS GAPS.
31 LEEDS CITY REGION LABOUR MARKET ANALYSIS 2016/2017
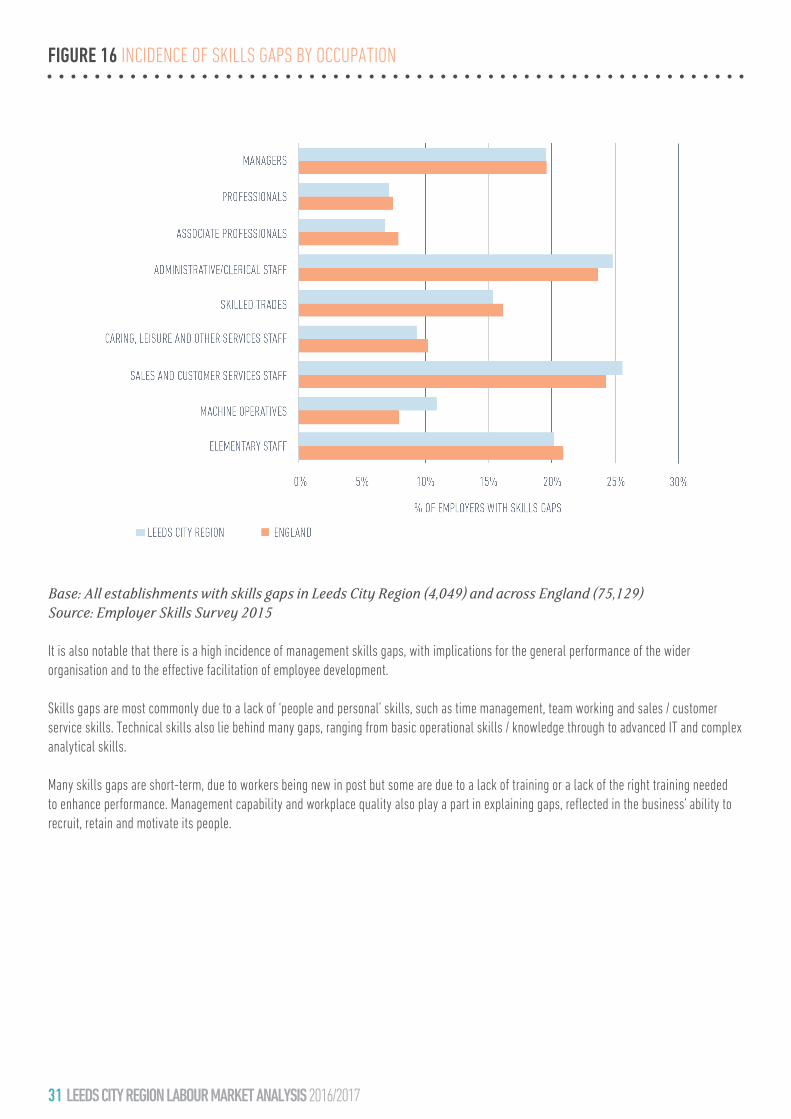
FIGURE 16 INCIDENCE OF SKILLS GAPS BY OCCUPATION
Base: All establishments with skills gaps in Leeds City Region (4,049) and across England (75,129)Source: Employer Skills Survey 2015
It is also notable that there is a high incidence of management skills gaps, with implications for the general performance of the wider organisation and to the effective facilitation of employee development.
Skills gaps are most commonly due to a lack of ‘people and personal’ skills, such as time management, team working and sales / customer service skills. Technical skills also lie behind many gaps, ranging from basic operational skills / knowledge through to advanced IT and complex analytical skills.
Many skills gaps are short-term, due to workers being new in post but some are due to a lack of training or a lack of the right training needed to enhance performance. Management capability and workplace quality also play a part in explaining gaps, reflected in the business’ ability to recruit, retain and motivate its people.
32 LEEDS CITY REGION LABOUR MARKET ANALYSIS 2016/2017
THE HIGH PREVALENCE OF EU MIGRANT EMPLOYMENT IN SOME SECTORS / OCCUPATIONS CREATES A RISK OF DISRUPTION SHOULD ACCESS TO THIS LABOUR SOURCE BE AFFECTED BY THE UK’S DECISION TO LEAVE THE EU.
The quantity and distribution of migrant workers in the labour force can also be an indicator of skills deficit – in this case between the needs of employers and the skills available from indigenous workers.
Following the outcome of the EU referendum it seems likely that free movement of labour into the UK for nationals of EU countries will be affected and that employers’ access to migrant workers from this source may be curtailed.
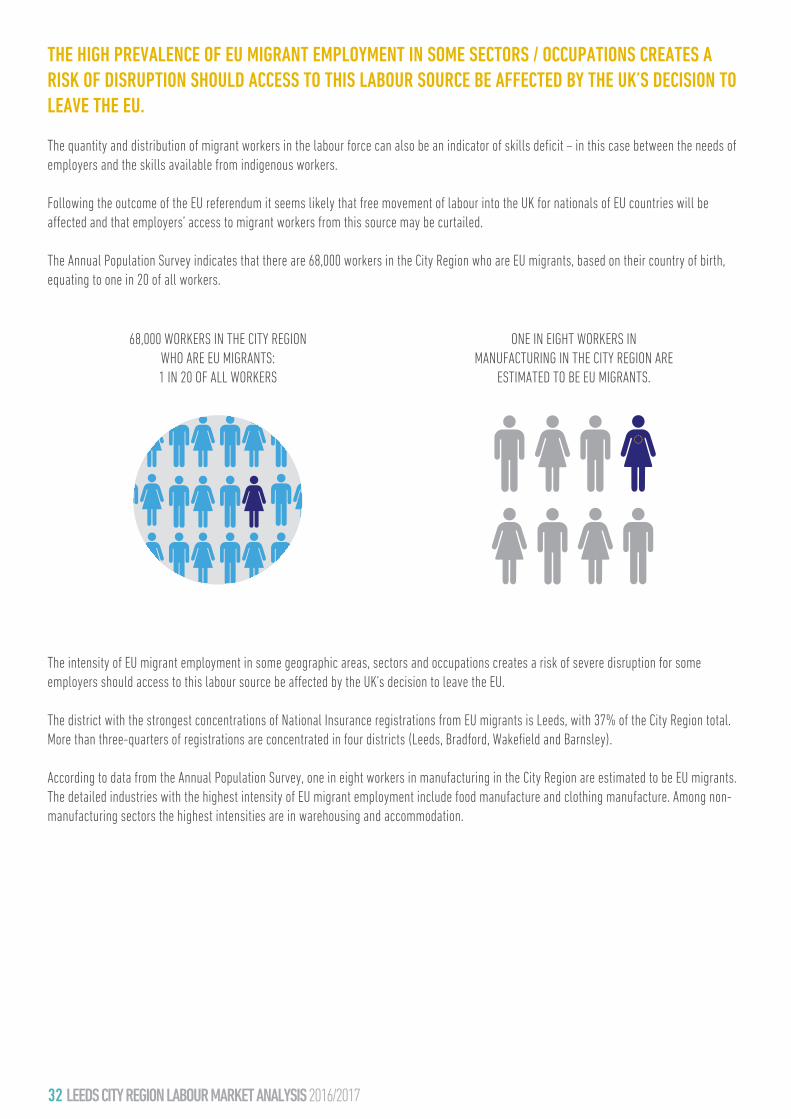
The Annual Population Survey indicates that there are 68,000 workers in the City Region who are EU migrants, based on their country of birth, equating to one in 20 of all workers.
The intensity of EU migrant employment in some geographic areas, sectors and occupations creates a risk of severe disruption for some employers should access to this labour source be affected by the UK’s decision to leave the EU.
The district with the strongest concentrations of National Insurance registrations from EU migrants is Leeds, with 37% of the City Region total. More than three-quarters of registrations are concentrated in four districts (Leeds, Bradford, Wakefield and Barnsley).
According to data from the Annual Population Survey, one in eight workers in manufacturing in the City Region are estimated to be EU migrants. The detailed industries with the highest intensity of EU migrant employment include food manufacture and clothing manufacture. Among non-manufacturing sectors the highest intensities are in warehousing and accommodation.
ONE IN EIGHT WORKERS IN MANUFACTURING IN THE CITY REGION ARE
ESTIMATED TO BE EU MIGRANTS.
68,000 WORKERS IN THE CITY REGION WHO ARE EU MIGRANTS:1 IN 20 OF ALL WORKERS

33 LEEDS CITY REGION LABOUR MARKET ANALYSIS 2016/2017
FIGURE 17 EU MIGRANT EMPLOYMENT AS % OF TOTAL EMPLOYMENT IN OCCUPATION IN LEEDS CITY REGION
Source: Annual Population Survey, January to December 2015
The largest concentrations of EU migrants are in routine and lower-skilled jobs, which also tend to be relatively low paid. Operative and elementary occupations together account for 45% of total EU migrant employment. These occupations also have the highest intensity of EU migrant employment. More than one quarter of total workers in elementary trades and one fifth of process, plant and machine operatives, are EU migrants.
UNEMPLOYMENT HAS FALLEN MARKEDLY IN THE CITY REGION BUT THERE IS STILL A SIGNIFICANT STRUCTURAL ELEMENT TO JOBLESSNESS.
Skills mismatch also comes in the form of structural unemployment in those instances where the occupational and qualification profile of the jobless is misaligned with demand from the labour market.
Based on the headline International Labour Organisation (ILO) measure, unemployment in the City Region has fallen by around 50,000 from its peak and according to the latest data stands at 89,000, a rate of 6% (using data that averages the position for January to December 2015).This is still above the national average (5.3%) and higher than the pre-recession low-point in the City Region of less than 5%; although more timely data for claimants of Job Seekers’ Allowance (JSA) suggests that joblessness has now fallen below its pre-recession level in terms of this measure.
The rate of youth unemployment fell from 24% to 15% between 2012 and 2015 but is still more than twice as high as the overall rate for the City Region. This reflects the fact that youth unemployment has a longer term structural component that pre-dates the recession and is due to the difficulty that some young people face in gaining an initial foothold in the labour market.
34 LEEDS CITY REGION LABOUR MARKET ANALYSIS 2016/2017
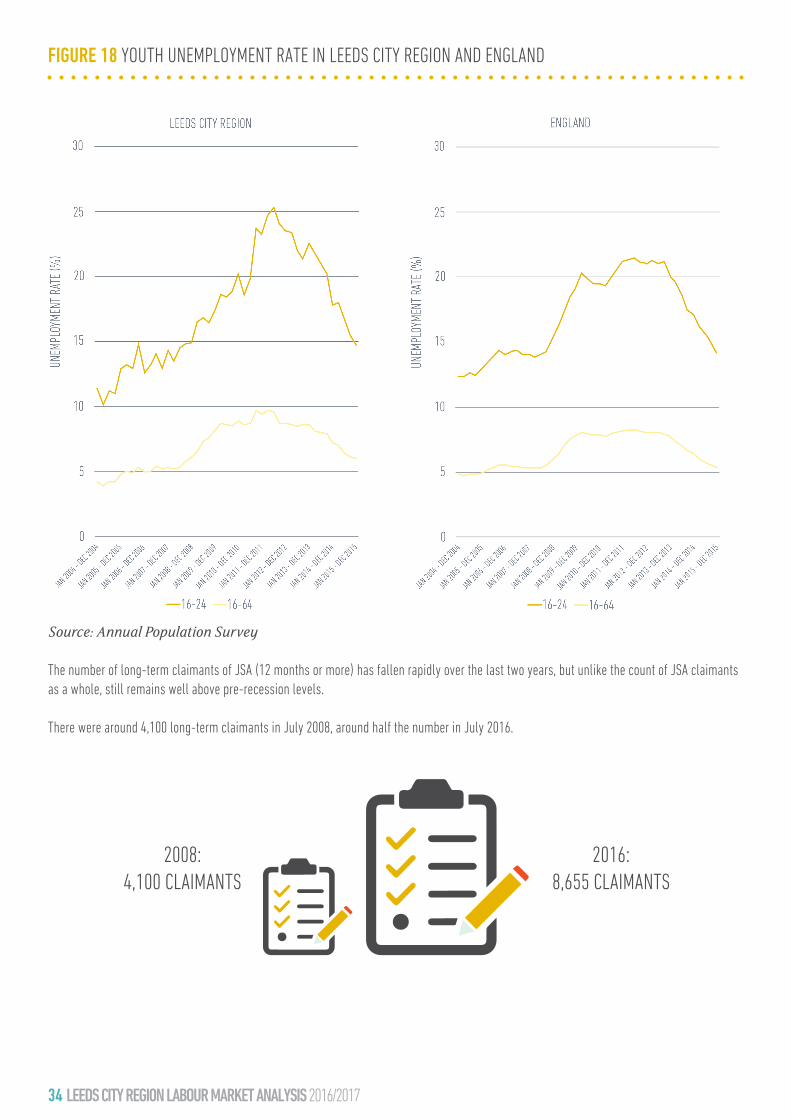
FIGURE 18 YOUTH UNEMPLOYMENT RATE IN LEEDS CITY REGION AND ENGLAND
Source: Annual Population Survey
The number of long-term claimants of JSA (12 months or more) has fallen rapidly over the last two years, but unlike the count of JSA claimants as a whole, still remains well above pre-recession levels.
There were around 4,100 long-term claimants in July 2008, around half the number in July 2016.
2008:4,100 CLAIMANTS
2016:8,655 CLAIMANTS
35 LEEDS CITY REGION LABOUR MARKET ANALYSIS 2016/2017
THERE IS A MISMATCH BETWEEN THE JOBS THAT NEED TO BE DONE IN THE CITY REGION AND THE JOBS THAT THE UNEMPLOYED ARE PROBABLY ABLE TO DO.
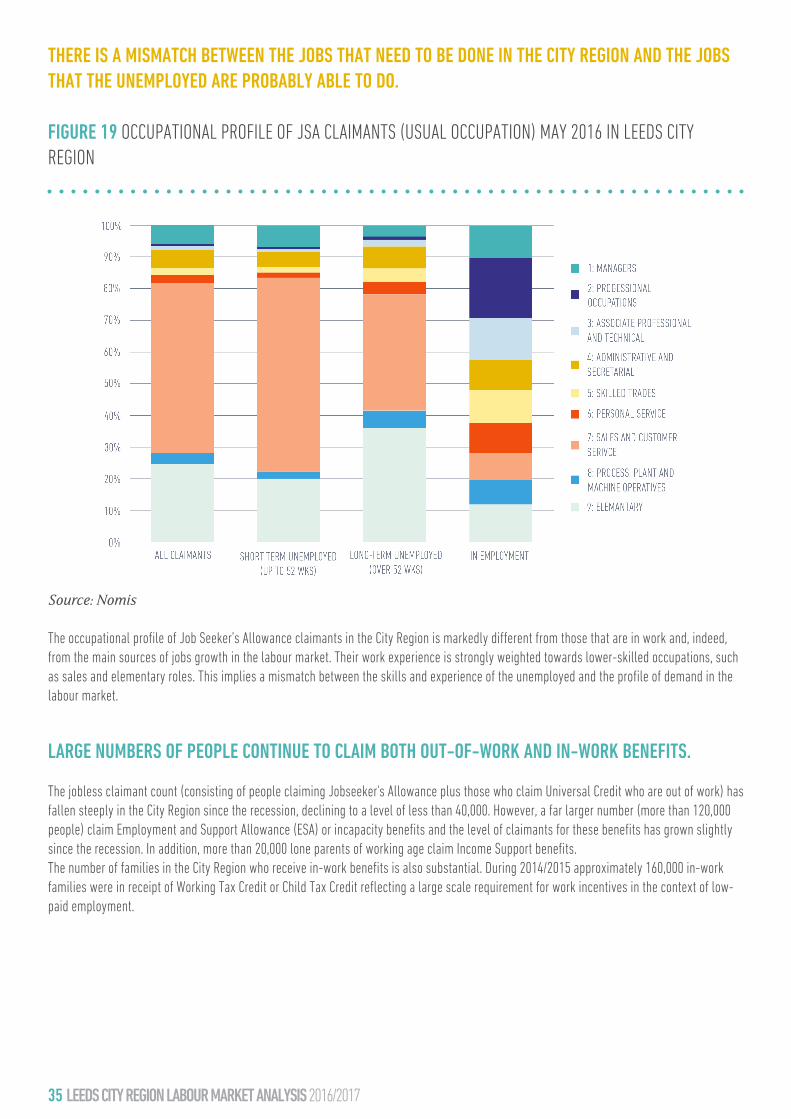
FIGURE 19 OCCUPATIONAL PROFILE OF JSA CLAIMANTS (USUAL OCCUPATION) MAY 2016 IN LEEDS CITY REGION
Source: Nomis
The occupational profile of Job Seeker’s Allowance claimants in the City Region is markedly different from those that are in work and, indeed, from the main sources of jobs growth in the labour market. Their work experience is strongly weighted towards lower-skilled occupations, such as sales and elementary roles. This implies a mismatch between the skills and experience of the unemployed and the profile of demand in the labour market.
LARGE NUMBERS OF PEOPLE CONTINUE TO CLAIM BOTH OUT-OF-WORK AND IN-WORK BENEFITS.
The jobless claimant count (consisting of people claiming Jobseeker's Allowance plus those who claim Universal Credit who are out of work) has fallen steeply in the City Region since the recession, declining to a level of less than 40,000. However, a far larger number (more than 120,000 people) claim Employment and Support Allowance (ESA) or incapacity benefits and the level of claimants for these benefits has grown slightly since the recession. In addition, more than 20,000 lone parents of working age claim Income Support benefits.The number of families in the City Region who receive in-work benefits is also substantial. During 2014/2015 approximately 160,000 in-work families were in receipt of Working Tax Credit or Child Tax Credit reflecting a large scale requirement for work incentives in the context of low-paid employment.

36 LEEDS CITY REGION LABOUR MARKET ANALYSIS 2016/2017
UNDER-UTILISATION OF WORKERS’ EXISTING SKILLS IS A WIDESPREAD ISSUE.
Mismatch is not just about a deficit of supply – a problem of people lacking the skills needed by business. It can also be about people’s skills being more advanced than those required for their jobs.
FIGURE 20 PROPORTION OF EMPLOYERS WITH ANY STAFF WHOSE SKILLS / QUALIFICATIONS ARE UNDER-USED
Source: Employer Skills Survey 2015. Base: all employers.
Just under one-third of employers in the City Region say that they do not make full use of the skills and qualifications of their staff. This is higher than some core cities and slightly higher than the England average.
This confirms that lack of demand for skills is a major issue for the City Region. We can infer from national evidence that it is a bigger problem than deficits of supply (shortages and gaps). Nationally, around 30% of graduates say that their skills are not fully used in their job, whilst a large number of workers with intermediate skills or qualifications are in jobs with a minimal skills requirement.
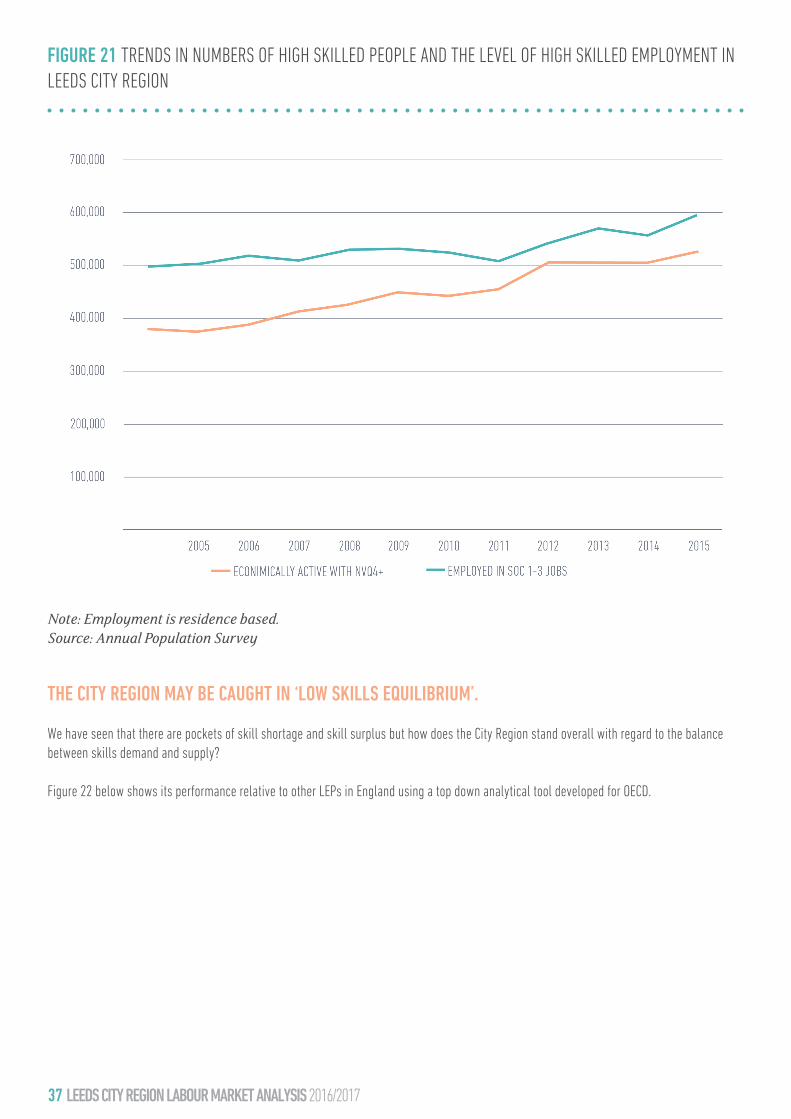
The potential for the supply of skills to outstrip demand is also reflected in a comparison of trends in the supply of qualified people relative to growth in high skilled employment.
THE NUMBER OF HIGH QUALIFIED PEOPLE IS GROWING MORE RAPIDLY THAN HIGH SKILLED EMPLOYMENT.
There is no simple definition of high skilled jobs but it seems clear that the overall trend in the supply of highly qualified people has the potential in future to outstrip demand in terms of growth in high skilled employment in the City Region. This raises questions about the ability of local employers to utilise the additional skills that are being generated without a substantial shift in the trajectory of demand growth.
37 LEEDS CITY REGION LABOUR MARKET ANALYSIS 2016/2017
FIGURE 21 TRENDS IN NUMBERS OF HIGH SKILLED PEOPLE AND THE LEVEL OF HIGH SKILLED EMPLOYMENT IN LEEDS CITY REGION
Note: Employment is residence based.Source: Annual Population Survey
THE CITY REGION MAY BE CAUGHT IN ‘LOW SKILLS EQUILIBRIUM’.
We have seen that there are pockets of skill shortage and skill surplus but how does the City Region stand overall with regard to the balance between skills demand and supply?
Figure 22 below shows its performance relative to other LEPs in England using a top down analytical tool developed for OECD.

38 LEEDS CITY REGION LABOUR MARKET ANALYSIS 2016/2017
FIGURE 22 RELATIONSHIP BETWEEN SKILLS SUPPLY AND DEMAND ACROSS LEP AREAS
Source: LEP analysis using framework adapted from Green, A. (2012), “Skills for Competitiveness: Country Report for United Kingdom”, OECD
Alongside most Core Cities, Leeds City Region is in the low skills equilibrium quadrant. This indicates that the local labour market is in balance but businesses typically compete on the basis of price with low skills and low wages and have less need to upgrade the skills of their workers.
The aim is to shift the City Region into the top right quadrant. In the high skills equilibrium quadrant businesses use high skills to deliver sophisticated products and services, competing on the basis of quality rather than price and leading to high productivity and high wages. This is difficult to achieve since it involves increasing demand for skills, principally by raising the proportion of businesses with high value strategies, at same as increasing supply of high level skills.

39 LEEDS CITY REGION LABOUR MARKET ANALYSIS 2016/2017
CONCLUSIONSThe need for action on skills remains pressing. The divergence in performance between the City Region and the national average in terms of the proportion of people in employment and the productivity of people in work continues to widen, largely as a result of the particularly severe impact of the recession locally. Although this largely reflects weak demand for labour and particularly for high skilled labour, the right supply of skills needs to be put in place to promote the development of higher value business activities in the City Region.
It is therefore of concern that the City Region continues to lag behind on high level qualifications.
Moreover, the pipeline of skills from education and training shows evidence of decline in volume terms. There has been a significant fall in FE and skills activity, job-related training may be on a long-term downward trend while HE enrolments are flat following a decline in 2012/2013. This lends emphasis to the importance of achieving the best value for the investment that is made in terms of the development of economically-valuable skills. It is therefore a concern that some subjects aligned with priority skill areas have seen a disproportionate fall in the volume of activity.
Broad-brush analysis suggests a degree of misalignment between the skills being developed through mainstream FE and HE and the skill requirements of the labour market, implied by the projected profile of future job openings. This needs to be explored further with key representatives of the learning sector.
Manufacturing is an area of strong specialisation in the City Region economy and this needs to be reflected in education and training provision. Although continuing net decline in employment is likely, the sector’s strong replacement needs coupled with a shift to higher value activities will mean that skills will be critical, particularly in respect of engineering and other professional and other associate professional roles.
Turning to digital skills, another priority skill area, there is evidence that the pipeline of skills is low and declining. At national level, concerns have been expressed about the relevance of some computer science provision and its relevance to the needs of employers and this may be a contributing factor.
With regard to infrastructure skills the picture is a better one at apprenticeship level but there is a low and declining supply of construction-related skills coming from the City Region’s higher education sector.
The polarisation of occupational employment has important implications. The decline in middle-skilled jobs reduces progression opportunities into higher skilled roles. Moreover, the service-intensive jobs that are growing in number are often less attractive than the middle-skilled jobs that are disappearing. This presents issues with regard to inclusive growth and the ambition to raise job quality and to connect disadvantaged residents with rewarding opportunities.

40 LEEDS CITY REGION LABOUR MARKET ANALYSIS 2016/2017
As a result of replacement demand job opportunities are expected in all broad occupational groups including those that are projected to see net decline. It is important to communicate widely that these occupations will continue to have recruitment needs and will offer positive career opportunities for some time to come.
As the economic recovery has gathered pace, the City Region has shown a pronounced susceptibility to skill shortages. These shortages are most acute in the professional, associate professional and skilled trade occupations that have been identified as skill priorities in our Employment and Skills Plan. These shortages are chiefly due to deficits of technical skills and work experience, highlighting the importance of vocational pathways (including apprenticeships) in addressing such skills needs.
At the same time the effectiveness of some lower-skilled workers is constrained by skills gaps relating to a range of technical and generic skills. Part of the explanation for this is likely to be skills gaps among managers themselves, as well as weaknesses in training and workplace practices.
The outcome of the EU referendum may lead to the emergence of labour shortages in sectors that are reliant on EU migrant workers, with the potential to cause disruption to business. The worst-affected businesses and sectors may need support in order to respond to this challenge. In some cases the response could involve upskilling as employers revise their business models or introduce new technologies.
It seems likely that low demand for skills is a significant issue with the City Region affected by pockets of skills surplus. Many employers say that their workers are skilled or qualified beyond the requirements of the job whilst the number of high skilled residents is growing more rapidly than the level of high skilled employment. This does not imply that investment in high level skills is less worthwhile or should be reduced.
Broad-brush, top-down analysis suggests that the City Region may have fallen into a state of low skills equilibrium, with the supply of and demand for skills in balance but at a low level. The solution is to Increase demand for skills by attracting and developing businesses with high value strategies, whilst making a co-ordinated effort to improve the supply of skills.
It is also important to note that the City Region is not a homogeneous area spatially. Much of our analysis has focused on the overall position for the City Region. This conceals many important differences within the area, at district level and below, explored more fully in the main report. Jobs are
distributed differently to people across the area and the skills profile also varies markedly. Inclusive growth requires improved connectivity between people and jobs at the overall City Region level but also within more localised labour markets within the City Region. In some cases transport links will be an important factor but there is also clear evidence of mismatch between the skills held by those seeking work and the skills required to access the available jobs.

41 LEEDS CITY REGION LABOUR MARKET ANALYSIS 2016/2017
GET INVOLVEDFIND OUT MORE ABOUT WHAT WE DO AT WWW.THE-LEP.COM/SKILLS
OR FOLLOW US ON TWITTER @LEEDSCITYREGION
IF YOU’D LIKE TO WORK WITH US ON DELIVERING OUR PLAN FOR SKILLED PEOPLE, BETTER JOBS CONTACT US ON [email protected] OR 0113 348 1819