legacy and alternative flame retardants in norwegian and...
TRANSCRIPT

Legacy and alternative flame retardants in Norwegian and UK indoor environment: implications of human exposure via dust ingestion Article
Supplemental Material
Creative Commons: AttributionNoncommercialNo Derivative Works 4.0
Kademoglou, K., Xu, F., PadillaSanchez, J. A., Haug, L. S., Covaci, A. and Collins, C. D. (2017) Legacy and alternative flame retardants in Norwegian and UK indoor environment: implications of human exposure via dust ingestion. Environment International, 102. pp. 4856. ISSN 01604120 doi: https://doi.org/10.1016/j.envint.2016.12.012 Available at http://centaur.reading.ac.uk/69170/
It is advisable to refer to the publisher’s version if you intend to cite from the work. See Guidance on citing .
To link to this article DOI: http://dx.doi.org/10.1016/j.envint.2016.12.012
Publisher: Elsevier
All outputs in CentAUR are protected by Intellectual Property Rights law, including copyright law. Copyright and IPR is retained by the creators or other copyright holders. Terms and conditions for use of this material are defined in the End User Agreement .

www.reading.ac.uk/centaur
CentAUR
Central Archive at the University of Reading
Reading’s research outputs online

1
Supplementary information 1
2
Legacy and alternative flame retardants in Norwegian and UK indoor environment: Implications of 3
human exposure via dust ingestion 4
Katerina Kademoglou1*, Fuchao Xu2, Juan Antonio Padilla-Sanchez3, Line Småstuen Haug3, Adrian 5
Covaci2, Chris D. Collins1* 6
1 Soil Research Centre, University of Reading, Reading, RG6 6DW, UK 7
2 Toxicological Centre, University of Antwerp, Universiteitsplein 1, 2610 Wilrijk-Antwerp, Belgium 8
3 Norwegian Institute of Public Health (NIPH), P.O. Box 4404, Nydalen, 0403 Oslo, Norway 9
* - Corresponding authors: Katerina Kademoglou: [email protected] or 10
[email protected] ; Chris Collins: [email protected] 11
12
Number of pages: 28 13
Number of figures: 1 14
Number of tables: 19 15
16

2
Materials and methods 17
Table SI-1 – Sample codes with country of origin, source, collection year, mass used (g) and flooring material 18
Sample code Country Source Collection year Mass used (g) Flooring material General remarks
H1 UK House 2013 0.034 wall-to-wall Carpet
H2 UK House 2013 0.032 wall-to-wall Carpet
H3 UK House 2013 0.031 wall-to-wall Carpet
H4 UK House 2013 0.032 wall-to-wall Carpet
H5 UK House 2013 0.033 wall-to-wall Carpet
H6 UK House 2013 0.032 wall-to-wall Carpet
H7 UK House 2011 0.030 wall-to-wall Carpet
H8 UK House 2011 0.031 wall-to-wall Carpet
H9 UK House 2012 0.032 wall-to-wall Carpet
H10 UK House 2011 0.032 wall-to-wall Carpet
H11 Norway House 2013 0.030 Laminated floor
H12 Norway House 2013 0.030 Wooden floor
H13 Norway House 2013 0.032 Laminated floor
H14 Norway House 2013 0.032 Other/not-defined
H15 Norway House 2013 0.033 Wooden floor
H16 Norway House 2013 0.030 No data
H17 Norway House 2013 0.032 No data
H18 Norway House 2013 0.033 parquet
H19 Norway House 2013 0.032 Wooden floor
H20 Norway House 2013 0.031 Flooring
S1 UK Office 2013 0.031 wall-to-wall Carpet Library offices
S2 UK Office 2013 0.030 Laminated floor and carpet flooring University offices
S3 UK Store 2013 0.030 Laminated wood flooring Store with office supplies, printers,
office furniture

3
S4 UK Store 2013 0.031 wall-to-wall Carpet; PVC floor in
repair room only Computer store
S5 UK Store 2013 0.032 Laminated wood flooring Luggage store
S6 UK Office 2013 0.032 wall-to-wall Carpet Lettings office
S7 UK Office 2013 0.031 wall-to-wall Carpet (two floors) Bank offices
S8 UK Store 2013 0.032 Laminated wood flooring (two
floors) Kitchenware store
S9 UK Office 2013 0.032 Laminated flooring (1st floor)
wall-to-wall Carpet (2nd floor) Lettings office
S10 UK Office 2013 0.032 wall-to-wall Carpet Construction management office
S11 UK Store 2013 0.032 wall-to-wall Carpet Phone store
S12 UK Store 2012 0.031 Laminated wood flooring Toys store
19
20

4
Chemicals and Reagents 21
Standards of BDE 28, 47, 66, 85, 100, 153, 154, 183 and 209, EH-TBB, BTBPE, Dechlorane plus (syn- 22
and anti-DP isomers), BEH-TEBP, TBECH (alpha and beta isomers) and labelled internal standards 23
(IS) 13C-BDE 209 were purchased from Wellington Laboratories (Guelph, ON, Canada). BDE 77 and 24
128 IS were obtained from AccuStandard Inc. (New Haven, CT, USA). Standards of tri-n-propyl 25
phosphate (TnPP), tri-isobutyl phosphate (TiBP), tri-n-butyl phosphate (TnBP), triphenyl phosphate 26
(TPHP), tris(2-chloroethyl) phosphate (TCEP) and tris(1,3-dichloropropyl) phosphate (TDCIPP, 27
mixture of 2 isomers) were purchased from Chiron AS (Trondheim, Norway). Triamyl phosphate (TAP; 28
IS) was purchased from TCI Europe (Zwijndrecht, Belgium). Labeled TPP-d15 IS and tris(2-29
butoxyethyl) phosphate (TBOEP) were purchased from Sigma Aldrich. Tris(1-chloro-2-propyl) 30
phosphate (TCPP, mixture of 3 isomers) was purchased from Pfaltz & Bauer (Waterbury, CT, USA). 31
Purity of analytical standards was >98%, except for TBOEP (>94%). Resorcinol bis(diphenyl 32
phosphate) (PBDPP or RDP) and Bisphenol A bis(diphenyl phosphate) (BPA-BDPP or BDP) were 33
purchased from TRC (Toronto, ON, Canada). The purities of the standards were 95.8% for RDP and 34
98% for BDP, respectively. Standards of isodecyl diphenyl phosphate (iDPP) were purchased from 35
Accustandard (New Haven, CT, USA) and purity was 45% (in a mix with 55% TPHP, marketed as 36
“Santicizer 148”), while Trixylenyl phosphate (TXP) standard was purchased from Chemos 37
(Regenstauf, Germany) with purity . Standard stock solutions were prepared in iso-octane for PBDEs, 38
EHFRs and m-PFRs, whereas standard stock solutions for o-PFRs were prepared in MeOH. 39
Indoor dust reference material SRM 2585 was purchased from the US National Institute of Standards 40
and Technology (NIST, Gaithersburg, MD, USA). Empty, pre-fritted polypropylene filtration tubes (6 41
mL) for silica SPE cartridge preparation and Amino Propyl (NH2)/silica-based cartridges (500 mg, 3 42
mL) were purchased from Agilent. For 5% acidified silica gel preparation, concentrated sulphuric acid 43
(H2SO4, >96%) was used and was purchased from Merck. Briefly, 1.9 mL of pure sulphuric acid was 44
added drop-wise to 50 g of hexane-washed, oven-dried silica gel under continuous and vigorous stirring. 45
Glass test tubes were cleaned by soaking for at least 12 h in an alkali solution. After washing, the tubes 46
were rinsed with water and dried at 100 ºC for at least 12 h and burned at 400°C to remove all traces of 47
contamination. 48
Analytical methods 49
Approximately 30 mg indoor dust sample were carefully placed into clean, transparent glass test tubes. 50
50 μL of an IS mix (prepared in iso-octane) were added ranging from 5 to 200 ng (13C-EH-TBB-d17, 51
13C-BTBPE, 13C-BEH-TEBP-d17, 13C-syn-DP, 13C-anti-DP, 13C-BDE-209, BDE-77, BDE-128, TCEP-52
d12, TPHP-d15, TDCPP-d15, TBEP-d6, and TAP). Indoor dust samples were extracted 3 times (1 min 53
vortex and 10 min sonication) using 2.5 mL of hexane/acetone (3:1; v/v). The supernatant was collected 54
after each extraction cycle and evaporated to near dryness under a gentle stream of N2. All samples 55
Commented [a1]: add

5
were analysed in batches of 20 samples in two consecutive days, along with one SRM 2585 (NIST, 56
USA) as quality control and two field blanks. Oligomeric PFRs were detected in all procedural blanks. 57
The average blank value was calculated in ng/g and then subtracted from the sample o-PFR values. For 58
the not detected FRs in blanks, mLOD was established using the last point of the calibration curve 59
divided by two. Our results of PBDEs and PFRs were in compliance with SRM 2585 indicative levels 60
and PFR levels from (Cequier et al., 2014). PBDEs levels ranged from 90 to 118% (median: 95%) with 61
the exception of BDE-28 (33%) and BDE-183 (122%). As for some PFRs, no indicated values were 62
available while drafting of the current manuscript, therefore no comparison could be performed. 63
64
Method optimisation 65
66
Figure SI-1 - Schematic representation of aminopropyl silica fractionation (step 1) and 5% acidified 67
silica (AS) clean up (step: 2) based on (Van den Eede et al., 2012b) 68
69

6
Target analytes and analytical characteristics
Table SI-2 – Nomenclature and analytical characteristics of the internal standards
Abbreviation Full name Used as
Quantifier
ion (m/z)
Qualifier ion
(m/z) Category Instrumental analysis
BDE 77 3,3 ,4,4 -Tetrabromodiphenyl ether IS 79 81 PBDE GC-ECNI-MS
BDE 128 2,2 ,3,3 ,4,4 -Hexabromodiphenyl ether IS 79 81 PBDE GC-ECNI-MS 13C-BDE 209 13C-labeled decabromodiphenyl ether IS 495 497 PBDE GC-ECNI-MS 13C-anti-DP 13C-syn-dechlorane plus IS 664 662 EHFR GC-ECNI-MS 13C-syn-DP 13C-anti-dechlorane plus IS 664 662 EHFR GC-ECNI-MS
13C-EH-TBB 2-ethylhexyl-D17-2,3,4,5-
tetrabromo[13C6]benzoate IS 363 365 EHFR GC-ECNI-MS
13C-BEH-TEBP Bis(2-ethylhexyl-D17)-
tetrabromo[13C6]phthalate IS 470 390 EHFR GC-ECNI-MS
13C-BTBPE 1,2-Bis(2,4,6-
tribromo[13C6]phenoxy)ethane IS 257 259 EHFR GC-ECNI-MS
TAP Triamyl phosphate IS 239 169 m-PFR1 GC-EI-MS
TPHP-d15 Triphenyl phosphate-D15 IS 341 339 m-PFR GC-EI-MS/LC-MS-MS
TDCPP-d15 Tris(1,3-dichloropropyl) phosphate-
D15 IS 394 396 m-PFR GC-EI-MS/LC-MS-MS
TBOEP-d6 tris-(butoxyethyl)-phosphate-D6 IS 303 202 m-PFR GC-EI-MS
TCEP-d12 Tris(2-chloroethyl) phosphate-D12 IS 341 339 -m-PFR GC-EI-MS
1: monomeric PFRs

7
Table SI-3 – Nomenclature and analytical characteristics of PBDEs and EHFRs
Abbreviation Full name Used as Quantifier
ion (m/z)
Qualifier ion
(m/z) Quantify against IS Category
Instrumental
analysis
BDE28 2,4,4'-Tribromodiphenyl ether Target 79 81 BDE 77 PBDE GC-ECNI-MS
BDE47 2,2',4,4'-Tetrabromodiphenyl ether Target 79 81 BDE 77 PBDE GC-ECNI-MS
BDE66 2,3',4,4'-Tetrabromodiphenyl ether Target 79 81 BDE 77 PBDE GC-ECNI-MS
BDE85 2,2′,3,4,4′-penta- bromodiphenyl
ether Target 79 81 BDE 77 PBDE GC-ECNI-MS
BDE100 2,2',4,4',6-Pentabromodiphenyl ether Target 79 81 BDE 77 PBDE GC-ECNI-MS
BDE153 2,2',4,4',5,5'-Hexabromodiphenyl
ether Target 79 81 BDE 128 PBDE GC-ECNI-MS
BDE154 2,2',4,4',5,6'-Hexabromodiphenyl
ether Target 79 81 BDE 128 PBDE GC-ECNI-MS
BDE183 2,2',3,4,4',5',6-Heptabromodiphenyl
ether Target 79 81 BDE 128 PBDE GC-ECNI-MS
BDE209 Decabromodiphenyl ether Target 487 485 13C-BDE 209 GC-ECNI-MS
EH-TBB 2-ethylhexyl-2,3,4,5-
tetrabromobenzoate Target 357 359 13C-EH-TBB EHFR GC-ECNI-MS
BTBPE 1,2-bis(2,4,6-
tribromophenoxy)ethane Target 251 249 13C-BTBPE EHFR GC-ECNI-MS
BEH-TEBP Bis(2-ethylhexyl)-3,4,5,6-
tetrabromo-phthalate Target 464 384 13C- BEH-TEBP EHFR GC-ECNI-MS
syn-DP syn-dechlorane plus isomer Target 654 652 13C-syn-DP EHFR GC-ECNI-MS
anti-DP anti-dechlorane plus isomer Target 654 652 13C-anti-DP EHFR GC-ECNI-MS
α-TBECH alpha isomer
tetrabromoethylcyclohexane Target 79 81 BDE 77 EHFR GC-ECNI-MS
β-TBECH beta isomer
tetrabromoethylcyclohexane Target 79 81 BDE 77 EHFR GC-ECNI-MS
DBDPE Decabromodiphenyl ethane Target 79 81 13C-BDE 209 EHFR GC-ECNI-MS

8
Table SI-4 – Nomenclature and analytical characteristics of monomeric PFRs
Abbreviation Full name Used as Quantifier
ion (m/z)
Qualifier ion
(m/z)
Quantify against
ISTD Category
Instrumental
analysis
TEHP Tris(2-ethylhexyl)phosphate Target 211 99 TAP m-PFR GC-EI-MS
TnPP Tri-n-propyl phosphate Target 99 183 TAP m-PFR GC-EI-MS
TnBP tri(n-butyl)phosphate Target 211 155 TAP m-PFR GC-EI-MS
EHDPHP 2-ethylhexyl-di-phenylphosphate Target 251 250 TAP m-PFR GC-EI-MS
TCEP Tris(2-chloroethyl)phosphate Target 249 251 TCEP-d12 m-PFR GC-EI-MS
TBOEP tris-(butoxyethyl)-phosphate Target 299 199 TBOEP-d6 m-PFR GC-EI-MS
TPHP triphenyl phosphate Target 326 325 TPHP-d15 m-PFR GC-EI-MS
TMPP* tri-4-methoxythphenyl phosphate Target 368 367 TPHP-d15 m-PFR GC-EI-MS
TDCIPP tris(1,3-dichloro-2-propyl)
phosphate Target 381 379 TDCPP-d15 m-PFR GC-EI-MS
TCPP** tris(chloropropyl)phosphate Target 277 279 TDCPP-d15 m-PFR GC-EI-MS
*in four isomers, ** in two isomers;

9
Table SI-5 - Nomenclature and analytical characteristics of monomeric PFRs and oligomeric PFRs
Abbreviation Full name Used as Quantifier ion
(m/z)
Qualifier ion 1
(m/z)
Qualifier ion 2
(m/z)
Quantify
against ISTD
Catego
ry
Instrumenta
l analysis
V6 tetrakis(2-chlorethyl)
dichloroisopentyldiphosphate Target 580.9->358.9 582.9 -> 234.9 584.9 -> 360.9 TDCPP-d15 o-PFR* LC-MS-MS
TDBPP Tris (2,3-dibromopropyl)
phosphate Target 698.6->99 696.6 -> 99.0 700.6 -> 99.0 TDCPP-d15 m-PFR LC-MS-MS
iDPP isodecyldiphenyl phosphate Target 251.0->77.1 391.2 -> 251.0 391.2 -> 77.1 TPHP-d15 o-PFR LC-MS-MS
RDP resorcinol bis(diphenyl
phosphate) Target 575.1->77 575.1 -> 152.0 575.1 -> 419.1 TPHP-d15 o-PFR LC-MS-MS
TXP trixylenyl phosphate Target 411.1 -> 105.0 411.1 -> 77.1 411.1 -> 179.0 TPHP-d15 m-PFR LC-MS-MS
BDP bisphenol A bis(diphenyl
phosphate) Target 693.2->367.1 694.1 -> 367.1 694.1 -> 368.1 TPHP-d15 o-PFR LC-MS-MS
TPHP-d15 Triphenyl phosphate-D15 IS 446.0->101.9 444.0->101.9 LC-MS-MS
TDCPP-d15 Tris(1,3-dichloropropyl)
phosphate-D15 IS 342.2->82.1 342.2->223.0 342.2->159.5 LC-MS-MS
*: o-PFR: oligomeric PFR

10
Instrumental methods 68
GC/ECNI-MS: Two µL of cleaned extract were injected on a DB-5 column (15 m×0.25 mm×0.10 µm) 69
using solvent vent injection. The injection temperature was set at 92 °C, hold 0.04 min, ramp 700 70
°C/min to 295 °C. Injection was performed under a pressure of 0.19 bar until 1.25 min and purge flow 71
to split vent of 50 mL/min after 1.25 min. The GC temperature program was 90 °C, hold 1.50 min, ramp 72
10 °C/min to 300 °C, hold 3 min, ramp 40 °C/min to 310 °C, hold 5 min. Helium was used as a carrier 73
gas with a flow rate of 1.0 mL/min. The mass spectrometer was employed in selected ion monitoring 74
(SIM) mode. Dwell times were set on 35 ms. The ion source, quadrupole and interface temperatures 75
were set at 250, 150 and 300 °C, respectively and the electron multiplier voltage was at 2200 V. Methane 76
was used as moderating gas. 77
GC/EI-MS: One µL of purified extract was injected on a HT-8 column (25 m×0.22 mm×0.25 µm) using 78
cold splitless injection. The injection temperature was set at 90 °C, hold 0.03 min, ramp 700 °C/min to 79
290 °C. Injection was performed using a pressure of 1 bar until 1.25 min and purge flow to split vent of 80
50 mL/min after 1.25 min. The GC temperature program was 90 °C, hold 1.25 min, ramp 10 °C/min to 81
240 °C, ramp 20 °C/min to 310 °C, hold 16 min. Helium was used as a carrier gas with a flow rate of 82
1.0 mL/min. The mass spectrometer was run in selected ion monitoring (SIM) mode. Dwell times 83
ranged between 20 and 30 ms in different acquisition windows. The ion source, quadrupole and 84
interface temperatures were set at 230, 150 and 300 °C, respectively and the electron multiplier voltage 85
was at 2200 V. 86
LC-MS/MS: For the instrumental analysis, an Agilent 1290 Infinity liquid chromatography (LC) system 87
(Agilent Technologies, Santa Clara, CA, USA) coupled to an Agilent 6460 Triple Quadrupole mass 88
spectrometer (MS) was employed, equipped with a Jetstream® electrospray ionization (ESI) ion source. 89
The LC parameters were optimised to provide both good chromatographic separation and minimal run 90
tine, in order to maximise sample throughput. A volume of 3 μL of extract was injected on a 91
Phenomenex (Torrance, CA, USA) Kinetex Biphenyl reversed phase column (2.1 x 50 mm, 1.7 μm), at 92
a column oven temperature of 55 °C. The mobile phases were A: ultrapure H2O and B: MeOH, both 93
containing 5 mM ammonium formate. Separation was achieved using a flow rate of 0.5 mL/min and a 94
gradient from 55 B to 94% B in 3.4 min, followed by 1 min hold before returning to the initial 95
conditions, making the total run time of 4.5 minutes. The column is re-equilibrated for the next run 96
during a 2.5 min post time. The source parameters were initially optimised for all main analytes 97
individually and subsequently a set of values for these parameters were selected to provide the best 98
response for all considered analytes. As such, the drying gas temperature was set at 350 °C, the gas 99
flow at 3 L/min, the nebulizer at 25 psi, sheath gas temperature 400 °C, sheath gas flow 12 L/min, 100
capillary voltage 2700 V and nozzle voltage 0 V. The MS was operated in dynamic multiple-reaction 101
monitoring (dMRM) mode, with 2-10 ion transitions for each analyte in their specific retention time 102

11
(RT) window (RT ± 0.5 min).The Agilent MassHunter Workstation Software version B.06.00 was used 103
for all aspects of data analysis. 104
105
Table SI-6 - Accuracy of PBDEs and PFRs in SRM 2585 (N=2) 106
PBDEs Mean
(ng/g) STDEV *
RSD% Ref value Accuracy %
BDE28 15.3 6.8 44.1 46.9 33
BDE47 446.5 26.9 6 497 90
BDE66 22.8 1.7 7.4 29.5 77
BDE85 117.5 10.6 9.1 145 81
BDE100 35.8 3.8 10.5 43.8 82
BDE153 137.5 42.9 31.2 119 116
BDE154 99 33.8 34.2 83.5 119
BDE183 52.5 27.1 51.6 43 122
BDE209 2420.4 362.9 15 2510 96
PFRs Mean
(ng/g) STDEV *
RSD% †Ref value Accuracy %
TEHP 252.7 11.4 4.5 NM**
NM
TnPP 17 6.3 36.8 NM NM
TnBP 266.3 21.6 8.1 197 135
EHDPHP 1049.2 57.3 5.5 NM NM
TCEP 962.6 48.6 5 899 107
TBOEP 50460.2 2444.3 4.8 45795 110
TPHP 963 52.9 5.5 1052 92
TMPP 53435.1 652 1.2 NM NM
TDCIPP 2221.8 69.8 3.1 1933 115
TCPP 1156 98.5 8.5 1063 109
V6 47 24 51.1 NM NM
TDBPP 18 7 38.9 NM NM
iDPP 122 15 12.3 NM NM
RDP nd nd nd NM NM
TXP 73 2 2.7 NM NM
BDP nd nd nd NM NM
*RSD= (Stdev/mean)*100, **NM=not measured, †taken from (Cequier et al., 2014) 107
108

12
Table SI 7 - Values of target analytes in field blanks (ng/g) and method limit of detection (mLOD) 109
PBDEs BL1 BL2 BL3 BL4 AVG STEDV mLOD*
(ng/g)
BDE28 1.3 1.0 1.3 N.D. 1.2 0.2 0.5
BDE47 1.0 1.0 1.3 N.D. 1.1 0.2 0.5
BDE66 N.D.** N.D. N.D. N.D. N.D. N.D. 0.6†
BDE85 N.D. N.D. N.D. N.D. N.D. N.D. 0.6
BDE100 N.D. N.D. N.D. N.D. N.D. N.D. 0.6
BDE153 N.D. N.D. N.D. N.D. N.D. N.D. 0.7
BDE154 N.D. N.D. N.D. N.D. N.D. N.D. 0.6
BDE183 N.D. N.D. N.D. N.D. N.D. N.D. 0.6
BDE209 N.D. N.D. 5.7 4.3 5.0 1.0 3.0
EHFRs BL1 BL2 BL3 BL4 AVG STEDV mLOD
EH-TBB N.D. N.D. N.D. N.D. N.D. N.D. 1.3
BTBPE N.D. N.D. N.D. N.D. N.D. N.D. 1.3
BEH-TEBP N.D. N.D. N.D. N.D. N.D. N.D. 1.3
syn-DP N.D. N.D. N.D. N.D. N.D. N.D. 1.6
anti-DP N.D. N.D. N.D. N.D. N.D. N.D. 1.6
αTBECH 0.3 0.7 0.3 0.7 0.5 0.2 0.7
βTBECH 0.3 0.3 0.3 0.3 0.3 0.0 0.6
DBDPE N.D. N.D. N.D. N.D. N.D. N.D. 13.3
PFRs BL1 BL2 BL3 BL4 AVG STEDV mLOD
TEHP 16.7 13.0 10.3 9.7 12.4 3.2 9.5
TnPP N.D. N.D. N.D. N.D. N.D. N.D. 26.7
TnBP 12.3 10.0 11.0 12.0 11.3 1.1 3.2
EHDPHP 4.7 N.D. N.D. N.D. 4.7 N.D. 2.3
TCEP N.D. N.D. N.D. N.D. N.D. N.D. 44.1
TBOEP 159.3 158.0 121.7 153.0 148.0 17.7 53.3
TPHP 4.3 N.D. N.D. N.D. 4.3 N.D. 2.7
ΣTMPP 3.3 N.D. N.D. N.D. 3.3 N.D. 5.4
TDCIPP 61.3 N.D. 71.7 N.D. 66.5 7.4 21.9
ΣTCPP 17.3 N.D. 15.0 N.D. 16.2 1.6 4.9
V6 1.0 0.7 0.7 0.6 0.8 0.2 0.5
TDBPP 0.9 0.7 0.6 0.6 0.7 0.2 0.5
iDPP 4.9 4.2 4.7 3.9 4.4 0.4 1.3
RDP 3.9 2.6 3.0 2.6 3.0 0.6 1.8
TXP 2.8 1.9 2.1 2.1 2.2 0.4 1.1
BDP 6.1 3.9 4.7 3.5 4.6 1.1 3.4
* mLOD= 3 x STDEV of field blank; 110 ** N.D. = not detected 111 † For non-detected analytes, mLOD was calculated as signal-to-noise ratio 3:1 112 113
114

13
Table SI-8 Descriptive statistics of PBDEs and EHFRs measured in the UK house dust samples (N=10). Concentrations and mLOD in ng/g.
PBDEs - UK
Houses
N=10 (ng/g)
Minimum 25%
Percentile Median
75%
Percentile Maximum
Geometric
mean Mean
Std.
Deviation
Std. Error
of Mean DF% mLOD
BDE28 0.9 1.1 2.1 7.7 10.6 2.5 3.9 3.9 1.2 100 0.5
BDE47 2.6 4.9 10.9 38.7 684 15.7 83.8 212.0 67.0 100 0.5
BDE66 <0.6 <0.6 <0.6 9.6 9.6 9.6 9.6 0.0 0.0 10 0.6
BDE85 <0.6 1.0 3.7 66.3 126 4.7 27.6 55.2 24.7 50 0.6
BDE100 <0.6 1.8 3.2 14.3 272 5.4 35.0 89.2 29.7 90 0.6
BDE153 1.6 3.3 8.2 15.6 448 9.3 52.0 139 44.0 100 0.7
BDE154 0.9 1.9 4.1 9.1 273 5.5 34.3 89.6 29.9 90 0.6
BDE183 3.8 4.6 5.8 14.3 133 10.3 25.7 47.6 18.0 70 0.6
Σ8PBDEs 19.4 25.3 49.9 175.6 1958.4 63 272 637 215
BDE209 265 1636 3351 13843 50601 3810 11081 17437 5514 100 3.0
Σ9PBDEs 304 1689 3451 14194 54518 3936 11625 18710 5943
EHFRs - UK
Houses
N=10 (ng/g)
Minimum 25%
Percentile Median
75%
Percentile Maximum
Geometric
mean Mean
Std.
Deviation
Std. Error
of Mean DF% mLOD
EH-TBB 2.5 3 5.0 20.5 32.0 6.7 10.7 11.2 3.7 90 1.3
BTBPE <1.3 <1.3 <1.3 100 100 36.3 48.7 45.2 26.1 30 1.3
BEH-TEBP 18.0 62.3 106 179 234 95 116 67.9 21.5 100 1.3
syn-DP 2.1 2.85 4.5 14.3 31.5 5.7 9.1 11.2 4.6 60 1.6
anti-DP 1.6 4.48 6.8 10.6 31.6 7.0 9.5 8.9 2.8 100 1.6
α-TBECH <0.7 0.7 1.2 5.4 5.6 2.2 3.1 2.3 0.9 60 0.7
β-TBECH <0.6 <0.6 0.6 1.7 1.7 1.4 1.4 0.4 0.2 30 0.6
DBDPE 531 849 1091 4594 39221 1902 5576 11924 3771 100 13.3
Σ8EHFRs 572 923 1245 4925 39659 2055 5774 12071 3831

14
Table SI-9 Descriptive statistics of PFRs measured in the UK house dust samples (N=10). Concentrations and mLOD in ng/g.
PFRs - UK
Houses N=10
(ng/g)
Minimum 25%
Percentile Median
75%
Percentile Maximum
Geometric
mean Mean
Std.
Deviation
Std.
Error of
Mean
DF% mLOD
TEHP 96.2 105 157 348 465 188 223 144 48 90 9.5
TnPP <26.7 <26.7 <26.7 <26.7 <26.7 <26.7 <26.7 <26.7 <26.7 0 26.7
TnBP 210 239 262 403 479 294 306 99 31 100 3.2
EHDPHP 292 1703 2375 3385 9172 2228 3010 2481 785 100 2.3
TCEP 138 590 873 1830 6265 991 1566 1793 567 100 44.1
TBOEP 225 2806 8070 24347 58745 6711 16080 19724 6237 100 53.3
TPHP 190 1129 1509 3724 9549 1716 2737 2915 922 100 2.7
TMPP 83 198 293 740 1052 340 459 359 114 100 5.4
TDCIPP 346 523 752 1229 3792 836 1081 1019 322 100 21.9
TCPP 18331 27054 64546 98080 1010000 64605 152691 303883 96096 100 4.9
Σ10m-PFRs 19911 34347 78837 134086 1099519 77909 178165 332419 105123
V6 1.3 11.8 16.6 50.8 756 23.5 96.8 232.0 73.4 100 0.5
TDBPP <0.5 <0.5 <0.5 <0.5 <0.5 <0.5 n.d. n.d. n.d. 0 0.5
iDPP 114 233.0 401 1053.0 1687 452 617 506 160 100 1.3
RDP <1.8 <1.8 1.9 3.1 3.1 1.5 1.9 1.2 0.5 50 1.8
TXP <1.1 6.6 26.5 73.6 537 84.0 162.0 51.3 100 1.1
BDP <3.4 25.8 66.8 167.0 485 47.7 116.0 144.0 45.6 100 3.4

15
Table SI-10 Descriptive statistics of PBDEs and EHFRs measured in the Norwegian house dust samples (N=10). Concentrations and mLOD in ng/g.
PBDEs –
Norway Houses
N=10 (ng/g)
Minimum 25%
Percentile Median
75%
Percentile Maximum
Geometric
mean Mean
Std.
Deviation
Std. Error
of Mean DF% mLOD
BDE28 <0.5 1.8 2.6 3.7 3.8 2.5 2.7 1.0 0.5 50 0.5
BDE47 <0.5 1.7 49.0 94.4 4.6 20.7 41.2 18.4 50 0.5
BDE66 <0.6 <0.6 1.3 1.3 1.3 1.3 1.3 0.0 0.0 10 0.6
BDE85 <0.6 <0.6 5.8 5.8 5.8 5.8 5.8 0.0 0.0 10 0.6
BDE100 <0.6 <0.6 23.3 23.3 23.3 23.3 23.3 0.0 0.0 10 0.6
BDE153 <0.7 <0.7 8.9 14.7 14.7 3.4 6.2 7.4 4.3 30 0.7
BDE154 <0.6 <0.6 9.6 9.6 9.6 2.6 5.2 6.3 4.5 20 0.6
BDE183 <0.6 <0.6 3.6 98.2 130 7.5 34.7 63.3 31.6 40 0.6
Σ8PBDEs 35.6 39.0 48.3 196 285.2 50.6 94.0 111.2 52.4
BDE209 26.7 97.3 161 536 3084 203 518 929 294 100 3.0
Σ9PBDEs 98 185 258 938 3654 304 706 1151 399
EHFRs –
Norway Houses
N=10 (ng/g)
Minimum 25%
Percentile Median
75%
Percentile Maximum
Geometric
mean Mean
Std.
Deviation
Std. Error
of Mean DF% mLOD
EH-TBB <1.3 3.8 5.4 8.7 9.2 3.7 5.1 3.4 1.5 50 1.3
BTBPE 299 299 299 299 299 299 299 0 0 10 1.3
BEH-TEBP 7.9 12.1 27.1 156 426.0 38.3 89.6 132.0 41.7 100 1.3
syn-DP <1.6 <1.6 2.6 3.4 3.4 2.2 2.4 1.1 0.6 30 1.6
anti-DP 1.6 1.8 3.1 4.7 5.1 2.9 3.2 1.5 0.7 40 1.6
α-TBECH <0.7 1.2 1.2 2.3 3.1 1.1 1.4 1.0 0.3 40 0.7
β-TBECH <0.6 <0.6 <0.6 <0.6 <mLOD 0.6 0.6 0.6 0.6 0 0.6
DBDPE 81.8 219 686 834 1802 484 689 536 190 80 13.3
Σ8EHFRs 389 538 1025 1308 2549 831 1090 675 235

16
Table SI-11 Descriptive statistics of PFRs measured in the Norwegian house dust samples (N=10). Concentrations and mLOD in ng/g.
PFRs - Norway
Houses N=10
(ng/g)
Minimum 25%
Percentile Median
75%
Percentile Maximum
Geometric
mean Mean
Std.
Deviation
Std. Error of
Mean DF% mLOD
TEHP 107 144 178 302 618 206 240 161 53.7 90 9.5
TnPP <26.7 <26.7 <26.7 <26.7 <26.7 <26.7 <26.7 <26.7 <26.7 0 26.7
TnBP 229 281 485 649 3123 512 713 859 272 100 3.2
EHDPHP 37.1 108 195 818 4011 285 743 1229 389 100 2.3
TCEP 56.7 81 120 370 498 158 210 162 51.1 100 44.1
TBOEP 1343 2912 18364 30999 48006 10232 19145 17269 5461 100 53.3
TPHP 202 240 830 1273 2922 656 931 826 261 100 2.7
TMPP 110 131 194 321 3176 252 503 943 298 100 5.4
TDCIPP 81 159 344 554 2306 319 511 654 207 100 21.9
TCPP 997 1323 1959 5431 33891 2800 5832 10122 3201 100 4.9
Σ10m-PFRs 3163 5379 22669 40717 98551 15420 28828 32230 10195
V6 1.2 2.2 4.1 5.3 8.8 3.5 4.1 2.4 0.9 80 0.5
TDBPP <0.5 <0.5 <0.5 0.7 0.7 0.6 0.6 0.1 0.1 20 0.5
iDPP 6.3 28.7 51.3 119 262 51.4 80.5 76.7 24.3 100 1.3
RDP <1.8 <1.8 <1.8 <1.8 <1.8 <1.8 n.d. n.d. n.d. 0 1.8
TXP 2.7 5.7 9.1 81.8 105.0 13.7 32.3 41.6 13.2 100 1.1
BDP <3.4 56.5 35.4 1240 697 27.4 118 236 83.5 80 3.4
17
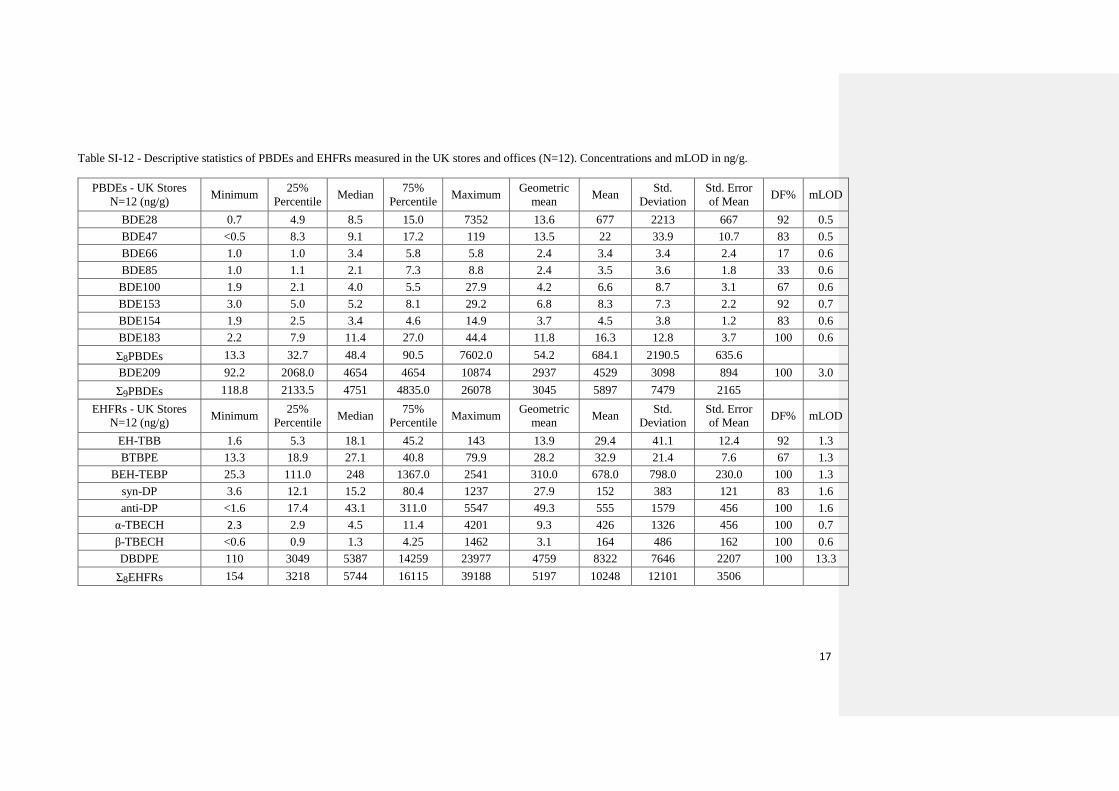
Table SI-12 - Descriptive statistics of PBDEs and EHFRs measured in the UK stores and offices (N=12). Concentrations and mLOD in ng/g.
PBDEs - UK Stores
N=12 (ng/g) Minimum
25%
Percentile Median
75%
Percentile Maximum
Geometric
mean Mean
Std.
Deviation
Std. Error
of Mean DF% mLOD
BDE28 0.7 4.9 8.5 15.0 7352 13.6 677 2213 667 92 0.5
BDE47 <0.5 8.3 9.1 17.2 119 13.5 22 33.9 10.7 83 0.5
BDE66 1.0 1.0 3.4 5.8 5.8 2.4 3.4 3.4 2.4 17 0.6
BDE85 1.0 1.1 2.1 7.3 8.8 2.4 3.5 3.6 1.8 33 0.6
BDE100 1.9 2.1 4.0 5.5 27.9 4.2 6.6 8.7 3.1 67 0.6
BDE153 3.0 5.0 5.2 8.1 29.2 6.8 8.3 7.3 2.2 92 0.7
BDE154 1.9 2.5 3.4 4.6 14.9 3.7 4.5 3.8 1.2 83 0.6
BDE183 2.2 7.9 11.4 27.0 44.4 11.8 16.3 12.8 3.7 100 0.6
Σ8PBDEs 13.3 32.7 48.4 90.5 7602.0 54.2 684.1 2190.5 635.6
BDE209 92.2 2068.0 4654 4654 10874 2937 4529 3098 894 100 3.0
Σ9PBDEs 118.8 2133.5 4751 4835.0 26078 3045 5897 7479 2165
EHFRs - UK Stores
N=12 (ng/g) Minimum
25%
Percentile Median
75%
Percentile Maximum
Geometric
mean Mean
Std.
Deviation
Std. Error
of Mean DF% mLOD
EH-TBB 1.6 5.3 18.1 45.2 143 13.9 29.4 41.1 12.4 92 1.3
BTBPE 13.3 18.9 27.1 40.8 79.9 28.2 32.9 21.4 7.6 67 1.3
BEH-TEBP 25.3 111.0 248 1367.0 2541 310.0 678.0 798.0 230.0 100 1.3
syn-DP 3.6 12.1 15.2 80.4 1237 27.9 152 383 121 83 1.6
anti-DP <1.6 17.4 43.1 311.0 5547 49.3 555 1579 456 100 1.6
α-TBECH 2.3 2.9 4.5 11.4 4201 9.3 426 1326 456 100 0.7
β-TBECH <0.6 0.9 1.3 4.25 1462 3.1 164 486 162 100 0.6
DBDPE 110 3049 5387 14259 23977 4759 8322 7646 2207 100 13.3
Σ8EHFRs 154 3218 5744 16115 39188 5197 10248 12101 3506

18
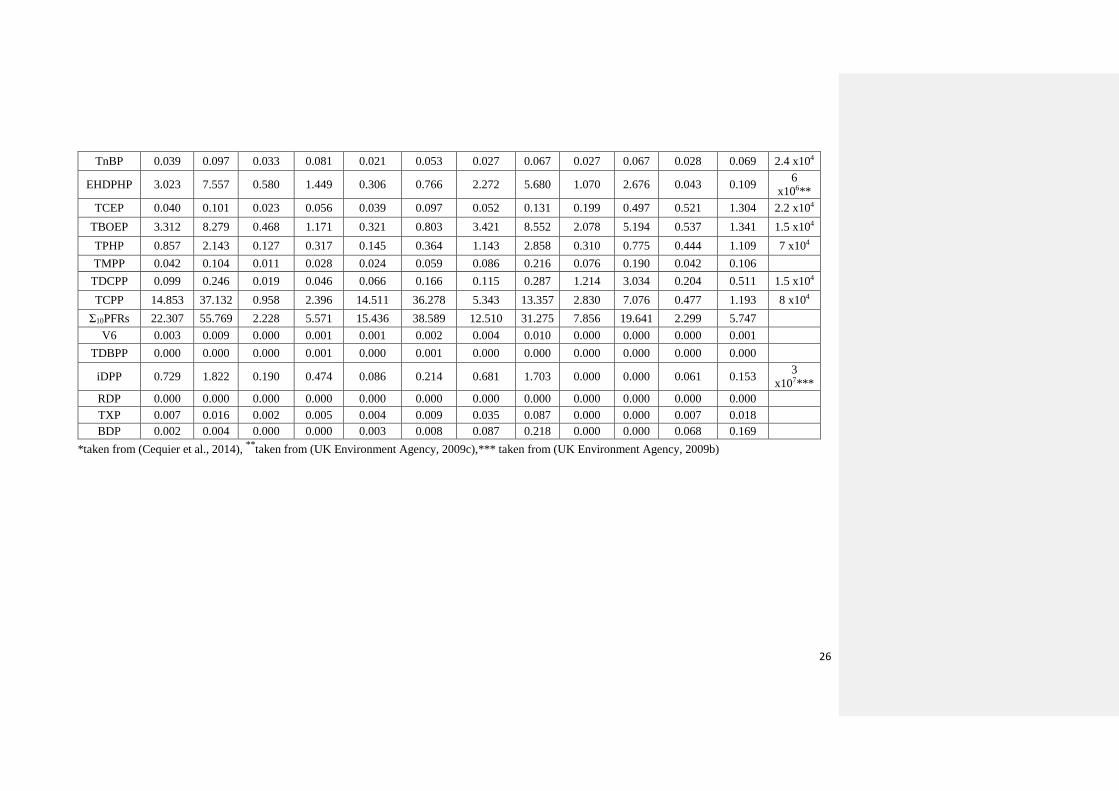
Table SI-13 - Descriptive statistics of PFRs measured in the UK stores and offices (N=12). Concentrations and mLOD in ng/g.
PFRs - UK Stores
N=12 (ng/g) Minimum
25%
Percentile Median
75%
Percentile Maximum
Geometric
mean Mean
Std.
Deviation
Std. Error
of Mean DF% mLOD
TEHP 97.7 389 529 1008 2259 548 743 640 213 75 9.5
TnPP <26.7 <26.7 <26.7 <26.7 <26.7 <26.7 <26.7 <26.7 <26.7 0 26.7
TnBP 223 235 281 329 488 288 297 80.1 23.1 100 3.2
EHDPHP 457 7374 19648 29767 127686 13554 26020 33613 9703 100 2.3
TCEP 237 456 897 2489 7185 1103 1895 2220 641 100 44.1
TBOEP 3371 8531 32700 82439 1.8E+06 40294 305634 647120 186808 100 53.3
TPHP 1331 3581 5752 11251 38094 5885 8834 9917 2863 100 2.7
TMPP 118 439 850 1068 1163 638 758 359 104 100 5.4
TDCIPP 195 877 1274 9827 12774 1790 3974 5243 1514 100 21.9
TCPP 5012 10174 25751 51148 155955 25867 44714 53044 15312 100 4.9
Σ10m-PFRs 11042 32068 87682 189341 2165604 89967 392883 752240 217182
V6 2.1 6.3 40.4 158 511 36.5 132 192 57.8 100 0.5
TDBPP 2.6 2.6 3.0 15.1 15.1 4.9 6.9 7.1 4.1 100 0.5
iDPP 644 1990 5898 7653 145455 5083 18018 42467 12804 100 1.3
RDP 2.0 2 6.1 53.5 53.5 8.7 20.5 28.6 16.5 100 1.8
TXP 20.8 69.2 244 1406 5820 240 935 1733 523 100 1.1
BDP 16.5 56.5 483 1240 5932 322 1083 1785 564 100 3.4

19
Human exposure assessment 115
All the exposure scenario equations and parameters used for adults and toddlers daily estimated intake 116
to FRs were based on SI Eq.1 (USEPA, 1997) and table SI 14 (Brandsma et al., 2013). In our study, 117
both average (20 mg/24 h for adult and 50 mg/24 h for toddler) and high (50 mg/24 h for adult and 200 118
mg/24 h toddler) dust intake situations were calculated. The exposure of home-based adults and toddlers 119
were assessed with 24 h exposure duration, while intakes for adult workers in offices and stores were 120
estimated with 8 h exposure duration. Body weight of 70 kg and 12.3 kg were used for adults and 121
toddlers, respectively. 122
Equation used for calculating daily exposure to FRs via dust ingestion (SI Eq. 1) 123
𝐷𝑎𝑖𝑙𝑦 𝐸𝑥𝑝𝑜𝑠𝑢𝑟𝑒 (ng/kg bw
day) =
𝐶𝑜𝑛𝑐𝑒𝑛𝑡𝑟𝑎𝑡𝑖𝑜𝑛 𝑥 𝐷𝑢𝑠𝑡 𝑖𝑛𝑔𝑒𝑠𝑡𝑖𝑜𝑛 𝑟𝑎𝑡𝑒 𝑥 𝐸𝑥𝑝𝑜𝑠𝑢𝑟𝑒 𝑑𝑢𝑟𝑎𝑡𝑖𝑜𝑛
𝐵𝑜𝑑𝑦 𝑤𝑒𝑖𝑔ℎ𝑡 124
Table SI-14 – Parameters used for calculating daily exposure to FRs via dust ingestion 125
126
127
128
129
Table SI-15 - Daily exposure of FRs for adults (workers) in UK stores and offices (n=12) with average 130
and high dust ingestion rate 131
Adults ng/kg bw/day -
Average ingestion rate -UK
Workers t=8h
Adults ng/kg bw/day - High
ingestion rate – UK Workers
t=8h - Worst case scenario
UK Stores UK Stores
FR Median Maximum Median Maximum
RfD
(ng/kg bw
day)*
BDE28 0.001 0.700 0.002 1.750
BDE47 0.001 0.011 0.002 0.028 1 x10²
BDE66 0.000 0.001 0.001 0.001
BDE85 0.000 0.001 0.001 0.002
BDE100 0.000 0.003 0.001 0.007
BDE153 0.000 0.003 0.001 0.007 2 x10²
BDE154 0.000 0.001 0.001 0.004
BDE183 0.001 0.004 0.003 0.011
Σ8PBDEs 0.005 0.724 0.012 1.810
BDE209 0.443 1.036 1.108 2.589 7 x10³
Σ9PBDEs 0.452 2.484 1.131 6.209
EH-TBB 0.002 0.014 0.004 0.034
BTBPE 0.003 0.008 0.006 0.019
Dust ingestion rate (g/day) Body Weight
(kg) Average High
Adults 0.02 0.05 70
Toddlers 0.05 0.2 12.3

20
BEH-TEBP 0.024 0.242 0.059 0.605
syn-DP 0.001 0.118 0.004 0.295
anti-DP 0.004 0.528 0.010 1.321
α-TBECH 0.000 0.400 0.001 1.000
β-TBECH 0.000 0.139 0.000 0.348
DBDPE 0.513 2.284 1.283 5.709
ΣEHFRs 0.547 3.732 1.368 9.330
TEHP 0.050 0.215 0.126 0.538
TNBP 0.027 0.046 0.067 0.116 2.4 x10⁴
EHDPHP 1.871 12.161 4.678 30.401 6 x10⁶**
TCEP 0.085 0.684 0.214 1.711 2.2 x10⁴
TBOEP 3.114 173.333 7.786 433.333 1.5 x10⁴
TPHP 0.548 3.628 1.370 9.070 7 x10⁴
TMPP 0.081 0.111 0.202 0.277
TDCIPP 0.121 1.217 0.303 3.041 1.5 x10⁴
TCPP 2.452 14.853 6.131 37.132 8 x10⁴
Σ10m-PFRs 8.351 206.248 20.877 515.620
V6 0.004 0.049 0.010 0.122
TDBPP 0.000 0.001 0.001 0.004
iDPP 0.562 13.853 1.404 34.632 3 x10⁷***
RDP 0.001 0.005 0.001 0.013
TXP 0.023 0.554 0.058 1.386
BDP 0.046 0.565 0.115 1.412
*taken from (Cequier et al., 2014),
**taken from (UK Environment Agency, 2009c),*** taken from 132
(UK Environment Agency, 2009b) 133
134

21
Table SI-16 – Daily exposure of FRs from dust for adults (non-workers) from UK and Norway houses with average and high dust ingestion rates
Adults ng/kg bw/day - Average ingestion rate - Non-workers
t=24h
Adults ng/kg bw/day - High ingestion rate -Non-
workers - t=24h - Worst case scenario
UK houses Norwegian houses UK houses Norwegian houses
FR Median Maximum Median Maximum Median Maximum Median Maximum RfD (ng/kg
bw day)
BDE28 0.001 0.003 0.001 0.001 0.002 0.008 0.002 0.004
BDE47 0.003 0.196 0.001 0.027 0.009 0.489 0.002 0.068 1 x10²
BDE66 0.003 0.003 0.000 0.000 0.007 0.007 0.001 0.001
BDE85 0.001 0.036 0.002 0.002 0.003 0.090 0.004 0.004
BDE100 0.001 0.078 0.007 0.007 0.002 0.194 0.017 0.017
BDE153 0.002 0.128 0.001 0.004 0.006 0.320 0.002 0.011 2 x10²
BDE154 0.001 0.078 0.001 0.003 0.003 0.195 0.004 0.007
BDE183 0.002 0.038 0.001 0.037 0.004 0.095 0.003 0.093
Σ8PBDEs 0.014 0.560 0.014 0.081 0.036 1.399 0.035 0.204
BDE209 0.957 14.457 0.046 0.881 2.394 36.144 0.115 2.203 7 x10³
Σ9PBDEs 0.986 15.577 0.074 1.044 2.465 38.941 0.184 2.610
EH-TBB 0.001 0.009 0.002 0.003 0.004 0.023 0.004 0.007
BTBPE 0.008 0.029 0.085 0.085 0.021 0.071 0.214 0.214
BEH-
TEBP 0.030 0.067 0.008 0.122 0.076 0.167 0.019 0.304
syn-DP 0.001 0.009 0.001 0.001 0.003 0.023 0.002 0.002
anti-DP 0.002 0.009 0.001 0.001 0.005 0.023 0.002 0.004
α-TBECH 0.000 0.002 0.000 0.001 0.001 0.004 0.001 0.002
β-TBECH 0.000 0.001 0.000 0.000 0.000 0.002 0.000 0.001
DBDPE 0.312 11.206 0.196 0.515 0.779 28.015 0.490 1.287
ΣEHFRs 0.356 11.331 0.293 0.728 0.889 28.328 0.732 1.821
TEHP 0.045 0.133 0.051 0.177 0.112 0.332 0.127 0.441

22
TnBP 0.075 0.137 0.139 0.892 0.187 0.342 0.346 2.231 2.4 x10⁴
EHDPHP 0.679 2.621 0.056 1.146 1.696 6.551 0.139 2.865 6 x10⁶**
TCEP 0.249 1.790 0.034 0.142 0.624 4.475 0.086 0.356 2.2 x10⁴
TBOEP 2.306 16.784 5.247 13.716 5.764 41.961 13.117 34.290 1.5 x10⁴
TPHP 0.431 2.728 0.237 0.835 1.078 6.821 0.593 2.087 7 x10⁴
TMPP 0.084 0.301 0.055 0.907 0.209 0.751 0.139 2.269
TDCIPP 0.215 1.083 0.098 0.659 0.537 2.709 0.246 1.647 1.5 x10⁴
TCPP 18.442 288.571 0.560 9.683 46.104 721.429 1.399 24.208 8 x10⁴
Σ10PFRs 22.525 314.148 6.477 28.157 56.312 785.371 16.192 70.394
V6 0.005 0.216 0.001 0.003 0.012 0.540 0.003 0.006
TDBPP 0.000 0.000 0.000 0.000 0.000 0.000 0.000 0.001
iDPP 0.115 0.482 0.015 0.075 0.286 1.205 0.037 0.187 3 x10⁷***
RDP 0.001 0.001 0.001 0.001 0.001 0.002 0.001 0.001
TXP 0.008 0.153 0.003 0.030 0.019 0.384 0.007 0.075
BDP 0.019 0.139 0.010 0.199 0.048 0.346 0.025 0.498
*taken from (Cequier et al., 2014), **
taken from (UK Environment Agency, 2009c),*** taken from (UK Environment Agency, 2009b)

23
Table SI-17 - Daily exposure of FRs from dust for toddlers from UK and Norway houses with average and high dust ingestion rate
Toddlers ng/kg bw/day - Average ingestion rate t=24h Toddlers ng/kg bw/day - High ingestion rate -
t=24h - Worst case scenario
UK houses Norwegian houses UK houses Norwegian houses
FR Median Maximum Median Maximum Median Maximum Median Maximum RfD (ng/kg bw
day)*
BDE28 0.013 0.048 0.014 0.020 0.053 0.192 0.055 0.081
BDE47 0.049 2.785 0.011 0.388 0.195 11.138 0.045 1.553 1 x10²
BDE66 0.039 0.039 0.005 0.005 0.156 0.156 0.021 0.021
BDE85 0.015 0.512 0.024 0.024 0.060 2.049 0.094 0.094
BDE100 0.013 1.106 0.095 0.095 0.052 4.423 0.379 0.379
BDE153 0.033 1.821 0.012 0.060 0.133 7.285 0.049 0.239 2 x10²
BDE154 0.017 1.110 0.021 0.039 0.067 4.439 0.084 0.156
BDE183 0.024 0.541 0.015 0.528 0.094 2.163 0.059 2.114
Σ8PBDEs 0.203 7.961 0.196 1.159 0.811 31.844 0.785 4.637
BDE209 13.622 205.695 0.654 12.537 54.488 822.780 2.618 50.146 7 x10³
Σ9PBDEs 14.027 221.617 1.047 14.855 56.109 886.468 4.189 59.421
EH-TBB 0.020 0.130 0.022 0.037 0.081 0.520 0.088 0.150
BTBPE 0.121 0.407 1.215 1.215 0.483 1.626 4.862 4.862
BEH-TEBP 0.431 0.951 0.110 1.732 1.724 3.805 0.441 6.927
syn-DP 0.018 0.128 0.011 0.014 0.073 0.512 0.042 0.055
anti-DP 0.027 0.128 0.012 0.021 0.110 0.514 0.050 0.083
α-TBECH 0.005 0.025 0.005 0.013 0.021 0.101 0.020 0.050
β-TBECH 0.002 0.009 0.002 0.004 0.010 0.037 0.010 0.015
DBDPE 4.435 159.435 2.789 7.325 17.740 637.740 11.154 29.301
ΣEHFRs 5.060 161.214 4.166 10.361 20.241 644.855 16.666 41.442
TEHP 0.638 1.890 0.724 2.512 2.553 7.561 2.894 10.049

24
TNBP 1.065 1.947 1.972 12.695 4.260 7.789 7.886 50.780 2.4 x10⁴
EHDPHP 9.654 37.285 0.793 16.305 38.618 149.138 3.171 65.220 6 x10⁶**
TCEP 3.549 25.467 0.488 2.024 14.195 101.870 1.951 8.098 2.2 x10⁴
TBOEP 32.805 238.801 74.650 195.146 131.220 955.203 298.602 780.585 1.5 x10⁴
TPHP 6.134 38.817 3.374 11.878 24.537 155.268 13.496 47.512 7 x10⁴
TMPP 1.191 4.276 0.789 12.911 4.764 17.106 3.154 51.642
TDCIPP 3.057 15.415 1.398 9.374 12.228 61.659 5.593 37.496 1.5 x10⁴
TCPP 262.382 4105.691 7.963 137.768 1049.528 16422.764 31.854 551.073 8 x10⁴
Σ10m-PFRs 320.476 4469.589 92.150 400.614 1281.902 17878.358 368.602 1602.455
V6 0.067 3.073 0.016 0.036 0.270 12.293 0.066 0.143
TDBPP 0.002 0.002 0.002 0.003 0.008 0.008 0.010 0.011
iDPP 1.630 6.858 0.209 1.065 6.520 27.431 0.834 4.260 3 x10⁷***
RDP 0.008 0.013 0.007 0.007 0.031 0.050 0.029 0.029
TXP 0.108 2.183 0.037 0.427 0.431 8.732 0.148 1.707
BDP 0.272 1.972 0.144 2.833 1.086 7.886 0.576 11.333
*taken from (Cequier et al., 2014), **
taken from (UK Environment Agency, 2009c),*** taken from (UK Environment Agency, 2009b)

25
Table SI 18 – Daily exposure of FRs for adult workers (t=8h) in UK offices (n=6) with average and high dust ingestion rate
S1 S2 S6 S7 S9 S10
FR Average High Average High Average High Average High Average High Average High
RfD
(ng/kg
bw
day)*
BDE28 0.000 0.001 0.000 0.000 0.003 0.008 0.001 0.002 0.700 1.750 0.000 0.000
BDE47 0.002 0.004 0.000 0.000 0.001 0.002 0.001 0.002 0.001 0.002 0.000 0.000 1 x10²
BDE66 0.000 0.000 0.000 0.000 0.000 0.000 0.000 0.000 0.000 0.000 0.000 0.000
BDE85 0.000 0.001 0.000 0.000 0.000 0.000 0.000 0.000 0.000 0.000 0.000 0.000
BDE100 0.000 0.001 0.000 0.000 0.000 0.000 0.000 0.000 0.000 0.000 0.000 0.000
BDE153 0.001 0.002 0.000 0.001 0.001 0.003 0.000 0.001 0.001 0.002 0.000 0.000 2 x10²
BDE154 0.000 0.001 0.000 0.000 0.000 0.001 0.000 0.001 0.001 0.001 0.000 0.000
BDE183 0.000 0.001 0.001 0.002 0.004 0.011 0.001 0.003 0.003 0.007 0.000 0.001
Σ8PBDEs 0.004 0.010 0.001 0.003 0.010 0.025 0.004 0.010 0.705 1.763 0.000 0.001
BDE209 0.482 1.206 0.076 0.190 0.186 0.465 0.608 1.519 0.545 1.363 0.009 0.022 7 x10³
Σ9PBDEs 0.487 1.217 0.077 0.193 0.196 0.490 0.612 1.529 1.250 3.125 0.009 0.023
EH-TBB 0.002 0.004 0.000 0.000 0.000 0.001 0.002 0.004 0.004 0.011 0.000 0.000
BTBPE 0.000 0.000 0.000 0.000 0.001 0.003 0.003 0.008 0.004 0.010 0.000 0.000
BEH-
TEBP 0.059 0.147 0.002 0.006 0.008 0.020 0.083 0.208 0.242 0.605 0.005 0.012
syn-DP 0.000 0.001 0.000 0.000 0.118 0.295 0.006 0.015 0.013 0.031 0.000 0.000
anti-DP 0.001 0.003 0.000 0.000 0.528 1.321 0.042 0.105 0.037 0.093 0.000 0.000
aTBECH 0.000 0.001 0.000 0.000 0.002 0.005 0.000 0.001 0.400 1.000 0.000 0.000
bTBECH 0.000 0.000 0.000 0.000 0.001 0.001 0.000 0.000 0.139 0.348 0.000 0.000
DBDPE 0.297 0.741 0.700 1.749 0.439 1.098 0.587 1.467 1.922 4.805 0.010 0.026
ΣEHFRs 0.359 0.898 0.703 1.756 1.098 2.744 0.724 1.809 2.762 6.904 0.016 0.040
TEHP 0.043 0.107 0.009 0.023 0.000 0.001 0.050 0.126 0.051 0.128 0.000 0.001
26
TnBP 0.039 0.097 0.033 0.081 0.021 0.053 0.027 0.067 0.027 0.067 0.028 0.069 2.4 x10⁴
EHDPHP 3.023 7.557 0.580 1.449 0.306 0.766 2.272 5.680 1.070 2.676 0.043 0.109 6
x106**
TCEP 0.040 0.101 0.023 0.056 0.039 0.097 0.052 0.131 0.199 0.497 0.521 1.304 2.2 x10⁴
TBOEP 3.312 8.279 0.468 1.171 0.321 0.803 3.421 8.552 2.078 5.194 0.537 1.341 1.5 x10⁴
TPHP 0.857 2.143 0.127 0.317 0.145 0.364 1.143 2.858 0.310 0.775 0.444 1.109 7 x10⁴
TMPP 0.042 0.104 0.011 0.028 0.024 0.059 0.086 0.216 0.076 0.190 0.042 0.106
TDCPP 0.099 0.246 0.019 0.046 0.066 0.166 0.115 0.287 1.214 3.034 0.204 0.511 1.5 x10⁴
TCPP 14.853 37.132 0.958 2.396 14.511 36.278 5.343 13.357 2.830 7.076 0.477 1.193 8 x10⁴
Σ10PFRs 22.307 55.769 2.228 5.571 15.436 38.589 12.510 31.275 7.856 19.641 2.299 5.747
V6 0.003 0.009 0.000 0.001 0.001 0.002 0.004 0.010 0.000 0.000 0.000 0.001
TDBPP 0.000 0.000 0.000 0.001 0.000 0.001 0.000 0.000 0.000 0.000 0.000 0.000
iDPP 0.729 1.822 0.190 0.474 0.086 0.214 0.681 1.703 0.000 0.000 0.061 0.153 3
x107***
RDP 0.000 0.000 0.000 0.000 0.000 0.000 0.000 0.000 0.000 0.000 0.000 0.000
TXP 0.007 0.016 0.002 0.005 0.004 0.009 0.035 0.087 0.000 0.000 0.007 0.018
BDP 0.002 0.004 0.000 0.000 0.003 0.008 0.087 0.218 0.000 0.000 0.068 0.169
*taken from (Cequier et al., 2014), **
taken from (UK Environment Agency, 2009c),*** taken from (UK Environment Agency, 2009b)
27
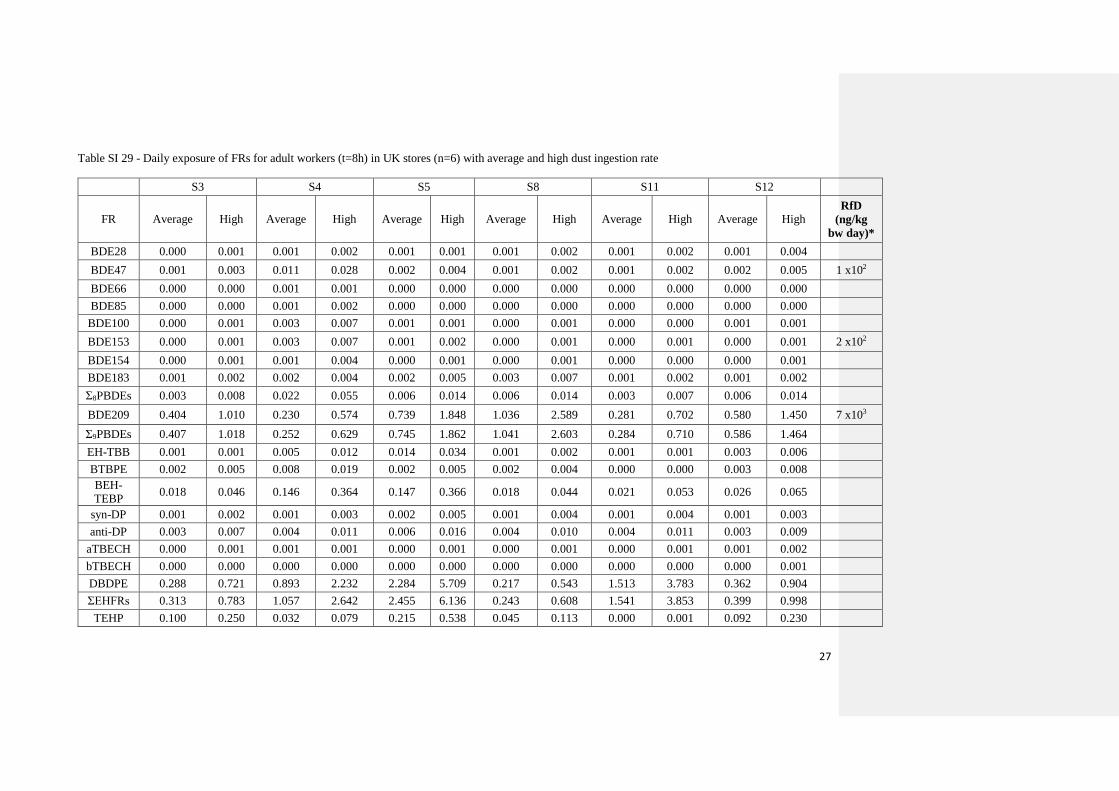
Table SI 29 - Daily exposure of FRs for adult workers (t=8h) in UK stores (n=6) with average and high dust ingestion rate
S3 S4 S5 S8 S11 S12
FR Average High Average High Average High Average High Average High Average High RfD
(ng/kg
bw day)*
BDE28 0.000 0.001 0.001 0.002 0.001 0.001 0.001 0.002 0.001 0.002 0.001 0.004
BDE47 0.001 0.003 0.011 0.028 0.002 0.004 0.001 0.002 0.001 0.002 0.002 0.005 1 x10²
BDE66 0.000 0.000 0.001 0.001 0.000 0.000 0.000 0.000 0.000 0.000 0.000 0.000
BDE85 0.000 0.000 0.001 0.002 0.000 0.000 0.000 0.000 0.000 0.000 0.000 0.000
BDE100 0.000 0.001 0.003 0.007 0.001 0.001 0.000 0.001 0.000 0.000 0.001 0.001
BDE153 0.000 0.001 0.003 0.007 0.001 0.002 0.000 0.001 0.000 0.001 0.000 0.001 2 x10²
BDE154 0.000 0.001 0.001 0.004 0.000 0.001 0.000 0.001 0.000 0.000 0.000 0.001
BDE183 0.001 0.002 0.002 0.004 0.002 0.005 0.003 0.007 0.001 0.002 0.001 0.002
Σ8PBDEs 0.003 0.008 0.022 0.055 0.006 0.014 0.006 0.014 0.003 0.007 0.006 0.014
BDE209 0.404 1.010 0.230 0.574 0.739 1.848 1.036 2.589 0.281 0.702 0.580 1.450 7 x10³
Σ9PBDEs 0.407 1.018 0.252 0.629 0.745 1.862 1.041 2.603 0.284 0.710 0.586 1.464
EH-TBB 0.001 0.001 0.005 0.012 0.014 0.034 0.001 0.002 0.001 0.001 0.003 0.006
BTBPE 0.002 0.005 0.008 0.019 0.002 0.005 0.002 0.004 0.000 0.000 0.003 0.008
BEH-
TEBP 0.018 0.046 0.146 0.364 0.147 0.366 0.018 0.044 0.021 0.053 0.026 0.065
syn-DP 0.001 0.002 0.001 0.003 0.002 0.005 0.001 0.004 0.001 0.004 0.001 0.003
anti-DP 0.003 0.007 0.004 0.011 0.006 0.016 0.004 0.010 0.004 0.011 0.003 0.009
aTBECH 0.000 0.001 0.001 0.001 0.000 0.001 0.000 0.001 0.000 0.001 0.001 0.002
bTBECH 0.000 0.000 0.000 0.000 0.000 0.000 0.000 0.000 0.000 0.000 0.000 0.001
DBDPE 0.288 0.721 0.893 2.232 2.284 5.709 0.217 0.543 1.513 3.783 0.362 0.904
ΣEHFRs 0.313 0.783 1.057 2.642 2.455 6.136 0.243 0.608 1.541 3.853 0.399 0.998
TEHP 0.100 0.250 0.032 0.079 0.215 0.538 0.045 0.113 0.000 0.001 0.092 0.230

28
TnBP 0.021 0.053 0.025 0.061 0.023 0.058 0.022 0.055 0.028 0.070 0.046 0.116 2.4 x10⁴
EHDPHP 1.380 3.451 1.751 4.377 2.123 5.309 3.036 7.589 1.992 4.979 12.161 30.401 6 x10⁶**
TCEP 0.099 0.249 0.250 0.624 0.124 0.310 0.071 0.178 0.063 0.157 0.684 1.711 2.2 x10⁴
TBOEP 147.190 367.976 1.640 4.101 2.917 7.292 8.804 22.011 4.993 12.482 173.616 434.040 1.5 x10⁴
TPHP 0.446 1.115 0.650 1.624 0.435 1.087 1.215 3.038 0.697 1.743 3.628 9.070 7 x10⁴
TMPP 0.086 0.214 0.109 0.273 0.102 0.254 0.075 0.188 0.102 0.254 0.111 0.277
TDCPP 1.180 2.949 0.132 0.329 0.088 0.220 0.128 0.319 0.082 0.205 1.217 3.041 1.5 x10⁴
TCPP 2.277 5.694 2.627 6.569 1.001 2.502 1.926 4.814 0.841 2.102 3.457 8.642 8 x10⁴
Σ10PFRs 152.781 381.953 7.216 18.041 7.029 17.573 15.324 38.311 8.798 21.994 195.013 487.532
V6 0.006 0.016 0.049 0.122 0.048 0.120 0.015 0.038 0.001 0.003 0.011 0.027
TDBPP 0.000 0.000 0.001 0.004 0.000 0.000 0.000 0.000 0.000 0.000 0.000 0.000
iDPP 0.650 1.625 0.279 0.698 0.562 1.404 1.448 3.620 0.338 0.845 13.853 34.632 3 x10⁷***
RDP 0.000 0.000 0.001 0.001 0.000 0.000 0.000 0.000 0.000 0.000 0.005 0.013
TXP 0.023 0.058 0.554 1.386 0.026 0.064 0.009 0.023 0.179 0.447 0.134 0.335
BDP 0.150 0.376 0.107 0.268 0.019 0.047 0.024 0.061 0.006 0.015 0.565 1.412
*taken from (Cequier et al., 2014), **
taken from (UK Environment Agency, 2009c),*** taken from (UK Environment Agency, 2009b)

29
References for SI 1
Brandsma, S.H., Sellström, U., de Wit, C.A., de Boer, J., Leonards, P.E.G., 2013. Dust Measurement 2 of Two Organophosphorus Flame Retardants, Resorcinol Bis(diphenylphosphate) (RBDPP) 3 and Bisphenol A Bis(diphenylphosphate) (BPA-BDPP), Used as Alternatives for BDE-209. 4 Environ. Sci. Technol. 47, 14434–14441. doi:10.1021/es404123q 5
Cequier, E., Ionas, A.C., Covaci, A., Marcé, R.M., Becher, G., Thomsen, C., 2014. Occurrence of a 6 Broad Range of Legacy and Emerging Flame Retardants in Indoor Environments in Norway. 7 Environ. Sci. Technol. 48, 6827–6835. doi:10.1021/es500516u 8
UK Environment Agency, 2009a. Environmental risk evaluation report: 2-Ethylhexyl diphenyl 9 phosphate (EHDPHP) (CAS no. 1241-94-7) [WWW Document]. URL 10 https://www.gov.uk/government/uploads/system/uploads/attachment_data/file/290842/scho0811 09bqty-e-e.pdf 12
UK Environment Agency, 2009b. Environmental risk evaluation report: Isodecyl diphenyl phosphate 13 (iDPP) CAS no. 29761-21-5 [WWW Document]. URL 14 https://www.gov.uk/government/uploads/system/uploads/attachment_data/file/290853/scho0815 09bquf-e-e.pdf 16
USEPA, 1997. EXPOSURE FACTORS HANDBOOK (1997 FINAL REPORT) [WWW Document]. 17 URL 18 http://cfpub.epa.gov/si/si_public_record_Report.cfm?dirEntryId=12464&CFID=186151631&19 CFTOKEN=30802087&jsessionid=8630fc2d1ae6e420aa633119683742257731 (accessed 20 29.11.2016). 21
Van den Eede, N., Dirtu, A.C., Ali, N., Neels, H., Covaci, A., 2012. Multi-residue method for the 22 determination of brominated and organophosphate flame retardants in indoor dust. Talanta 89, 23 292–300. doi:10.1016/j.talanta.2011.12.031 24
25