legislative budget and finance committee -...
TRANSCRIPT

SENATORS
VACANT Chairman VACANT Vice Chairman JAMES R. BREWSTER ROBERT B. MENSCH DOMINIC PILEGGI CHRISTINE TARTAGLIONE JOHN N. WOZNIAK REPRESENTATIVES
ROBERT W. GODSHALL Secretary VACANT Treasurer STEPHEN E. BARRAR JIM CHRISTIANA H. SCOTT CONKLIN PHYLLIS MUNDY EXECUTIVE DIRECTOR
PHILIP R. DURGIN
A Cost Effective Alternative Approach to Meeting Pennsylvania’s
Chesapeake Bay Nutrient Reduction Targets
Conducted Pursuant to Act 2012-87
January 2013
Legislative Budget and Finance Committee
A JOINT COMMITTEE OF THE PENNSYLVANIA GENERAL ASSEMBLY Offices: Room 400 Finance Building, 613 North Street, Harrisburg
Mailing Address: P.O. Box 8737, Harrisburg, PA 17105-8737 Tel: (717) 783-1600 • Fax: (717) 787-5487 • Web: http://lbfc.legis.state.pa.us

i
Table of Contents
Page
Report Summary ............................................................................... S-1
I. Introduction ....................................................................................... 1
II. Pennsylvania’s Chesapeake Bay Program ...................................... 3
III. Restructuring Pennsylvania’s Chesapeake Bay Program ............. 16
IV. Appendices ......................................................................................... 35 A. Information on Kreider Farms (BION) and Hillandale Farms
(EnergyWorks) ................................................................................ 36 B. Map of Chesapeake Bay Watershed in Pennsylvania .................... 39 C. Pennsylvania 2011 Milestones to Reduce Nitrogen & Phosphorus
Assessment June 2012 – Final Progress ........................................ 40 D. Estimated Costs to Achieve Nitrogen Reduction Targets From
Nonpoint Source Agriculture and Urban Stormwater Sources (Both Pervious and Impervious) Under a Competitive RFP Program and Using Best Management Practices (BMPs) .............. 42
E. Maryland’s Bay Restoration Fund ................................................... 43 F. Recent Examples of PENNVEST-funded Projects for Point
Source and Nonpoint Source Pollution Reduction to the Chesapeake Bay ............................................................................. 45
S-1
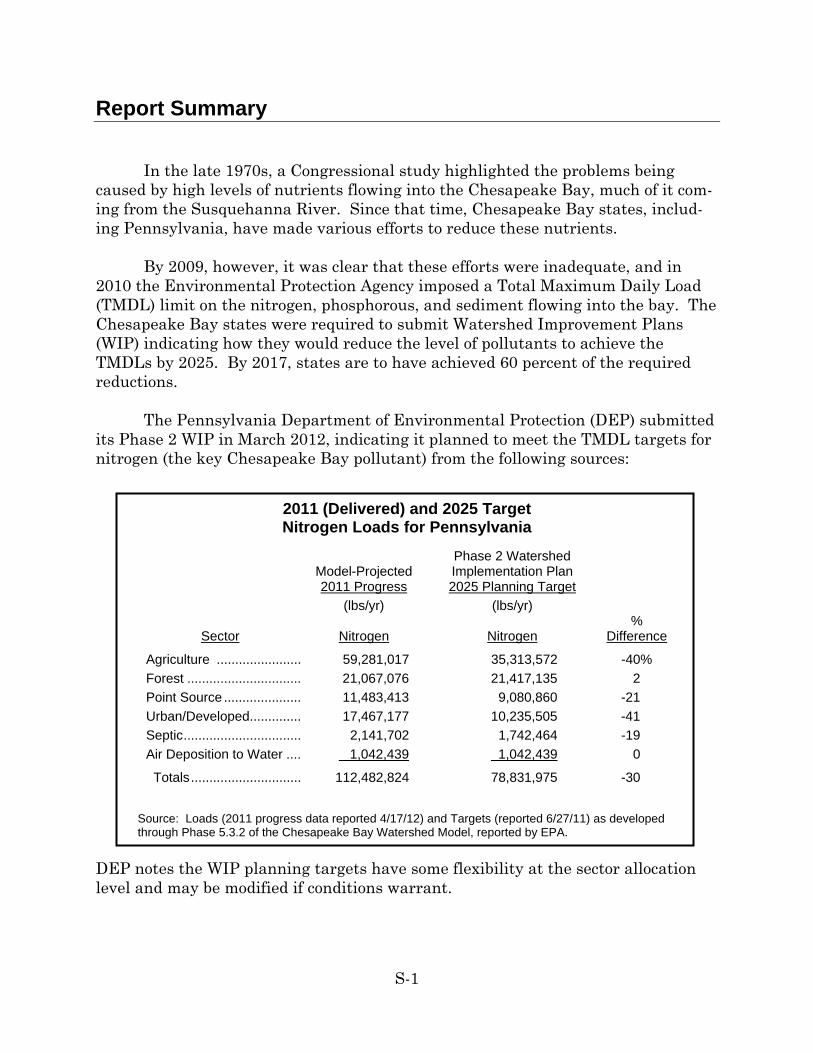
Report Summary In the late 1970s, a Congressional study highlighted the problems being caused by high levels of nutrients flowing into the Chesapeake Bay, much of it com-ing from the Susquehanna River. Since that time, Chesapeake Bay states, includ-ing Pennsylvania, have made various efforts to reduce these nutrients. By 2009, however, it was clear that these efforts were inadequate, and in 2010 the Environmental Protection Agency imposed a Total Maximum Daily Load (TMDL) limit on the nitrogen, phosphorous, and sediment flowing into the bay. The Chesapeake Bay states were required to submit Watershed Improvement Plans (WIP) indicating how they would reduce the level of pollutants to achieve the TMDLs by 2025. By 2017, states are to have achieved 60 percent of the required reductions. The Pennsylvania Department of Environmental Protection (DEP) submitted its Phase 2 WIP in March 2012, indicating it planned to meet the TMDL targets for nitrogen (the key Chesapeake Bay pollutant) from the following sources:
2011 (Delivered) and 2025 Target Nitrogen Loads for Pennsylvania
Model-Projected 2011 Progress
Phase 2 Watershed Implementation Plan 2025 Planning Target
(lbs/yr) (lbs/yr)
Sector Nitrogen Nitrogen %
Difference
Agriculture ....................... 59,281,017 35,313,572 -40% Forest ............................... 21,067,076 21,417,135 2 Point Source ..................... 11,483,413 9,080,860 -21 Urban/Developed .............. 17,467,177 10,235,505 -41 Septic ................................ 2,141,702 1,742,464 -19 Air Deposition to Water .... 1,042,439 1,042,439 0
Totals .............................. 112,482,824 78,831,975 -30
Source: Loads (2011 progress data reported 4/17/12) and Targets (reported 6/27/11) as developed through Phase 5.3.2 of the Chesapeake Bay Watershed Model, reported by EPA.
DEP notes the WIP planning targets have some flexibility at the sector allocation level and may be modified if conditions warrant.

S-2
While many point sources (e.g., wastewater treatment plants) have achieved, or are near to achieving, their 2017 TMDL goals, other sectors—primarily agricul-ture and urban/suburban stormwater—have been less successful. The uncertainties this has created, and the high costs some sectors (e.g., urban/suburban stormwater) will incur to reduce nutrients to compliance levels, was the impetus behind the pro-vision in the fiscal code to study an alternative approach involving the use of a com-petitive bidding program for nutrient credits rather than sector allocation targets.
Our outline of a competitive RFP (Request for Proposal) program, which is
based in part on an approach taken by the Colorado River Basin Salinity Control Program, includes:
1. DEP establishing the shortfall in nitrogen reductions (i.e., the number of
pounds of nitrogen reductions planned to be achieved via the WIP minus the actual reductions achieved) on an annual or biannual basis.
2. DEP developing a formula that would be disclosed to bidders for how it will score proposals. While the cost per pound of nitrogen reduced would be the primary factor, other environmental (e.g., phosphorous reductions in impaired local streams) and economic factors should also be considered when scoring proposals.
3. PENNVEST entering into long-term contracts (15-20 years) with success-ful bidders to purchase nitrogen credits. Long-term contracts are neces-sary for capital-intensive advanced technology solutions to be financially viable. Actual payment would not be made, however, until the credits have been achieved and verified.
4. DEP would adjust the number of credits to be purchased on an annual or biannual basis. DEP could also make modifications to the scoring formula between bidding periods.
We estimate a competitive RFP program for the Chesapeake Bay would likely
cost between $128 million in 2015 to $313 million in 2025 if no additional nitrogen reductions are achieved from nonpoint sources. Assuming half the nitrogen reduc-tions from nonpoint sources called for in the Commonwealth’s current WIP are achieved, the cost of the RFP program would also be cut in half, and therefore range from $64 million in 2015 to $156 million in 2025. These estimates are based on ni-trogen reductions at $11 per pound ($10 per pound, plus $1 per pound for transac-tion costs).
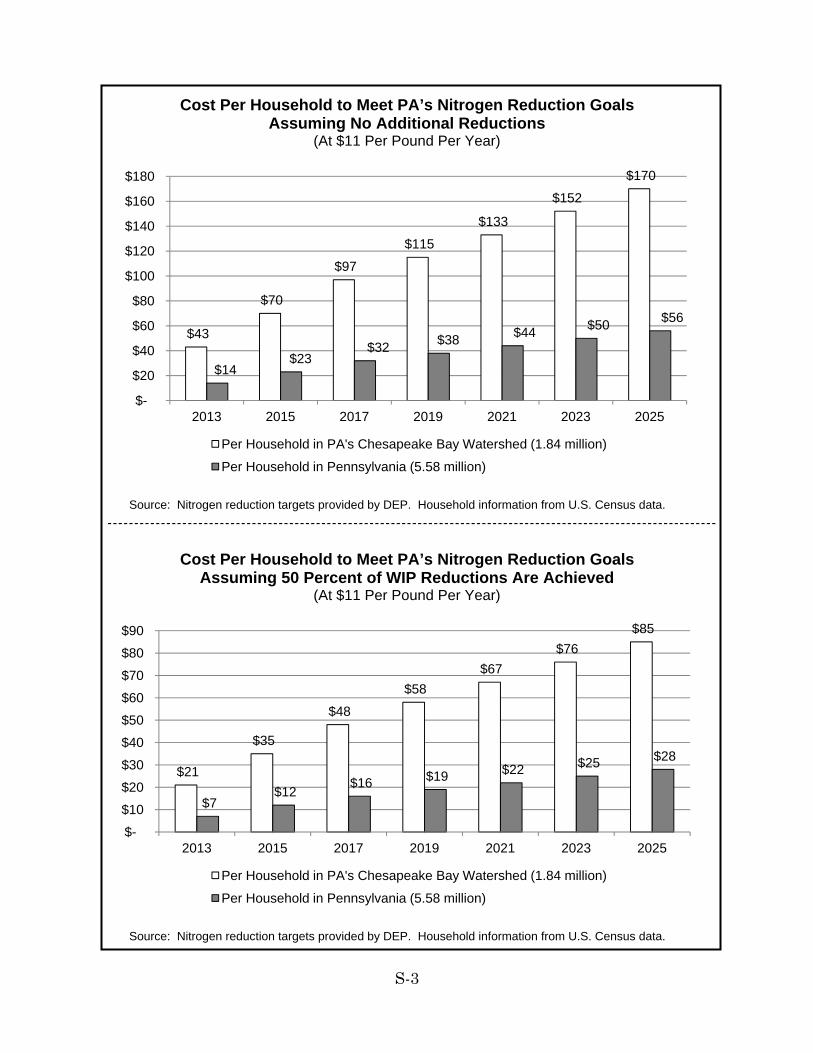
The exhibit on the following page shows the annual per household costs un-
der both scenarios (no additional nitrogen reductions achieved and 50 percent of ni-trogen reductions achieved) if they were spread out among Pennsylvania house-holds in the Chesapeake Bay region and if they were spread out among all Pennsyl-vania households.
S-3
Cost Per Household to Meet PA’s Nitrogen Reduction Goals Assuming No Additional Reductions
(At $11 Per Pound Per Year)
Source: Nitrogen reduction targets provided by DEP. Household information from U.S. Census data. ------------------------------------------------------------------------------------------------------------------
Cost Per Household to Meet PA’s Nitrogen Reduction Goals Assuming 50 Percent of WIP Reductions Are Achieved
(At $11 Per Pound Per Year)
Source: Nitrogen reduction targets provided by DEP. Household information from U.S. Census data.
$43
$70
$97
$115
$133
$152
$170
$14 $23
$32 $38 $44 $50 $56
$-
$20
$40
$60
$80
$100
$120
$140
$160
$180
2013 2015 2017 2019 2021 2023 2025
Per Household in PA's Chesapeake Bay Watershed (1.84 million)
Per Household in Pennsylvania (5.58 million)
$21
$35
$48
$58 $67
$76 $85
$7 $12
$16 $19 $22 $25 $28
$-
$10
$20
$30
$40
$50
$60
$70
$80
$90
2013 2015 2017 2019 2021 2023 2025
Per Household in PA's Chesapeake Bay Watershed (1.84 million)
Per Household in Pennsylvania (5.58 million)

S-4
We also estimated the cost to achieve nitrogen reductions for nonpoint source agriculture and urban runoff from impervious surfaces using best management practices and under a competitive RFP program. These two sources (nonpoint source agriculture and urban runoff from impervious surface) account for about 80 percent of Pennsylvania’s total required nitrogen reductions. As shown in the ex-hibit below, the cost to achieve the nitrogen reductions called for under the WIP for agriculture and urban runoff from impervious surfaces are far lower (approximately 80-85 percent lower) under a competitive RFP program than if achieved through Best Management Practices (BMPs).
Estimated Costs to Achieve All Need Nitrogen Reductions From Nonpoint Source Agriculture and Urban Runoff Using Best Management
Practices (BMPs) and Under a Competitive RFP Program
Source: Nitrogen reduction information provided by DEP. BMP costs from Table 4. Funding for such a program could possibly be achieved by flexing existing
funding for nonpoint sources (approximately $187 million in 2010) or through a new funding source, such as the $60 per year “flush tax” Maryland imposes on house-holds living in its Chesapeake Bay watershed.
The report identifies several other issues raised by a competitive RFP pro-
gram and possible ways those issues could be addressed.
$-
$500
$1,000
$1,500
$2,000
2013 2015 2017 2019 2021 2023 2025
($ M
illio
ns)
Agricultural BMPs (@ $54 per pound)
Urban Stormwater BMPs (@ $386 per pound)
Competitive RFP program (@ $11 per pound)

1
I. Introduction Act 2012-87, the Fiscal Code, includes a provision (Sec. 1764-F) requiring the Legislative Budget and Finance Committee, in consultation with the Pennsylvania Infrastructure Investment Authority (PENNVEST), to conduct a study of an alter-native approach for how the Commonwealth can meet nutrient reduction planning targets contained in any watershed implementation plan.
Study Objectives The study objectives as enumerated in Act 87 are:
(i) Review the cost and the environmental, recreational, and public health and safety impact and other benefits realized by the Commonwealth and municipalities from reductions of water quality impairment from nutri-ents in major watersheds.
(ii) Assess the use of competitive bidding for long-term verified nutrient credits rather than sector allocation targets in any watershed implemen-tation plan.
(iii) Analyze funding options, including use of any available federal, state or local funds for the purchase of nutrient credits.
Methodology
Extensive research has been conducted of the problems and possible solutions confronting polluted estuaries in the United States, and the Chesapeake Bay in particular. Much of the information in this report came from such research, as well as information from the Pennsylvania Department of Environmental Protection’s (DEP) 2004 Chesapeake Bay Tributary Strategy and DEP’s Final Phase II Water-shed Implementation Plan (WIP). Information on the cost and benefits of nutrient credit trading and best man-agement practices (BMPs) came largely from a May 2012 report funded by the Chesapeake Bay Commission entitled Nutrient Credit Trading for the Chesapeake Bay: An Economic Study. We conducted field visits to two facilities employing advanced technologies to process manure waste, one at Kreider Farms in Lancaster County, which processes manure from dairy cows, and one at Hillandale Farms in Adams County, which pro-cesses chicken manure. Information on these facilities can be found in Appendix A.
2
During the study we also interviewed representatives from the following or-ganizations: Chesapeake Bay Foundation, Chesapeake Bay Commission, PENNVEST, BION Environmental Technologies, Inc., the Pennsylvania Depart-ment of Environmental Protection, EnergyWorks, and the Pennsylvania Municipal Authorities Association. We express our gratitude to all these individuals and or-ganizations for their assistance in this project.
Important Note This report was developed by the Legislative Budget and Finance Committee staff. The release of this report should not be construed as an indication that the Committee or its individual members necessarily concur with the report’s findings and recommendations. Any questions or comments regarding the contents of this report should be di-rected to Philip R. Durgin, Executive Director, Legislative Budget and Finance Committee, P.O. Box 8737, Harrisburg, Pennsylvania 17105-8737.

3
II. Pennsylvania’s Chesapeake Bay Program
In the late 1970s, the United States Congress funded a study to analyze the decline in living resources of the Chesapeake Bay, which had been one of the most biologically productive ecosystems on earth before significant human disturbance. The study identified an oversupply of nutrients as the main source of the bay’s deg-radation. High nutrient inputs feed excess algae growth, conversion to different species of algae that do not support the bay’s indigenous food chain, low concentra-tions of oxygen, and reduced light penetration to the submerged aquatic plants that support other components of the bay’s food chain.
After the publication of these initial findings, the Chesapeake Bay Program
was established in 1983 as a regional partnership with a mission to lead and direct the restoration of the Chesapeake Bay. The executive body of the Chesapeake Bay Program is the Chesapeake Executive Council, which establishes the policy direc-tion of the program and consists of the Governors of Maryland, Pennsylvania, and Virginia, the Administrator of the U.S. Environmental Protection Agency, the Mayor of the District of Columbia, and the Chesapeake Bay Commission Chair.
Since its creation, the Chesapeake Bay Program has been primarily focused on reducing the amount of nutrients and sediment entering the bay. The Chesa-peake 2000 Agreement reaffirmed the commitment of the Chesapeake Bay Program to restoration and protection of the Chesapeake Bay by establishing several goals, one of which was to remove the bay from the federal Clean Water Act’s list of im-paired waters prior to 2010—and thereby staving off a federally mandated total maximum daily load—by addressing nutrient and sediment-related problems.
The Chesapeake 2000 Agreement committed the state partners to develop
specific plans, known as Tributary Strategies or Tributary Compliance Plans, de-signed to reduce nutrient and suspended-sediment loadings to acceptable levels (cap loads) in each of the tributaries throughout the watershed. The Pennsylvania De-partment of Environmental Protection (DEP) issued its Chesapeake Bay Tributary Strategy (CBTS) in 2005 to address Pennsylvania’s commitment to nutrient and sediment reductions in the Chesapeake 2000 Agreement. The Strategy called for reducing nutrient and sediment loads to Pennsylvania streams and the Chesapeake Bay from both point sources (where discharges can be attributed to a specific physi-cal location such as a wastewater discharge pipe or a waste lagoon outflow) and nonpoint sources (such a onsite septic, runoff from forests, poorly managed farm-land, and stormwater runoff from city streets and suburban communities). See Ap-pendix B for a map of the Chesapeake Bay Watershed.
Although progress was made under the CBTS, by 2009 it had become clear that the water quality goals of the Chesapeake 2000 Agreement would not be met

4
by the 2010 deadline. (See Table 1 for 2011 nutrient and sediment loads by state and Exhibit 1 for delivered loads by sector.) As a consequence, in 2009 EPA
Table 1
Comparison of 2011 Nutrient and Sediment Loads to the Chesapeake Bay by Jurisdiction as Projected by the Phase 5.3.2 Model
State Nitrogen (lbs/yr) Percent
Pennsylvania ............... 112,470,000 45% Virginia ......................... 62,620,000 25 Maryland ...................... 50,150,000 20 New York ..................... 10,280,000 4 West Virginia ............... 5,400,000 2 Delaware ..................... 4,250,000 2 District of Columbia ..... 2,120,000 1
Totals ........................... 247,290,000
State Phosphorous (lbs/yr) Percent
Virginia ......................... 4,796,000 26% Pennsylvania ............... 8,297,000 45 Maryland ...................... 3,129,000 17 West Virginia ............... 878,000 5 New York ..................... 818,000 4 Delaware ..................... 330,000 2 District of Columbia ..... 80,000 0.4
Totals ........................... 18,328,000
State Total Suspended Solidsa (lbs/yr) Percent
Virginia ......................... 2,512,800,000 30% Pennsylvania ............... 3,627,400,000 44 Maryland ...................... 1,331,600,000 16 West Virginia ............... 314,800,000 4 New York ..................... 381,200,000 5 Delaware ..................... 92,400,000 1 District of Columbia ..... 19,000,000 0.2
Totals ........................... 8,279,200,000 _______________ a Previously reported as sediment. Source: Projected loads as developed through Phase 5.3.2 of the Chesapeake Bay Watershed Model, reported by EPA on 5/12/2012.

5
Exhibit 1
2011 Model Projected Delivered Nitrogen, Phosphorous, and Sediment by Sector (Pennsylvania)
Nitrogen – 112.5 Million Pounds Per Year
Phosphorous – 4.8 Million Pounds Per Year
Sediment – 1,559.2 Million Pounds Per Year
Source: Loads (2011 progress data reported 4/17/12) as developed through Phase 5.3.2 of the Chesapeake Bay Watershed Model, reported by EPA.
Agriculture, 59.3
Forest, 21.1
Point Source, 11.5
Urban/Developed,
17.5
Septic, 2.1 Other, 1
Agriculture,2.6
Forest, 0.4
Point Source, 1.0
Urban/Developed, 0.8
Other, 0.04
Agriculture, 1,559.2
Forest, 385.9
Point Source,
21.4
Urban/Developed,
546.5

6
established a federal Total Maximum Daily Load (TMDL) for the Chesapeake Bay. Specifically, the TMDL set bay watershed limits of 185.9 million pounds of nitrogen, 12.5 million pounds of phosphorus, and 6.45 billion pounds of sediment per year. These figures represent a 25 percent reduction in nitrogen, 24 percent reduction in phosphorus, and 20 percent reduction in sediment over 2009 levels. Pennsylvania’s share of these reductions (based on Phase 5.3.2 Model updates) is shown in Table 2. States were given until November 2010 to submit their final plans to EPA for how they would achieve their target loads.
Table 2
PA Reduction Targets as Projected by the Phase 5.3.2 Model (Pounds Per Year)
Nitrogen Phosphorous Sedimenta
Model-Projected 2011 Progress ........... 112,482,824 4,796,543 2,512,994,737
Phase 2 Planning Target for 2025 ........ 78,831,975 3,599,323 1,945,000,000
Reductions From 2011 Rates by 2025 . 33,650,849 1,197,220 567,994,737
60 Percent by 2017b ............................ 93,953,184 4,153,273 2,224,768,925
Reductions From 2011 Rates by 2017 . 18,529,640 643,270 288,225,812 _______________ a Reported sediment values now reported as total suspended solids by EPA. b Bay jurisdictions are to achieve 60 percent of their 2025 targets (from 2009 baselines) by 2017. Source: DEP Water Planning Office.
The Tributary Strategy plans to reduce pollution to the Chesapeake Bay have
thus been replaced by the state-developed Watershed Implementation Plans (WIPs). DEP submitted Pennsylvania’s Phase 1 WIP to the EPA in November 2010. The document outlined the state’s plan to address nutrient and sediment loadings that drain to the Chesapeake Bay. DEP submitted its Phase 2 plan, which addresses EPA’s revised nutrient and sediment Phase 2 targets, in March 2012.
Pennsylvania’s WIP divides the nutrient loads going into the bay watershed
from Pennsylvania into various sectors, each of which has its own nutrient load tar-gets (see Table 3). It is important to note, however, that the WIP allows DEP flexi-bility in how it allocates these reductions among sectors. DEP can change the sec-tor allocations without requiring EPA approval, provided the total reductions re-main the same.
In addition to the WIP, every two years, the states are to meet milestone commitments to reduce pollution in the bay. The goal is for the program partners to put all projects in place by 2025. A summary of Pennsylvania’s most recent mile-stone progress report is shown in Exhibit 2.

7
Table 3
Nutrient and Sediment Loads Delivered to the Chesapeake Bay as Projected by the Phase 5.3.2 Model
2011 Progress and 2025 Target Pounds Per Year
Model-Projected Phase 2 Watershed Implementation Plan
2011 Progress 2025 Planning Target
% Sector Nitrogen Nitrogen Difference
Agriculture ................................. 59,281,017 35,313,572 -40% Forest ......................................... 21,067,076 21,417,135 2 Point Source ............................... 11,483,413 9,080,860 -21 Urban/Developed ....................... 17,467,177 10,235,505 -41 Septic ......................................... 2,141,702 1,742,464 -19 Air Deposition to Water .............. 1,042,439 1,042,439 0
Totals ........................................ 112,482,824 78,831,975 -30
Sector Phosphorous Phosphorous Difference
Agriculture ................................. 2,611,189 1,832,756 -30% Forest ......................................... 393,689 397,140 1 Point Source ............................... 997,916 903,949 -9 Urban/Developed ....................... 756,503 428,232 -43 Septic ......................................... - - - Air Deposition to Water .............. 37,246 37,246 0
Totals ........................................ 4,796,543 3,599,323 -25
Sector Sediment Total Suspended Solidsa Difference
Agriculture ................................. 1,559,246,443 1,190,126,459 -24% Forest ......................................... 385,909,945 428,739,765 11 Point Source ............................... 21,355,580 12,653,777 -41 Urban/Developed ....................... 546,482,769 313,479,999 -43 Septic ......................................... - - - Air Deposition to Water .............. - - -
Totals ........................................ 2,512,994,737 1,945,000,000 -23 _______________ a Note: Previously reported as sediment. Source: Loads (2011 progress data reported 4/17/12) and Targets (reported 6/27/11) as developed through Phase 5.3.2 of the Chesapeake Bay Watershed Model, reported by EPA.

8
Exhibit 2
Pennsylvania’s 2012-2013 Milestone Commitments to Reduce Nitrogen, Phospho-rus and Sediment

9
Exhibit 2 (Continued)
Source: Pennsylvania Department of Environmental Protection.
10
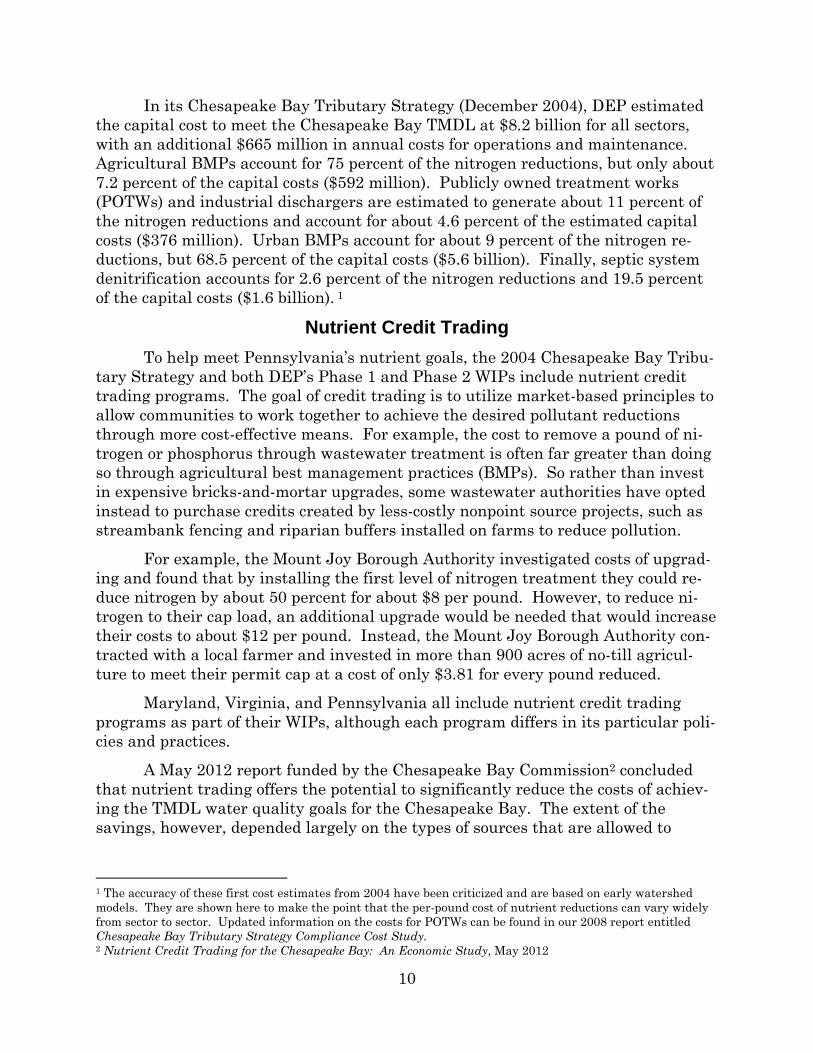
In its Chesapeake Bay Tributary Strategy (December 2004), DEP estimated the capital cost to meet the Chesapeake Bay TMDL at $8.2 billion for all sectors, with an additional $665 million in annual costs for operations and maintenance. Agricultural BMPs account for 75 percent of the nitrogen reductions, but only about 7.2 percent of the capital costs ($592 million). Publicly owned treatment works (POTWs) and industrial dischargers are estimated to generate about 11 percent of the nitrogen reductions and account for about 4.6 percent of the estimated capital costs ($376 million). Urban BMPs account for about 9 percent of the nitrogen re-ductions, but 68.5 percent of the capital costs ($5.6 billion). Finally, septic system denitrification accounts for 2.6 percent of the nitrogen reductions and 19.5 percent of the capital costs ($1.6 billion). 1
Nutrient Credit Trading
To help meet Pennsylvania’s nutrient goals, the 2004 Chesapeake Bay Tribu-tary Strategy and both DEP’s Phase 1 and Phase 2 WIPs include nutrient credit trading programs. The goal of credit trading is to utilize market-based principles to allow communities to work together to achieve the desired pollutant reductions through more cost-effective means. For example, the cost to remove a pound of ni-trogen or phosphorus through wastewater treatment is often far greater than doing so through agricultural best management practices (BMPs). So rather than invest in expensive bricks-and-mortar upgrades, some wastewater authorities have opted instead to purchase credits created by less-costly nonpoint source projects, such as streambank fencing and riparian buffers installed on farms to reduce pollution.
For example, the Mount Joy Borough Authority investigated costs of upgrad-ing and found that by installing the first level of nitrogen treatment they could re-duce nitrogen by about 50 percent for about $8 per pound. However, to reduce ni-trogen to their cap load, an additional upgrade would be needed that would increase their costs to about $12 per pound. Instead, the Mount Joy Borough Authority con-tracted with a local farmer and invested in more than 900 acres of no-till agricul-ture to meet their permit cap at a cost of only $3.81 for every pound reduced.
Maryland, Virginia, and Pennsylvania all include nutrient credit trading programs as part of their WIPs, although each program differs in its particular poli-cies and practices.
A May 2012 report funded by the Chesapeake Bay Commission2 concluded that nutrient trading offers the potential to significantly reduce the costs of achiev-ing the TMDL water quality goals for the Chesapeake Bay. The extent of the savings, however, depended largely on the types of sources that are allowed to
1 The accuracy of these first cost estimates from 2004 have been criticized and are based on early watershed models. They are shown here to make the point that the per-pound cost of nutrient reductions can vary widely from sector to sector. Updated information on the costs for POTWs can be found in our 2008 report entitled Chesapeake Bay Tributary Strategy Compliance Cost Study. 2 Nutrient Credit Trading for the Chesapeake Bay: An Economic Study, May 2012

11
participate (e.g., municipal wastewater, agricultural nonpoint, and urban/suburban3 stormwater sources) and whether trading can occur between watershed basins and/or between states. The more sources that are allowed to participate and the greater the geographic area, the greater the potential savings.
Pennsylvania’s nutrient credit trading program started off slowly, with only six trades having occurred between the program’s inception and September 2008. Our November 2008 report Chesapeake Bay Tributary Strategy Compliance Cost Study found that uncertainties regarding future TMDLs (TMDLs were not estab-lished until 2009) and credit certification and verification standards, among other issues, contributed to the reluctance of the municipal wastewater community to embrace nutrient trading.
PENNVEST reports that, as of 2012, the trading program has developed a consistent and growing base of participants, and continued growth in the number of participants is expected as subsequent phases of the Chesapeake Bay Tributary Strategy are implemented. As of November 30, 2012, 38 trades have occurred, with the overall quantities traded being 623,703 pounds of nitrogen and 33,203 pounds of phosphorus. Nitrogen and phosphorus credits traded in auction through PENNVEST have been trading at costs ranging from about $1.25 to $4 per pound. 4
PENNVEST serves as a clearinghouse in which credit buyers and sellers con-tract with PENNVEST, which in turn purchases credits from credit generators and aggregators. These transactions occur through periodic credit auctions as well as through bilateral agreements. PENNVEST believes it is likely that participation in trading will continue to increase as the nutrient limits become effective on larger numbers of National Pollutant Discharge Elimination System (NPDES)-permitted facilities.
EPA, however, has expressed concern over certain aspects of Pennsylvania’s trading program. In a May 2012 letter to DEP Secretary Michael L. Krancer, EPA indicated it will conduct “enhanced” oversight of Pennsylvania’s trading program and may increase enforcement of NPDES permits that rely on trading if EPA’s con-cerns about the program are not fully addressed. As of the end of 2012, negotiations between EPA and DEP regarding these concerns were on-going. DEP believes these negotiations will ultimately result in changes in the methodologies used to calculate and generate credits, which could result in different entities having credits availa-ble for sale.
Environmental, Recreational, and Public Health and Safety Benefits
Act 87 directs the study to include a review of the environmental, recreation al, and public health and safety benefits from reductions of nutrients in major watersheds. The Chesapeake Bay Foundation addressed many of these issues in a 3 Hereafter referred to as simply urban stormwater. 4 Actual costs for all trades cannot be determined as the cost in private bilateral trades is not fully tracked or available.

12
May 2012 report entitled Saving a National Treasure: The Economic Argument for Cleaning Up the Chesapeake Bay and its Rivers. While many of the direct benefits (fishing, tourism, property values, and shipping activities) accrue primarily to Mar-yland and Virginia, reducing nutrients in the streams and rivers that flow into the bay also provides benefits. As noted in the report, these include:
• Recreational fishing. Nearly two million people go fishing in Pennsylvania each year, contributing over $1.6 billion to the economy. Among the most popular fish for anglers are warmwater species, especially smallmouth bass, and coldwater species, especially native brook trout. On January 1, 2012, the Pennsylvania Fish and Boat Commission enacted a mandate for total catch-and-release of smallmouth bass in certain areas of the Susquehanna River and bans it completely between May 1 and June 15 in parts of the river be-cause of population declines associated with water-quality problems. De-graded stream habitat has restricted the Pennsylvania brook trout to a small fraction of its historical distribution.
• Wildlife watching. Roughly eight million wildlife watchers spent $636 mil-lion, $960 million, and $1.4 billion in Maryland, Virginia, and Pennsylvania, respectively, in 2006 on trip-related expenses and equipment. These esti-mates do not include other economic benefits of these expenditures, such as job creation and the multiplier effect on local economies. Improvements to water quality through land preservation, reforestation, and wetlands restora-tion will increase and enhance wildlife populations.
• Property values. A U.S. Environmental Protection Agency study indicated that clean water can increase the value of single family homes up to 4,000 feet from the water’s edge by up to 25 percent.
• Drinking water. Reducing pollution inputs from pipes and land-based sources can reduce locality costs to treat drinking water sources to safe standards. An EPA study of drinking water source protection efforts con-cluded that every $1 spent on source-water protection saved an average of $27 in water treatment costs. Similarly, a study by the Brookings Institute suggested that a 1 percent decrease in sediment loading will lead to a 0.05 percent reduction in water treatment costs.
• Infrastructure savings. Proactive efforts to lessen stormwater flows today re-duce future public costs needed to maintain navigation channels, remediate pollution and hazard flooding, and repair infrastructure and property dam-age caused by excessive runoff.
A 2001 discussion paper entitled Benefits of Water Quality Policies: the
Chesapeake Bay, funded by Resources for the Future, had similar findings. The paper identified six categories of benefits: benefits of improved water quality to homeowners who live near the Bay (amenity benefits), recreational benefits to fish-ers, recreational benefits to swimmers and boaters, commercial fishing benefits, and benefits to people who may never visit the Bay but care about protecting

13
Chesapeake Bay ecosystems (nonuse benefits). Of all categories of benefits, the pa-per concluded that those associated with recreational fishing and impacts on prop-erty values can be estimated with the greatest confidence. The benefits of improved water quality to swimmers and nonuse values, while important, are more difficult to measure. The paper suggests that the largest categories of benefits are likely to be nonuse benefits, benefits reflected in property values, and benefits to recreation-al fishers and swimmers.
Meeting Future Interim Milestones and Final Targets Meeting the milestones and final targets outlined in Pennsylvania’s WIP will
be challenging. To date, most progress has come from regulated point sources (pri-marily wastewater treatment plants). Goal attainment related to nonpoint sources, particularly agriculture and urban stormwater, has been less successful (see Exhib-it 3 and Appendix C for additional detail).
In recognition of the progress made by Pennsylvania’s wastewater treatment plants, in May 2012, the EPA reduced its oversight of the wastewater sector from “enhanced” to “ongoing.”5 The DEP has also noted that the wastewater treatment facilities in Pennsylvania’s Chesapeake Bay region are approaching or have already attained their 2017 goals.
In contrast, the EPA is maintaining the higher level of “enhanced” oversight
of both the agriculture sector and urban stormwater. The EPA also identified sev-eral backstop actions it might take if its urban stormwater concerns are not ad-dressed, including requiring additional reductions from wastewater treatment plants.
A recent analysis by Devereux Environmental Consulting for the EPA high-
lighted the difficulty confronting the agricultural community in meeting the Chesa-peake Bay requirements. Devereux analyzed three different scenarios under which farms could meet Pennsylvania’s current “threshold” requirements for nutrient trading.6 Even when 100 percent compliance with the threshold measures was as-sumed, the agricultural sector still exceeded the allowable TMDL allocation for ni-trogen by at least 41 percent under each scenario. (See Exhibit 4 for additional in-formation on agriculture’s baseline and threshold requirements.)
5 The EPA provides two levels of oversight based on their assessment of a state’s progress in meeting its imple-mentation targets: ongoing and enhanced. If the EPA notes particular concerns, it will also develop “backstop” actions to implement if its concerns are not adequately addressed. 6 The analysis assumed all Pennsylvania’s farms were in compliance with applicable nutrient management, erosion and sediment controls, and manure management regulations and implemented either a 35-foot stream buffer or a 20 percent reduction in nutrients below the reductions achieved through regulations, which are “threshold” requirements to generate nutrient trading credits.

14
Exhibit 3
Assessment of Pennsylvania’s Progress on Selected Pollution-Reduction Targets for the 2011 Milestone
Source: Chesapeake Bay Foundation, July 2012.

15
Exhibit 4
Pennsylvania Agricultural Requirements for Baseline and Threshold The criteria for Pennsylvania’s agricultural nonpoint sources take the form of baseline and threshold requirements. All farms (not just those in the Chesapeake Bay watershed) are to meet baseline re-quirements. Threshold requirements pertain to farms that seek to participate in Pennsylvania’s Nu-trient Credit Trading Program and therefore only apply to farms in the Chesapeake Bay watershed. The baseline requirement is that on-site operations must be in compliance with:
• Chapter 102 Erosion & Sedimentation Regulations (i.e., develop and implement an Erosion and Sediment Control Plan). These plans do not have to be submitted for approval but must be kept on the farm and made available upon request.
• Section 91.36 regarding manure management (i.e., develop and implement a Manure Man-agement Plan). There is no reporting or inspection requirement for manure management plans, but the plans must be kept on the farm and made available upon request. DEP and County Conservation Districts have, and continue, to make efforts to inform farmers of the regulatory requirement, including mailings, “door-to-door” visits, and workshops. In 2011 DEP hired four compliance staff positions that, as of June 30, 2012 have completed 368 in-spections which resulted in 176 compliance actions that generated $43,591 in fines. Addi-tionally, in September 2012, the State Conservation Commission approved a model compli-ance policy for agriculture that all CCDs will be required to address by September 2013 or risk losing their CBIG grant funds. These information and compliance efforts also address many of the Chapter 102 (Erosion and Sediment Control Plan) requirements.
• Operations defined as CAOs (Concentrated Animal Operations) or CAFOs (Concentrated Animal Feeding Operations) have additional manure management requirements, known as Nutrient Management Plans. The Nutrient Management Plans for CAOs and CAFOs must be developed and reviewed by certified nutrient management specialists, and the operations are to be inspected, at a minimum, every three years.
Agricultural operations that participate in the Nutrient Credit Trading Program must also meet at least one of three “threshold” requirements:
(1) A 100 foot mechanical setback or equivalent is implemented on-site. It either requires that no surface waters exist within 100 feet of the farm or that manure is not mechanically applied within 100 feet of surface water or that manure is not applied at all and that commercial ferti-lizer application rates are below Penn State recommended agronomic rates, or
(2) A 35 foot buffer or equivalent is planted between the field and surface water. The buffer is a swathe of permanent vegetation maintained between the field and surface water. Common types of buffer are riparian forest buffers and riparian grass buffers, or
(3) The farm’s overall nutrient balance be reduced by 20% below what is required by the base-line requirement presented above.
Compliance to threshold requirements is determined by a site visit by DEP staff or a DEP-approved entity. Source: Pennsylvania Departments of Agriculture and Environmental Protection.

16
III. Restructuring Pennsylvania’s Chesapeake Bay Program
Given these uncertainties and high costs some sectors will need to incur to reduce nutrients to compliance levels, Act 2012-87 directed us to conduct “an as-sessment of the use of competitive bidding for long-term verified nutrient credits ra-ther than sector allocation targets in any watershed implementation plan.”7
The approach contemplated in Act 87 would involve a change to the Com-
monwealth’s WIP whereby the current sector-allocated nutrient reduction plan for meeting the federal TMDL mandates would be replaced with a program in which the Commonwealth—presumably through PENNVEST—would purchase nutrient credits through a competitive RFP (Request for Proposal) process. The credits would then be applied to the Commonwealth’s total reduction requirement, not to the various individual sectors.
The thinking behind this approach is that nutrient loadings stem predomi-nately from agricultural activities, in particular livestock waste. By onsite treat-ment of such waste, Pennsylvania could potentially meet its nutrient reduction tar-gets at a much lower cost, and with a much higher degree of reliability, than through the approach in DEP’s current WIP, which relies heavily on agricultural and urban best management practices (BMPs).
A May 2012 report entitled Nutrient Credit Trading for the Chesapeake Bay supports trading as a means of reducing the potentially high cost of compliance with the Chesapeake Bay TMDLs. The report estimates that if Significant Point Sources Discharges, such as municipal and industrial wastewater discharge facilities, were allowed to purchase nutrient credits generated from agricultural sources, potential savings (if allowed on a watershed-wide basis) could approach $200 million, a 49 percent reduction in costs over the “no-trading” scenario.
The potential savings of trading for urban stormwater is even greater. The
report estimates that nutrient credit trading for urban stormwater, if done on a wa-tershed basis, could save as much as 82 percent, or about $1.2 billion, when com-pared to a no-trading scenario.
Nutrient credit trading programs are designed primarily to help point source
dischargers (such as wastewater treatment plants) comply with specific nutrient re-ductions they are required to achieve. The competitive RFP program as outlined in Act 87 is fundamentally different in that the credits would be purchased by the Commonwealth; they would not be traded between sources. The principle, however, is similar: using nutrient credits generated through cost-effective means to replace 7 As the Commonwealth’s current nutrient trading program is also a “competitive bid” program, we use the term “competitive RFP program” to refer to the approach outlined in Act 87.
17
nutrient reductions that otherwise would have to be generated from high-cost—or at least higher-cost—practices. Key Features of a Competitive RFP Approach to Nutrient Reductions
The Colorado River Basin Salinity Control Program (CRBSCP) began using a market-based, competitive bidding (auction) model as a strategy to reduce salinity in the Colorado River in 1995. The approach outlined below is based largely on the CRBSCP model,8 but with a focus on nitrogen, rather than salt, reductions.9 Key features of the basic program design include:
1. DEP would determine how many additional pounds of nutrients need to
be removed to achieve the Chesapeake Bay TMDL requirements for a giv-en one- or two-year period. For example, assuming Pennsylvania met its 2011 target, additional nitrogen reductions of 13.5 million pounds will be needed by 2015. If DEP believes 8 million of the 13.5 million pounds can be achieved through on-going efforts, then the remaining 5.5 million pounds of reductions would be targeted to be achieved through the com-petitive RFP program.
2. DEP would develop a formula, which would be disclosed to potential bid-ders, for scoring the proposals they receive. The cost per pound of nitro-gen reduction would be the starting point, but the formula would presum-ably take in other key factors, such as geography, soil conditions, distance from the bay, and other factors that affect the delivery rate of nitrogen en-tering the bay. Certainty of the project achieving its objectives and the project’s impact on local streams TMDLs, particularly any phosphorus or sediment reductions that may accompany the nitrogen reductions, could be other important factors. Other considerations, such as flood control, open space, recreational or wildlife benefits, and job creation or economic development potential, could also be included in such a formula. Thus, a project that offers nitro-gen reductions at $12 per pound may, depending on how the project scores on other variables, rank higher than a project that offers nitrogen reduc-tion at, for example, $8 per pound but with no other environmental or economic benefits.
3. As part of the RFP process, PENNVEST10 would need to indicate the contract period for which the reductions are being purchased. As some of the technologies involved in achieving nitrogen reductions can be quite
8 See also Priceline for Pollution: Auctions to Allocate Public Pollution Control Dollars, by Robert W. Adler, Vol-ume 34, Issue 3, William & Mary Environmental Law and Policy Review. 9 As discussed on page 25, the focus is on nitrogen reduction because nitrogen is more readily carried down-stream than phosphorous or sediment and thus, from a Chesapeake Bay perspective, is the cost driver. 10 We assume PENNVEST, which serves as the clearinghouse for the current nutrient trading program, would serve a similar function under the competitive RFP program.

18
expensive, bidders—and their investors—would need to know the time pe-riod over which they could recover their investment. For projects that re-quire significant up-front capital costs, a contract period on the order of 15-20 years might be necessary before investors would be willing to com-mit to such projects. Longer contract periods lower the risk to investors, who in turn can then lower the bid price of their nutrient reductions. To protect the Commonwealth, PENNVEST would only make payments after the credits were achieved and verified.
4. As the years progress, DEP would have the opportunity to revise the number of new pounds of reductions to place up for bid. DEP would also have the opportunity to revise the formula and contract parameters to adapt to new circumstances.
We discussed such an approach with key agencies and organizations involved
in meeting Pennsylvania’s Chesapeake Bay goal, including staff at the Department of Environmental Protection, PENNVEST, the Chesapeake Bay Foundation, the Chesapeake Bay Commission, and BION Environmental Technologies, Inc., a pri-vate-sector firm with experience in nutrient management. Based on these discus-sions and our analysis, we identified the following key points:
Both DEP and EPA appear receptive to a competitive RFP program as part of a Chesapeake Bay strategy. In our discussions with DEP, the department ex-pressed interest in a competitive RFP program as “one of the tools in the toolbox” for addressing the Chesapeake Bay goals. DEP believes the WIP as it currently ex-ists should continue to be implemented, but that a competitive RFP program could be an important supplement to the plan. They also believe such a program, if en-acted, should be done on a statewide basis (covering all streams and rivers, not just those in the Chesapeake Bay watershed) and cover a variety of pollutants (not just nitrogen). EPA has also expressed interest in the concept of a competitive RFP program, but noted the specific strategies used to comply with the Chesapeake Bay require-ments are the responsibility of the participating states. DEP cites the importance of advanced technologies in meeting WIP goals. DEP cited “technological innovation” in its 2011 Watershed Improvement Plan as a key element in achieving the Chesapeake Bay goals. The WIP specifically cites technologies such as manure treatment, methane digesters, and electrical co-generation on dairy, poultry, and hog operations. Many of these technologies can produce electricity and marketable soil amendments; reduce methane and am-monia emissions; and generate revenue through renewable energy, nutrient reduc-tion, and carbon credits. Projects of this nature can support the three priorities in the Chesapeake Bay region: maintaining a vibrant farming economy; restoring and protecting the water quality of Pennsylvania streams and the Chesapeake Bay; and

19
providing crucial economic development benefits to rural businesses and communi-ties. During the course of this project, LB&FC staff toured two such facilities in south central Pennsylvania, one which processes cow manure and another which processes chicken manure. Both of these facilities see selling nutrient credits, in combination with other revenue streams such as renewable energy and recovering minerals, as key to the success of these projects. Additional information on these two facilities can be found in Appendix A. A competitive RFP program could dramatically lower overall compliance costs, perhaps by 80 percent or more for nonpoint agriculture and urban runoff. The competitive bidding program implemented by the Colorado River Basin Salinity Control Program serves as a potential target for the level of cost savings that might be achieved by a competitive RFP program enacted for the Chesapeake Bay. Ac-cording to an article published in the William and Mary Environmental Law and Policy Review,
The BOR [U.S. Bureau of Reclamation] initially expected the average cost-effectiveness of controls under the new program to average $50 per ton. After the initial four years of the program, selected projects averaged just over half of that estimate ($26 per ton), with a range of $11 to $36 per ton, and slightly over a third of the average cost-effectiveness of controls under the previous program ($70 per ton). Moreover, although one might have expected costs to increase after the most cost-effective proposals were funded in the first year or two of the program, cost-effectiveness actually improved over the first four years of the program. A possible goal of a competitive RFP program for the Chesapeake Bay would
be to obtain savings on the same order of the same magnitude (50 percent to 80 per-cent).
BION, a firm which has implemented a technologically based solution for removing nitrogen and phosphorus from dairy cow manure, estimates the Com-monwealth could purchase verifiable nitrogen credits at prices ranging from $8 to $12 per pound. For the purposes of this analysis, we used the mid-point of $10 per pound.
While we cannot attest to the validity of the BION estimates, our 2008 report
entitled Chesapeake Bay Tributary Strategy Compliance Cost Study found that, as pertains to Pennsylvania’s nutrient credit trading program, wastewater treatment plant managers most often cited $9 as their estimate for the likely cost to purchase of a pound of nitrogen credits (the survey was conducted shortly after the trading program began). We also note that under Pennsylvania’s current trading program, nitrogen credits are being sold at prices well below $10 per pound (generally, $2 to
20
$4 per pound). Finally, EnergyWorks reported its Energy and Nutrient Recovery Facility it could be profitable, when combined with its project’s other revenue streams, by selling nitrogen credits at $3 per pound. An estimate of $10 per pound, therefore, appeared to us to be a reasonable, perhaps even conservative, estimate for the purposes of this study.
Additionally, we included a 10 percent transaction cost factor to cover the
Commonwealth’s administrative costs, with the acknowledgement that for large dollar value contracts, a 10 percent figure might be high, and for small dollar value contracts, a 10 percent transaction cost estimate might be low. The estimate we use for this analysis is, therefore, $11 ($10, plus $1 for transaction costs).
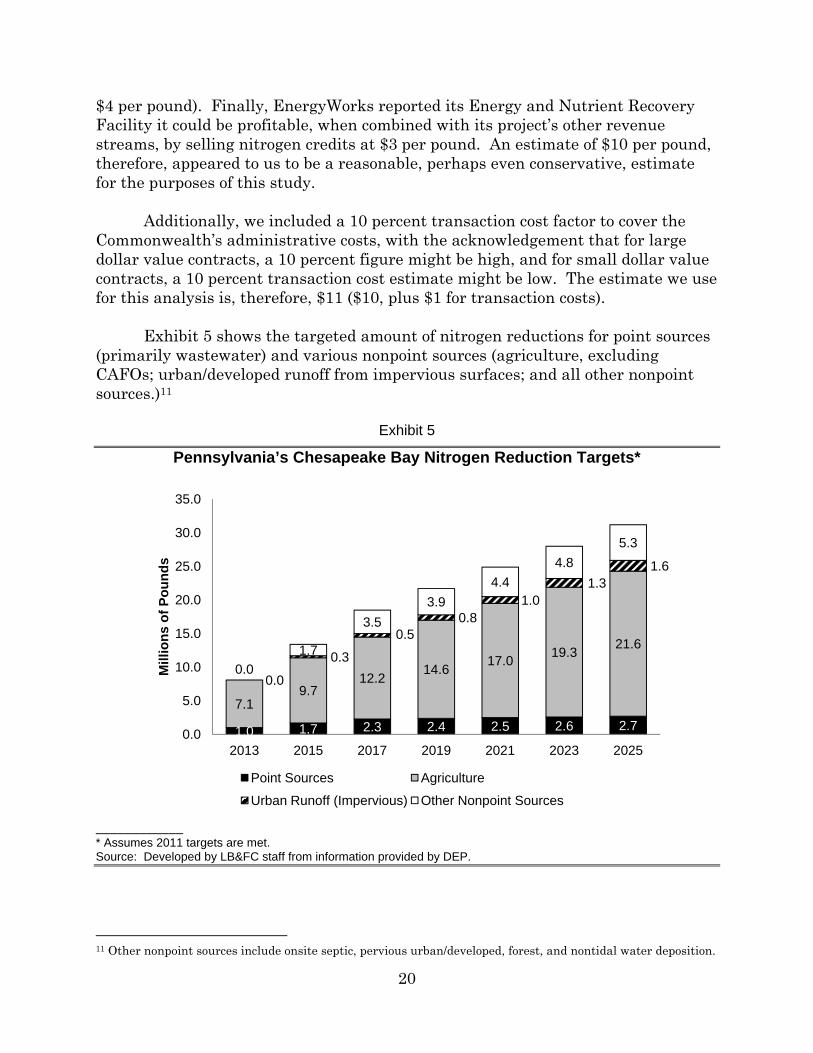
Exhibit 5 shows the targeted amount of nitrogen reductions for point sources
(primarily wastewater) and various nonpoint sources (agriculture, excluding CAFOs; urban/developed runoff from impervious surfaces; and all other nonpoint sources.)11
Exhibit 5
Pennsylvania’s Chesapeake Bay Nitrogen Reduction Targets*
____________ * Assumes 2011 targets are met. Source: Developed by LB&FC staff from information provided by DEP.
11 Other nonpoint sources include onsite septic, pervious urban/developed, forest, and nontidal water deposition.
1.0 1.7 2.3 2.4 2.5 2.6 2.77.1
9.712.2 14.6 17.0 19.3 21.6
0.0
0.3
0.50.8
1.01.3
1.6
0.01.7
3.53.9
4.44.8
5.3
0.0
5.0
10.0
15.0
20.0
25.0
30.0
35.0
2013 2015 2017 2019 2021 2023 2025
Mill
ions
of P
ound
s
Point Sources Agriculture
Urban Runoff (Impervious) Other Nonpoint Sources

21
Exhibit 6 shows the estimated annual amount of funds that would be neces-sary to purchase all the nonpoint source nitrogen reductions required of Pennsylva-nia under the WIP (agriculture plus all other nonpoint sources).12
Exhibit 6
Estimated Cost to Reduce Nitrogen to Pennsylvania’s Chesapeake Bay Targets From Nonpoint Sources*
Assuming No Additional Nonpoint Source Reductions (At $11 per pound per year)
Estimated Cost to Reduce Nitrogen to Pennsylvania’s Chesapeake Bay Targets From Nonpoint Sources*
Assuming 50 Percent of WIP Nonpoint Source Reductions Are Achieved (At $11 per pound per year)
_______________ *Reductions are from 2011 levels (assumes 2011 nitrogen targets have been met). All figures are in 2012 dollars. Source: Developed by LB&FC staff from the nonpoint source information in Exhibit 5.
12 Estimates for point sources are not included because DEP believes many point sources (primarily wastewater treatment plants) already have, or are very close to having, achieved their 2017 reduction targets.
$78
$128
$178 $212
$246 $279
$313
$-
$50
$100
$150
$200
$250
$300
$350
2013 2015 2017 2019 2021 2023 2025
$ in
Mill
ions
$39
$64
$89 $106
$123 $140
$156
$-$20 $40 $60 $80
$100 $120 $140 $160 $180
2013 2015 2017 2019 2021 2023 2025
$ in
Mill
ions

22
As Exhibit 6 shows, under a competitive RFP program, we estimate the reve-nues needed to meet all additional nonpoint source nitrogen reductions would be approximately $128 million in 2015, increasing to approximately $313 million in 2025, if no additional nonpoint source reductions are achieved.
However, it is reasonable to assume that the on-going efforts to reduce non-
point source pollution as described in the WIP (e.g., to improve agriculture’s regula-tory compliance and adopting best management practices and the efforts municipal-ities are taking to comply with their NPDES stormwater limits) will yield at least some additional reductions. As shown in the lower chart on Exhibit 6, any reduc-tions achieved by on-going efforts—the chart in Exhibit 6 assumes 50 percent of the planned reductions will be achieved—will reduce the cost of an RFP program pro-portionally.
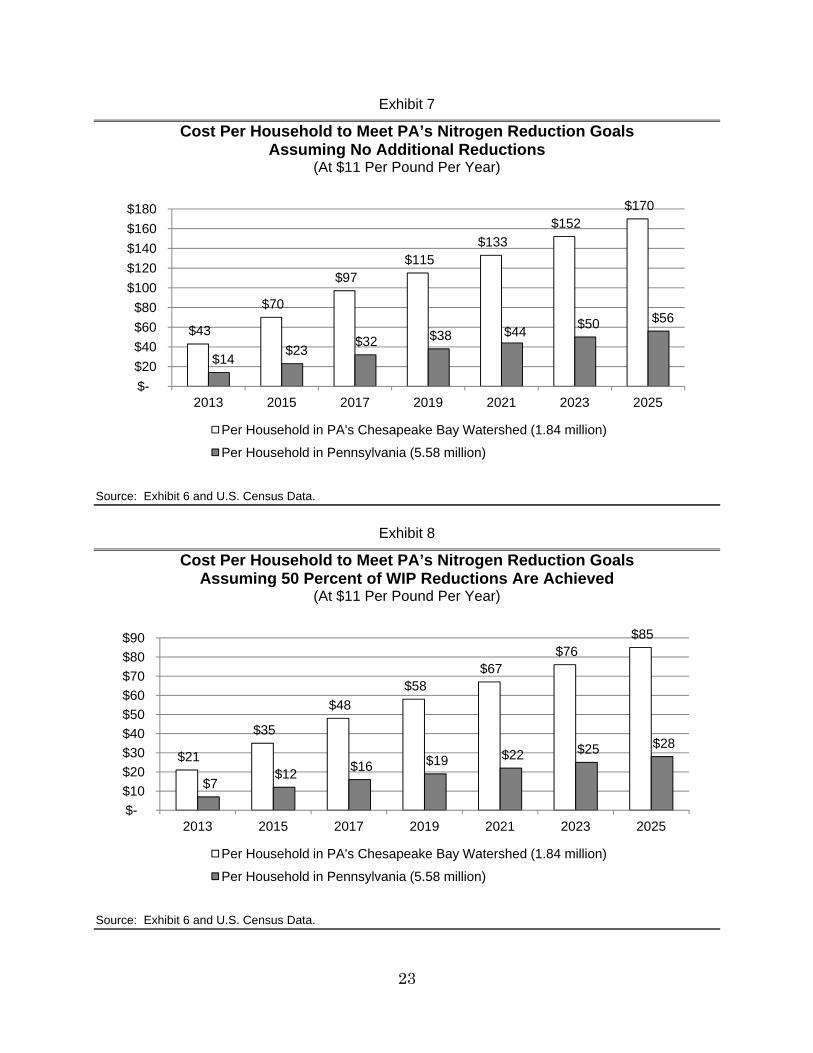
Exhibits 7 and 8 show the cost per household for these two levels of reduc-tions under two scenarios: if the costs are borne solely by households in the Chesa-peake Bay watershed and if the costs are spread out over all Pennsylvania house-holds. These figures compare to DEP’s initial estimate of $693 million in annual op-erating and maintenance costs (not including annualized capital) for nonpoint source reductions as shown in DEP’s 2004 Chesapeake Bay Tributary Strategy. If annualized capital costs are included, annual costs for nonpoint sources would be $1.4 billion, or more than four times higher than the $313 million estimate for the competitive RFP program to meet all the Commonwealth’s 2025 nonpoint source ni-trogen reduction targets. (DEP’s figures include the estimated costs to meet the goals of the 2004 CBTS for removal of nitrogen, phosphorous, and sediment. DEP did not break out the cost of each pollutant separately.) As a second point of comparison, we also calculated the cost to meet Pennsyl-vania’s nitrogen reductions for two nonpoint sources, agriculture and urban runoff from impervious sources, based on figures presented in the May 2012 report Nutri-ent Credit Trading for the Chesapeake Bay: An Economic Study. This report iden-tified the annual cost to reduce a pound of nitrogen for various agricultural and ur-ban stormwater BMPs (see Table 4).13 We eliminated the two most expense BMPs for both agriculture (off stream watering and precision intensive rotational grazing) and urban stormwater (dry ponds and street sweeping) as they would appear cost prohibitive. We then calculated the mean annual cost to reduce a pound of nitrogen for the remaining practices ($54 for agriculture and $386 for urban stormwater). The annual cost to reduce 9.7 million pounds of nitrogen (the 2015 target for agri-culture over 2011 levels) at $54 per pound is $524 million; the annual cost to meet agriculture’s 2025 target, a reduction of 21.6 million pounds over 2011 levels, is $1.17 billion. 13 One-time capital costs for the BMPs were converted to annual terms using a fixed project lifetime and a 7 percent discount rate. The project lifetime varied across BMPs from one year for cover crops to 15 years for con-version of farmland to forestry.
23
Exhibit 7
Cost Per Household to Meet PA’s Nitrogen Reduction Goals Assuming No Additional Reductions
(At $11 Per Pound Per Year)
Source: Exhibit 6 and U.S. Census Data.
Exhibit 8
Cost Per Household to Meet PA’s Nitrogen Reduction Goals Assuming 50 Percent of WIP Reductions Are Achieved
(At $11 Per Pound Per Year)
Source: Exhibit 6 and U.S. Census Data.
$43
$70
$97 $115
$133 $152
$170
$14 $23 $32 $38 $44 $50 $56
$-$20 $40 $60 $80
$100 $120 $140 $160 $180
2013 2015 2017 2019 2021 2023 2025
Per Household in PA's Chesapeake Bay Watershed (1.84 million)
Per Household in Pennsylvania (5.58 million)
$21
$35
$48 $58
$67 $76
$85
$7 $12 $16 $19 $22 $25 $28
$-$10 $20 $30 $40 $50 $60 $70 $80 $90
2013 2015 2017 2019 2021 2023 2025
Per Household in PA's Chesapeake Bay Watershed (1.84 million)
Per Household in Pennsylvania (5.58 million)

24
Table 4
Estimated Cost of Best Management Practices
Agriculture Urban Storm Water
Cover Crop Early Drilled Eye ....................... $ 24 Dry Extended Detention Ponds.............. $ 468
Livestock Exclusion ...................................... 7 Dry Ponds .............................................. 4,662
Off Stream Watering .................................... 283 Urban Nutrient Management .................. 23
Precision Intensive Rotational Grazing ........ 329 Street Sweeping ..................................... 4,156
Continuous No-Till ........................................ 56 Urban Filtering Practices ........................ 627
Enhanced Nutrient Management ................. 33 Urban Infiltration Practices ..................... 235
Decision Agriculture ..................................... 117 Urban Infiltration - Sand/Vegetation ...... 538
Grass Buffers ............................................... 21 Wet Ponds and Wetlands ...................... 463
Forest Buffers ............................................... 37 Urban Forest Buffers .............................. 348
Tree Planting ................................................ 83
Wetland Restoration ..................................... 83
Land Retirement ........................................... 46
Upland Prescribed Grazing .......................... 86
Average (mean)a ......................................... $54 Average (mean)a ................................... $386_______________ aExcludes the two highest cost BMPS for both sectors. Agricultural BMPs include a 38 percent adjustment factor which, according to RTI (the contractor for the study), is to account for the effects of transaction costs for trades in-volving agricultural nonpoint sources. Source: Nutrient Credit Trading for the Chesapeake Bay: An Economic Study, Chesapeake Bay Commission, May 2012. For nonpoint source urban runoff from imperious surfaces, the cost to reduce 271,000 pounds of nitrogen (the 2015 target over 2011 levels) at $386 per pound is $105 million; the cost to meet the 2025 target, a reduction of 1.56 million pounds over 2011 levels, is $602 million.14 Relying on agricultural and urban stormwater BMPs to meet the TMDL tar-gets for nonpoint source agricultural and urban runoff from impervious surfaces could therefore cost about $628 million in 2015 and $1.77 billion in 2025. This com-pares to an estimated cost of $110 million in 2015 and $255 million in 2025 for a competitive RFP program to achieve these same levels of reductions, assuming they could be purchased at $11 per pound.15 This analysis (see Exhibit 9) suggests the competitive RFP program could be on the order of 80-85 percent less costly than 14 Nitrogen from pervious urban sources, such as golf courses, parks and yards, is also a major contributor to the nitrogen load reaching the Chesapeake Bay. Appendix D contains information on the potential costs of using urban stormwater BMPs to reduce nitrogen loads from urban/developed pervious sources. 15 These cost figures differ somewhat from those shown in Exhibit 6 because Exhibit 6 includes reductions from all nonpoint sources (including forests, onsite septic, urban/developed pervious, and non-tidal water deposition), not just agriculture and urban runoff from impervious surfaces.

25
relying on agricultural and urban stormwater BMPs to achieve the same level of re-ductions.16
Exhibit 9
Estimated Costs to Achieve Nitrogen Reduction Targets From Nonpoint Source Agriculture and Urban Runoff From Impervious Surfaces Using Best Management
Practices (BMPs) and Under a Competitive RFP Program*/
_______________ */ Information on potential costs to reduce nitrogen from urban/developed pervious surfaces to target levels using urban stormwater BMPs can be found in Appendix D. Source: Nitrogen reduction targets provided by DEP. BMP cost data is from Table 4. Nitrogen is easily carried downstream, and is therefore the larger problem with regard to Pennsylvania’s pollution of the Chesapeake Bay. As shown in Ta-ble 2, Pennsylvania’s Chesapeake Bay TMDL requirements are for nitrogen, phos-phorus, and sediment. Of the three, however, nitrogen is the most mobile as it can be easily carried downstream. This is primarily because phosphorous binds more tightly with sediment than nitrogen, with 60-80 percent of the phosphorous leaving an agricultural watershed typically being attached to sediment. Nitrogen, on the other hand, leaches through the soil readily, and only about 20-30 percent of this nutrient is typically attached to sediment, with the remainder moving in dissolved form via surface runoff or sub-surface flow. Therefore, sediment control measures are also usually effective at reducing phosphorous levels as well, whereas the same is not always true for nitrogen. As a result, while upstream TMDLs for phospho-rous and sediment are also important compliance issues, these problems are pri-marily local issues, while nitrogen is the primary concern for the Chesapeake Bay. 16 This analysis assumes that farmers and municipalities would seek to achieve the same poundage reductions from each of the BMPs used to calculate the mean cost ($54 for agriculture and $386 for urban stormwater). In practice, it is likely that greater use would be made of lower cost BMPs, which would thereby lower the overall cost of relying on BMPs.
$-
$500
$1,000
$1,500
$2,000
2013 2015 2017 2019 2021 2023 2025
($ M
illio
ns)
Agricultural BMPs (@ $54 per pound)
Urban Stormwater BMPs (@ $386 per pound)
Competitive RFP program (@ $11 per pound)

26
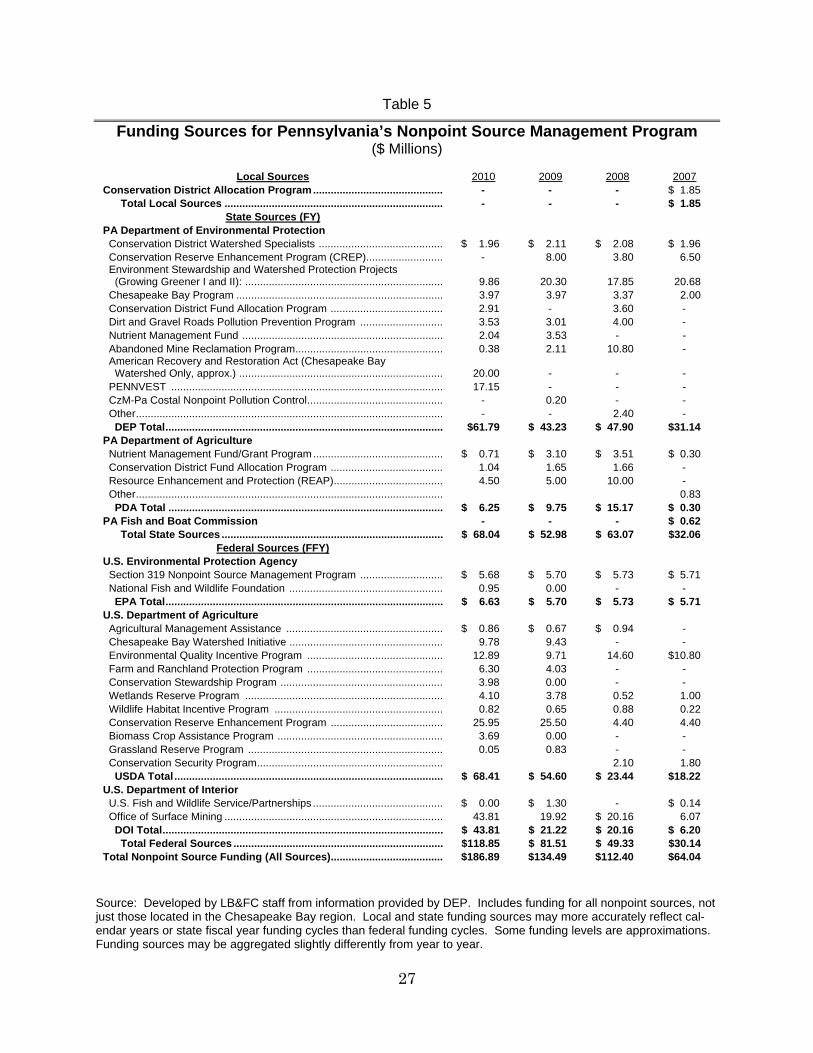
Long-term financing is essential to technological solutions. Given the high cost of building and maintaining large scale technological solutions such as me-thane digesters and methane-to-energy projects, which can cost over $30 million for a single project, long-term financing is essential. Obtaining such financing, howev-er, requires being able to demonstrate to investors that the project has sufficient revenue flow to be viable. Long-term contracts (e.g., on the order of 15-20 years) for nutrient credits are therefore necessary for the financial viability of these projects. As noted above (see page 18) the funds for such contracts would not, however, be re-leased until after the credits have been earned and verified. A source of funding for the competitive RFP program would need to be found. As shown in Table 5, both the Commonwealth and the federal government devote significant resources to Pennsylvania’s nonpoint source efforts, at least some of which could possibly be reallocated to a competitive RFP program. We, however, were not able to determine how much of these revenues might be available for such a purpose. Moreover, future federal funding remains uncertain as the complete 2012 U.S. Farm Bill has yet to pass, and pressure to reduce federal spending is ex-pected to continue. If federal funding is not available, state revenues could conceivably be used to support such a program, either through existing state sources or through a new as-sessment, such as the Maryland “flush tax.” In Maryland, residents and building owners within the Chesapeake Bay watershed17 are subject to a set of fees that support the Bay Restoration Fund, which was created to upgrade Maryland’s wastewater treatment plants (approximately $60 million annually), septic systems ($7 million annually), and to help fund agricultural cover crops ($5 million annual-ly). The fees are levied on users of wastewater facilities, onsite sewage disposal systems, and holding tanks. The revenue is collected by the billing authorities and remitted to the Comptroller of Maryland. Each residential dwelling that receives an individual sewer bill and each user of an onsite sewage disposal system or holding tank that receives a water bill is sub-ject to a $5 monthly fee. Users of onsite sewage disposal systems or sewage holding tanks that do not receive a water bill are subject to a $60 annual fee collected through annual property tax bills. The Bay Restoration Fee is separately identified on the customer’s bill, along with the corresponding dollar amount. Additional in-formation on the Bay Restoration Fund fees can be found in Appendix E. A fee of $5 per month ($60 per year) per household would generate approxi-mately $110 million in gross revenue if applied to the 1.84 million Pennsylvania households living in the Chesapeake Bay watershed, and approximately $335 mil-lion in gross revenue if applied to all 5.58 million Pennsylvania households.
17 Maryland residents living outside the Chesapeake Bay watershed pay a reduced fee.
27
Table 5
Funding Sources for Pennsylvania’s Nonpoint Source Management Program ($ Millions)
Local Sources 2010 2009 2008 2007
Conservation District Allocation Program ............................................ - - - $ 1.85 Total Local Sources .......................................................................... - - - $ 1.85
State Sources (FY) PA Department of Environmental Protection Conservation District Watershed Specialists .......................................... $ 1.96 $ 2.11 $ 2.08 $ 1.96 Conservation Reserve Enhancement Program (CREP).......................... - 8.00 3.80 6.50 Environment Stewardship and Watershed Protection Projects (Growing Greener I and II): ................................................................... 9.86 20.30 17.85 20.68 Chesapeake Bay Program ...................................................................... 3.97 3.97 3.37 2.00 Conservation District Fund Allocation Program ...................................... 2.91 - 3.60 - Dirt and Gravel Roads Pollution Prevention Program ............................ 3.53 3.01 4.00 - Nutrient Management Fund .................................................................... 2.04 3.53 - - Abandoned Mine Reclamation Program .................................................. 0.38 2.11 10.80 - American Recovery and Restoration Act (Chesapeake Bay Watershed Only, approx.) ..................................................................... 20.00 - - - PENNVEST ............................................................................................ 17.15 - - - CzM-Pa Costal Nonpoint Pollution Control .............................................. - 0.20 - - Other ........................................................................................................ - - 2.40 - DEP Total .............................................................................................. $61.79 $ 43.23 $ 47.90 $31.14 PA Department of Agriculture Nutrient Management Fund/Grant Program ............................................ $ 0.71 $ 3.10 $ 3.51 $ 0.30 Conservation District Fund Allocation Program ...................................... 1.04 1.65 1.66 - Resource Enhancement and Protection (REAP) ..................................... 4.50 5.00 10.00 - Other ........................................................................................................ 0.83 PDA Total ............................................................................................. $ 6.25 $ 9.75 $ 15.17 $ 0.30 PA Fish and Boat Commission - - - $ 0.62 Total State Sources ........................................................................... $ 68.04 $ 52.98 $ 63.07 $32.06
Federal Sources (FFY) U.S. Environmental Protection Agency Section 319 Nonpoint Source Management Program ............................ $ 5.68 $ 5.70 $ 5.73 $ 5.71 National Fish and Wildlife Foundation .................................................... 0.95 0.00 - - EPA Total .............................................................................................. $ 6.63 $ 5.70 $ 5.73 $ 5.71 U.S. Department of Agriculture Agricultural Management Assistance ..................................................... $ 0.86 $ 0.67 $ 0.94 - Chesapeake Bay Watershed Initiative .................................................... 9.78 9.43 - - Environmental Quality Incentive Program .............................................. 12.89 9.71 14.60 $10.80 Farm and Ranchland Protection Program .............................................. 6.30 4.03 - - Conservation Stewardship Program ....................................................... 3.98 0.00 - - Wetlands Reserve Program ................................................................... 4.10 3.78 0.52 1.00 Wildlife Habitat Incentive Program ......................................................... 0.82 0.65 0.88 0.22 Conservation Reserve Enhancement Program ...................................... 25.95 25.50 4.40 4.40 Biomass Crop Assistance Program ........................................................ 3.69 0.00 - - Grassland Reserve Program .................................................................. 0.05 0.83 - - Conservation Security Program ............................................................... 2.10 1.80 USDA Total ........................................................................................... $ 68.41 $ 54.60 $ 23.44 $18.22 U.S. Department of Interior U.S. Fish and Wildlife Service/Partnerships ............................................ $ 0.00 $ 1.30 - $ 0.14 Office of Surface Mining .......................................................................... 43.81 19.92 $ 20.16 6.07 DOI Total ............................................................................................... $ 43.81 $ 21.22 $ 20.16 $ 6.20 Total Federal Sources ....................................................................... $118.85 $ 81.51 $ 49.33 $30.14 Total Nonpoint Source Funding (All Sources) ...................................... $186.89 $134.49 $112.40 $64.04
Source: Developed by LB&FC staff from information provided by DEP. Includes funding for all nonpoint sources, not just those located in the Chesapeake Bay region. Local and state funding sources may more accurately reflect cal-endar years or state fiscal year funding cycles than federal funding cycles. Some funding levels are approximations. Funding sources may be aggregated slightly differently from year to year.

28
Robert W. Adler, a Professor of Law at the University of Utah who has writ-ten extensively on various watershed pollution issues, notes that the flush tax pro-vides no incentive for pollution reduction because the tax is not tied to the amount of pollution caused by each user. Professor Adler has suggested:
One way in which program funds can be generated in ways that both satisfy the polluter pays concept and that provide additional pollution reduction incentives would be a dedicated tax on agricultural and household fertilizers and any other agricultural, commercial, or indus-trial products that cause nitrogen and phosphorus to reach the [Ches-apeake] Bay. The funding mechanism itself thus would create incen-tives to use those products more conservatively, and the funds received could be allocated for additional cost-effective pollution controls through the auction process.
Professor Adler does not, however, cite specific products (other than agricultural and household fertilizers) that might be targeted for such a tax.
A decision would need to be made as to how to implement a competitive RFP program. Pennsylvania’s nutrient credit trading program was established through the 2004 Chesapeake Bay Tributary Strategy, and subsequently formalized in regulation at 25 PA Code Chapter 96.8. Although a competitive RFP program could conceivably be established in a similar manner, we assume a program of the magnitude envisioned in this report, especially if funded through a dedicated fund-ing source, would need to be established through legislation and, presumably, then embodied in regulation. Many wastewater treatment plants have already made major capital in-vestments and increased customer fees. Our 2008 report entitled Chesapeake Bay Tributary Strategy Compliance Cost Study found that it will cost “significant munic-ipal discharges” approximately $1.4 billion in capital costs to meet the nutrient-related requirements of the Chesapeake Bay Tributary Strategy. This translates to costs of $68 per household equivalent per year ($40 capital related and $28 opera-tion and maintenance related). Pennsylvania’s municipal authorities are therefore concerned that a competi-tive RFP program may result in their customers, in essence, paying twice for meet-ing the Chesapeake Bay goals: once in increased fees for their upgraded wastewater treatment plant and a second time to provide funds for the RFP pro-gram to purchase additional nutrient credit reductions that, under the current WIP, would primarily be the responsibility of the agricultural sector. This concern stems, in part, from language in an early draft proposal that would have required sewer authorities (and water authorities whose customers re-ceive water bills but use septic systems) to impose a transfer fee on their customers. Municipalities would be required to impose a similar fee on on-site septic system

29
permit holders that do not receive a water bill. These fees would then be made available for PENNVEST to use to purchase nutrient credits. The municipal authorities we spoke to did not believe they should be respon-sible for collecting additional fees to address nutrient reductions required of non-point sources such as farms, noting that many authorities have already significant-ly increased fees to their customers to meet Chesapeake Bay requirements. The Scranton Sewer Authority, for example, cited the federal Chesapeake Bay require-ments as the reason for a $23 million upgrade to its treatment plant, necessitating a 45 percent increase in rates in 2012. The Waynesboro Borough Authority, citing the costs of upgrades to its facilities to meet the Chesapeake Bay requirements, report-edly enacted a 10 percent increase in rates in 2012, following 15 percent rate in-creases in both 2010 and 2011. According to the Pennsylvania Municipal Authori-ties Association, sewage authority increases of this magnitude are common throughout Pennsylvania’s Chesapeake Bay tributary regions. Wastewater treatment facilities that are treating for nutrients over and above what their permits require could, however, benefit from a competitive RFP program by selling credits, the revenue from which could be used to offset a portion of the facility’s operating costs. Municipal wastewater authorities could also benefit because the EPA has indicated that if Pennsylvania is not able to achieve the planned reductions in the agriculture and urban stormwater sections of the plan, further reductions may be required of wastewater treatment plants. This next level of reductions, known as enhanced nutrient removal (ENR), can require costly addi-tional upgrades to wastewater treatment plants.
Local streams have their own TMDLs that must also be addressed. If a lo-cal stream is identified by DEP as having a nutrient problem, those problems must be addressed even if the state has met its requirements for the Chesapeake Bay. In short, if a local stream is polluted, the problem cannot be offset by buying credits elsewhere. This has led to concerns that, should Commonwealth funds be spent purchasing credits from large-scale technological operations targeted specifically at the Chesapeake Bay, funds would not then be available to help address the water quality problems of local streams. For most fresh water streams and lakes in Pennsylvania, phosphorous is the “limiting” nutrient (i.e., the nutrient that controls algae growth), whereas nitrogen is typically the limiting nutrient in estuaries such as the Chesapeake Bay. As a re-sult, steps focused solely on reducing the nitrogen flowing to the Bay may do little to address the water quality problems of local streams, which are typically due to ex-cess phosphorus and sediment. As Frequently, however, steps taken to reduce one nutrient, such as nitrogen, also result in the reductions of other pollutants. For example, a recent study of the various control measures implemented by BION at four animal operations in south‐central Pennsylvania found these operations will result in significant impacts

30
to nutrient loads delivered to local streams as well as to the Chesapeake Bay. 18 The study estimated the BION operations, which are primarily targeted toward nitrogen reductions from manure, will also result in adjusted phosphorus load re-ductions that exceed the TMDL‐required reductions in two of three locally impaired creeks (the Quittapahilla and Donegal Creeks) and about 44 percent of the TMDL load in the Chickies Creek.
In addition to addressing phosphorous problems in these local streams, the project is also expected to help mitigate problems caused by elevated nitrate concen-trations in groundwater resources that serve as sources of local drinking water sup-plies. The study noted that Lancaster County has reported that more than 140 wa-ter supply systems have had to implement some level of nitrate removal because ni-trate concentrations were consistently above the USEPA standard. According to the study, the degree of nitrogen removal expected from BION’s treatment activities at the four areas identified would most certainly have a positive impact on groundwa-ter nitrogen concentrations in these areas.
One way to encourage such projects would be to give greater weight (i.e., a higher score) to nutrient credit bids that also address the issues pertaining to impaired local streams. For example, a bid for nitrogen reductions that would also reduce phosphorous in a creek with a serious phosphorous problem could receive a higher score (i.e., the Commonwealth would be willing to pay a higher price per pound of nitrogen reduced) than a bid for nitrogen reductions on a project that does not reduce phosphorous loads into an impaired stream. This is why our outline of a potential competitive RFP program (see page 17) includes DEP developing a for-mula that would take into consideration phosphorus and other local water quality concerns, such as water-borne pathogens, endocrine disruptors, methane, and ni-trates in local drinking water supplies into award decisions.19 Credits must be verifiable. One of the potentially most difficult aspects of implementing a nutrient credit trading or credit purchasing program is ensuring that the credits purchased are actually realized, meaning that the proposed project or practice is implemented and yields the planned nutrient reductions. As a general rule, load reductions from nonpoint sources, like agricultural BMPs, are less certain that those from point source control technologies, in part because nonpoint source BMPs are more difficult to monitor and verify.20 To address this issue, EPA has done significant work to estimate the nutrient removal efficiencies of various BMPs 18 An Overview of Potential Nutrient Load Reductions to Local Streams and the Chesapeake Bay as a Result of Bion’s Waste Treatment Activities at Farm Operations in South‐Central Pennsylvania, by Barry M. Evans, Ph.D., Penn State University, October 12, 2012. 19 This approach has been used in the CRBSCP program, where projects have received additional credit for ac-companying reductions in certain other pollutants, such as selenium. 20 A 2012 report entitled Improving conservation practices programming to protect water quality in agricultural watersheds: Lessons learned from the National Institute of Food and Agriculture–Conservation Effects Assess-ment Project found that farmers tend to discontinue certain types of BMPs, especially practices such as nutrient management. The report attributed these tendencies to generational transfers or changes in land ownership and/or lack of interest in continuation of the practice.

31
in their Chesapeake Bay Watershed Model, and participating states are required to use those models.21 States can further address this uncertainty by building in a “cushion” to pro-tect against overly optimistic estimates in credit exchanges between point and non-point sources. Virginia, for example, requires a trading ratio of 2:1 when a new or expanding point source purchases a credit from a nonpoint source. That is, for eve-ry credit needed, the point source must purchase two credits from the nonpoint sell-er. In Maryland, purchasers of agricultural nonpoint credits are also required to purchase a set aside equal to 10 percent of the credit value. Pennsylvania’s trading ratio for purchase by a point source from a nonpoint source is 1:1; however, credit calculations must include a 10 percent set aside for the Department’s credit reserve. Pennsylvania also has a process in place to verify that the credits purchased are actually achieved. As part of the certification decision, DEP requires a verifica-tion plan that explains how such verification will occur. Verification can take a number of forms, but it must demonstrate that the pollutant reduction activity was implemented as described in the certification and that other requirements, such as those pertaining to baselines and thresholds, have been met. DEP is not typically the primary verifier, but it may conduct verification activities such as monitoring, inspecting sites, and performing compliance audits. One advantage of using advanced technologies, such as have been employed by BION and EnergyWorks, is that the nutrients are strictly controlled and there-fore can be readily measured and verified at various points in the process. This re-moves much of the uncertainty surrounding the reliability of credits generated through agricultural and urban stormwater BMPs. Participation by small bidders. PENNVEST has expressed concern that it might be difficult to structure an RFP program in which small farms or entities could compete effectively. One possible solution to promote participation by small bidders could involve “aggregators” who would bundle several small nutrient credit producers into larger units as a way to take advantage of efficiencies of scale. While the costs for nitrogen credits might be higher from such aggregators, the smaller operations may be able to offer other benefits, such as nutrient reductions on im-paired local streams, which under the PENNVEST/DEP formula (discussed above) might offset the initially higher costs. Other options for including small bidders in-clude establishing a “set-aside” whereby a certain number of pounds would be allo-cated for small bidders only or requiring under certain circumstances that large bidders allow smaller operations to participate as part of their bid. Traditional nutrient removal projects can have important tangential bene-fits. Concern has also been expressed that, should the Commonwealth implement a nutrient reduction approach that relies heavily on capital-intensive advanced 21 The EPA has questioned the efficiency of some BMPs, believing they may be overestimated, and may need to be adjusted.

32
technologies, it would remove much of the impetus provided by the Chesapeake Bay requirements to make needed structural repairs and upgrades in other sectors, par-ticularly urban stormwater systems. Our 2008 report entitled Chesapeake Bay Tributary Strategy Compliance Cost Study noted a similar issue; that oftentimes wastewater treatment plants would incorporate other needed or desired capital im-provements to their facilities as part of an upgrade to improve nutrient removal. A similar issue exists with regard to agricultural BMPs. If Commonwealth funds are diverted from existing programs to purchase nutrient credits from ad-vanced technologies, fewer funds may be available to help farmers meet related goals, such as developing and implementing Nutrient Management Plans, Erosion and Sediment Control Plans, and, for farms that include an Animal Concentration Area or that land apply manure, Manure Management Plans. PENNVEST notes, for example, that it already has a process in place for funding the implementation of BMPs that reduce nutrients without an RFP process. Funding for these projects comes from a combination of state funds approved by voters, federal grants to PENNVEST from the Environmental Protection Agency, and recycled loan repayments from previous PENNVEST funding awards. Exam-ples of recent PENNVEST projects pertaining to the Chesapeake Bay are shown in Appendix F. PENNVEST also notes, however, that its funding is limited, and it re-ceives many more requests for funding that it can accommodate.
If a competitive RFP approach resulted in the Chesapeake Bay TMDLs being achieved at a much reduced overall cost, more funds would be available, at least in the aggregate (meaning public and private sectors together), to address these relat-ed infrastructure needs and to target water quality concerns other than nitrogen.
Job creation and economic development potential. Advanced technology projects can not only help the Commonwealth achieve its TMDL loads, but also have the potential to promote economic development and create new jobs in rural communities. A January 2012 report entitled Manure to Energy22 highlighted the triple benefits that manure-to-energy projects can offer; producing renewable do-mestic energy, sustaining profitable farms, and improving water quality. The re-port highlights several examples of farms using chicken and cattle manure to gen-erate gas to heat farm buildings, to generate electricity to power the farm and to sell any surplus back to the power grid, to transform raw manure into sterile ash that can be used as an alternative to commercial fertilizer or sold to phosphorous-poor regions of the country,23 and well as decreasing greenhouse gases and reducing the amount of nutrients and other pollutants delivered to the bay and local water-ways. These projects can also produce valuable nutrient, renewable energy, and
22 Manure to Energy: Sustainable Solutions for the Chesapeake Bay Region, January 2012. 23 As increasing global demand depletes available supplies, renewable phosphorus will become an important factor in achieving sustainable agriculture. Studies are now being completed to demonstrate the safety and efficacy of renewable phosphorus from manure processing as an animal feed ingredient.

33
carbon offset credits as additional revenue streams. The report contains several recommendations and policy options to encourage these types of projects. Advanced technologies may also be key to the continued financial viability of small farms. To remain competitive in today’s commodity markets, farms need to increase the scale of their operations. Traditional manure management methods involve spreading the manure as fertilizer on farm fields. This means, however, that more land is required to increase the scale of animal feeding operations. By eliminating the need for land application of manure, technology solutions can de-couple this link between land use and the scale of animal operations.

34
35
IV. Appendices

36
APPENDIX A
Advanced Technology Projects at Kreider Farms (BION) and Hillandale Farms (EnergyWorks)
Kreider Farms (BION) Bion Environmental Technologies, Inc., has executed an agreement with Kreider Farms to in-stall a system at their 2,000-head dairy facility in Lancaster County, Pennsylvania, to reduce ammonia emissions and nitrogen in the effluent. These reductions will qualify for credits under Pennsylvania’s Nutrient Credit Trading Program as part of the strategy to comply with Pennsyl-vania’s Chesapeake Bay Tributary Strategy.
Bion worked extensively with the Pennsylvania Department of Environmental Protection over the past four years to establish a nutrient credit calculation/verification methodology that is ap-propriate to Bion’s technology and recognizes its ‘multi-media’ (both water and atmospheric) approach to nutrient reductions with respect to the Chesapeake Bay Tributary Strategy. The DEP has approved Bion’s protocols for calculating credits for its system’s reduction of nitrogen and phosphorus in the liquid effluent, as well as ammonia emissions that have been recognized as a significant contributor of nutrients in the Bay through downwind deposition of nitrogen.
The PENNVEST Board of Directors approved a low-interest loan for Phase I of Bion’s Kreider Farms project following Bion’s lengthy review process by Penn State University and PA DEP and stakeholder meetings with US EPA, PA DEP, PA Department of Agriculture and others. Bion received approval of its demonstration permit from the DEP in August 2010.
Bion anticipates that Phase 1 of its Kreider Dairy project will initially generate approximately 130,000 nitrogen credits annually from the primary milking herd of 1,200 animals. Phase 1 will also produce approximately 16,250 phosphorus credits. Additional N & P credits can be gener-ated and earned through:
1. actual sampling results (that show improvements from modeling), 2. upcoming studies regarding the bioavailability and denitrification characteristics of the
residual fine solids, 3. implementation of the renewable energy facility as outlined for Phase 2 for the combus-
tion of the coarse (cellulosic) solids, and 4. additional manure inputs when the dairy support herd (approximately 800 animals) is
brought online
As shown below, Phase 2 will include renewable energy production from the dairy waste coarse solids as well as the waste from Kreider’s approximately 5 million chickens. Upon successful completion of Phase 2, which requires PA DEP to approve additional protocols, the project is anticipated to produce a total of 1.5 million credits, potentially more with the treatment of waste from surrounding farms. These are long-term credits (certified for 10 years or more) that can be used to offset the discharges from municipal wastewater treatment facilities and other nitrogen sources in the Susquehanna watershed that face much higher nitrogen remediation costs.

37
Appendix A (Continued)
Hillandale Farms (EnergyWorks)
In October 2010, Hillandale Farms Gettysburg and EnergyWorks BioPower, LLC signed agree-ments to proceed with the construction of an Energy and Nutrient Recovery Facility (the Gettys-burg ENRF) on land adjacent to the Hillandale operations in Adams County. The facility will use gasification technology to transform egg layer manure into renewable energy and mineral by-products and will be capable of processing the entire amount of manure produced by 5 million layer hens.
As a nutrient credit generator certified under the Pennsylvania Nutrient Cap and Trade program using gasification technology, the Gettysburg ENRF is the first facility of its kind in the United States. The facility will generate 2.5 megawatts of electricity, recycle over 13,000 tons of min-eral byproducts annually, reduce farm ammonia emissions by 50 percent, eliminate over 34,000 tons of CO2 equivalent greenhouse gases annually, reduce manure storage by 97 percent, elim-inate manure application on 23,000 acres of land, and achieve 3.5 percent and 4.4 percent, re-spectively, of Pennsylvania’s 2025 goals for reducing nitrogen and phosphorous loading to the Chesapeake Bay. The project is to become fully operational by the end of 2012.

38
Appendix A (Continued)
The Hillandale Farms egg layer operations north of Gettysburg, currently house approximately 3.5 million layer hens, producing approximately 3 million eggs per day. The farm is expanding its operations to approximately 5 million hens.
EnergyWorks BioPower, LLC, based in Lancaster, will operate the plant and is a subsidiary of EnergyWorks North America headquartered in Annapolis, Maryland.
Gettysburg Plant
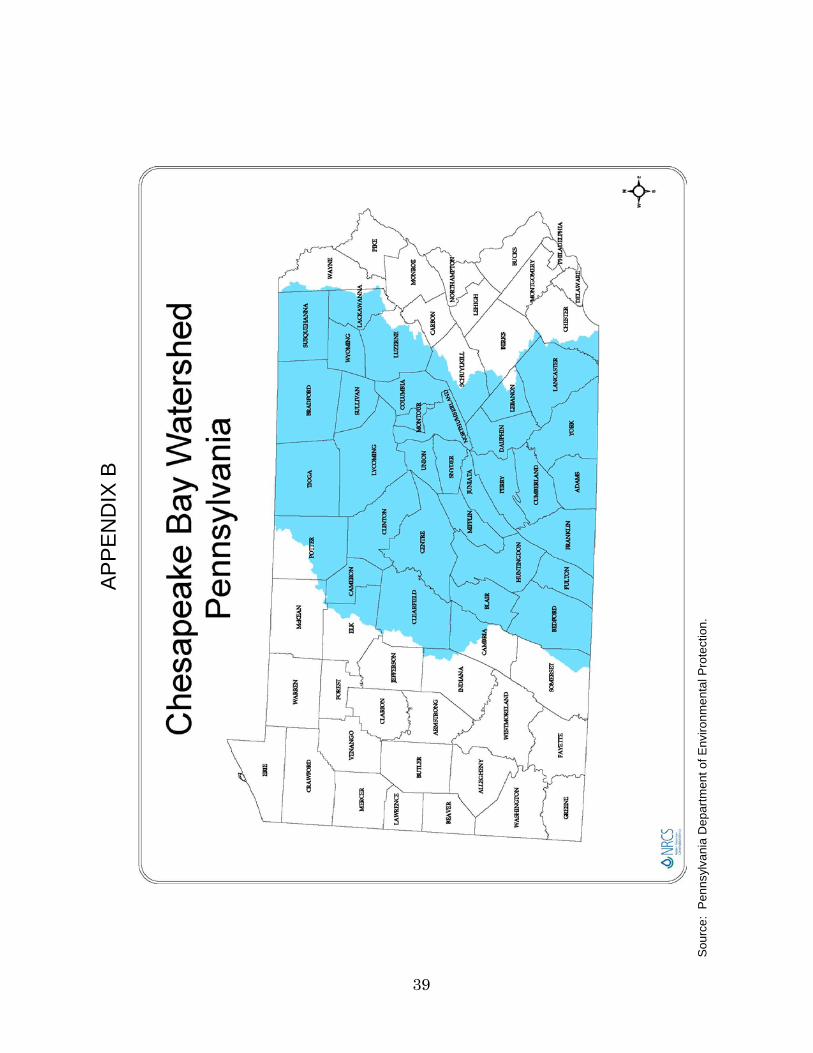
AP
PE
ND
IX B
S
ourc
e: P
enns
ylva
nia
Dep
artm
ent o
f Env
ironm
enta
l Pro
tect
ion.
39

40
APPENDIX C
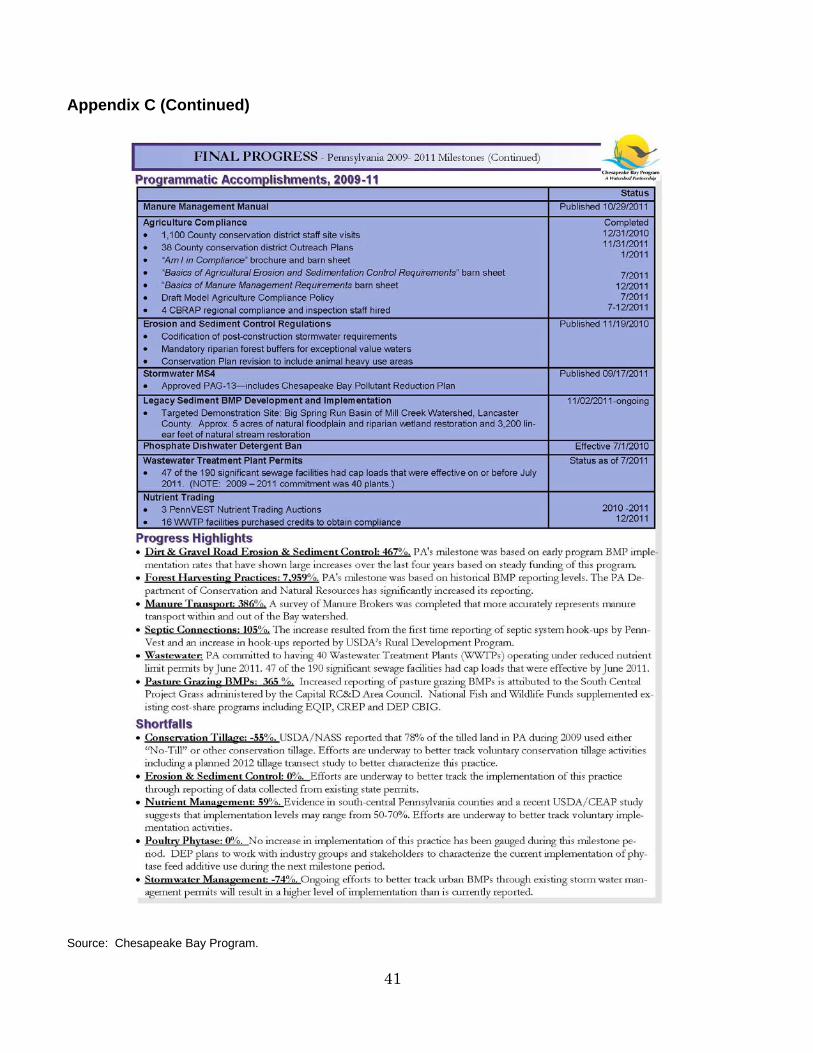
41
Appendix C (Continued)
Source: Chesapeake Bay Program.

AP
PE
ND
IX D
Estim
ated
Cos
ts to
Ach
ieve
Nitr
ogen
Red
uctio
n Ta
rget
s Fr
om N
onpo
int S
ourc
e
Agr
icul
ture
and
Urb
an S
torm
wat
er S
ourc
es (B
oth
Perv
ious
and
Impe
rvio
us)
Usi
ng B
est M
anag
emen
t Pra
ctic
es (B
MPs
) and
Und
er a
Com
petit
ive
RFP
Pro
gram
S
ourc
e: D
evel
oped
by
LB&
FC s
taff
usin
g ni
troge
n re
duct
ion
targ
et in
form
atio
n pr
ovid
ed b
y D
EP
. In
form
atio
n on
cos
ts o
f BM
Ps
from
Nut
rient
Cre
dit T
radi
ng fo
r th
e C
hesa
peak
e B
ay:
An
Eco
nom
ic S
tudy
, Che
sape
ake
Bay
Com
mis
sion
, May
201
2.
$386
$5
24
$661
$7
87
$914
$1
,040
$1
,166
$3
3
$241
$4
48
$845
$1,2
42
$1,6
39
$2,0
36
$12
$105
$197
$298
$400
$501
$602
$-
$500
$1,0
00
$1,5
00
$2,0
00
$2,5
00
$3,0
00
$3,5
00
$4,0
00
2013
2015
2017
2019
2021
2023
2025
($ Millions)
Agr
icul
tura
l BM
Ps
(@ $
54 p
er p
ound
)
Urb
an S
torm
wat
er B
MP
s (F
rom
Per
viou
s Su
rface
s) (@
$38
6 pe
r pou
nd)
Urb
an S
torm
wat
er B
MP
s (F
rom
Impe
rvio
us S
urfa
ces)
(@ $
386
per p
ound
)
Com
petit
ive
RFP
pro
gram
(@ $
11 p
er p
ound
)
42
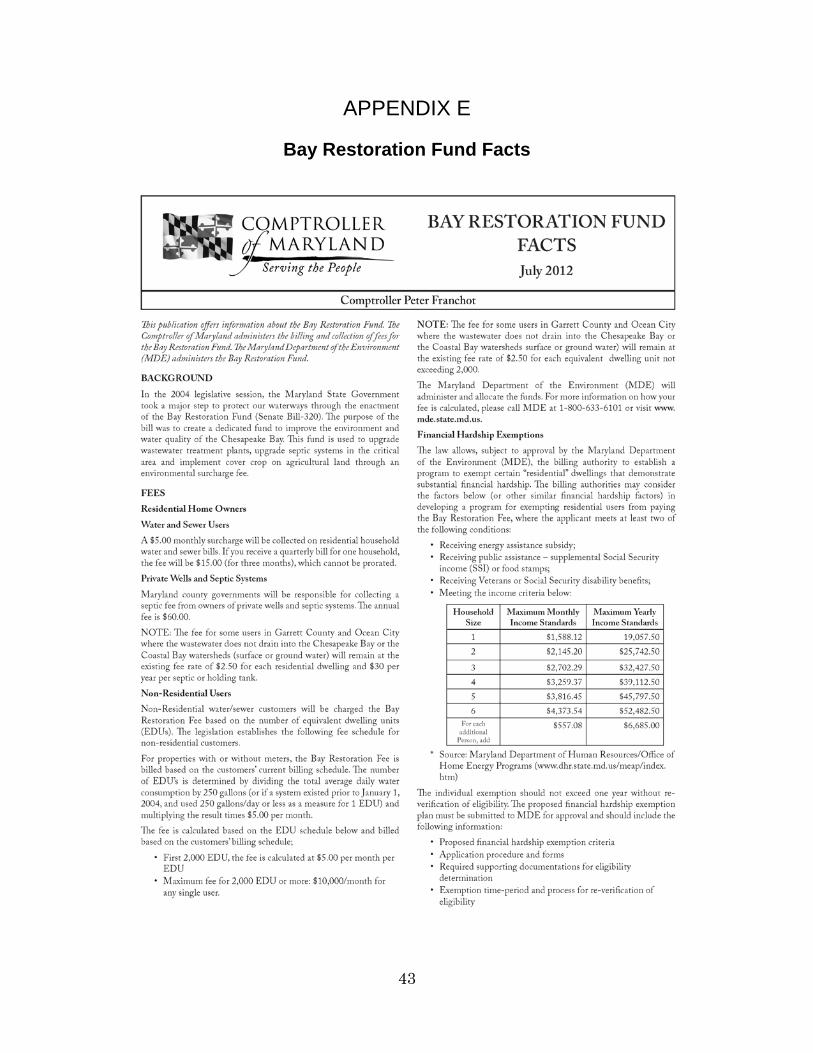
43
APPENDIX E
Bay Restoration Fund Facts
44
Appendix E (Continued)
Source: Comptroller of Maryland, July 2012.
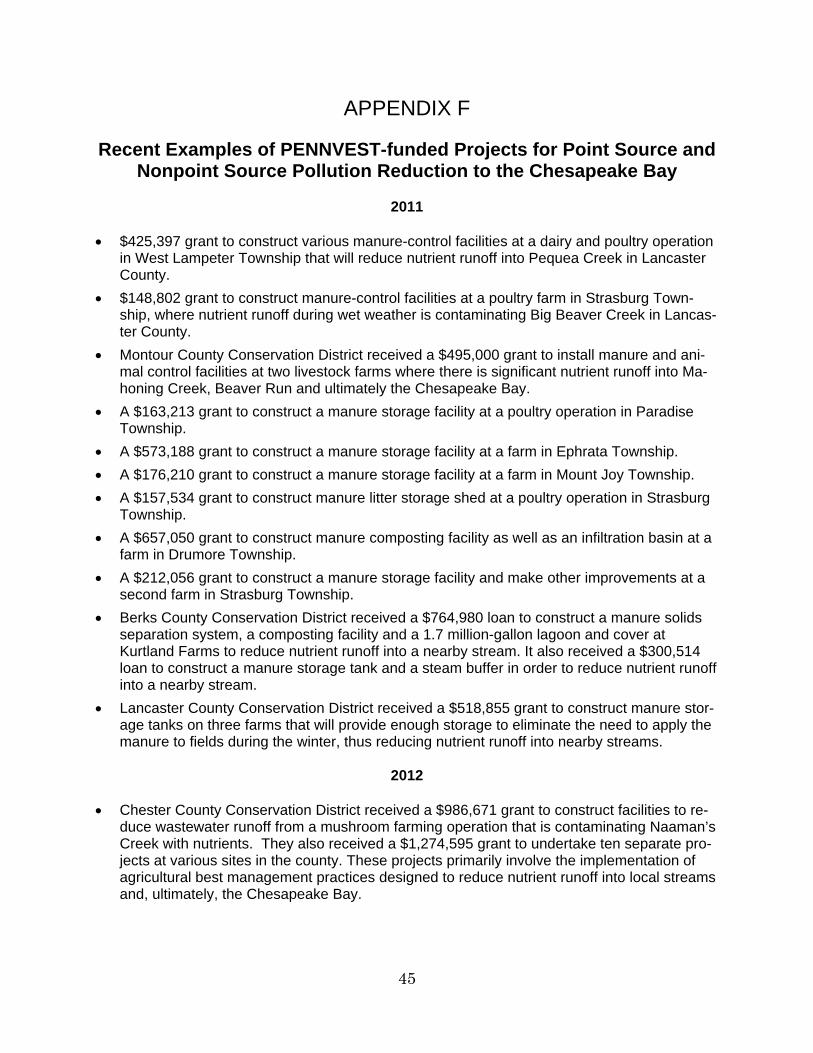
45
APPENDIX F
Recent Examples of PENNVEST-funded Projects for Point Source and Nonpoint Source Pollution Reduction to the Chesapeake Bay
2011
• $425,397 grant to construct various manure-control facilities at a dairy and poultry operation
in West Lampeter Township that will reduce nutrient runoff into Pequea Creek in Lancaster County.
• $148,802 grant to construct manure-control facilities at a poultry farm in Strasburg Town-ship, where nutrient runoff during wet weather is contaminating Big Beaver Creek in Lancas-ter County.
• Montour County Conservation District received a $495,000 grant to install manure and ani-mal control facilities at two livestock farms where there is significant nutrient runoff into Ma-honing Creek, Beaver Run and ultimately the Chesapeake Bay.
• A $163,213 grant to construct a manure storage facility at a poultry operation in Paradise Township.
• A $573,188 grant to construct a manure storage facility at a farm in Ephrata Township. • A $176,210 grant to construct a manure storage facility at a farm in Mount Joy Township. • A $157,534 grant to construct manure litter storage shed at a poultry operation in Strasburg
Township. • A $657,050 grant to construct manure composting facility as well as an infiltration basin at a
farm in Drumore Township. • A $212,056 grant to construct a manure storage facility and make other improvements at a
second farm in Strasburg Township. • Berks County Conservation District received a $764,980 loan to construct a manure solids
separation system, a composting facility and a 1.7 million-gallon lagoon and cover at Kurtland Farms to reduce nutrient runoff into a nearby stream. It also received a $300,514 loan to construct a manure storage tank and a steam buffer in order to reduce nutrient runoff into a nearby stream.
• Lancaster County Conservation District received a $518,855 grant to construct manure stor-age tanks on three farms that will provide enough storage to eliminate the need to apply the manure to fields during the winter, thus reducing nutrient runoff into nearby streams.
2012
• Chester County Conservation District received a $986,671 grant to construct facilities to re-
duce wastewater runoff from a mushroom farming operation that is contaminating Naaman’s Creek with nutrients. They also received a $1,274,595 grant to undertake ten separate pro-jects at various sites in the county. These projects primarily involve the implementation of agricultural best management practices designed to reduce nutrient runoff into local streams and, ultimately, the Chesapeake Bay.
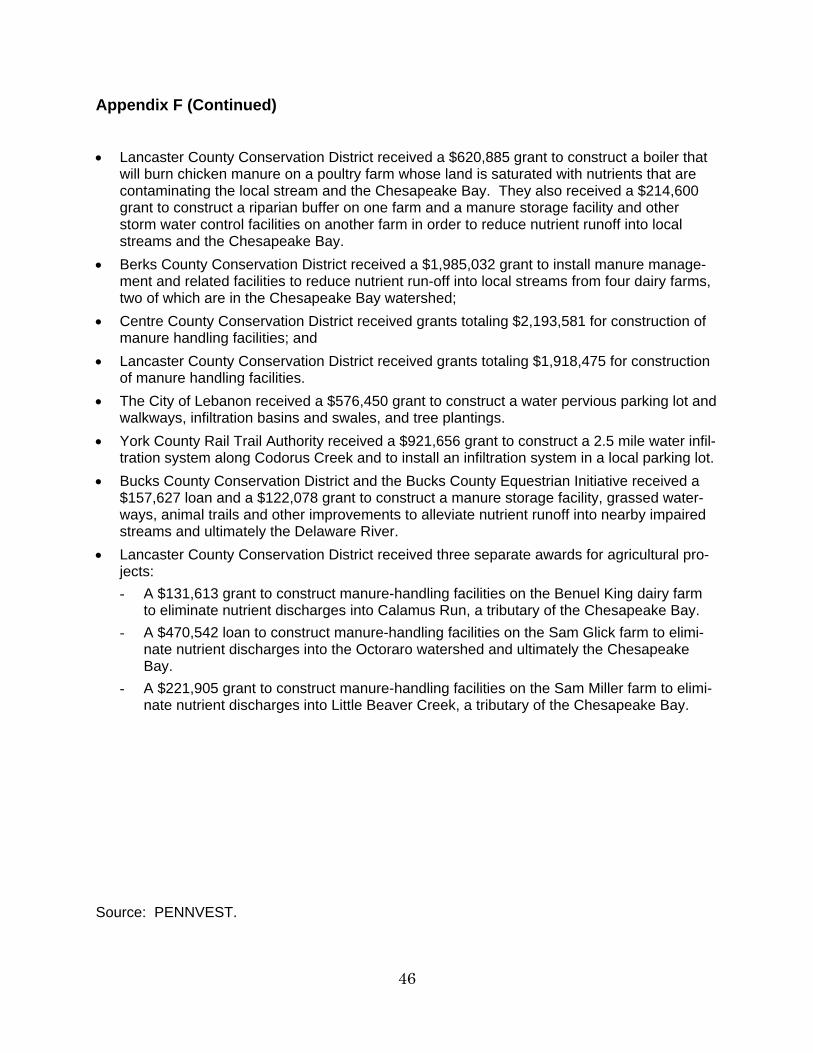
46
Appendix F (Continued) • Lancaster County Conservation District received a $620,885 grant to construct a boiler that
will burn chicken manure on a poultry farm whose land is saturated with nutrients that are contaminating the local stream and the Chesapeake Bay. They also received a $214,600 grant to construct a riparian buffer on one farm and a manure storage facility and other storm water control facilities on another farm in order to reduce nutrient runoff into local streams and the Chesapeake Bay.
• Berks County Conservation District received a $1,985,032 grant to install manure manage-ment and related facilities to reduce nutrient run-off into local streams from four dairy farms, two of which are in the Chesapeake Bay watershed;
• Centre County Conservation District received grants totaling $2,193,581 for construction of manure handling facilities; and
• Lancaster County Conservation District received grants totaling $1,918,475 for construction of manure handling facilities.
• The City of Lebanon received a $576,450 grant to construct a water pervious parking lot and walkways, infiltration basins and swales, and tree plantings.
• York County Rail Trail Authority received a $921,656 grant to construct a 2.5 mile water infil-tration system along Codorus Creek and to install an infiltration system in a local parking lot.
• Bucks County Conservation District and the Bucks County Equestrian Initiative received a $157,627 loan and a $122,078 grant to construct a manure storage facility, grassed water-ways, animal trails and other improvements to alleviate nutrient runoff into nearby impaired streams and ultimately the Delaware River.
• Lancaster County Conservation District received three separate awards for agricultural pro-jects: - A $131,613 grant to construct manure-handling facilities on the Benuel King dairy farm
to eliminate nutrient discharges into Calamus Run, a tributary of the Chesapeake Bay. - A $470,542 loan to construct manure-handling facilities on the Sam Glick farm to elimi-
nate nutrient discharges into the Octoraro watershed and ultimately the Chesapeake Bay.
- A $221,905 grant to construct manure-handling facilities on the Sam Miller farm to elimi-nate nutrient discharges into Little Beaver Creek, a tributary of the Chesapeake Bay.
Source: PENNVEST.