legislative economic briefing - mississippi · legislative economic briefing ... since january...
TRANSCRIPT

Legislative Economic BriefingFebruary 16, 2017
Mississippi University Research CenterMississippi Institutions of Higher Learning
Darrin Webb, State [email protected]
(601)432-6556
To subscribe to our publications, including Mississippi’s Business email Janna Taylor at [email protected].
Visit our website for this presentation
www.mississippi.edu/urc/downloads/presentations/legislative_economic_briefing.pdf

Overview• US economy has momentum at the start of 2017
– Rebound in energy-sector capital spending
– Strong gains in single-family housing permits
– Orders and shipments of core capital goods are growing again
– January jobs gains were much improved
– Inflation is picking up – signaling improved growth in the economy
– One temporary headwind however is continuation of inventory drawdown in the first half of the year
• Signals are more mixed in Mississippi– Employment slowed considerably in the 4th quarter– Income growth appears to have likewise slowed in the 4th quarter– Transfers to GF have been weak, especially sales & income tax which are
perhaps the revenue sources most closely connected to economic activity– Building permits are improving – Manufacturing workweek length remains high– Initial unemployment claims continue to decline
February 2017 MS University Research Center, IHL 2
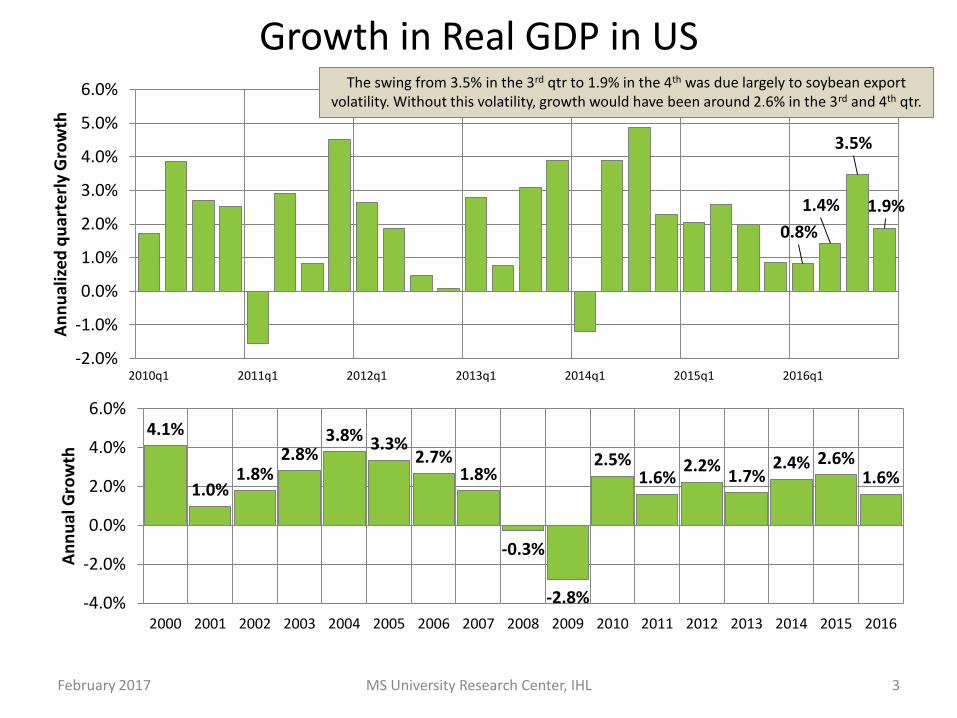
Growth in Real GDP in US
0.8%
1.4%
3.5%
1.9%
-2.0%
-1.0%
0.0%
1.0%
2.0%
3.0%
4.0%
5.0%
6.0%
2010q1 2011q1 2012q1 2013q1 2014q1 2015q1 2016q1
An
nu
aliz
ed q
uar
terl
y G
row
th
MS University Research Center, IHL 3February 2017
4.1%
1.0%1.8%
2.8%3.8% 3.3%
2.7%1.8%
-0.3%
-2.8%
2.5%1.6%
2.2%1.7%
2.4% 2.6%1.6%
-4.0%
-2.0%
0.0%
2.0%
4.0%
6.0%
2000 2001 2002 2003 2004 2005 2006 2007 2008 2009 2010 2011 2012 2013 2014 2015 2016
An
nu
al G
row
thThe swing from 3.5% in the 3rd qtr to 1.9% in the 4th was due largely to soybean export
volatility. Without this volatility, growth would have been around 2.6% in the 3rd and 4th qtr.

US Real GDP Growth is Slowing
-15.0%
-10.0%
-5.0%
0.0%
5.0%
10.0%
15.0%
20.0%
25.0%
1930 1940 1950 1960 1970 1980 1990 2000 2010
Annual Growth Avg. Growth During Expansion Yrs, By Decade
February 2017 MS University Research Center, IHL 4
Growth during the last expansion (1992-2007) was 3.2%Average growth between 2010-2016 period was 2.1%. We have not experienced a 3.0% growth rate since 2005Reasons: increased interdependence of international economies, high debt levels, aging population/demographic trends.Implications: more frequent recessions.
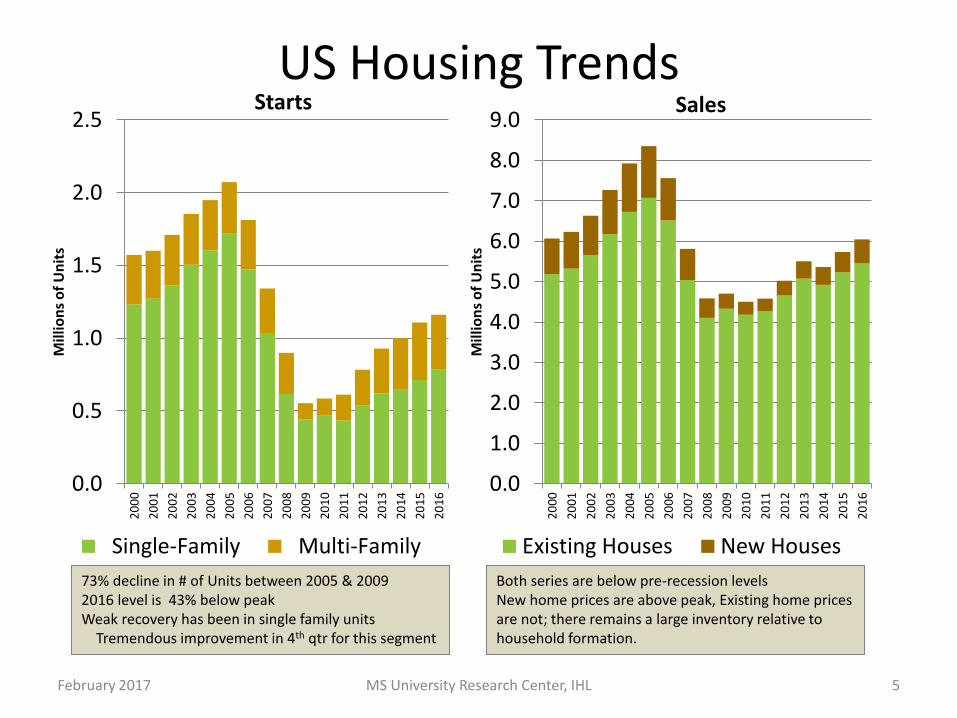
US Housing Trends
0.0
0.5
1.0
1.5
2.0
2.52
00
0
20
01
20
02
20
03
20
04
20
05
20
06
20
07
20
08
20
09
20
10
20
11
20
12
20
13
20
14
20
15
20
16
Mill
ion
s o
f U
nit
s
Single-Family Multi-Family
February 2017 MS University Research Center, IHL 5
73% decline in # of Units between 2005 & 20092016 level is 43% below peakWeak recovery has been in single family units
Tremendous improvement in 4th qtr for this segment
0.0
1.0
2.0
3.0
4.0
5.0
6.0
7.0
8.0
9.0
20
00
20
01
20
02
20
03
20
04
20
05
20
06
20
07
20
08
20
09
20
10
20
11
20
12
20
13
20
14
20
15
20
16
Mill
ion
s o
f U
nit
s
Existing Houses New Houses
Starts Sales
Both series are below pre-recession levels New home prices are above peak, Existing home prices are not; there remains a large inventory relative to household formation.
Housing Trends
• People are renting rather than buying
• Reflects modest income growth
• Household formation is down– During boom years young adults were buying
– Fueled by stronger income growth & easy mortgages
– After bust young adults started living with others• Due in part to high student load debt & decreased job
opportunities
• At some point household formation will again track population growth & boost housing
February 2017 MS University Research Center, IHL 6
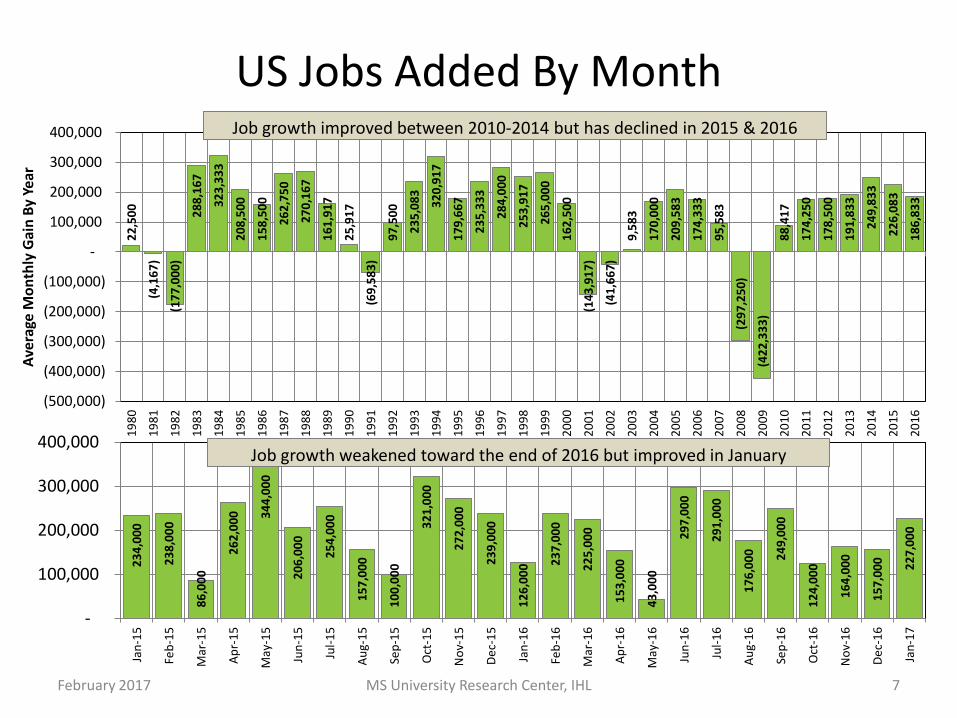
US Jobs Added By Month
MS University Research Center, IHL 7February 2017
22
,50
0
(4,1
67
)
(17
7,0
00
)
28
8,1
67
32
3,3
33
20
8,5
00
15
8,5
00
26
2,7
50
27
0,1
67
16
1,9
17
25
,91
7
(69
,58
3)
97
,50
0
23
5,0
83
32
0,9
17
17
9,6
67
23
5,3
33
28
4,0
00
25
3,9
17
26
5,0
00
16
2,5
00
(14
3,9
17
)
(41
,66
7)
9,5
83
17
0,0
00
20
9,5
83
17
4,3
33
95
,58
3
(29
7,2
50
)
(42
2,3
33
)
88
,41
7
17
4,2
50
17
8,5
00
19
1,8
33
24
9,8
33
22
6,0
83
18
6,8
33
(500,000)
(400,000)
(300,000)
(200,000)
(100,000)
-
100,000
200,000
300,000
400,0001
98
0
19
81
19
82
19
83
19
84
19
85
19
86
19
87
19
88
19
89
19
90
19
91
19
92
19
93
19
94
19
95
19
96
19
97
19
98
19
99
20
00
20
01
20
02
20
03
20
04
20
05
20
06
20
07
20
08
20
09
20
10
20
11
20
12
20
13
20
14
20
15
20
16
Ave
rage
Mo
nth
ly G
ain
By
Year
Job growth improved between 2010-2014 but has declined in 2015 & 20162
34
,00
0
23
8,0
00
86
,00
0
26
2,0
00
34
4,0
00
20
6,0
00
25
4,0
00
15
7,0
00
10
0,0
00
32
1,0
00
27
2,0
00
23
9,0
00
12
6,0
00
23
7,0
00
22
5,0
00
15
3,0
00
43
,00
0
29
7,0
00
29
1,0
00
17
6,0
00
24
9,0
00
12
4,0
00
16
4,0
00
15
7,0
00
22
7,0
00
-
100,000
200,000
300,000
400,000
Jan
-15
Feb
-15
Mar
-15
Ap
r-1
5
May
-15
Jun
-15
Jul-
15
Au
g-1
5
Sep
-15
Oct
-15
No
v-1
5
De
c-1
5
Jan
-16
Feb
-16
Mar
-16
Ap
r-1
6
May
-16
Jun
-16
Jul-
16
Au
g-1
6
Sep
-16
Oct
-16
No
v-1
6
De
c-1
6
Jan
-17
Job growth weakened toward the end of 2016 but improved in January
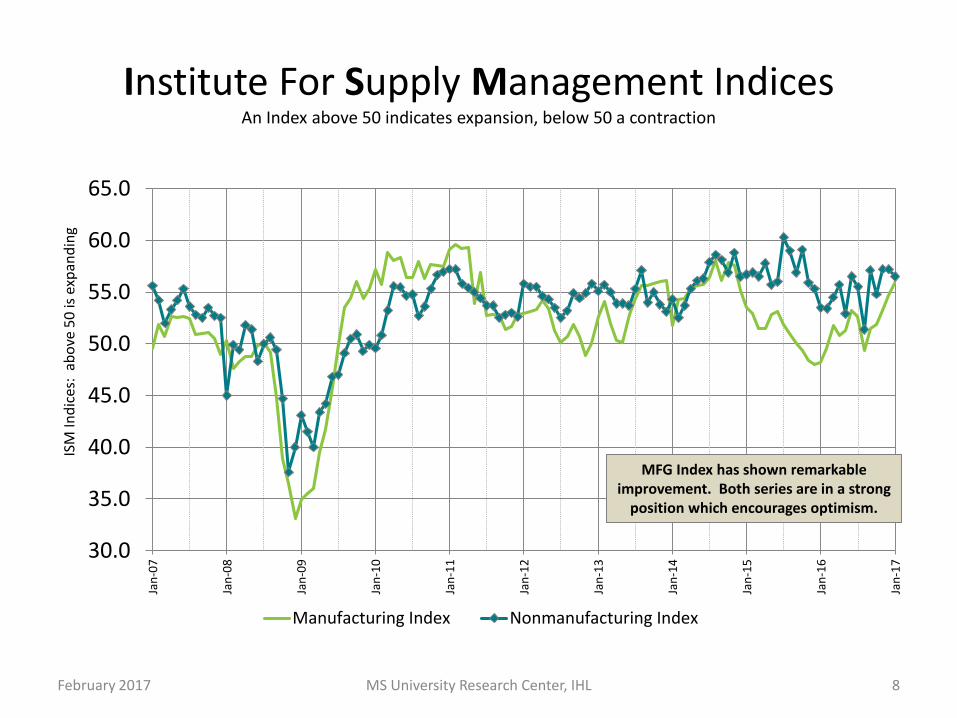
Institute For Supply Management IndicesAn Index above 50 indicates expansion, below 50 a contraction
30.0
35.0
40.0
45.0
50.0
55.0
60.0
65.0
Jan
-07
Jan
-08
Jan
-09
Jan
-10
Jan
-11
Jan
-12
Jan
-13
Jan
-14
Jan
-15
Jan
-16
Jan
-17
ISM
Ind
ices
: ab
ove
50
is e
xpan
din
g
Manufacturing Index Nonmanufacturing Index
MS University Research Center, IHL 8February 2017
MFG Index has shown remarkable improvement. Both series are in a strong
position which encourages optimism.

Real US Retail SalesAdjusted for Inflation
$280,000
$290,000
$300,000
$310,000
$320,000
$330,000
$340,000
$350,000
$360,000
$370,000
Jan-10 Jan-11 Jan-12 Jan-13 Jan-14 Jan-15 Jan-16
Mo
nth
ly S
ale
s M
illi
on
s o
f 2
00
4 $
2010 3.8%
2016 1.7%
2015 2.2%
MS University Research Center, IHL 9February 2017
2011 4.1%
20122.7%
2014 2.3%
2013 2.4%
Retail sales in 2016 were low compared to the fairly modest growth of the past few years. Christmas sales struggled to meet expectations reaching near or only slightly above last year. This is a bit surprising given the increased optimism. Wage growth, while improving with a tightening labor force, remains relatively subdued

Weekly US Regular Retail Gasoline PricesDollars Per Gallon
$0.00
$0.50
$1.00
$1.50
$2.00
$2.50
$3.00
$3.50
$4.00
$4.50
February 2017 MS University Research Center, IHL 10
After falling dramatically in mid-2014 prices stabilized in late 2016. We have seen a slight uptick in recent weeks, but prices remain low
for relative to the past decade.
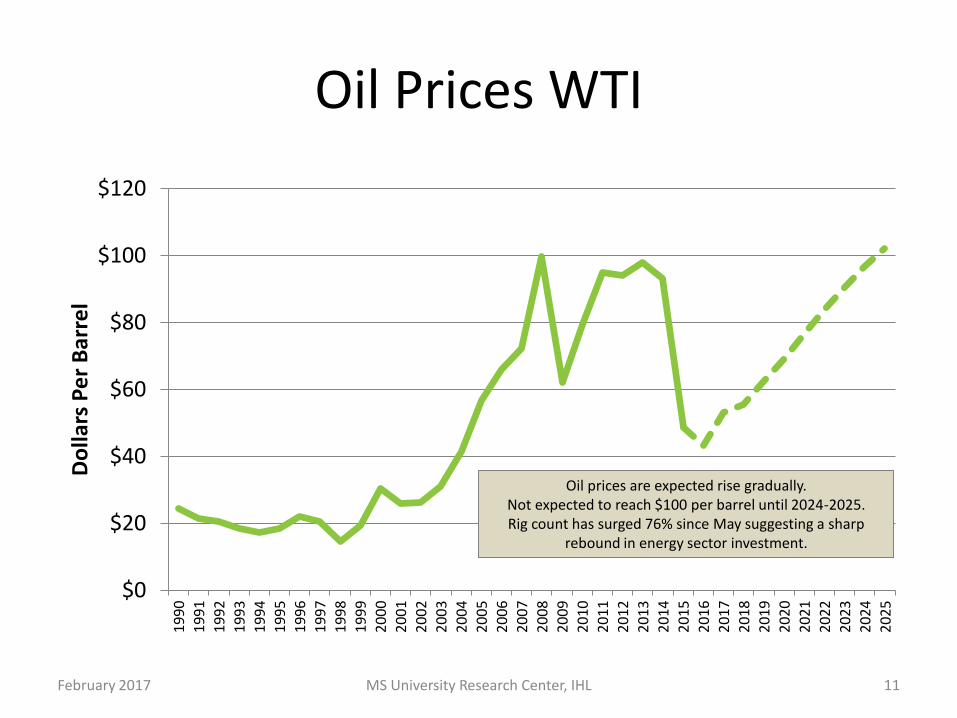
Oil Prices WTI
$0
$20
$40
$60
$80
$100
$1201
99
0
19
91
19
92
19
93
19
94
19
95
19
96
19
97
19
98
19
99
20
00
20
01
20
02
20
03
20
04
20
05
20
06
20
07
20
08
20
09
20
10
20
11
20
12
20
13
20
14
20
15
20
16
20
17
20
18
20
19
20
20
20
21
20
22
20
23
20
24
20
25
Do
llars
Pe
r B
arre
l
February 2017 MS University Research Center, IHL 11
Oil prices are expected rise gradually. Not expected to reach $100 per barrel until 2024-2025.Rig count has surged 76% since May suggesting a sharp
rebound in energy sector investment.

US Light Vehicle Sales
9.00
11.00
13.00
15.00
17.00
19.00
21.00
23.00Ja
n-0
5
Jan
-06
Jan
-07
Jan
-08
Jan
-09
Jan
-10
Jan
-11
Jan
-12
Jan
-13
Jan
-14
Jan
-15
Jan
-16
Jan
-17
Mill
ion
s o
f U
nit
s, S
AA
R
Monthly Annual Average
MS University Research Center, IHL 12February 2017
Average sales for 2013 -- 15.5 million unitsAverage sales for 2014 – 16.5 million unitsAverage Sales for 2015 – 17.4 million unitsAverage Sales for 2016 – 17.5 million units
Sales have stabilized at about 17.5 million units.

US Consumer Sentiment
0.0
20.0
40.0
60.0
80.0
100.0
120.0
19
90
19
92
19
94
19
96
19
98
20
00
20
02
20
04
20
06
20
08
20
10
20
12
20
14
20
16
Annual Average
0.0
20.0
40.0
60.0
80.0
100.0
120.0
Jan-14 Jan-15 Jan-16 Jan-17
Monthly
February 2017 MS University Research Center, IHL 13
Sentiment returned to the Pre-recession level in 2015.
January 2017 Index is at the highest level since January 2004. The Index was very close to this level in January 2015, but weakened
over the course of the year.

National Federation of Independent Businesses Optimism Index
Jan
-07
Jan
-08
Jan
-09
Jan
-10
Jan
-11
Jan
-12
Jan
-13
Jan
-14
Jan
-15
Jan
-16
Jan
-17
80
85
90
95
100
105
110
NFI
B O
pti
mis
m In
dex
, 19
86
=10
0
MS University Research Center, IHL 14February 2017
Small Businesses confidence has risen sharply in recent months, reaching the highest level since 2004 fueled by the prospects of lower taxes and reduced regulations.

Year-Over-Year Growth in Real Personal Income Less Transfer Payments: United States
by Quarter
-8%
-6%
-4%
-2%
0%
2%
4%
6%
8%
10%
Mar
-60
Mar
-62
Mar
-64
Mar
-66
Mar
-68
Mar
-70
Mar
-72
Mar
-74
Mar
-76
Mar
-78
Mar
-80
Mar
-82
Mar
-84
Mar
-86
Mar
-88
Mar
-90
Mar
-92
Mar
-94
Mar
-96
Mar
-98
Mar
-00
Mar
-02
Mar
-04
Mar
-06
Mar
-08
Mar
-10
Mar
-12
Mar
-14
Mar
-16
February 2017 MS University Research Center, IHL 15
Gray Areas Represent National Recessions
Declines are characteristic of recessions. While the series weakened in 2015 & 2016,
it remains well into positive territory.

US Employment Cost IndexWage and Salaries for All Civilian Workers
Growth Over The Prior Year by Quarter
0.0%
0.5%
1.0%
1.5%
2.0%
2.5%
3.0%
3.5%
4.0%
Mar
-01
Dec
-01
Sep
-02
Jun
-03
Mar
-04
Dec
-04
Sep
-05
Jun
-06
Mar
-07
Dec
-07
Sep
-08
Jun
-09
Mar
-10
Dec
-10
Sep
-11
Jun
-12
Mar
-13
Dec
-13
Sep
-14
Jun
-15
Mar
-16
Dec
-16
February 2017 MS University Research Center, IHL 16
Despite gains in recent years, wage growth remains well below
pre-recession levels.

Population Index
0
50
100
150
200
250
300
3501
96
0
19
63
19
66
19
69
19
72
19
75
19
78
19
81
19
84
19
87
19
90
19
93
19
96
19
99
20
02
20
05
20
08
20
11
20
14
20
17
20
20
20
23
20
26
20
29
20
32
20
35
20
38
20
41
20
44
19
60
= 1
00
US SE (excl. MS) MS
February 2017 MS University Research Center, IHL 17
Population is indexed to 1960 to allow all three regions to appear on the same graph. Comparisons can then be made by the slope of each line. Both the US and SE are growing at a much faster pace than MS. Current projections show this trend continuing for the foreseeable future.
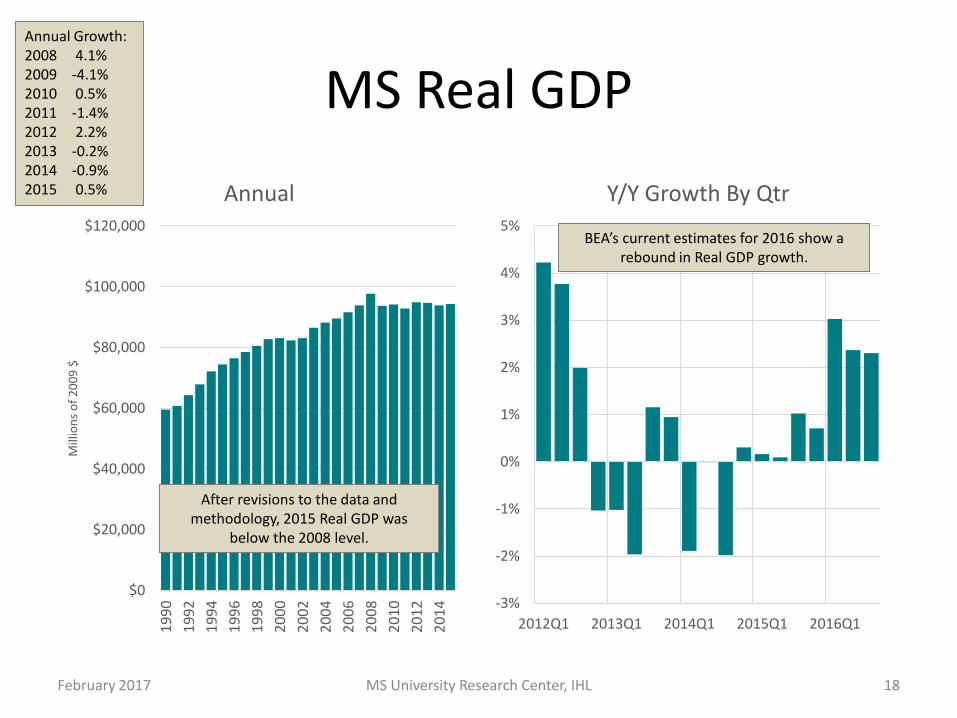
MS Real GDP
$0
$20,000
$40,000
$60,000
$80,000
$100,000
$120,000
19
90
19
92
19
94
19
96
19
98
20
00
20
02
20
04
20
06
20
08
20
10
20
12
20
14
Mill
ion
s o
f 2
00
9 $
Annual
-3%
-2%
-1%
0%
1%
2%
3%
4%
5%
2012Q1 2013Q1 2014Q1 2015Q1 2016Q1
Y/Y Growth By Qtr
February 2017 MS University Research Center, IHL 18
After revisions to the data and methodology, 2015 Real GDP was
below the 2008 level.
BEA’s current estimates for 2016 show a rebound in Real GDP growth.
Annual Growth: 2008 4.1%2009 -4.1%2010 0.5%2011 -1.4%2012 2.2%2013 -0.2%2014 -0.9%2015 0.5%

96
98
100
102
104
106
108
110
112
Jan-07 Jan-08 Jan-09 Jan-10 Jan-11 Jan-12 Jan-13 Jan-14 Jan-15 Jan-16
Ind
ex 2
00
4=
100
MS Index of Coincident Indicators
19MS University Research Center, IHLFebruary 2017
The MSCI stalled in 2016. The index is largely an indicator of the labor market for the state.
The Mississippi Index of Coincident Indicators reflects economic conditions existing in a given month. The index is constructed by the Federal Reserve Bank of Philadelphia and re-indexed to 2004. The Index is based on changes in nonfarm employment, the unemployment rate, average manufacturing workweek length and wage and salary disbursements.
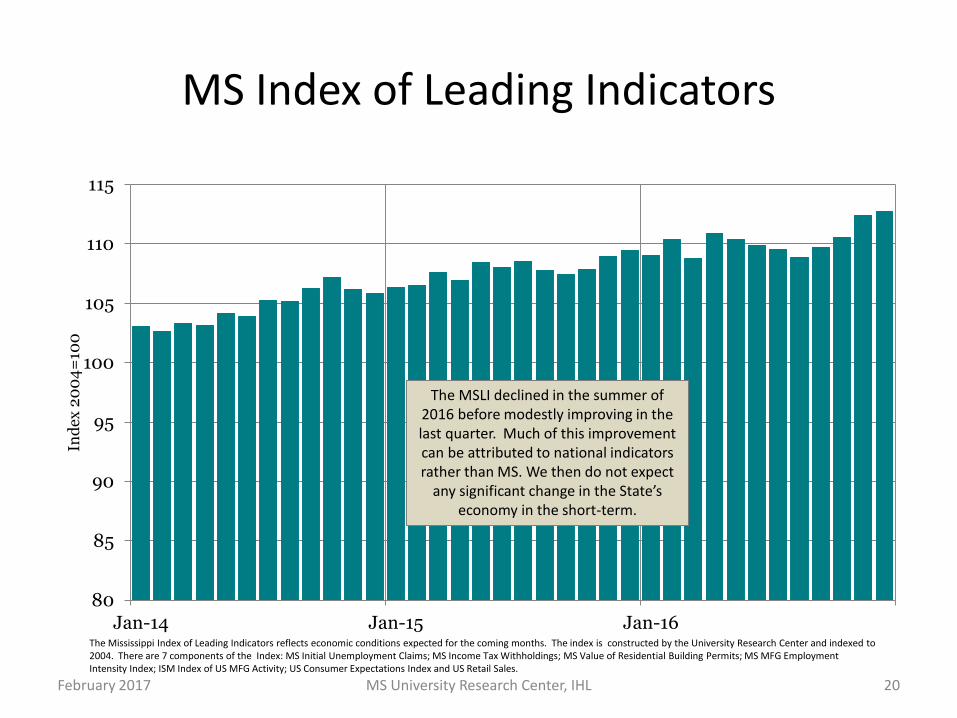
MS Index of Leading Indicators
80
85
90
95
100
105
110
115
Jan-14 Jan-15 Jan-16
Ind
ex 2
00
4=
100
20MS University Research Center, IHL
The MSLI declined in the summer of 2016 before modestly improving in the last quarter. Much of this improvement can be attributed to national indicators rather than MS. We then do not expect
any significant change in the State’s economy in the short-term.
February 2017
The Mississippi Index of Leading Indicators reflects economic conditions expected for the coming months. The index is constructed by the University Research Center and indexed to 2004. There are 7 components of the Index: MS Initial Unemployment Claims; MS Income Tax Withholdings; MS Value of Residential Building Permits; MS MFG Employment Intensity Index; ISM Index of US MFG Activity; US Consumer Expectations Index and US Retail Sales.
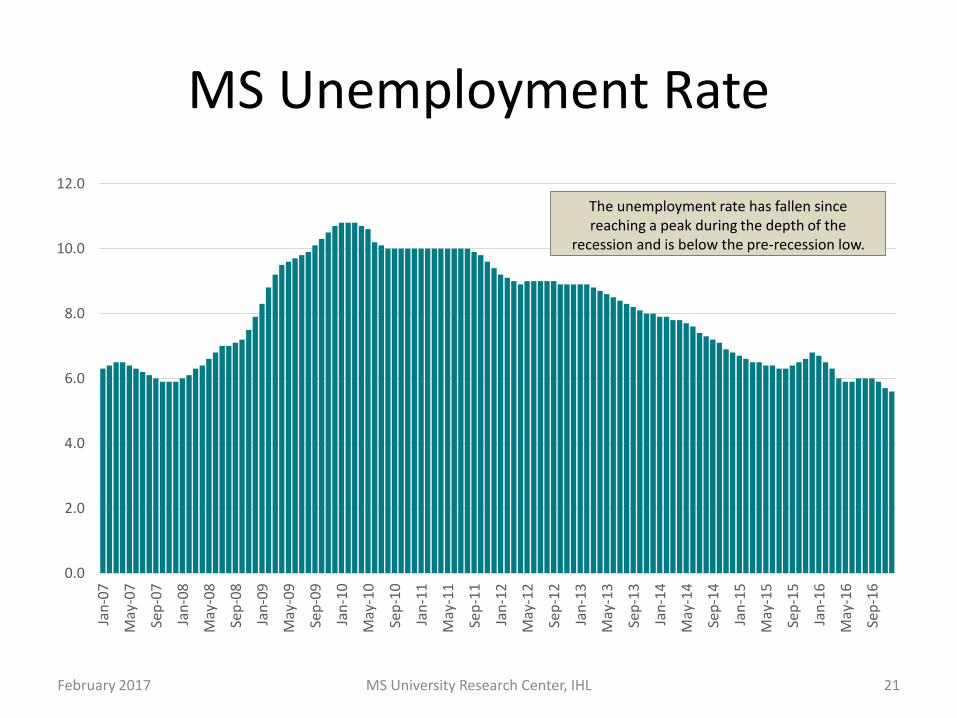
MS Unemployment Rate
0.0
2.0
4.0
6.0
8.0
10.0
12.0
Jan
-07
May
-07
Sep
-07
Jan
-08
May
-08
Sep
-08
Jan
-09
May
-09
Sep
-09
Jan
-10
May
-10
Sep
-10
Jan
-11
May
-11
Sep
-11
Jan
-12
May
-12
Sep
-12
Jan
-13
May
-13
Sep
-13
Jan
-14
May
-14
Sep
-14
Jan
-15
May
-15
Sep
-15
Jan
-16
May
-16
Sep
-16
February 2017 MS University Research Center, IHL 21
The unemployment rate has fallen since reaching a peak during the depth of the
recession and is below the pre-recession low.
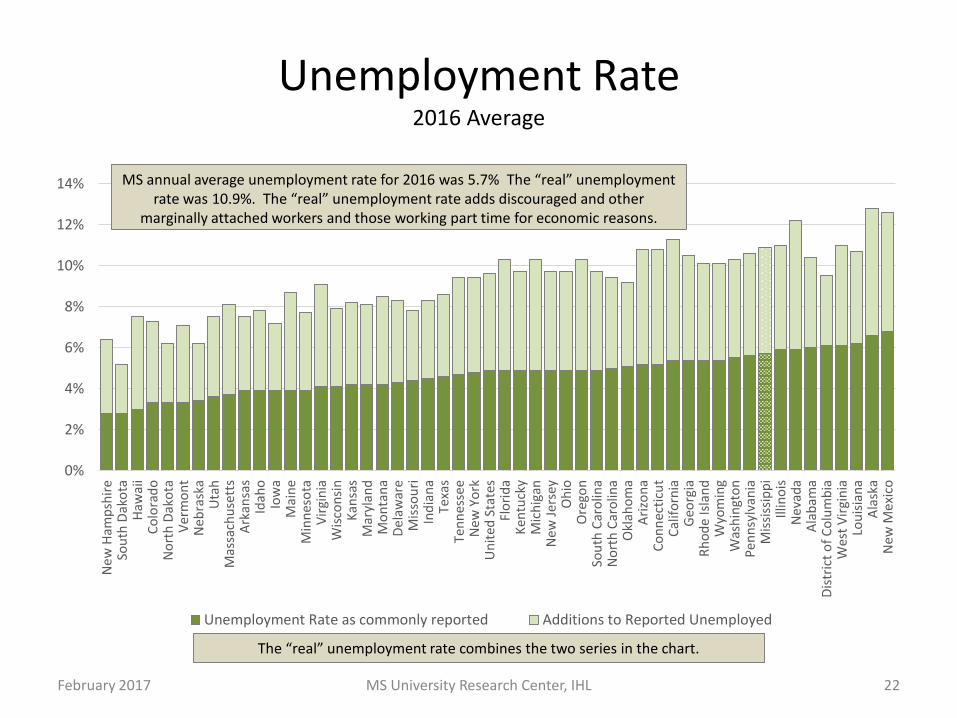
Unemployment Rate2016 Average
0%
2%
4%
6%
8%
10%
12%
14%
New
Ham
psh
ire
Sou
th D
ako
taH
awai
iC
olo
rad
oN
ort
h D
ako
taV
erm
on
tN
ebra
ska
Uta
hM
assa
chu
sett
sA
rkan
sas
Idah
oIo
wa
Mai
ne
Min
nes
ota
Vir
gin
iaW
isco
nsi
nK
ansa
sM
aryl
and
Mo
nta
na
Del
awar
eM
isso
uri
Ind
ian
aTe
xas
Ten
nes
see
New
Yo
rkU
nit
ed S
tate
sFl
ori
da
Ken
tuck
yM
ich
igan
New
Jer
sey
Oh
ioO
rego
nSo
uth
Car
olin
aN
ort
h C
aro
lina
Okl
aho
ma
Ari
zon
aC
on
nec
ticu
tC
alif
orn
iaG
eorg
iaR
ho
de
Isla
nd
Wyo
min
gW
ash
ingt
on
Pen
nsy
lvan
iaM
issi
ssip
pi
Illin
ois
Nev
ada
Ala
bam
aD
istr
ict
of
Co
lum
bia
Wes
t V
irgi
nia
Lou
isia
na
Ala
ska
New
Mex
ico
Unemployment Rate as commonly reported Additions to Reported Unemployed
February 2017 MS University Research Center, IHL 22
MS annual average unemployment rate for 2016 was 5.7% The “real” unemployment rate was 10.9%. The “real” unemployment rate adds discouraged and other
marginally attached workers and those working part time for economic reasons.
The “real” unemployment rate combines the two series in the chart.

MS Initial Unemployment Claims
-
50,000
100,000
150,000
200,000
250,000
300,000
19
90
19
92
19
94
19
96
19
98
20
00
20
02
20
04
20
06
20
08
20
10
20
12
20
14
20
16
Annual Average
0
2,000
4,000
6,000
8,000
10,000
12,000
Jan-14 Jan-15 Jan-16
3-Month Moving AverageSeasonally Adjusted
February 2017 MS University Research Center, IHL 23
Claims have trended down and are at historically low levels.
Claims fell in the last quarter. Declining claims mean fewer lay-offs.
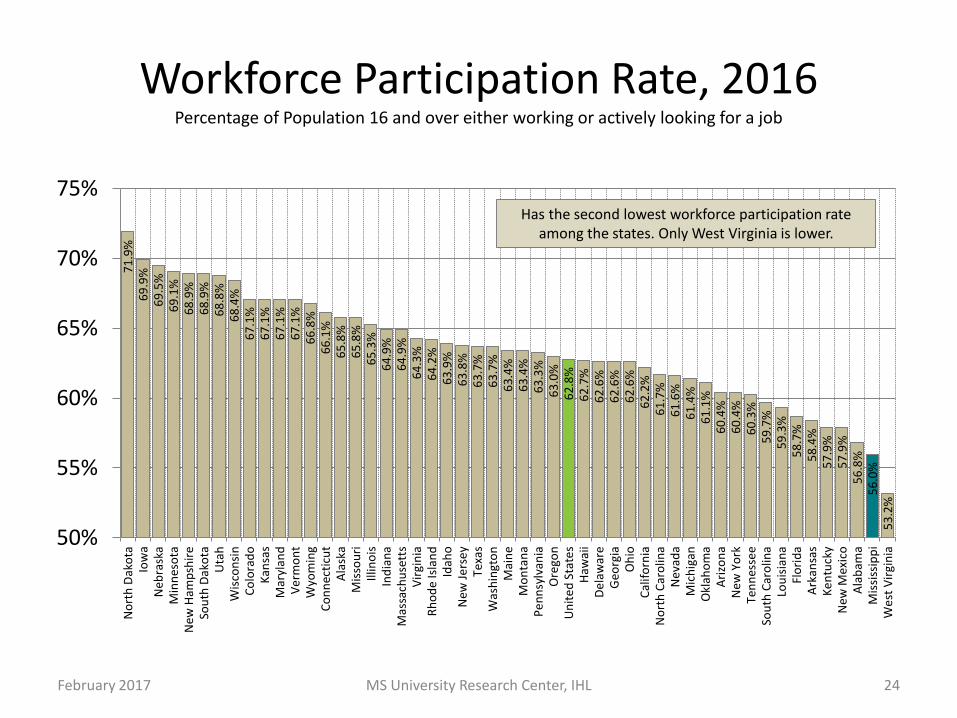
Workforce Participation Rate, 2016Percentage of Population 16 and over either working or actively looking for a job
71
.9%
69
.9%
69
.5%
69
.1%
68
.9%
68
.9%
68
.8%
68
.4%
67
.1%
67
.1%
67
.1%
67
.1%
66
.8%
66
.1%
65
.8%
65
.8%
65
.3%
64
.9%
64
.9%
64
.3%
64
.2%
63
.9%
63
.8%
63
.7%
63
.7%
63
.4%
63
.4%
63
.3%
63
.0%
62
.8%
62
.7%
62
.6%
62
.6%
62
.6%
62
.2%
61
.7%
61
.6%
61
.4%
61
.1%
60
.4%
60
.4%
60
.3%
59
.7%
59
.3%
58
.7%
58
.4%
57
.9%
57
.9%
56
.8%
56
.0%
53
.2%
50%
55%
60%
65%
70%
75%
No
rth
Dak
ota
Iow
aN
ebra
ska
Min
nes
ota
New
Ham
psh
ire
Sou
th D
ako
taU
tah
Wis
con
sin
Co
lora
do
Kan
sas
Mar
ylan
dV
erm
on
tW
yom
ing
Co
nn
ecti
cut
Ala
ska
Mis
sou
riIll
ino
isIn
dia
na
Mas
sach
use
tts
Vir
gin
iaR
ho
de
Isla
nd
Idah
oN
ew J
ers
ey
Texa
sW
ash
ingt
on
Mai
ne
Mo
nta
na
Pe
nn
sylv
ania
Ore
gon
Un
ite
d S
tate
sH
awai
iD
ela
war
eG
eorg
iaO
hio
Cal
ifo
rnia
No
rth
Car
olin
aN
evad
aM
ich
igan
Okl
aho
ma
Ari
zon
aN
ew Y
ork
Ten
nes
see
Sou
th C
aro
lina
Lou
isia
na
Flo
rid
aA
rkan
sas
Ke
ntu
cky
New
Mex
ico
Ala
bam
aM
issi
ssip
pi
We
st V
irgi
nia
February 2017 MS University Research Center, IHL 24
Has the second lowest workforce participation rate among the states. Only West Virginia is lower.

Workforce Participation Trends
• Participation has fallen in recent years for both the US and MS
• The gap between MS & US participation rate is highest among 16-19 year-olds & 45-65 year-olds
• MS lower participation rate due in a large part to higher incidence of disability– Census shows 10% of working age population in MS is disabled & not
in the work force; in the US the rate is 6%. The state’s higher rate translates into over 70 thousand people.
• MS participation rate exceeds that of the US for 35-44 year-old women; only category where this is the case
• See appendix for charts reflecting the above as well as other trends
February 2017 MS University Research Center, IHL 25
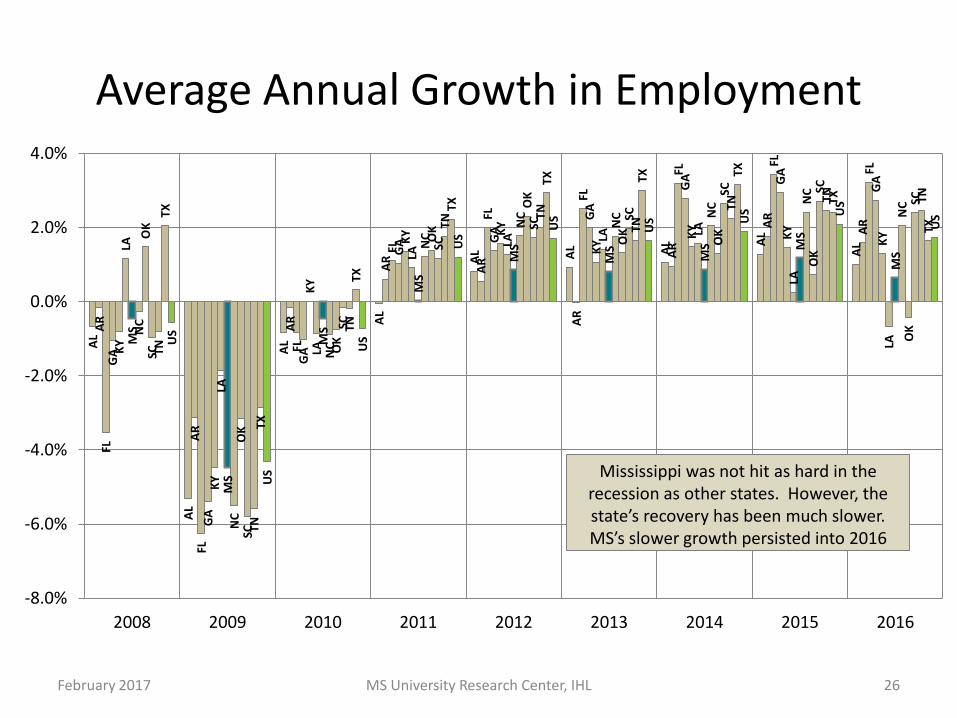
Average Annual Growth in EmploymentA
L
AL
AL
AL
AL AL AL A
L
AL
AR
AR
AR
AR
AR
AR
AR
AR
AR
FL
FL
FL
FL
FL
FL
FL
FL
FL
GA
GA
GA
GA G
A
GA
GA GA
GA
KY
KY
KY
KY K
Y
KY
KY
KY
KY
LA
LA
LA
LA
LA LA LA
LA
LAMS
MS
MS
MS
MS
MS
MS M
S
MS
NC
NC
NC
NC
NC
NC N
C NC
NC
OK
OK
OK
OK
OK
OK
OK
OK
OK
SC
SC
SC
SC
SC
SC
SC SC
SC
TN
TN
TN
TN
TN
TN
TN
TN TN
TX
TX
TX
TX
TX TX TX
TX
TX
US
US
US
US
US
US U
S US
US
-8.0%
-6.0%
-4.0%
-2.0%
0.0%
2.0%
4.0%
2008 2009 2010 2011 2012 2013 2014 2015 2016
February 2017 MS University Research Center, IHL 26
Mississippi was not hit as hard in the recession as other states. However, the state’s recovery has been much slower. MS’s slower growth persisted into 2016

Employment Relative to Pre-RecessionDecember 2016 as a Percentage Above (Below) December 2007
4.9%
-2.3%
-5%
0%
5%
10%
15%
20%
25%
No
rth
Dak
ota
Texa
sU
tah
Co
lora
do
Was
hin
gto
nM
assa
chu
sett
sC
alif
orn
iaSo
uth
Dak
ota
Ore
gon
New
Yo
rkTe
nn
esse
eFl
ori
da
Idah
oSo
uth
Car
olin
aG
eorg
iaN
ebra
ska
Ala
ska
Un
ite
d S
tate
sN
ort
h C
aro
lina
Min
nes
ota
Vir
gin
iaH
awai
iD
ela
war
eM
on
tan
aM
aryl
and
Ke
ntu
cky
Okl
aho
ma
Iow
aN
ew H
amp
shir
eIn
dia
na
Ve
rmo
nt
Mic
hig
anLo
uis
ian
aA
rkan
sas
Wis
con
sin
Pe
nn
sylv
ania
Mis
sou
riA
rizo
na
Oh
ioN
evad
aR
ho
de
Isla
nd
Illin
ois
Kan
sas
New
Je
rse
yW
est
Vir
gin
iaC
on
nec
ticu
tA
lab
ama
Mis
siss
ipp
iN
ew M
exic
oM
ain
e
February 2017 MS University Research Center, IHL 27
MS is one of 8 states where the December 2016 employment was below that of December 2007. States rank from a high of 20.5% above to a low
of 5.6 below. MS is 2.3% below.

Annual AverageNonfarm Employment, 1950-2016
0
20,000
40,000
60,000
80,000
100,000
120,000
140,000
160,000
0
200
400
600
800
1,000
1,200
1,400
19
50
19
52
19
54
19
56
19
58
19
60
19
62
19
64
19
66
19
68
19
70
19
72
19
74
19
76
19
78
19
80
19
82
19
84
19
86
19
88
19
90
19
92
19
94
19
96
19
98
20
00
20
02
20
04
20
06
20
08
20
10
20
12
20
14
20
16
MS US
February 2017 MS University Research Center, IHL 28
MS grew at a relatively steady pace prior to 2000. Since 2000 the state has struggled to gain momentum or keep pace with the Nation. The Nation has especially outpaced the state since the
2008 recession.

Nonfarm Employment in MS
1,100
1,105
1,110
1,115
1,120
1,125
1,130
1,135
1,140
1,145
1,150
Jan-14 Jan-15 Jan-16
Thousands
29MS University Research Center, IHL
After fairly consistent gain in employment over the previous two
years, employment weakened substantially in late 2016. Average
annual growth for 2016 was 0.6%, half of the 1.2% growth observed in 2015.
Growth for 2014 was 0.9%
February 2017

MS Employment for Major Sectors
50
100
150
200
250
300
Tho
usa
nd
s
Manufacturing Retail Trade Health Care and Social Assistance Leisure and Hospitality Government
February 2017 MS University Research Center, IHL 30
MS’s slow growth over the past two decades has coincided with a movement away from manufacturing. That shift began in the 90s but was less apparent due to
growth in the casino industry. More people work in Government than any other major sector which has shown no upward momentum since the Great Recession

Where are the Jobs?Mississippi added an average 7,358 jobs in 2016 over 2015
-3,600
-1,092
-733
-375
-225
350
1,100
1,842
2,225
3,642
4,225
-4,000 -3,000 -2,000 -1,000 0 1,000 2,000 3,000 4,000 5,000
Professional Services
Financial Activities
Mining & logging
Other Services
Information
Construction
Manufacturing
Government
Education & Health Services
Leisure & Hospitality
Trade, Transportation & Utilities
February 2017 MS University Research Center, IHL 31

February 2017 MS University Research Center, IHL 32
Employment Gained (Lost) By County, 2015-2016
No change
Decline
Up to 250
251 to 500
Greater than 500

MS Residential Building PermitsNumber of Units
0
2000
4000
6000
8000
10000
12000
14000
16000
18000
20
00
20
01
20
02
20
03
20
04
20
05
20
06
20
07
20
08
20
09
20
10
20
11
20
12
20
13
20
14
20
15
20
16
Annual
0
100
200
300
400
500
600
700
Jan-14 Jan-15 Jan-16
3-Month Moving AverageSeasonally adjusted
February 2017 MS University Research Center, IHL 33
The momentum of 2015 did not continue into 2016. Permits fell through much of the year
before improving in the last quarter.
Graph may understate building activity as permits are not required in the county.
Between 2007 and 2011 there was a 73% decline in activity. Despite 5 years
of gain, we remain 56% below Peak

MS Construction Employment
0.0
10.0
20.0
30.0
40.0
50.0
60.0
70.0
19
90
19
92
19
94
19
96
19
98
20
00
20
02
20
04
20
06
20
08
20
10
20
12
20
14
20
16
Annual Average
40.0
42.0
44.0
46.0
48.0
50.0
52.0
54.0
Jan-14 Jan-15 Jan-16
MonthlySeasonally Adjusted
February 2017 MS University Research Center, IHL 34
Employment improved in much of 2016 but fell sharply in the last quarter.
After strong growth in the 90s, employment has generally trended downward. The notable exceptions are the period following Katrina &
during large projects of 2013-2014.

MS Manufacturing Employment
0.0
50.0
100.0
150.0
200.0
250.0
300.0
19
90
19
92
19
94
19
96
19
98
20
00
20
02
20
04
20
06
20
08
20
10
20
12
20
14
20
16
Annual Average
135.0
136.0
137.0
138.0
139.0
140.0
141.0
142.0
143.0
144.0
145.0
Jan-14 Jan-15 Jan-16
MonthlySeasonally Adjusted
February 2017 MS University Research Center, IHL 35
Much of the growth that took place in 2015 disappeared in 2016. The state
ended the year with a substantial decline in December.
MFG employment generally declined between 1994 and 2010. Since 2010
the state has experienced modest gains. In 2016, manufacturing
employment rose 0.8% or 1,100 jobs
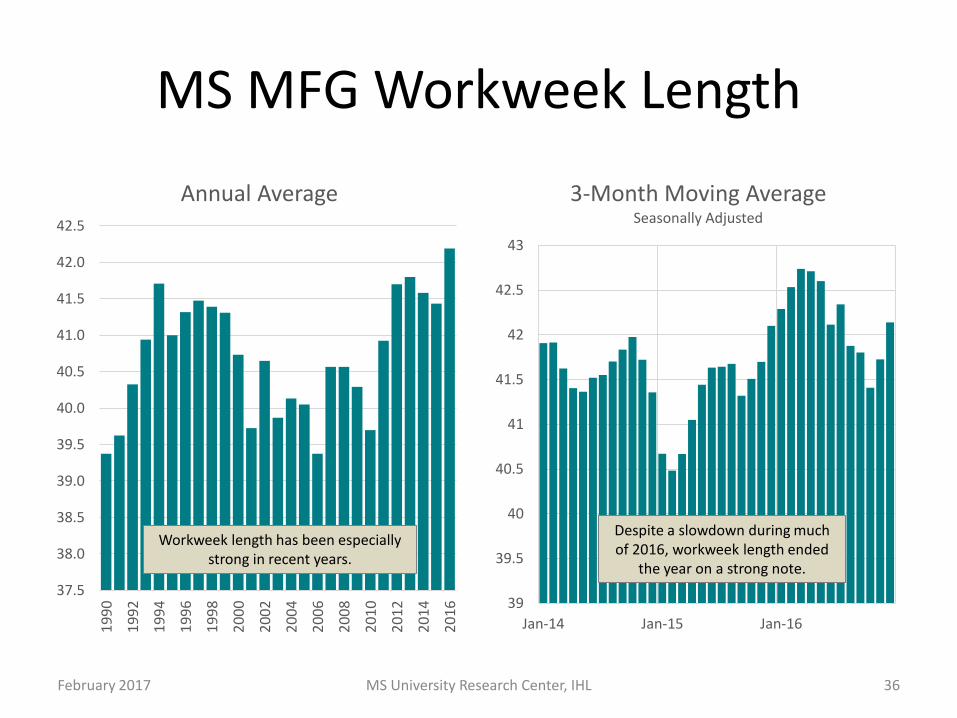
MS MFG Workweek Length
37.5
38.0
38.5
39.0
39.5
40.0
40.5
41.0
41.5
42.0
42.5
19
90
19
92
19
94
19
96
19
98
20
00
20
02
20
04
20
06
20
08
20
10
20
12
20
14
20
16
Annual Average
39
39.5
40
40.5
41
41.5
42
42.5
43
Jan-14 Jan-15 Jan-16
3-Month Moving AverageSeasonally Adjusted
February 2017 MS University Research Center, IHL 36
Despite a slowdown during much of 2016, workweek length ended
the year on a strong note.
Workweek length has been especially strong in recent years.
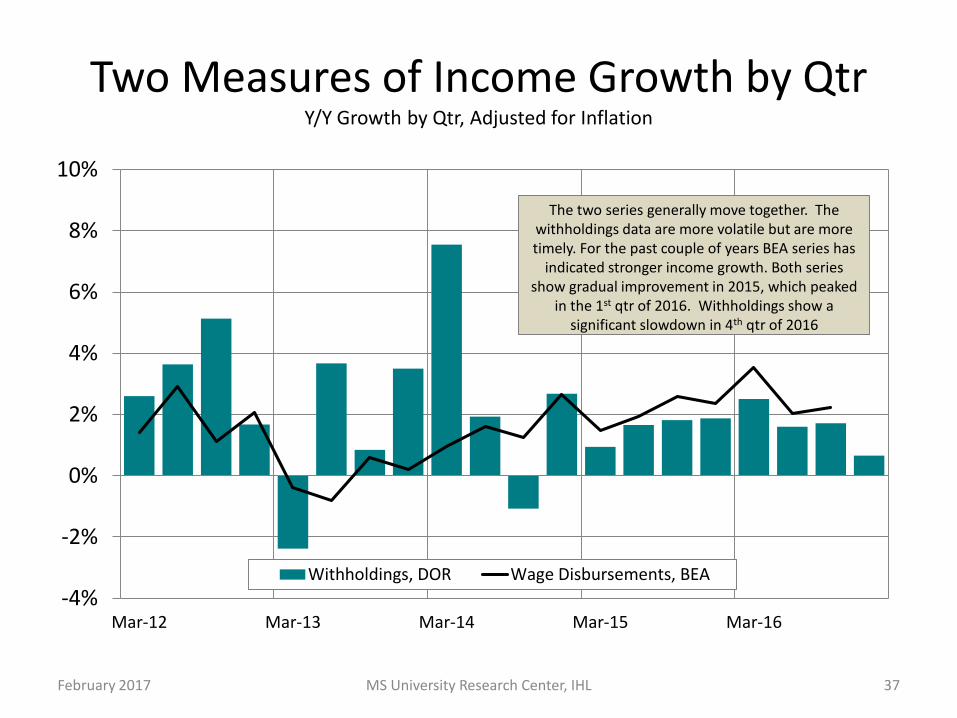
Two Measures of Income Growth by QtrY/Y Growth by Qtr, Adjusted for Inflation
-4%
-2%
0%
2%
4%
6%
8%
10%
Mar-12 Mar-13 Mar-14 Mar-15 Mar-16
Withholdings, DOR Wage Disbursements, BEA
February 2017 MS University Research Center, IHL 37
The two series generally move together. The withholdings data are more volatile but are more timely. For the past couple of years BEA series has
indicated stronger income growth. Both series show gradual improvement in 2015, which peaked
in the 1st qtr of 2016. Withholdings show a significant slowdown in 4th qtr of 2016

MS Gaming Revenue
-15.0%
-10.0%
-5.0%
0.0%
5.0%
10.0%
15.0%
20.0%
$0
$500
$1,000
$1,500
$2,000
$2,500
$3,000
$3,5001
99
5
19
96
19
97
19
98
19
99
20
00
20
01
20
02
20
03
20
04
20
05
20
06
20
07
20
08
20
09
20
10
20
11
20
12
20
13
20
14
20
15
20
16
Lin
e G
rap
h: A
nn
ual
% C
HG
Bar
Gra
ph
: Mill
ion
s o
f D
olla
rs
Coast River Total % CHG Total
February 2017 MS University Research Center, IHL 38
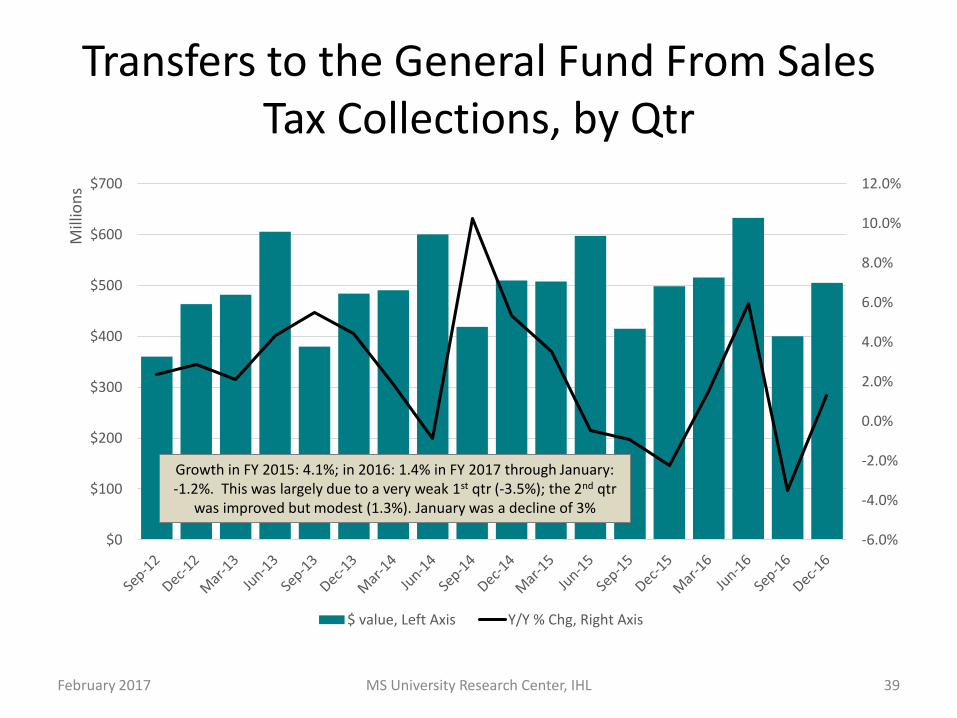
Transfers to the General Fund From Sales Tax Collections, by Qtr
-6.0%
-4.0%
-2.0%
0.0%
2.0%
4.0%
6.0%
8.0%
10.0%
12.0%
$0
$100
$200
$300
$400
$500
$600
$700
Mill
ion
s
$ value, Left Axis Y/Y % Chg, Right Axis
February 2017 MS University Research Center, IHL 39
Growth in FY 2015: 4.1%; in 2016: 1.4% in FY 2017 through January: -1.2%. This was largely due to a very weak 1st qtr (-3.5%); the 2nd qtr
was improved but modest (1.3%). January was a decline of 3%
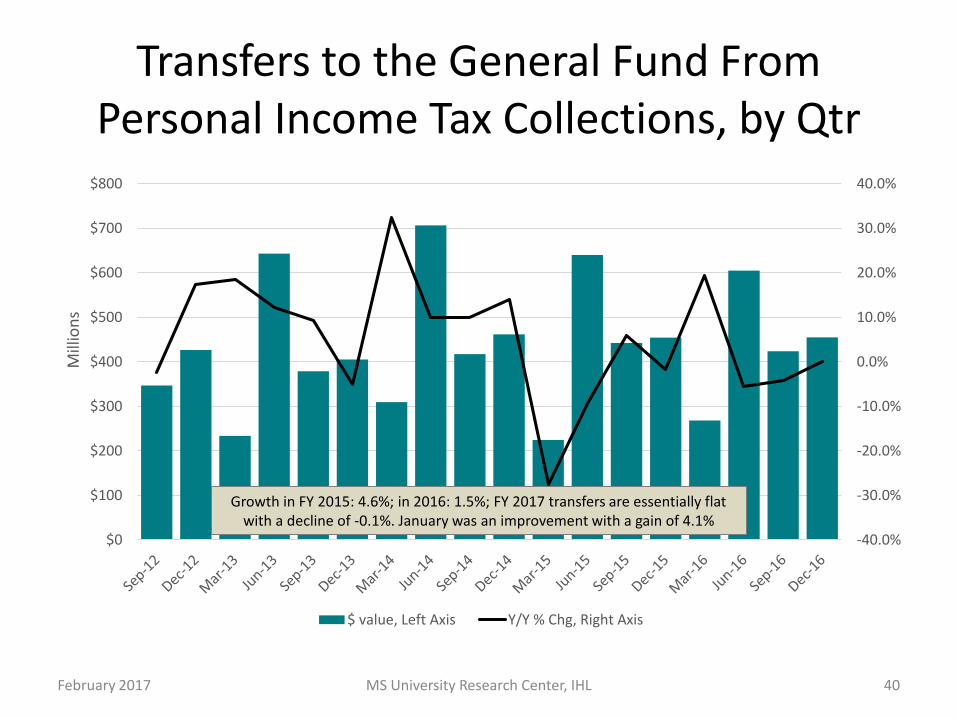
Transfers to the General Fund From Personal Income Tax Collections, by Qtr
-40.0%
-30.0%
-20.0%
-10.0%
0.0%
10.0%
20.0%
30.0%
40.0%
$0
$100
$200
$300
$400
$500
$600
$700
$800
Mill
ion
s
$ value, Left Axis Y/Y % Chg, Right Axis
February 2017 MS University Research Center, IHL 40
Growth in FY 2015: 4.6%; in 2016: 1.5%; FY 2017 transfers are essentially flat with a decline of -0.1%. January was an improvement with a gain of 4.1%

Transfers to the General Fund
-10%
-5%
0%
5%
10%
15%
$0
$1,000
$2,000
$3,000
$4,000
$5,000
$6,000
$7,000
2003 2004 2005 2006 2007 2008 2009 2010 2011 2012 2013 2014 2015 2016 2017 2018
Mill
ion
s
Additional Transfers from settlements, WCSR Fund, budget reduction, etc., Left Axis
Transfers from DOR and "Other than DOR" Left Axis
Y/Y % Chg in Tota GF, Right Axis
February 2017 MS University Research Center, IHL 41
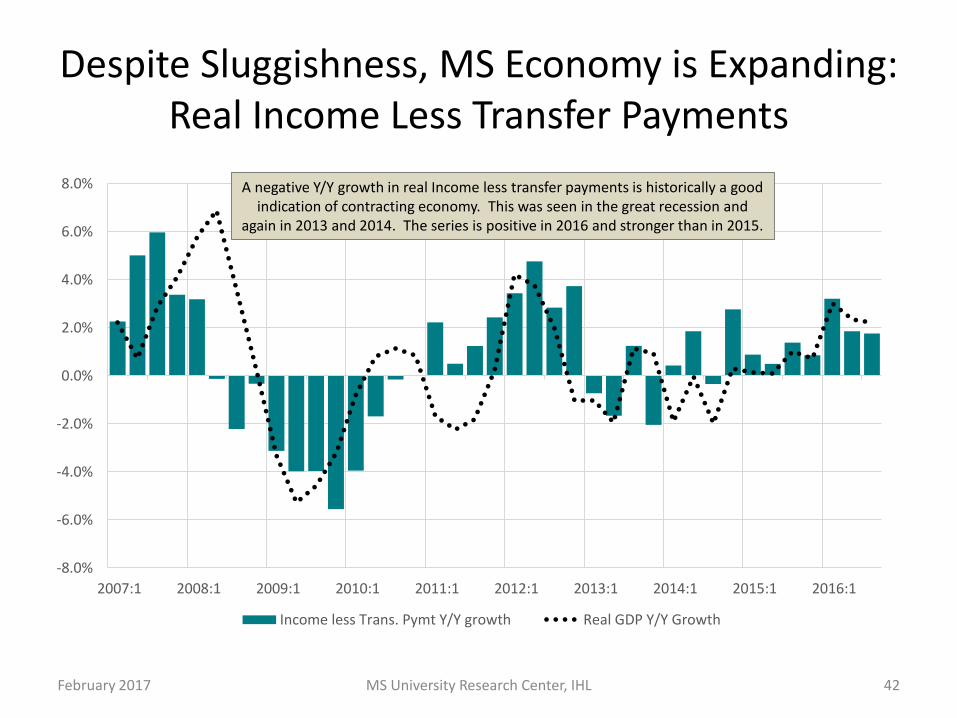
Despite Sluggishness, MS Economy is Expanding: Real Income Less Transfer Payments
-8.0%
-6.0%
-4.0%
-2.0%
0.0%
2.0%
4.0%
6.0%
8.0%
2007:1 2008:1 2009:1 2010:1 2011:1 2012:1 2013:1 2014:1 2015:1 2016:1
Income less Trans. Pymt Y/Y growth Real GDP Y/Y Growth
February 2017 MS University Research Center, IHL 42
A negative Y/Y growth in real Income less transfer payments is historically a good indication of contracting economy. This was seen in the great recession and
again in 2013 and 2014. The series is positive in 2016 and stronger than in 2015.
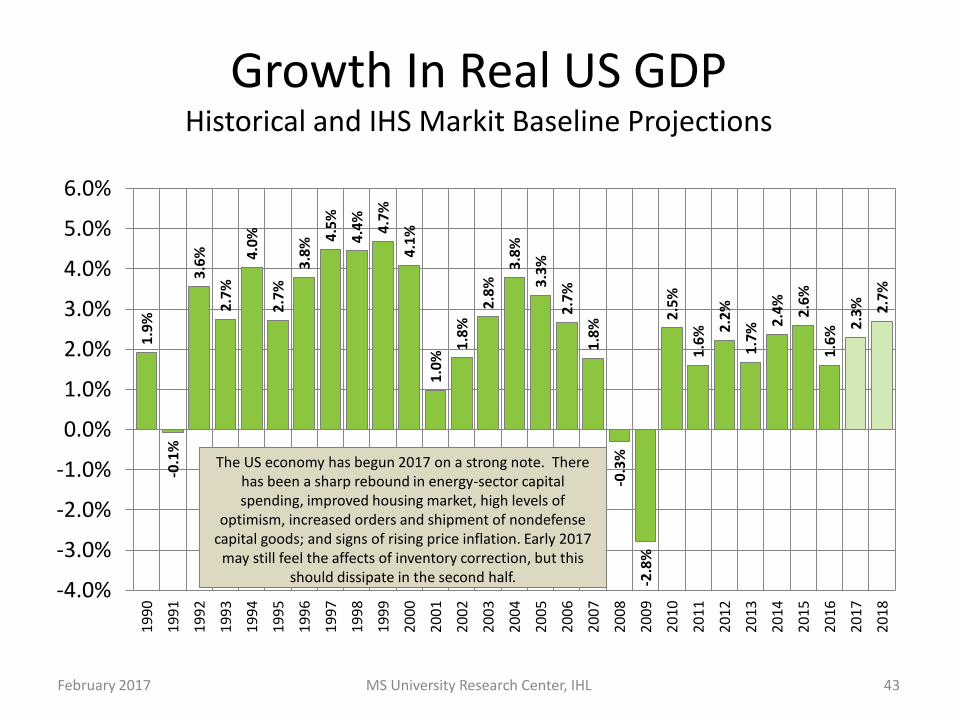
Growth In Real US GDPHistorical and IHS Markit Baseline Projections
1.9
%
-0.1
%
3.6
%
2.7
%
4.0
%
2.7
%
3.8
% 4.5
%
4.4
%
4.7
%
4.1
%
1.0
%
1.8
%
2.8
%
3.8
%
3.3
%
2.7
%
1.8
%
-0.3
%
-2.8
%
2.5
%
1.6
% 2.2
%
1.7
% 2.4
%
2.6
%
1.6
% 2.3
% 2.7
%
-4.0%
-3.0%
-2.0%
-1.0%
0.0%
1.0%
2.0%
3.0%
4.0%
5.0%
6.0%
19
90
19
91
19
92
19
93
19
94
19
95
19
96
19
97
19
98
19
99
20
00
20
01
20
02
20
03
20
04
20
05
20
06
20
07
20
08
20
09
20
10
20
11
20
12
20
13
20
14
20
15
20
16
20
17
20
18
MS University Research Center, IHL 43February 2017
The US economy has begun 2017 on a strong note. There has been a sharp rebound in energy-sector capital spending, improved housing market, high levels of
optimism, increased orders and shipment of nondefense capital goods; and signs of rising price inflation. Early 2017
may still feel the affects of inventory correction, but this should dissipate in the second half.
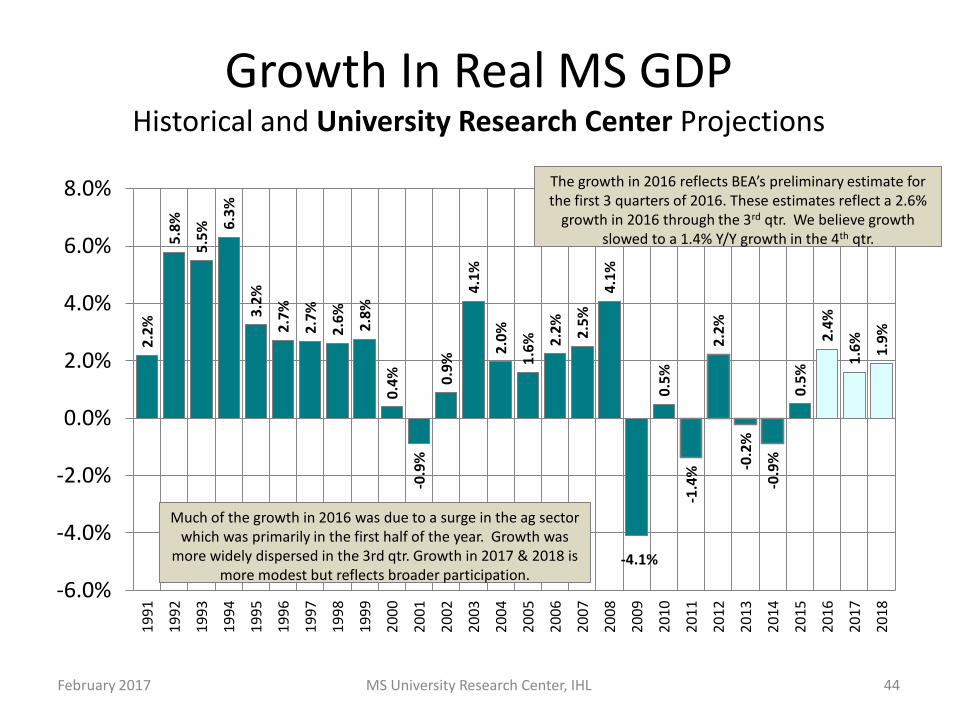
Growth In Real MS GDPHistorical and University Research Center Projections
2.2
%
5.8
%
5.5
% 6.3
%
3.2
%
2.7
%
2.7
%
2.6
%
2.8
%
0.4
%
-0.9
%
0.9
%
4.1
%
2.0
%
1.6
% 2.2
%
2.5
%
4.1
%
-4.1%
0.5
%
-1.4
%
2.2
%
-0.2
%
-0.9
%
0.5
%
2.4
%
1.6
%
1.9
%
-6.0%
-4.0%
-2.0%
0.0%
2.0%
4.0%
6.0%
8.0%
19
91
19
92
19
93
19
94
19
95
19
96
19
97
19
98
19
99
20
00
20
01
20
02
20
03
20
04
20
05
20
06
20
07
20
08
20
09
20
10
20
11
20
12
20
13
20
14
20
15
20
16
20
17
20
18
MS University Research Center, IHL 44February 2017
The growth in 2016 reflects BEA’s preliminary estimate for the first 3 quarters of 2016. These estimates reflect a 2.6%
growth in 2016 through the 3rd qtr. We believe growth slowed to a 1.4% Y/Y growth in the 4th qtr.
Much of the growth in 2016 was due to a surge in the ag sector which was primarily in the first half of the year. Growth was
more widely dispersed in the 3rd qtr. Growth in 2017 & 2018 is more modest but reflects broader participation.

Recap:
• US Economy has momentum in 2017– Risk of recession remains low
• MS has struggled since the great Recession.– 2016 is the 1st time the state has experienced 2 years
of consecutive growth since the recession– The strong headline growth of 2016 was driven by ag
volatility which will shave off growth in 2017– Growth in 2017 however will be more widespread and
will continue into 2018 at a modest pace.
• Despite a modest forecast, revenues have disappointed in FY 2017.
February 2017 MS University Research Center, IHL 45

APPENDIX
February 2017 MS University Research Center, IHL 46

Per Capita Personal Income2015
$6
8,7
04
$6
2,6
03
$5
9,9
49
$5
8,6
70
$5
6,1
47
$5
6,0
81
$5
5,9
72
$5
5,9
50
$5
5,9
05
$5
3,7
41
$5
2,0
52
$5
1,8
98
$5
0,8
99
$5
0,8
71
$5
0,2
95
$5
0,0
18
$4
9,7
45
$4
8,5
87
$4
8,5
44
$4
8,2
88
$4
8,1
12
$4
7,8
81
$4
7,6
33
$4
7,1
61
$4
6,9
47
$4
5,9
14
$4
5,9
02
$4
5,5
73
$4
4,4
29
$4
3,7
83
$4
3,5
66
$4
2,9
47
$4
2,8
12
$4
2,7
99
$4
2,3
00
$4
2,0
94
$4
1,9
40
$4
1,8
89
$4
1,8
09
$4
0,7
59
$4
0,3
06
$3
9,3
08
$3
9,1
56
$3
8,5
88
$3
8,3
92
$3
8,3
02
$3
8,2
52
$3
8,0
30
$3
7,9
38
$3
6,7
58
$3
4,7
71
$30,000
$35,000
$40,000
$45,000
$50,000
$55,000
$60,000
$65,000
$70,000C
on
nec
ticu
tM
assa
chu
sett
sN
ew J
ers
ey
New
Yo
rkA
lask
aW
yom
ing
Mar
ylan
dN
ort
h D
ako
taN
ew H
amp
shir
eC
alif
orn
iaV
irgi
nia
Was
hin
gto
nC
olo
rad
oM
inn
eso
taIll
ino
isR
ho
de
Isla
nd
Pe
nn
sylv
ania
Ve
rmo
nt
Neb
rask
aH
awai
iU
nit
ed
Sta
tes
Sou
th D
ako
taD
ela
war
eK
ansa
sTe
xas
Wis
con
sin
Iow
aO
klah
om
aFl
ori
da
Ore
gon
Oh
ioLo
uis
ian
aM
ich
igan
Mai
ne
Mis
sou
riTe
nn
esse
eIn
dia
na
Nev
ada
Mo
nta
na
No
rth
Car
olin
aG
eorg
iaU
tah
Ari
zon
aK
en
tuck
yId
aho
Sou
th C
aro
lina
Ark
ansa
sA
lab
ama
New
Mex
ico
We
st V
irgi
nia
Mis
siss
ipp
i
Per capita income is total personal income divided by total population.
February 2017 MS University Research Center, IHL 47

Per Capita Personal IncomeAdjusted for Cost of Living, 2015
$6
3,1
47
$
61
,14
8
$5
8,4
53
$
58
,29
6
$5
4,4
10
$
53
,58
1
$5
3,1
42
$
53
,11
9
$5
2,3
57
$
52
,12
2
$5
1,9
97
$
50
,83
3
$5
0,7
45
$
50
,73
3
$5
0,7
09
$
50
,67
7
$5
0,6
57
$
50
,58
0
$4
9,9
98
$
49
,94
5
$4
9,9
01
$
49
,15
8
$4
8,7
86
$
48
,59
9
$4
8,1
12
$
48
,01
1
$4
7,8
12
$
47
,31
5
$4
6,9
88
$
46
,74
5
$4
6,6
67
$
45
,88
6
$4
5,4
96
$
44
,83
2
$4
4,4
48
$
44
,38
3
$4
4,2
25
$
44
,07
7
$4
3,8
11
$
43
,71
7
$4
3,5
04
$
43
,31
4
$4
2,8
75
$
42
,32
3
$4
1,3
48
$
41
,34
2
$4
1,1
05
$
40
,61
8
$4
0,5
24
$
40
,10
5
$3
9,9
35
$30,000
$35,000
$40,000
$45,000
$50,000
$55,000
$60,000
$65,000
$70,000C
on
nec
ticu
tN
ort
h D
ako
taM
assa
chu
sett
sW
yom
ing
Sou
th D
ako
taN
ebra
ska
New
Ham
psh
ire
Ala
ska
New
Je
rse
yM
inn
eso
taK
ansa
sIo
wa
Mar
ylan
dV
irgi
nia
New
Yo
rkR
ho
de
Isla
nd
Pe
nn
sylv
ania
Okl
aho
ma
Was
hin
gto
nIll
ino
isC
olo
rad
oW
isco
nsi
nO
hio
Texa
sU
nit
ed
Sta
tes
Ve
rmo
nt
Cal
ifo
rnia
Mis
sou
riLo
uis
ian
aD
ela
war
eTe
nn
esse
eIn
dia
na
Mic
hig
anFl
ori
da
No
rth
Car
olin
aM
on
tan
aO
rego
nM
ain
eG
eorg
iaA
rkan
sas
Ke
ntu
cky
Ala
bam
aN
evad
aSo
uth
Car
olin
aW
est
Vir
gin
iaH
awai
iId
aho
Ari
zon
aU
tah
Mis
siss
ipp
iN
ew M
exic
o
Per capita income is total personal income divided by total population.
February 2017 MS University Research Center, IHL 48
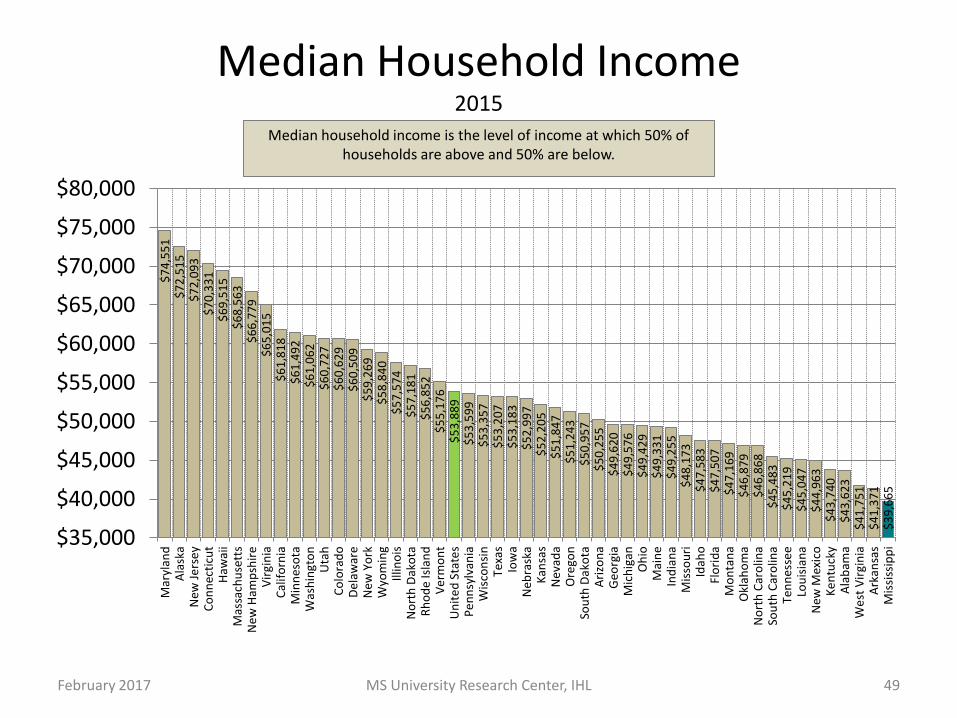
Median Household Income2015
$7
4,5
51
$7
2,5
15
$7
2,0
93
$7
0,3
31
$6
9,5
15
$6
8,5
63
$6
6,7
79
$6
5,0
15
$6
1,8
18
$6
1,4
92
$6
1,0
62
$6
0,7
27
$6
0,6
29
$6
0,5
09
$5
9,2
69
$5
8,8
40
$5
7,5
74
$5
7,1
81
$5
6,8
52
$5
5,1
76
$5
3,8
89
$5
3,5
99
$5
3,3
57
$5
3,2
07
$5
3,1
83
$5
2,9
97
$5
2,2
05
$5
1,8
47
$5
1,2
43
$5
0,9
57
$5
0,2
55
$4
9,6
20
$4
9,5
76
$4
9,4
29
$4
9,3
31
$4
9,2
55
$4
8,1
73
$4
7,5
83
$4
7,5
07
$4
7,1
69
$4
6,8
79
$4
6,8
68
$4
5,4
83
$4
5,2
19
$4
5,0
47
$4
4,9
63
$4
3,7
40
$4
3,6
23
$4
1,7
51
$4
1,3
71
$3
9,6
65
$35,000
$40,000
$45,000
$50,000
$55,000
$60,000
$65,000
$70,000
$75,000
$80,000M
aryl
and
Ala
ska
New
Je
rse
yC
on
nec
ticu
tH
awai
iM
assa
chu
sett
sN
ew H
amp
shir
eV
irgi
nia
Cal
ifo
rnia
Min
nes
ota
Was
hin
gto
nU
tah
Co
lora
do
De
law
are
New
Yo
rkW
yom
ing
Illin
ois
No
rth
Dak
ota
Rh
od
e Is
lan
dV
erm
on
tU
nit
ed
Sta
tes
Pe
nn
sylv
ania
Wis
con
sin
Texa
sIo
wa
Neb
rask
aK
ansa
sN
evad
aO
rego
nSo
uth
Dak
ota
Ari
zon
aG
eorg
iaM
ich
igan
Oh
ioM
ain
eIn
dia
na
Mis
sou
riId
aho
Flo
rid
aM
on
tan
aO
klah
om
aN
ort
h C
aro
lina
Sou
th C
aro
lina
Ten
nes
see
Lou
isia
na
New
Mex
ico
Ke
ntu
cky
Ala
bam
aW
est
Vir
gin
iaA
rkan
sas
Mis
siss
ipp
i
Median household income is the level of income at which 50% of households are above and 50% are below.
February 2017 MS University Research Center, IHL 49
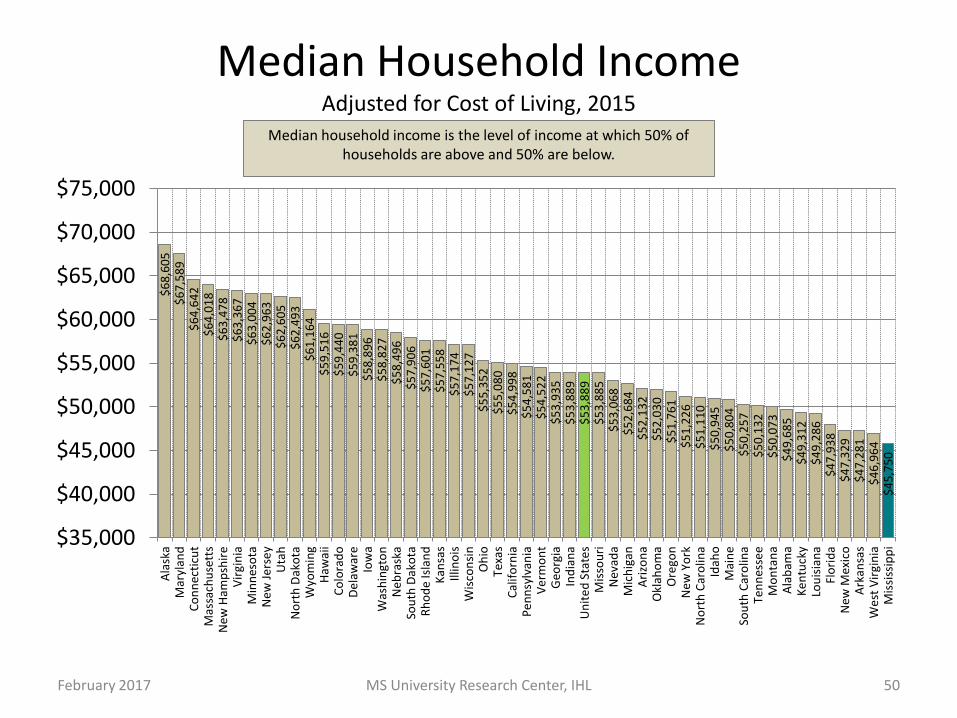
Median Household IncomeAdjusted for Cost of Living, 2015
$6
8,6
05
$
67
,58
9
$6
4,6
42
$
64
,01
8
$6
3,4
78
$
63
,36
7
$6
3,0
04
$
62
,96
3
$6
2,6
05
$
62
,49
3
$6
1,1
64
$
59
,51
6
$5
9,4
40
$
59
,38
1
$5
8,8
96
$
58
,82
7
$5
8,4
96
$
57
,90
6
$5
7,6
01
$
57
,55
8
$5
7,1
74
$
57
,12
7
$5
5,3
52
$
55
,08
0
$5
4,9
98
$
54
,58
1
$5
4,5
22
$
53
,93
5
$5
3,8
89
$
53
,88
9
$5
3,8
85
$
53
,06
8
$5
2,6
84
$
52
,13
2
$5
2,0
30
$
51
,76
1
$5
1,2
26
$
51
,11
0
$5
0,9
45
$
50
,80
4
$5
0,2
57
$
50
,13
2
$5
0,0
73
$
49
,68
5
$4
9,3
12
$
49
,28
6
$4
7,9
38
$
47
,32
9
$4
7,2
81
$
46
,96
4
$4
5,7
50
$35,000
$40,000
$45,000
$50,000
$55,000
$60,000
$65,000
$70,000
$75,000A
lask
aM
aryl
and
Co
nn
ecti
cut
Mas
sach
use
tts
New
Ham
psh
ire
Vir
gin
iaM
inn
eso
taN
ew J
ers
ey
Uta
hN
ort
h D
ako
taW
yom
ing
Haw
aii
Co
lora
do
De
law
are
Iow
aW
ash
ingt
on
Neb
rask
aSo
uth
Dak
ota
Rh
od
e Is
lan
dK
ansa
sIll
ino
isW
isco
nsi
nO
hio
Texa
sC
alif
orn
iaP
en
nsy
lvan
iaV
erm
on
tG
eorg
iaIn
dia
na
Un
ite
d S
tate
sM
isso
uri
Nev
ada
Mic
hig
anA
rizo
na
Okl
aho
ma
Ore
gon
New
Yo
rkN
ort
h C
aro
lina
Idah
oM
ain
eSo
uth
Car
olin
aTe
nn
esse
eM
on
tan
aA
lab
ama
Ke
ntu
cky
Lou
isia
na
Flo
rid
aN
ew M
exic
oA
rkan
sas
We
st V
irgi
nia
Mis
siss
ipp
i
Median household income is the level of income at which 50% of households are above and 50% are below.
February 2017 MS University Research Center, IHL 50
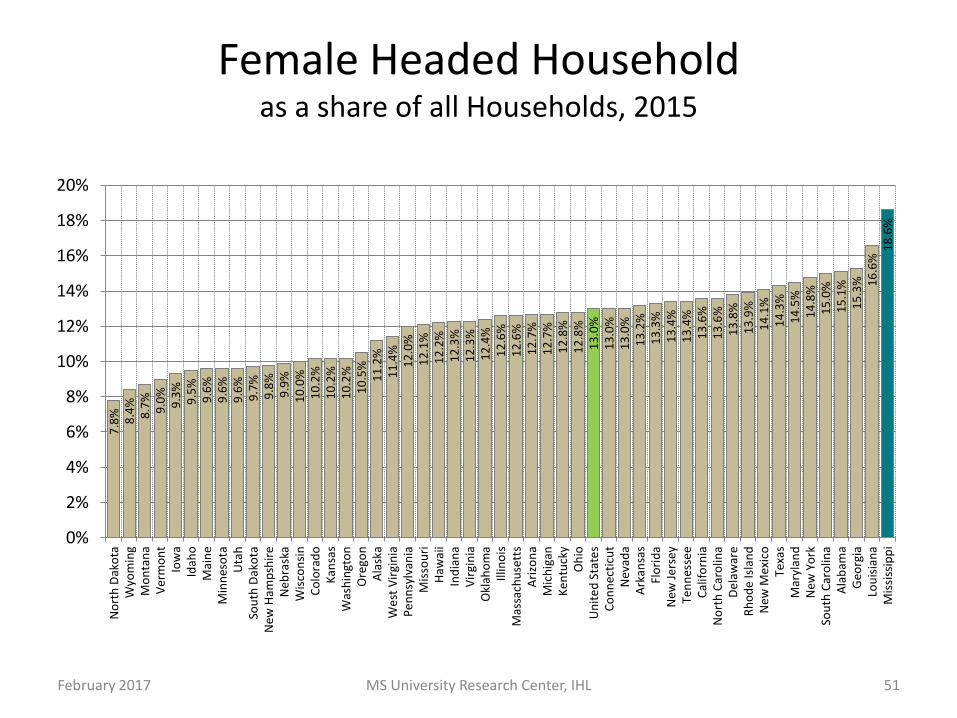
Female Headed Household as a share of all Households, 2015
7.8
% 8.4
%8
.7%
9.0
%9
.3%
9.5
%9
.6%
9.6
%9
.6%
9.7
%9
.8%
9.9
%1
0.0
%1
0.2
%1
0.2
%1
0.2
%1
0.5
%1
1.2
%1
1.4
%1
2.0
%1
2.1
%1
2.2
%1
2.3
%1
2.3
%1
2.4
%1
2.6
%1
2.6
%1
2.7
%1
2.7
%1
2.8
%1
2.8
%1
3.0
%1
3.0
%1
3.0
%1
3.2
%1
3.3
%1
3.4
%1
3.4
%1
3.6
%1
3.6
%1
3.8
%1
3.9
%1
4.1
%1
4.3
%1
4.5
%1
4.8
%1
5.0
%1
5.1
%1
5.3
% 16
.6%
18
.6%
0%
2%
4%
6%
8%
10%
12%
14%
16%
18%
20%
No
rth
Dak
ota
Wyo
min
gM
on
tan
aV
erm
on
tIo
wa
Idah
oM
ain
eM
inn
eso
taU
tah
Sou
th D
ako
taN
ew H
amp
shir
eN
ebra
ska
Wis
con
sin
Co
lora
do
Kan
sas
Was
hin
gto
nO
rego
nA
lask
aW
est
Vir
gin
iaP
en
nsy
lvan
iaM
isso
uri
Haw
aii
Ind
ian
aV
irgi
nia
Okl
aho
ma
Illin
ois
Mas
sach
use
tts
Ari
zon
aM
ich
igan
Ke
ntu
cky
Oh
ioU
nit
ed
Sta
tes
Co
nn
ecti
cut
Nev
ada
Ark
ansa
sFl
ori
da
New
Je
rse
yTe
nn
esse
eC
alif
orn
iaN
ort
h C
aro
lina
De
law
are
Rh
od
e Is
lan
dN
ew M
exic
oTe
xas
Mar
ylan
dN
ew Y
ork
Sou
th C
aro
lina
Ala
bam
aG
eorg
iaLo
uis
ian
aM
issi
ssip
pi
February 2017 MS University Research Center, IHL 51

Government DependenceShare of Total Personal Income From Transfer Payments and Government Earnings, 2015
12
.8%
14
.4%
14
.8%
14
.2%
13
.3%
12
.6%
14
.7%
15
.8%
15
.4%
14
.8%
14
.6%
13
.6%
15
.4%
17
.4%
15
.5%
15
.2%
19
.2%
19
.6%
17
.2%
17
.1%
12
.6% 17
.3%
20
.0%
17
.3%
18
.6%
17
.7%
17
.5%
13
.6%
13
.9% 2
0.6
%2
1.5
%2
0.1
%2
0.1
%2
0.3
%2
0.2
%2
0.0
%1
8.7
%2
0.2
%2
1.1
%2
0.9
%2
0.1
%2
2.6
%2
4.0
%2
2.8
%2
3.2
%1
5.7
%2
4.7
%1
5.9
%2
6.3
%2
8.2
%2
4.1
%
8.8
% 8.7
%9
.5%
10
.3%
11
.7%
12
.4%
10
.6%
9.8
%1
0.4
%1
1.5
%1
2.0
%1
3.1
%1
2.3
%1
0.7
%1
2.6
%1
3.3
% 9.5
%9
.0%
11
.5%
11
.6%
16
.2% 11
.9%
9.3
%1
2.5
%1
1.2
%1
2.2
%1
2.6
%1
6.6
%1
6.7
% 10
.2%
9.7
%1
1.1
%1
1.4
%1
1.3
%1
1.5
%1
1.7
%1
3.1
%1
1.7
%1
1.4
%1
2.6
%1
3.7
%1
2.1
%1
1.2
%1
3.8
%1
3.7
%2
2.1
%1
3.6
%2
3.3
%1
4.3
%1
3.2
%1
7.6
%
0%
5%
10%
15%
20%
25%
30%
35%
40%
45%
Co
nn
ecti
cut
New
Ham
psh
ire
Mas
sach
use
tts
New
Je
rse
yC
olo
rad
oN
ort
h D
ako
taTe
xas
Min
nes
ota
Illin
ois
Sou
th D
ako
taN
ebra
ska
Uta
hC
alif
orn
iaW
isco
nsi
nK
ansa
sW
ash
ingt
on
Pe
nn
sylv
ania
Ind
ian
aIo
wa
Nev
ada
Wyo
min
gU
nit
ed
Sta
tes
Flo
rid
aN
ew Y
ork
Idah
oG
eorg
iaO
klah
om
aV
irgi
nia
Mar
ylan
dTe
nn
esse
eM
ich
igan
Oh
ioM
isso
uri
Lou
isia
na
Rh
od
e Is
lan
dD
ela
war
eM
on
tan
aO
rego
nA
rizo
na
Ve
rmo
nt
No
rth
Car
olin
aM
ain
eA
rkan
sas
Sou
th C
aro
lina
Ala
bam
aH
awai
i*K
en
tuck
yA
lask
a*M
issi
ssip
pi
We
st V
irgi
nia
New
Mex
ico
February 2017 MS University Research Center, IHL 52
40.6% of Income in MS comes from the Government. 26.3 percent is from transfer payments and 14.4% is from government earnings. Only WV & NM are more dependent on the
government. MS has the highest share of income from transfer payments. These sources tend to grow slow and in the case of earnings have decreased in recent years.

Workforce Participation by Age, 2016
0.0%
20.0%
40.0%
60.0%
80.0%
100.0%
16 to 19 years 20 to 24 years 25 to 34 years 35 to 44 years 45 to 54 years 55 to 64 years 65 years andover
MS US
February 2017 MS University Research Center, IHL 53
-11.4
-5.6-3.6 -1.4
-10.6 -10.7
-4.6
-12.0
-10.0
-8.0
-6.0
-4.0
-2.0
0.0
16 to 19 years 20 to 24 years 25 to 34 years 35 to 44 years 45 to 54 years 55 to 64 years 65 years andover
MS-US Gap in Workforce Participation Rate by Age
The larger gap is due in part to higher incidence of disability.

Workforce Participation, Men
0.0%
20.0%
40.0%
60.0%
80.0%
100.0%
20 to 24 years 25 to 34 years 35 to 44 years 45 to 54 years 55 to 64 years 65 years and over
MS US
February 2017 MS University Research Center, IHL 54
-3.7% -4.9% -4.6%
-10.1%-13.0%
-6.1%
-15.0%
-10.0%
-5.0%
0.0%
20 to 24 years 25 to 34 years 35 to 44 years 45 to 54 years 55 to 64 years 65 years and over
MS-US Gap in Workforce Participation Rate, Men

Workforce Participation, Women
0.0%
20.0%
40.0%
60.0%
80.0%
100.0%
20 to 24 years 25 to 34 years 35 to 44 years 45 to 54 years 55 to 64 years 65 years and over
MS US
February 2017 MS University Research Center, IHL 55
-7.0%-1.7%
1.9%
-10.6% -8.4%-3.3%
-15.0%
-10.0%
-5.0%
0.0%
5.0%
20 to 24 years 25 to 34 years 35 to 44 years 45 to 54 years 55 to 64 years 65 years and over
MS-US Gap in Workforce Participation Rate, Women

Workforce Participation In MS, 2016
0%
10%
20%
30%
40%
50%
60%
70%
80%
90%
100%
20 to 24years
25 to 34years
35 to 44years
45 to 54years
55 to 64years
65 yearsand over
By Gender and Age
Men Women
55.7% 56.5%
60.8%
51.7%
62.2%
58.3%
49.5%
54.9%
0%
10%
20%
30%
40%
50%
60%
70%
By Race and Gender
February 2017 MS University Research Center, IHL 56
The participation rate is higher for men for all age cohorts
There is very little difference between white and nonwhite. The lowest participation rate is
among white women.