legislative energy horizon institute - plug-in electric vehicles and
TRANSCRIPT

ww
w.in
l.gov
Legislative Energy Horizon Institute -Plug-in Electric Vehicles and Charging Infrastructure
Jim Francfort Pacific Northwest National LaboratoryRichland, WashingtonAugust 2015
This presentation does not contain any proprietary, confidential, or otherwise restricted information INL/MIS-15-35917
Idaho National Laboratory
• U.S. Department of Energy (DOE) laboratory • 890 square mile site with 4,000 staff• Support DOE’s strategic goal:
– Increase U.S. energy security and reduce the nation’s dependence on foreign oil
• Multi-program DOE laboratory– Nuclear Energy– Fossil, Biomass, Wind, Geothermal and Hydropower
Energy– Advanced Vehicle Testing Activity & Battery Testing– Homeland Security and Cyber Security
Bio-massBio-mass
NuclearHydropowerHydropower
WindWind
2

Vehicle / Infrastructure Testing Experience• Since 1994, INL staff have benchmarked PEVs with data loggers in the
field, and on closed test tracks and dynamometers• INL has accumulated 250 million PEV miles from 27,000 electric drive
vehicles and 16,600 charging units • Currently, approximately 100 PEV, HEVs, CNG and advanced diesel
vehicles in track, dyno and field testing: BMWs, KIAs, Fords, GMs, Nissans, Smarts, Mitsubishi, VWs, Hondas, Hyundai, Toyotas
– EV Project: 8,228 Leafs, Volts and Smarts, 12,363 EVSE and DCFC• 4.2 million charge events, 124 million test miles. At one point,
1 million test miles every 5 days– Ford, GM, Toyota and Honda requested INL support identifying
electric vehicle miles traveled (eVMT) for 15,721 new PHEVs, EREVs and BEVs
• Total vehicle miles traveled (VMT): 158 million miles• INL also tests HEVs, NEVs, HICEs, charging infrastructure and other
advanced technology vehicles with petroleum reduction technologies3

Nomenclature• PEV (plug-in electric vehicle) are defined as any vehicle that connects
or plugs in to the grid to fully recharge the traction battery pack– BEVs: battery electric vehicle (no internal combustion engine ICE)– EREVs: extended range electric vehicles (operates on electric first
and when electric range has been exceeded, operates like a normal hybrid electric vehicle)
– PHEVs: plug-in hybrid electric vehicles (blended electric and ICE operations in various schemes)
• Charging infrastructure– DCFC: high voltage DC fast chargers 440V– Level 2 EVSE: AC 208/240V electric vehicle supply equipment– Level 1 EVSE: AC 110/120V electric vehicle supply equipment
4

PEV Annual Sales
5
Sources:http://electricdrive.org/index.php?ht=d/sp/i/20952/pid/20952http://www.afdc.energy.gov/data/10314
• PEVs cumulative sales of 340,000 (June 2015)
• 119,000 PEVs were sold in 2014, 23% gain over 2013
• No less than 21 PEV models available in MY15 with up to 7 more expected this year
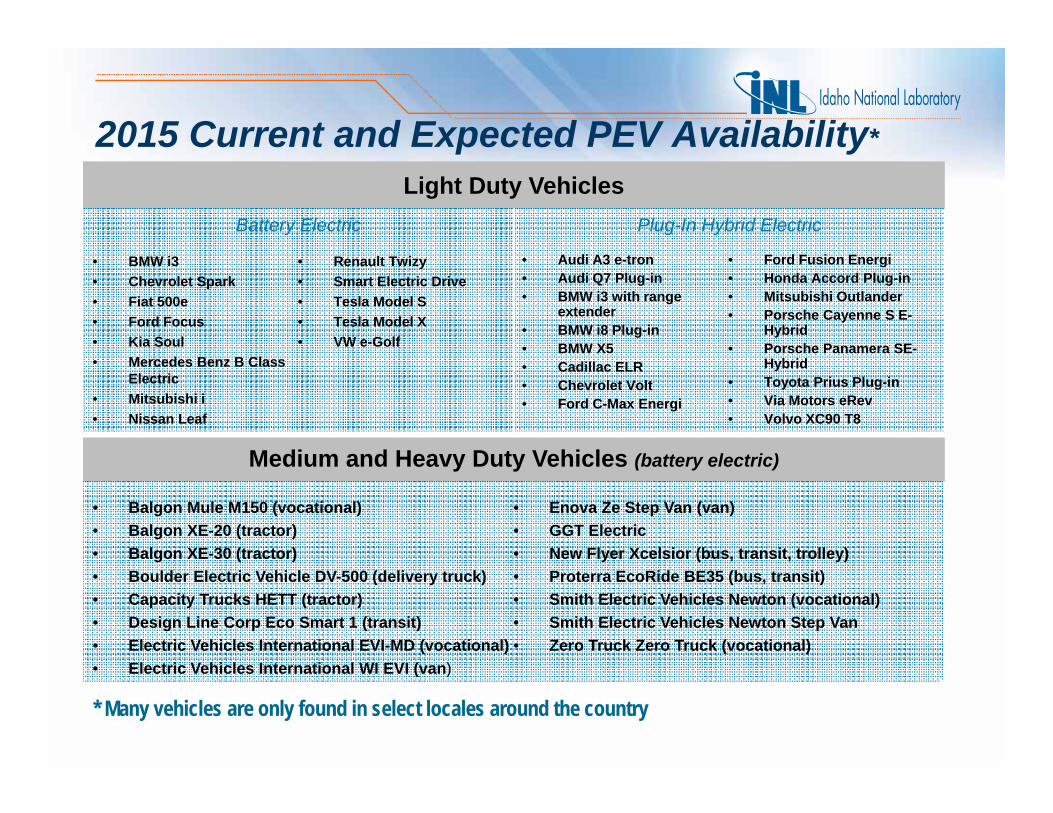
2015 Current and Expected PEV Availability*
Light Duty VehiclesBattery Electric Plug-In Hybrid Electric
Medium and Heavy Duty Vehicles (battery electric)
• BMW i3• Chevrolet Spark• Fiat 500e• Ford Focus• Kia Soul• Mercedes Benz B Class
Electric• Mitsubishi i• Nissan Leaf
• Renault Twizy• Smart Electric Drive• Tesla Model S• Tesla Model X• VW e-Golf
• Audi A3 e-tron• Audi Q7 Plug-in• BMW i3 with range
extender• BMW i8 Plug-in • BMW X5• Cadillac ELR• Chevrolet Volt• Ford C-Max Energi
• Ford Fusion Energi• Honda Accord Plug-in• Mitsubishi Outlander• Porsche Cayenne S E-
Hybrid• Porsche Panamera SE-
Hybrid• Toyota Prius Plug-in• Via Motors eRev• Volvo XC90 T8
• Balgon Mule M150 (vocational)• Balgon XE-20 (tractor)• Balgon XE-30 (tractor)• Boulder Electric Vehicle DV-500 (delivery truck)• Capacity Trucks HETT (tractor)• Design Line Corp Eco Smart 1 (transit)• Electric Vehicles International EVI-MD (vocational)• Electric Vehicles International WI EVI (van)
• Enova Ze Step Van (van)• GGT Electric• New Flyer Xcelsior (bus, transit, trolley)• Proterra EcoRide BE35 (bus, transit)• Smith Electric Vehicles Newton (vocational)• Smith Electric Vehicles Newton Step Van• Zero Truck Zero Truck (vocational)
* Many vehicles are only found in select locales around the country

PEV Challenges and Opportunities• Cut battery costs and improve life
and durability• Lower electric drive systems cost
Cost: more expensive to purchase than conventional vehicle counterparts
• Reduce vehicle weight• Develop high efficiency climate control
systems• Expand charging infrastructure
Range: all-electric vehicles are gener-ally less (1/4 – 1/3) than conventional
vehicles (unless you are rich)
• OEMs are expected to further expand PEV availability
Vehicle Availability: There is a lack of electric options in several vehicle classes (minivans, pickups, SUVs)
• Further consumer awareness and incentives, Workplace Charging Challenge, and training
Consumer Acceptance: Most consumers know little about PEVs
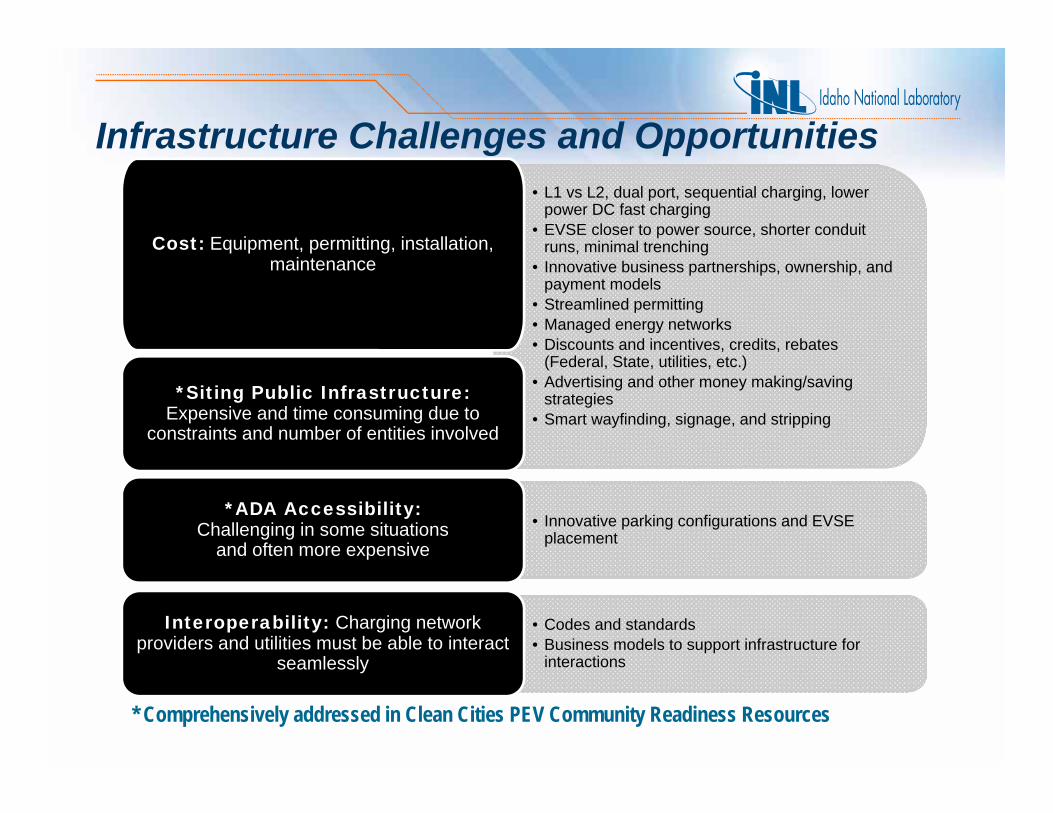
Infrastructure Challenges and Opportunities• L1 vs L2, dual port, sequential charging, lower
power DC fast charging• EVSE closer to power source, shorter conduit
runs, minimal trenching• Innovative business partnerships, ownership, and
payment models• Streamlined permitting• Managed energy networks• Discounts and incentives, credits, rebates
(Federal, State, utilities, etc.)• Advertising and other money making/saving
strategies• Smart wayfinding, signage, and stripping
Cost: Equipment, permitting, installation, maintenance
*Siting Public Infrastructure:Expensive and time consuming due to
constraints and number of entities involved
• Innovative parking configurations and EVSE placement
*ADA Accessibility:Challenging in some situations
and often more expensive
• Codes and standards• Business models to support infrastructure for
interactions
Interoperability: Charging network providers and utilities must be able to interact
seamlessly
* Comprehensively addressed in Clean Cities PEV Community Readiness Resources
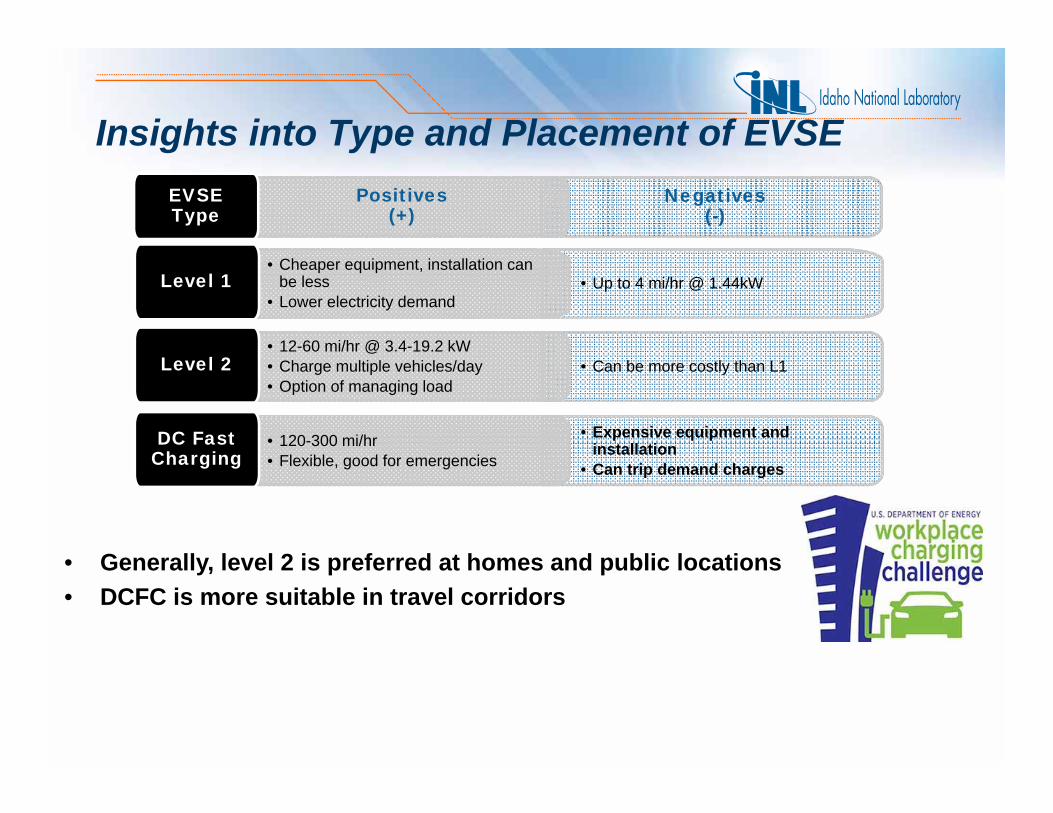
Insights into Type and Placement of EVSE
• Up to 4 mi/hr @ 1.44kW
• Can be more costly than L1
• Expensive equipment and installation
• Can trip demand charges
Negatives(-)
• Cheaper equipment, installation can be less
• Lower electricity demandLevel 1
• 12-60 mi/hr @ 3.4-19.2 kW• Charge multiple vehicles/day• Option of managing load
Level 2
• 120-300 mi/hr• Flexible, good for emergencies
DC Fast Charging
Positives(+)
EVSE Type
• Generally, level 2 is preferred at homes and public locations• DCFC is more suitable in travel corridors

PEV Reported Charging Locations
10
• DOE Alternative Fuels Data Center - Electric Vehicle Charging Station Locations
– http://www.afdc.energy.gov/fuels/electricity_locations.html– 10,003 electric stations and 25,958 charging outlets (excludes
private locations) in the United States– Interactive map that provides additional information for each
location– (Note that these are self reported stations)
State Policy Considerations• PEVs operating solely on electricity don’t pay motor fuel excise
taxes, BUT: • Some states requiring PEV fees*
– CO, GA, ID, NE, NC, OR, VA, WA– OR assessing tax per mile driven in test project– Others like IN and VT have studied options
• For more information, see – State Laws and Incentives,
http://www.afdc.energy.gov/laws/state– State Fees as Transportation Funding Alternatives policy
bulletin, http://www.afdc.energy.gov/bulletins/technology_bulletin_2014_03_10.html
– Analysis to baseline fuel tax for PEVs to comparable ICE vehicles, http://avt.inl.gov/pdf/phev/PEVandPHEVeVMTforIAHD.pdf
*As of July 1, 2015

Time of Use Impacts (Mostly on Residential EVSE)
SDG&E EV-TOU-2 summer schedule
SDG&E residential EVSE connect profile
SDG&E residential EVSE demand profile

GHG Emissions by Grid MixMPG
(MPGe) U.S. Mix Coal Only NG Only NuclearOnly
Nissan Leaf (BEV) (115) 180 g/mi 328 g/mi 148 g/mi 4 g/mi
Chevy Volt (PHEV40)
38 (after 1st 40
miles as electric)
284 g/mi 411 g/mi 258 g/mi 134 g/mi
Toyota Prius Plug-in (PHEV10)
50 (as 1st 12 miles as electric)
234 g/mi 286 g/mi 223 g/mi 172 g/mi
Conventional Gasoline Vehicle (2014) 23.5
460 g/mi
Conventional GasolineVehicle (2025) 54.5
200 g/mi

Environmental and Speed Impacts on PEVs• 2013 Ford Focus
Electric• Representative
results

Leaf and Volt Use (EV Project 2nd quarter report 2013)
15
ParametersEV Project BEV Leafs
EV Project EREV Volts
Number of vehicles 4,261 1,895
Total miles driven (miles) 8,040,300 5,753,009
Average trip distance (miles) 7.1 8.3Average distance traveled per day when the vehicle was driven (miles)
29.5 41.0
Average number of trips between charging events 3.8 3.3Average distance traveled between charging events (miles)
26.7 27.6
Average number of charging events per day when the vehicle was driven
1.1 1.5
Percent of home charging events 74% 80%
Percent of away-from-home charging events 20% 14%
Percent of unknown charging locations 6% 7%

National Look at Public Charging & Installation Costs
16
Defining Public Venues• Venue definition was originally different across all EVSE (electric
vehicle supply equipment & DCFC (direct current fast charger) studies & deployments
• INL settled on venues mostly defined in NYSERDA deployment• Primary Venues used to define AeroVironment & Blink EVSE & DCFC
used in the The EV Project, ChargePoint America, and West Coast Electric Highway projects:
– Education: Training facilities, universities, or schools– Fleet: EVSE known to be used primarily by commercial or
government fleet vehicles– Hotels: Hotel parking lots provided for hotel patron use– Leisure Destination: Parks and recreation facilities or areas,
museums, sports arenas, or national parks or monuments.– Medical: Hospital campuses or medical office parks– Multi-Family: Parking lots serving multi-family residential housing
(also referred to as multi-unit dwellings)17

Defining Public Venues – cont’d• Primary Venues cont’d:
– Non-Profit Meeting Places: Churches or charitable organizations– Parking Lots/Garages: Parking lots or garages that are operated
by private parking management companies, property management companies, or municipalities that offers direct access to a variety of venues
– Public/Municipal: City, county, state, or federal government facilities
– Retail: Retail locations both large and small, such as shopping malls, strip malls, and individual stores
– Transportation Hub: Parking locations with direct pedestrian access to other forms of transportation, such as parking lots at airports, metro-rail stations, or ferry port parking lots
– Workplace: Business offices, office parks or campuses, or industrial facilities
18

Public EVSE Charging Venues• EVSE & DCFC sites discussed here were comprised of as few as one
EVSE and as many as 18 EVSE per site• The first four weeks of usage of EVSE at a site were not included in
the calculation of performance metrics for that site• The subset of data chosen for this research was restricted between
September 1, 2012, and December 31, 2013
19
• 774 public Level 2 (240V) sites in primary venues
• The retail and parking lots/garages venues contained over 45% of all Level 2 sites, workplace 16%

Public EVSE Venue Frequency of Charge Events• Average charging events per week per site (white circles) • The range is the colored bar• One retail venue averaged 40 average events per week• The top 7 workplace sites averaged over 40 charging events per week
20

Public DCFC Use (Direct Current Fast Charger)• 102 AeroVironment & Blink DCFC average number of charging events
per week per site for DCFC sites by venue• The retail venue contains 62% of all deployed DCFC
21

Publicly Accessible DCFC Use• The site with the most usage is at a workplace venue• DCFC utilization ranged from 3 to just over 60 charging events / week• Workplace and education venues had the highest median charging
frequency at 25 & 38 events per site per week
22
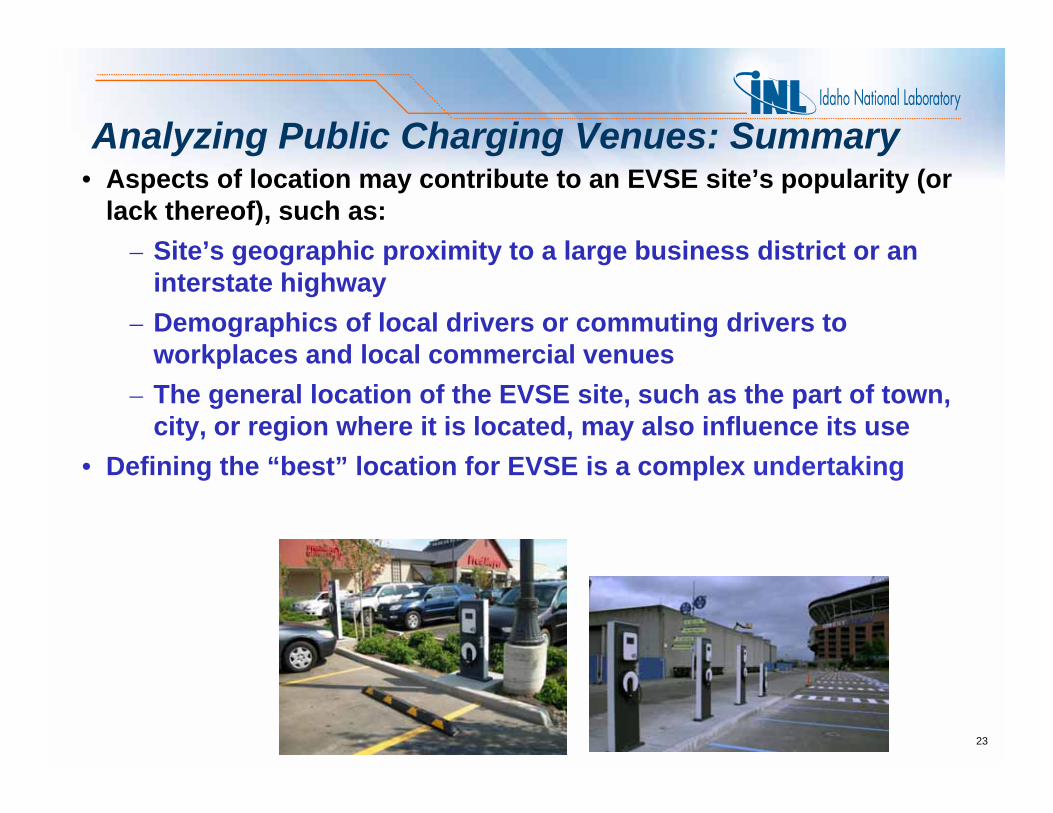
Analyzing Public Charging Venues: Summary• Aspects of location may contribute to an EVSE site’s popularity (or
lack thereof), such as: – Site’s geographic proximity to a large business district or an
interstate highway– Demographics of local drivers or commuting drivers to
workplaces and local commercial venues– The general location of the EVSE site, such as the part of town,
city, or region where it is located, may also influence its use • Defining the “best” location for EVSE is a complex undertaking
23

Analyzing Public Charging Venues: Summary cont’d• Businesses, government agencies, & other organizations have many
reasons for providing EVSE. Their definition of the “best” location for EVSE varies
– Some are concerned with installing EVSE where it will be highly used & provide a return on investment
• This return may come in the form of direct revenue earned by fees for EVSE use (but we can talk about this)
• Or indirect return by enticing customers to stay in their businesses longer while they wait for their vehicle to charge or by attracting the plug-in electric vehicle driver customer demographic (it has been documented)
24

Analyzing Public Charging Venues: Summary cont’d– Other organizations have non-financial interests, such as
supporting greenhouse gas or petroleum reductions, or furthering other sustainability initiatives
– Others organizations install EVSE to boost their public brand image
– Employers provide them as a benefit to attract employees
25

Public Installation Considerations
26
• Establishing an EV charging infrastructure has unique challenges in that the public is not used to seeing EVSEs in public and may be unfamiliar with its purpose and use
• Without specific signage to the contrary, ICE vehicles may park in spaces equipped with an EVSE because they are convenient and vacant
• When an PEV arrives, the driver finds the space occupied and is unable to recharge

Public Installation Considerations
27
• It is recommended that municipalities adopt specific ordinances to:– Prohibit non-EVs from parking in spaces marked for “EV Charging
Only” – Require that EVs parked in spaces marked for “EV Charging Only”
must be connected to the EVSE while parked• It may not be feasible to install EVSE in existing accessible parking
spaces because– that space then becomes exclusively designated for an EV and
would remove one of the– accessible spaces originally required for the facility.

Disabled Parking Considerations
28
• Recommendations to enable persons with disabilities to have access to a charging station per ADA and IBC (International Building Code):
– An accessible space is required to park, exit vehicle and access the EVSE
– Operable controls within 48” front and side reach range; and a 30” x 48” clear floor space is required
• In general, for every 25 parking spaces, one parking space should be accessible. For every six parking spaces that are accessible, one parking space should be van accessible. See: http://avt.inel.gov/pdf/EVProj/EVProjectAccessibilityAtPublicEVChargingLocations.pdf

Public Level 2 EVSE Installation Costs• Installation cost data for analysis is available for 2,479 units • Average installation cost per unit for all publicly accessible Level 2
EVSE installed in EV Project markets was $3,108• The five most expensive geographic markets had per unit installation
costs over $4,000 ($4,004 to $4,588)• The five least expensive geographic markets had per unit installation
costs under $2,600 ($2,088 to $2,609)• Similar to residential EVSE and direct current (DC) fast charger
installation costs, AC Level 2 EVSE installed in California were the most expensive installations
29

• Labor was the primary geographic differentiator of EVSE installation cost
• Labor costs can be mitigated by wall mount versus pedestal installation
• Another factor that affected installation costs in different markets was implementation of Americans with Disability Act (ADA) requirements as understood by the local permitting authority having jurisdiction
30
Public Level 2 EVSE Installation Costs

31
Oregon and Washington I-5 and other Travel Corridors with DC Fast Charger
Usage

West Coast Electric Highway• West Coast Electric Highway (WCEH) was designed to support
long distance EV travel in WA, OR, and CA• Analysis included 45 AeroVironment and 12 Blink DCFC (Not part
of the WCEH, but sited in the travel corridor) located in Oregon and Washington (9/1/2012 to 1/1/2014)
• Using EV Project data, we can look at Nissan Leaf charging at these DCFC
– 1,589 EV Project Leafs in Oregon and Washington– 319 used at least one of the 57 DCFC in the study
• During this period, the 57 corridor DCFCs reported 36,846 charges by 2,515 distinct PEVs
32
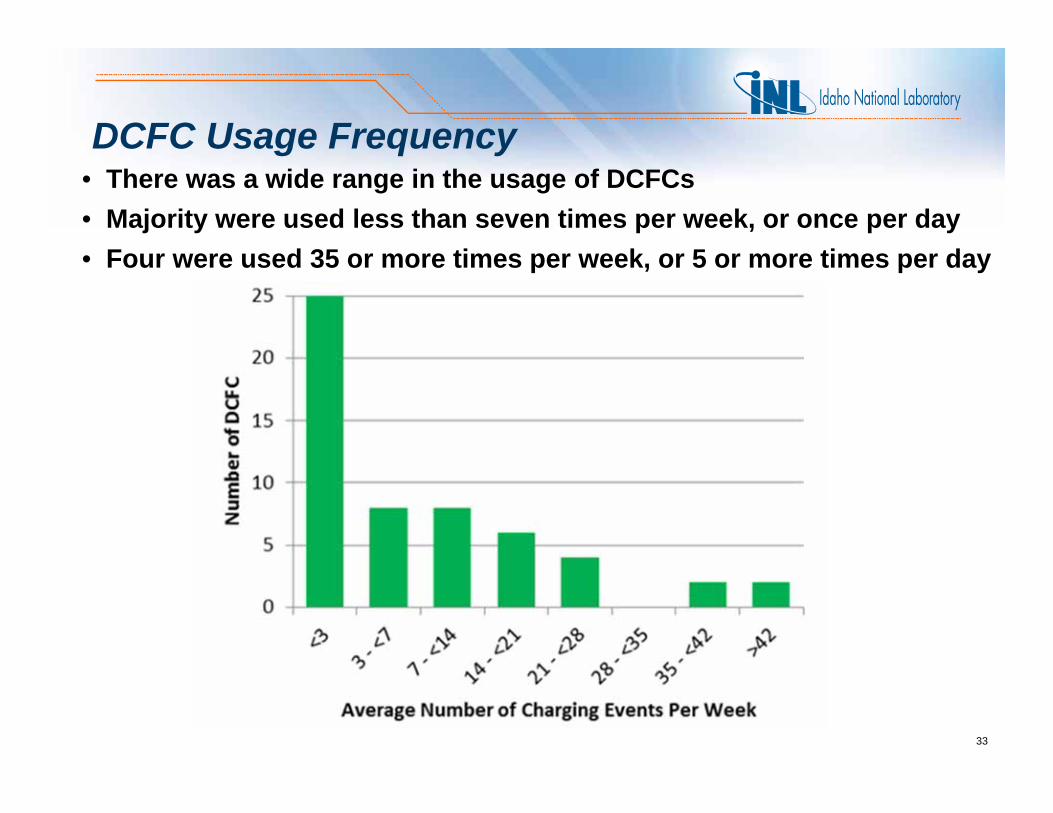
DCFC Usage Frequency• There was a wide range in the usage of DCFCs• Majority were used less than seven times per week, or once per day• Four were used 35 or more times per week, or 5 or more times per day
33

Usage Locations• DCFC that are closer to large
cities were used more frequently• DCFCs directly between the
larger cities (i.e., Portland, Seattle, & Vancouver, British Columbia) had high usage
• DCFCs installed farther from large cities, especially east & west of I-5 & south of Eugene, were generally used less than 7 times per week
• Low usage may not create high value for DCFC owners seeking revenue
• Individual charge events may have been highly valued by the EV driver
34

Maximizing Outing Distances• Data from 319 Nissan Leafs in The EV Project, which used the
corridor DCFC in this study, were analyzed• An Outing represents all driving done from when a driver leaves
home to when they return home
35
• A DCFC had to be used in 30 or more outings to be included in this analysis
• DCFC are used to maximize Outing distances beyond the range of the Leafs (75+ miles)

Median Outing Distance• DCFC in cities were used in much shorter outings (usually less than
full charge range of Leaf)• As distance from DCFC to cities increases, outing distance
increases• Many DCFC along I-5 were used 2 to 4 times per day for outings
over 150 miles– Some >225 miles– Regularly being used for outings that require 2, 3 or more full
charges to complete• 19 outings longer than 500 miles• Longest outings was 770 miles. This driver performed 16 fast
charges at nine different DCFCs• Tough to build a business case around a few PEV drivers
36

Leaf Drivers’ DCFC Use and Outing Distances
37
• Color highlights charge events per week
• Star size highlights outing distances
• DCFC is clearly of high value but only to a small group of PEV drivers
• But the question remains – Do drivers use PEVs
more because DCFC exist even if drivers never use them?
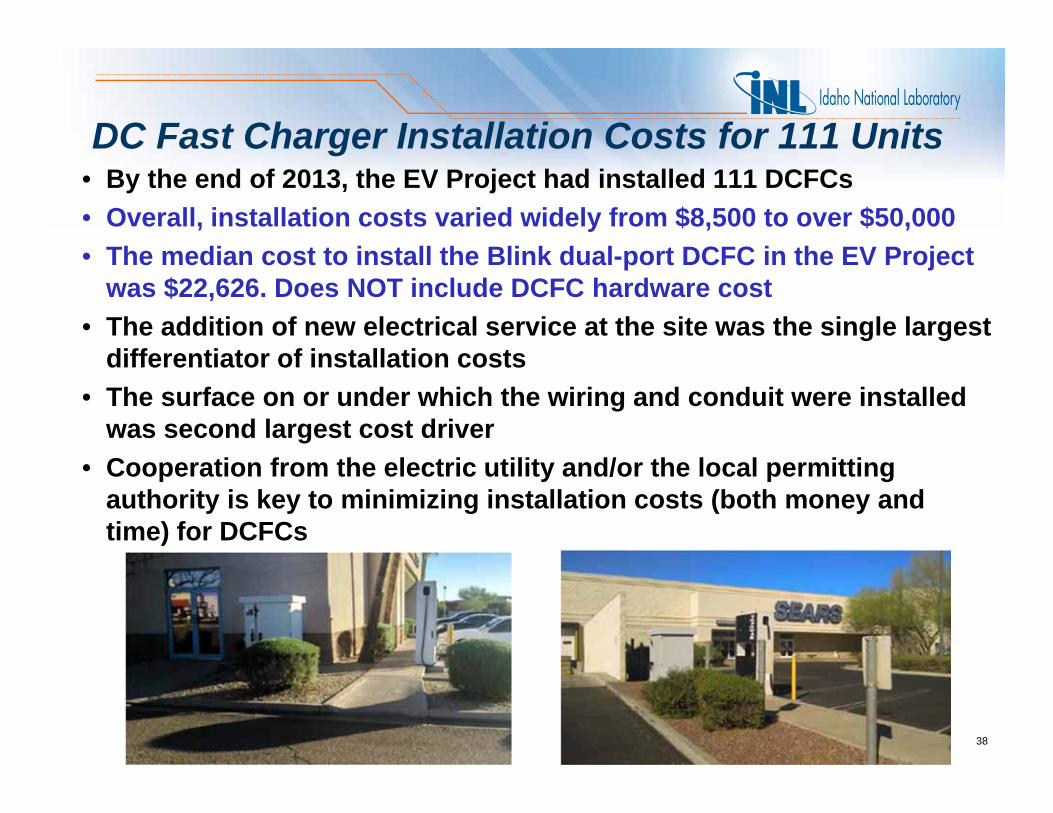
DC Fast Charger Installation Costs for 111 Units• By the end of 2013, the EV Project had installed 111 DCFCs• Overall, installation costs varied widely from $8,500 to over $50,000• The median cost to install the Blink dual-port DCFC in the EV Project
was $22,626. Does NOT include DCFC hardware cost• The addition of new electrical service at the site was the single largest
differentiator of installation costs• The surface on or under which the wiring and conduit were installed
was second largest cost driver• Cooperation from the electric utility and/or the local permitting
authority is key to minimizing installation costs (both money and time) for DCFCs
38

What is the Impact of Utility Demand Charges on a DCFC Host?
• DCFC energy transferred versus charge time and Leaf charge profile
• Demand charges associated with 50-kW high power charging of a DCFC can have a significant impact on a monthly electric utility bill
• Owner will need to choose whether to power the DCFC on the original business service electrical supply or provide separate service
39

What is the Impact of Utility Demand Charges on a DCFC Host? Cont’d
• Detailed analysis of potential costs and the electric utility rate schedule options to determine the optimal rate schedule for a DCFC site is important and should be conducted in consultation with the electric utility
• Some electric utilities provide rate schedules for commercial customers without imposing demand charges
• DCFC site hosts may be compensated for energy used in DCFC charging through access or use fees imposed on PEV drivers
• The host’s monthly DCFC demand charge is based on the single highest power required by the DCFC during the month, regardless of the number of charge events in the month
• A higher number of PEV charges in a month reduces the average demand charge cost per PEV charge
• Monthly charge can exceed $1,000 per DCFC
40

Workplace Charging & Installation Costs
41
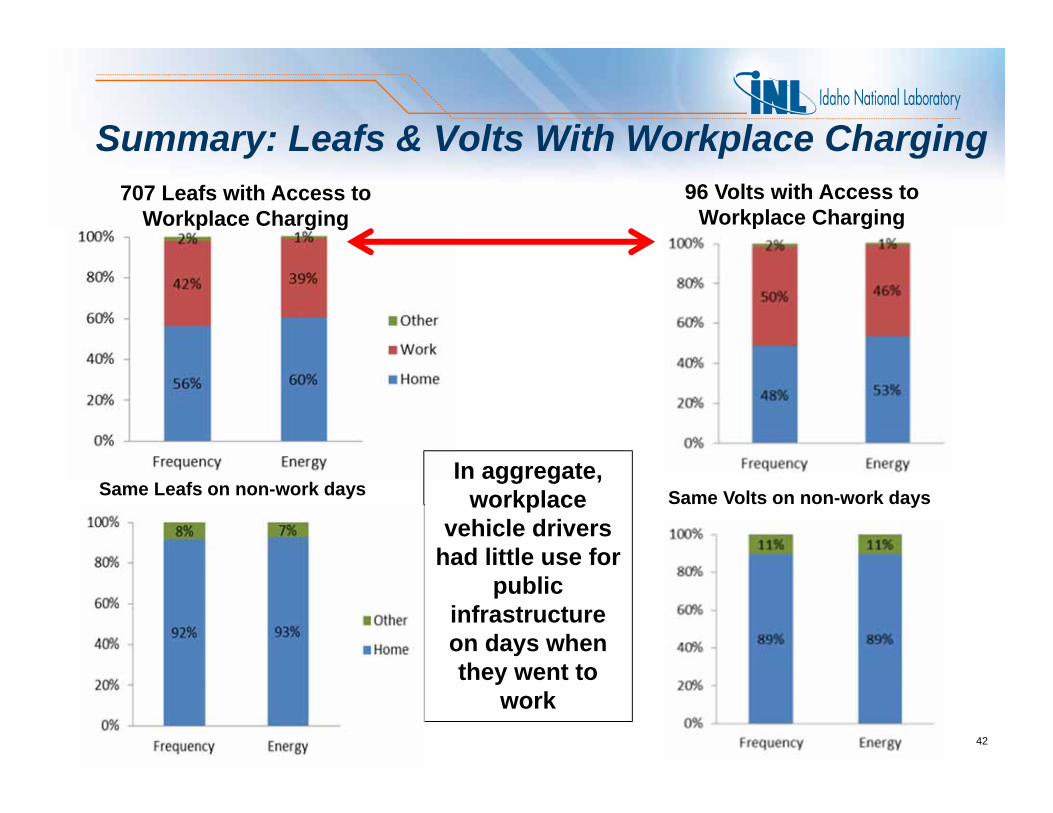
Summary: Leafs & Volts With Workplace Charging
42
707 Leafs with Access to Workplace Charging
In aggregate, workplace
vehicle drivers had little use for
public infrastructure on days when they went to
work
Same Leafs on non-work days
96 Volts with Access to Workplace Charging
Same Volts on non-work days

Workplace Cost Drivers – Facility Location • Location Relative to the Facility
– Typically installed in existing employee parking lots, normally at the rear of the workplace or at the side of the building
– This typically puts the EVSE closer to the building’s power distribution panels
– Shorter electrical conduit runs and, therefore, less expensive installation costs
– Some workplace charging stations were installed in multi level parking garages
• Also located away from the front of the building and were more likely to be nearer electrical service
• Typically utilized surface-mounted electrical conduit, which is less expensive to install than conduit buried underground
• These units typically utilized surface-mounted electrical conduit, which is less expensive to install than conduit buried underground
43

Workplace Cost Drivers – Wall Mounted• Wall-Mounted Installations
– Greater freedom as to the installation location at a site led to more wall-mounted installations
– Wall-mounted EVSE were typically less expensive to install, because they did not require underground conduit to supply power, which is typical for a pedestal unit
– The average cost to install a wall-mount AC Level 2 EVSE was $2,035
– The average cost to install a pedestal AC Level 2 was $3,209
44
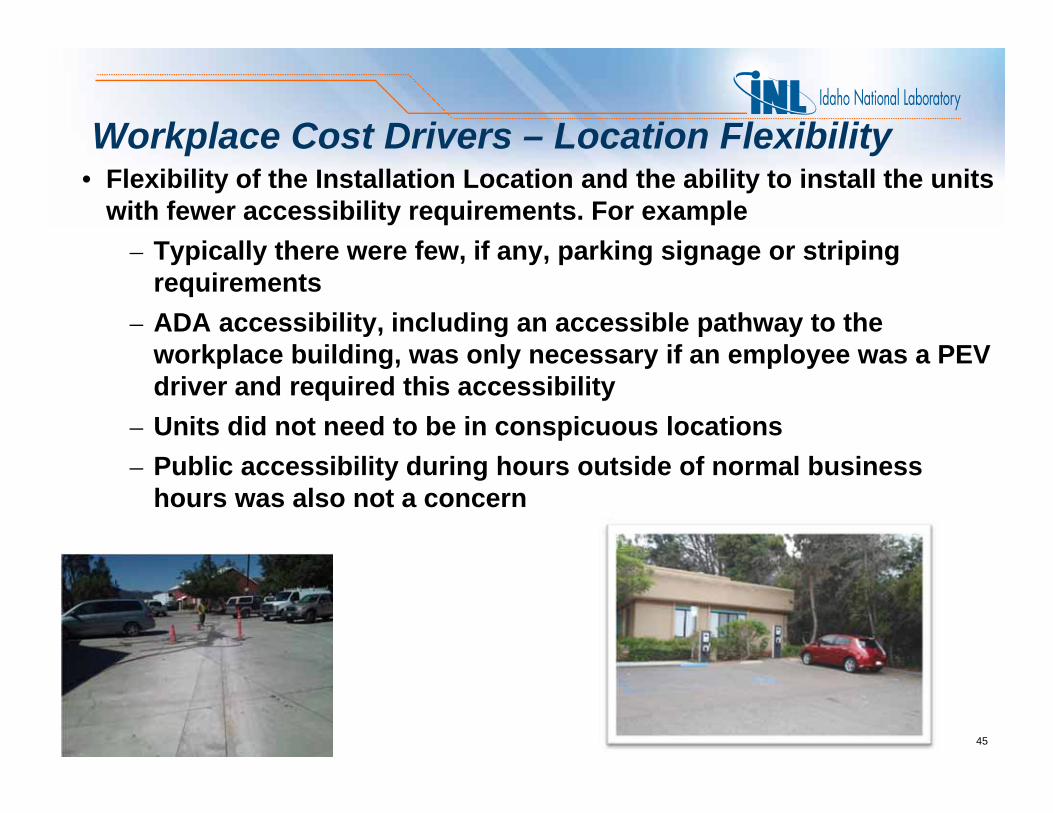
Workplace Cost Drivers – Location Flexibility• Flexibility of the Installation Location and the ability to install the units
with fewer accessibility requirements. For example– Typically there were few, if any, parking signage or striping
requirements– ADA accessibility, including an accessible pathway to the
workplace building, was only necessary if an employee was a PEV driver and required this accessibility
– Units did not need to be in conspicuous locations– Public accessibility during hours outside of normal business
hours was also not a concern
45
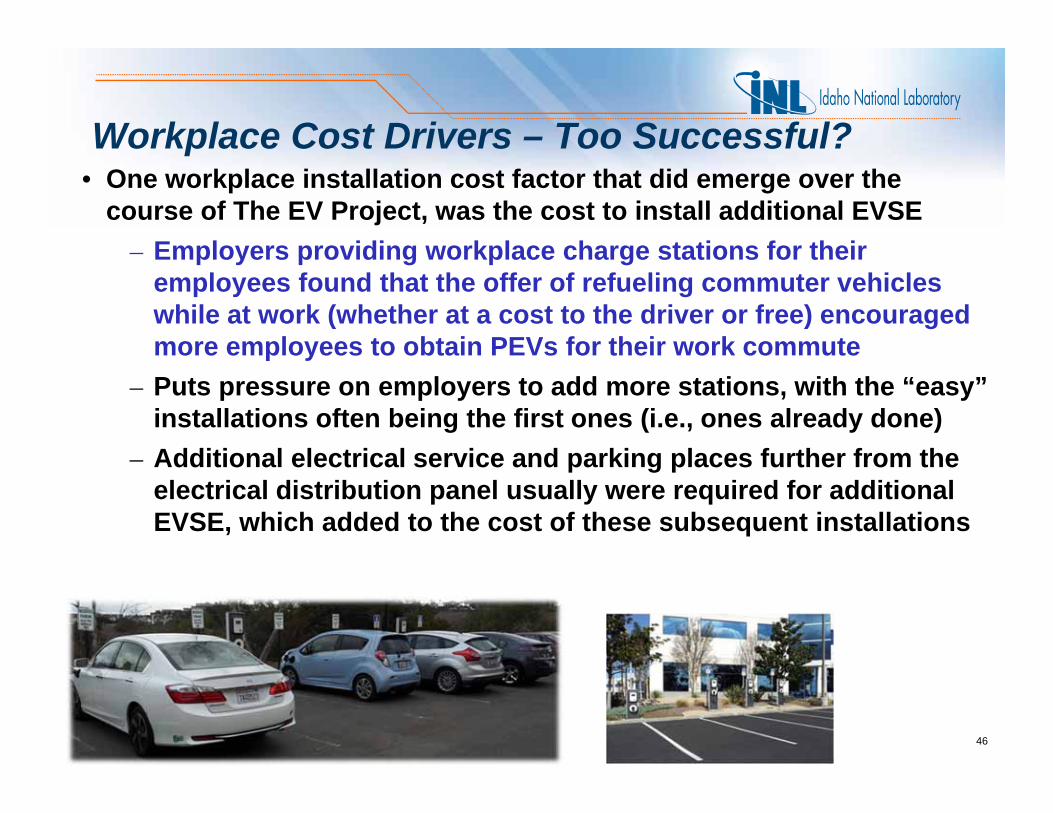
Workplace Cost Drivers – Too Successful?• One workplace installation cost factor that did emerge over the
course of The EV Project, was the cost to install additional EVSE– Employers providing workplace charge stations for their
employees found that the offer of refueling commuter vehicles while at work (whether at a cost to the driver or free) encouraged more employees to obtain PEVs for their work commute
– Puts pressure on employers to add more stations, with the “easy” installations often being the first ones (i.e., ones already done)
– Additional electrical service and parking places further from the electrical distribution panel usually were required for additional EVSE, which added to the cost of these subsequent installations
46

Workplace Charging Installation Costs• The average cost for installation of electric vehicle supply equipment
(EVSE) at workplace locations was $2,223• Average installation costs for EV Project non-residential AC Level 2
EVSE
• Maximum and minimum installation costs for EV Project non-residential AC Level 2 EVSE
47
Average Installation Cost
All Non-Residential
Publicly Accessible Workplace
All $2,979 $3,108 $2,223Pedestal Units $3,209 $3,308 $2,305
Wall-Mount Units $2,035 $2,042 $2,000
Maximum and Minimum Installation CostsAll Non-
ResidentialPublicly
Accessible Workplace
Maximum $12,660 $12,660 $5,960
Minimum $599 $599 $624

Workplace Charging Installation Costs• Distribution of per unit workplace installation costs
– 80% of the workplace stations were installed at costs that were below the average installation cost of $3,108 for stations installed for public use
48

Utility Demand Charges on AC Level 2 EVSE• Some electric utilities impose demand charges on the highest power
delivered to a customer in a month• Simultaneously charging plug-in electric vehicles via multiple AC
Level 2 EVSE can create significant increases in power demand• The increased charging rate allowed by many newer plug-in-electric
vehicles (PEVs) will exacerbate this impact• 3 EVSE x 6.6 kW = 19.8 kW
– Many utilities start demand charges at 20 kW– Demand charge can exceed $1,000 per month
49

50
Charging Fee Impact on Use Rates

Roll-out of Blink DCFC usage fees
during Q3
National Blink DC Fast Chargers - Fee Impacts
DCFC Fee per Session - $5 Blink members - $8 non-Blink members
51

Average Usage Rate for Public Level 2 EVSE & DC Fast Chargers per Select Regions
CP L2 - SF (1.1)
DCFC - WA (2.7)
DCFC - LA (1.7) DCFC - SF (1.9)
CP L2 - LA (1.3)
CP L2 - WA (0.66)Blink L2 - SF (0.55)
Blink L2 - WA (0.29)Blink L2 - LA (0.48)
Level 2 Fee per hour - $1 Blink EVSE - ChargePoint unknown
52

DC Fast Charger Use Profiles• 4th 2013 Quarter connect time and energy transfer rates suggest users
may want to maximize energy transferred due to fees• In below graph, connect and drawing power times sit on each other• Low use rates suggest a difficult business case
53

54
Electric Vehicle Miles Traveled (eVMT)

eVMT Analysis• Collaborative groups
– Idaho National Laboratory– Honda North America– Ford Motor Company– Toyota Motor Engineering & Manufacturing NA– General Motors
• Calculated electric vehicle miles traveled (eVMT) for: – Ford Fusion Energi– Ford C-Max Energi– Honda Accord PHEV– Toyota Prius PHEV– Chevrolet Volt– Ford Focus Electric– Honda Fit EV– Nissan Leaf
• Data is from actual customer, on-road vehicle operation– 158,468,000 miles from 21,600 vehicles– Across the U.S. (i.e. widely varying regions and climates)
55

56
eVMT vs. VMT
• Even partial electric drive can have significant petroleum reduction benefits

Electric Utility News• December 2014 California Public Utilities Commission issued Order
allowing utility ownership of EV charging infrastructure.– Southern California Edison
• Estimates 350,000 plug-in vehicles in service area by 2020• Seeking CPUC approval to spend $355M to install >30,000 EV
charging stations over 5 years– Pacific Gas & Electric
• Presently over 60,000 plug-in electric vehicles registered in service area
• Seeking CPUC approval to install 25,000+ EV charging stations at a cost of $654M funded by rate payers
– San Diego Gas & Electric• Presently over 15,000 plug-in electric vehicles in service area• Seeking CPUC approval to spend >$100M to contract with 3rd
parties to build, install, operate and maintain 5,500 EV charging stations
Provided by Idaho Power 57

Additional Information
For publications and general plug-in electric vehicle performance, visit http://avt.inl.gov
Funding provided by DOE`s Vehicle Technologies Office
58