lehman brothers ceo energy / power conference - bhp.com · by reviewing/attending this presentation...
TRANSCRIPT

4 September 2008J Michael Yeager Chief Executive Petroleum
Lehman Brothers CEO Energy / Power Conference
Petroleum Year End Review FY2008

Petroleum Year End Review FY2008Slide 2
DisclaimerBy reviewing/attending this presentation you agree to be bound by the following conditions.Neither BHP Billiton Limited and BHP Billiton Plc (“BHP Billiton") nor any of its directors, officers, employees or advisers nor any other person makes any representation or warranty, express or implied, as to, and accordingly no reliance should be placed on, the fairness, accuracy or completeness of the information contained in the presentation or of the views given or implied. To the extent permitted by law, neither BHP Billiton nor any of its directors, officers, employees or advisers nor any other person shall have any liability whatsoever for any errors or omissions or any loss howsoever arising, directly or indirectly, from any use of this information or its contents or otherwise arising in connection therewith. This presentation is for information purposes only and does not constitute or form part of any offer for sale or issue of any securities or an offer or invitation to purchase or subscribe for any such securities. Certain statements in this presentation are forward-looking statements (including statements regarding the cost and timing of development projects, future production volumes, increases in production and infrastructure capacity and, without limitation, other statements typically containing words such as "intends," "expects," "anticipates," "targets," plans," "estimates" and words of similar import.) These statements are based on current expectations and beliefs and numerous assumptions regarding BHP Billiton's present and future business strategies and the environments in which BHP Billiton will operate in the future and such assumptions, expectations and beliefs may or may not prove to be correct and by their nature, are subject to a number of known and unknown risks and uncertainties that could cause actual results, performance and achievements to differ materially.Factors that could cause actual results or performance to differ materially from those expressed or implied in the forward-looking statements include, but are not limited to, the risk factors discussed in BHP Billiton's filings with the U.S. Securities and Exchange Commission ("SEC") (including in Annual Reports on Form 20-F) which are available at the SEC's website (http://www.sec.gov). Save as required by law or the rules of the UK Listing Authority and the London Stock Exchange, the UK Takeover Panel, or the listing rules of ASX Limited, BHP Billiton undertakes no duty to update any forward-looking statements in this presentation. BHP Billiton results are reported under International Financial Reporting Standards (IFRS). References to Underlying EBIT and Underlying EBITDA exclude any exceptional items. A reconciliation to profit from operations is contained within the profit announcementReferences in this presentation to “$” are to United States dollars unless otherwise specified.

Petroleum Year End Review FY2008Slide 3
Today’s agendaFY2008 Financial Results – BHP Billiton and Petroleum
How We Run BHP Billiton Petroleum
FY2008 Petroleum Performance
― Safety/Environment
― Volumes
― Costs
― Growth-Replenishment
Results

Petroleum Year End Review FY2008Slide 4
2007 2008
BHP Billiton financial highlights% ChangeYear ended June (US$m)
Revenue 59,473 47,473 25.3Underlying EBITDA 28,031 22,950 22.1Underlying EBIT 24,282 20,067 21.0Attributable profit (excluding exceptionals) 15,368 13,675 12.4Attributable profit 15,390 13,416 14.7Net operating cash flow 18,159 15,957 13.8EPS (excluding exceptionals) (US cents) 274.9 233.9 17.5Dividend per share (US cents) 70.0 47.0 48.9
Petroleum Year End Review FY2008Slide 5
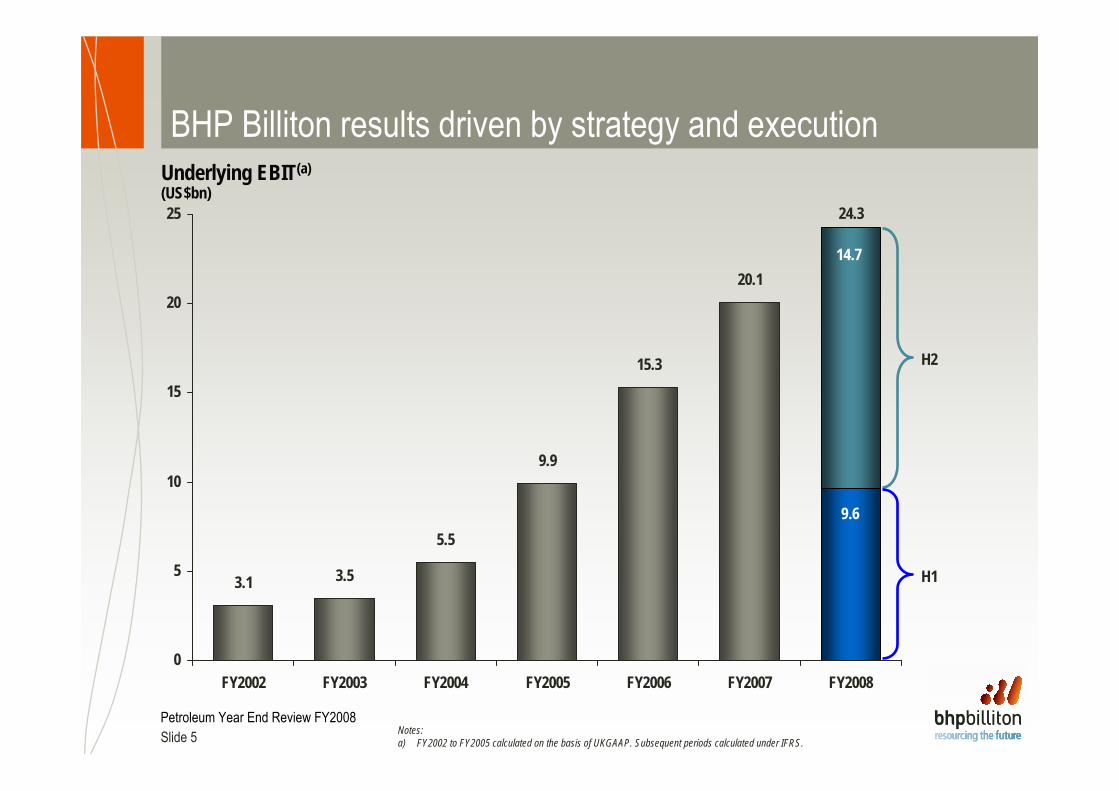
BHP Billiton results driven by strategy and execution
3.1 3.5
5.5
9.9
15.3
20.1
24.3
0
5
10
15
20
25
FY2002 FY2003 FY2004 FY2005 FY2006 FY2007 FY2008
Notes:a) FY2002 to FY2005 calculated on the basis of UKGAAP. Subsequent periods calculated under IFRS.
Underlying EBIT(a)(US$bn)
H2
H1
9.6
14.7

Petroleum Year End Review FY2008Slide 6
BHP Billiton portfolio performanceUnderlying EBIT Margin(a)(FY2008)
Notes:a) EBIT Margin excludes third party trading activities.
67%
30%
31%
62%
20%
25%
24%
48%
51%
58%
Underlying EBIT(FY2008, US$bn)
0
5
10
15
20
25
Energy(27%)
Non Ferrous(44%)
SteelmakingMaterials(29%)
Iron Ore
Manganese
Energy Coal
Metallurgical Coal
D & SP
Base Metals
Petroleum
Stainless SteelMaterials
Aluminium
Iron Ore
Manganese
Energy Coal
Metallurgical Coal
Diamonds andSpecialty Products
Base Metals
Petroleum
Stainless SteelMaterials
Aluminium
Group
$24.3 bn
Petroleum Year End Review FY2008Slide 7
Boffa/SantouRefinery
Boffa/SantouRefinery
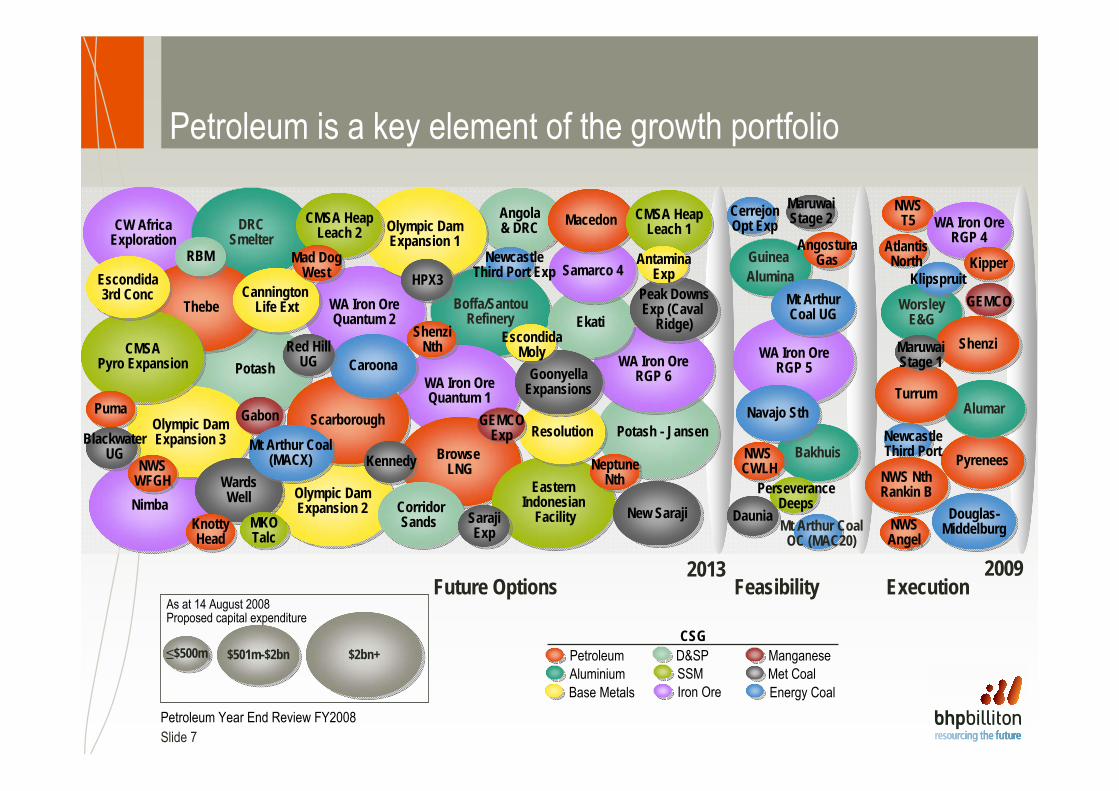
As at 14 August 2008Proposed capital expenditure
≤$500m≤$500m $501m-$2bn$501m-$2bn $2bn+$2bn+SSM
Energy Coal
D&SP
Iron OreBase Metals
PetroleumMet Coal
CSGManganese
Aluminium
2009Execution
PyreneesPyrenees
AlumarAlumar
AtlantisNorth
2013Feasibility
BakhuisBakhuis
WorsleyE&G
WorsleyE&G
Douglas-MiddelburgDouglas-
Middelburg
Future Options
NewcastleThird Port
WA Iron OreQuantum 2
WA Iron OreQuantum 2
Potash - JansenPotash - Jansen
WA Iron OreQuantum 1
WA Iron OreQuantum 1
NimbaNimba
Angola& DRC
Angola& DRC
WA Iron OreRGP 5
WA Iron OreRGP 5
CW AfricaExplorationCW Africa
Exploration
TurrumTurrum
NWS CWLHNWS CWLH
DRCSmelterDRC
Smelter
NWST5
NWST5
Petroleum is a key element of the growth portfolio
NWS NthRankin BNWS NthRankin B
WA Iron OreRGP 4
WA Iron OreRGP 4
KipperKipper
Olympic DamExpansion 2
Olympic DamExpansion 2
Browse LNG
Browse LNG
Olympic DamExpansion 1
Olympic DamExpansion 1
CMSA HeapLeach 2
CMSA HeapLeach 2
ShenziNth
Klipspruit
NWSAngelNWSAngel
ShenziShenzi
GEMCO
PotashPotash
Olympic DamExpansion 3
Olympic DamExpansion 3
ThebeThebe
CMSAPyro Expansion
CMSAPyro Expansion
WardsWell
WardsWell
ScarboroughScarborough
CaroonaCaroona WA Iron OreRGP 6
WA Iron OreRGP 6
EasternIndonesian
Facility
EasternIndonesian
Facility
Escondida3rd Conc
Escondida3rd Conc
RBMRBM
PumaPuma
Blackwater UG
NWSWFGHNWS
WFGH
MKOTalc
MKOTalc
Cannington Life Ext
Cannington Life Ext
CorridorSands
CorridorSands
Kennedy
GabonGabon
SarajiExp
SarajiExp
Red HillUG
ResolutionResolution
NeptuneNth
NeptuneNth
GEMCO Exp
EkatiEkati
Guinea AluminaGuinea Alumina
AngosturaGas
HPX3HPX3
MaruwaiStage 1
KnottyHead
KnottyHead
Samarco 4Samarco 4
Peak DownsExp (Caval
Ridge)
Peak DownsExp (Caval
Ridge)
MacedonMacedon CMSA HeapLeach 1
CMSA HeapLeach 1
AntaminaExp
NewcastleThird Port Exp
Mad DogWest
Mt ArthurCoal UG
Mt ArthurCoal UG
CerrejonOpt Exp
DauniaDaunia
MaruwaiStage 2
Navajo SthNavajo Sth
PerseveranceDeepsMt Arthur Coal
OC (MAC20)
Mt Arthur Coal(MACX)
Mt Arthur Coal(MACX)
New SarajiNew Saraji
GoonyellaExpansionsGoonyella
Expansions
Escondida Moly

Petroleum Year End Review FY2008Slide 8
An E&P player with the power and reach of a super-majorMarket capitalization (US$bn, August 2008)
ImpalaPlatinum
AluminiumCorp. of China **
SouthernCopper
GoldCorp
Alcoa
BarrickGold
AngloPlatinum
FreeportMcMoRan
NorilskNickel **
Xstrata
AngloAmerican
ChinaShenhua **
Rio Tinto *
Vale
BHP Billiton
0 50 100 150 200
Mining Peer GroupPetroleum Peer Group
*Rio Tinto Market Cap = Market Cap of Rio Tinto Plc + 62.6% of Market Cap of Rio Tinto Ltd (due to Rio Tinto Plc’s approximate 37.4% holding of Rio Tinto Ltd, as per www.riotinto.com/investors/590_data_book.asp)**Market value may be unreliable due to a high percentage of non free-float shares.Sources: Datastream, Bloomberg
0 50 100 150 200 250
Marathon OilWoodside
HessRepsolApache
Husky EnergyCanadian Natural
Imperial OilDevon Energy
EcopetrolOil & Natural Gas
Suncor EnergyEncana
LukoilCNOOC
OccidentalBG Group
RosneftStatoilHydro
ConocoPhillipsEni
TotalChevron
BPBHP Billiton
PetrobrasRoyal Dutch
GazpromPetrochina
Exxon Mobil (1)(2)
E&P Integrated(1) - $409bn (2) - $349bn
Petroleum Year End Review FY2008Slide 9
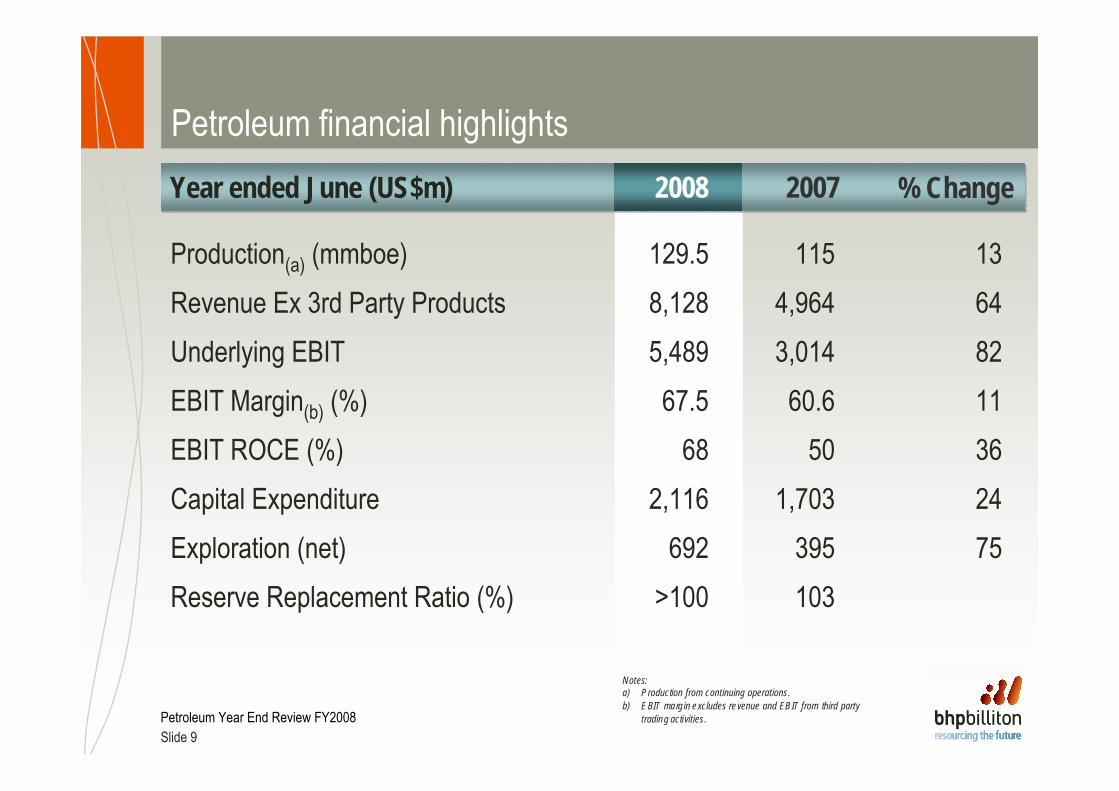
2007 2008
Petroleum financial highlights% ChangeYear ended June (US$m)
Production(a) (mmboe) 129.5 115 13Revenue Ex 3rd Party Products 8,128 4,964 64Underlying EBIT 5,489 3,014 82EBIT Margin(b) (%) 67.5 60.6 11EBIT ROCE (%) 68 50 36Capital Expenditure 2,116 1,703 24Exploration (net) 692 395 75Reserve Replacement Ratio (%) >100 103
Notes:a) Production from continuing operations.b) EBIT marg in excludes revenue and EBIT from third party
trading activities.

Petroleum Year End Review FY2008Slide 10
Results
Today’s agendaFY2008 Financial Results – BHP Billiton and Petroleum
How We Run BHP Billiton Petroleum
FY2008 Petroleum Performance
― Safety/Environment
― Volumes
― Costs
― Growth-Replenishment

Petroleum Year End Review FY2008Slide 11
Global operational focus
Petroleum HQGulf of Mexico
AlgeriaPakistan
North West Shelf
Bass Strait
The Falklands
Colombia Trinidad
E Canada
W Australia
Malaysia
Exploration Producing and development
UK

Petroleum Year End Review FY2008Slide 12
Our core strategy and competitive advantages• The core strategy
– Large, long-life upstream assets with multiple options – that we operate– Target organic growth opportunities that are material to BHP Billiton– Balanced proven plays and frontier exploration– Functional organizational model to achieve top quartile performance
• Our competitive advantages– Balance sheet strength of a super major, with the energy of a start-up– Able to compete technically with super majors in chosen locations– Industry leading geoscience imaging technology in deepwater subsalt– Trusted and dynamic partner – Speed of decisions versus competitors
Petroleum Year End Review FY2008Slide 13
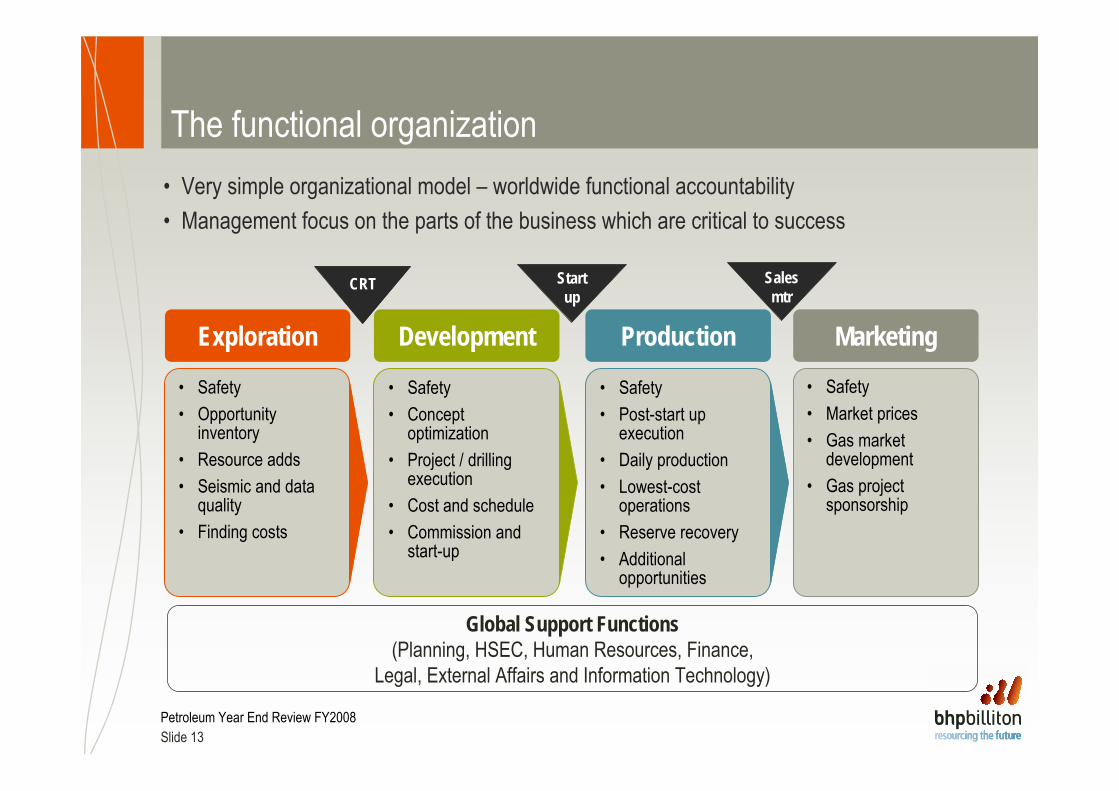
The functional organization
• Safety• Opportunity
inventory• Resource adds• Seismic and data
quality• Finding costs
Exploration Development Production Marketing
• Very simple organizational model – worldwide functional accountability• Management focus on the parts of the business which are critical to success
• Safety• Concept
optimization• Project / drilling
execution• Cost and schedule• Commission and
start-up
• Safety• Post-start up
execution• Daily production• Lowest-cost
operations• Reserve recovery• Additional
opportunities
• Safety• Market prices• Gas market
development• Gas project
sponsorship
Global Support Functions(Planning, HSEC, Human Resources, Finance,
Legal, External Affairs and Information Technology)
CRT Startup
Salesmtr

Petroleum Year End Review FY2008Slide 14
Management team in place to executeJ. Michael Yeager
Chief Executive Petroleum
Nigel SmithPresident
Development
Stephen O’RourkePresident
Exploration
ZlatkoTodorcevski
Chief Financial Officer
Alex GreenMarketing Director Crude Marketing
Renee KlimczakPresident
Gas Marketing
Timothy CuttPresident Production
Petroleum Year End Review FY2008Slide 15
Today’s agendaFY2008 Financial Results – BHP Billiton and Petroleum
How We Run BHP Billiton Petroleum
FY2008 Petroleum Performance
― Safety/Environment
― Volumes
― Costs
― Growth-Replenishment
Results

Petroleum Year End Review FY2008Slide 16
Delivered significant HSEC improvements despite significant ramp-up in drilling and construction activities
• Achieved 9% reduction in TRIFR and 43% reduction in LTIFR between FY07 and FY08
• 3 LTIs in FY08 vs 20 in FY06• No fatalities• LTIFR in industry top quartile
• Reduced hydrocarbon spills by 74% between FY07 and FY08
• Reduced high potential near miss incidents by 45%
• Good Safety = Good Business
Total Recordable Injury Frequency Rate (TRIFR)(Per million hours)
Lost Time Injury Frequency Rate (LTIFR)(Per million hours)
2.37 2.17
4.73
0.0
1.0
2.0
3.0
4.0
5.0
FY06 FY07 FY08
0.47 0.27
1.93
0.0
1.0
2.0
3.0
4.0
5.0
FY06 FY07 FY08
OGP Top Quartile
OGP Top Quartile
Notes:OGP Data is Calendar Year

Petroleum Year End Review FY2008Slide 17
Today’s agendaFY2008 Financial Results – BHP Billiton and Petroleum
How We Run BHP Billiton Petroleum
FY2008 Petroleum Performance
― Safety/Environment
― Volumes
― Costs
― Growth-Replenishment
Results

Petroleum Year End Review FY2008Slide 18
Produced 355 kboed in FY08, up 13% from FY07• Base production well managed
• 93.8% uptime vs. 100, 100, 100• Significant improvements
FY08: 93.8% vs 1QFY07: 89.0% • 1% improved uptime = ~1.5 mmboe
(~4 kboed)• Start-up of new projects
• Stybarrow, Genghis Khan, Atlantis• Zamzama Phase 2• Neptune (July 2008)• NWS Train V (September 2008)
• Record production ramp-ups from new projects• Stybarrow and Neptune• Multiple high rate wells
89.0% 93.6% 92.0% 94.6% 93.8%
0%
100%
1QFY
07
2QFY
07
3QFY
07
4QFY
07
FY08
Production efficiency(a)(Uptime)
Stybarrow field
Notes:a) Excludes Atlantis as it is currently in ramp-up stage.

Petroleum Year End Review FY2008Slide 19
Stybarrow (50% working interest, BHP Billiton operated)
FPSO and subsea wellsBrought on-stream in November 2007 approximately two months ahead of scheduleAchieved sustained production at design capacity of 80 kbpd (gross)Record-setting single well flow rates of approximately 32 kbpd
Performance highlights

Petroleum Year End Review FY2008Slide 20
Genghis Khan (44% working interest, BHP Billiton operated)
Subsea wells tied back to Marco Polo platformDesign capacity of 55 kbpd (gross)Brought on-stream in October 2007, bringing Shenzi production forward by ~ 2 yearsTwo wells completed
Performance highlights

Petroleum Year End Review FY2008Slide 21
Zamzama Phase II (38.5 % working interest, BHP Billiton operated)
Plant expansion started up February 2008Gas plant expansion design capacityof 150 mmcfd (gross)Currently optimizing production systems
Performance highlights

Petroleum Year End Review FY2008Slide 22
Atlantis (44% working interest, non-operated)
Semi-submersible platform with deepwater subsea wellsBrought on-stream in October (crude) & December 2007 (gas)Design capacity of 200 kbpd; 180 mmcfd (gross)8 wells currently producing at 85 kbpd (gross), 2 additional wells planned on-stream by end of Q2 FY2009Initiation of Water Injection planned by end of FY2009Atlantis North Startup (1 well) by H2 CY09
Performance highlights

Petroleum Year End Review FY2008Slide 23
Neptune (35% working interest, BHP Billiton operated)Performance highlights
Tension leg platform and subsea wells4,250ft water depth50 kbpd and 50mmcfd capacity (gross)Hull remediation completed with no incidentsStartup July 2008; currently producing oil at facility capacity with 6 wells available

Petroleum Year End Review FY2008Slide 24
Today’s agendaFY2008 Financial Results – BHP Billiton and Petroleum
How We Run BHP Billiton Petroleum
FY2008 Petroleum Performance
― Safety/Environment
― Volumes
― Costs
― Growth-Replenishment
Results

Petroleum Year End Review FY2008Slide 25
Cost – unit cost structure is highly competitive among peers• Cost focus is on unit cost per barrel oil
equivalent• Unit operating costs holding steady
~US$5.00/boe– Lower year-on-year price and fx
adjusted• Unit DD&A at ~US$9.00/boe worldwide
– Forecast to rise as major projects come on-line
• Both unit operating costs and unit DD&A are highly competitive vs. peers
0
5
10
15
20
25
FY05 FY06 FY07 FY08
0
5
10
15
20
25
FY05 FY06 FY07 FY08
Cash operating costs(US$/boe)
DD&A(US$/boe)
Peers
Peers
Peer group includes: Anadarko, Apache, Devon, Hess, Murphy, Noble, Talisman, and Woodside.Peer Group is Calendar YearSource: BHP Billiton, John S. Herold, Inc. and annual reports.

Petroleum Year End Review FY2008Slide 26
Today’s agendaFY2008 Financial Results – BHP Billiton and Petroleum
How We Run BHP Billiton Petroleum
FY2008 Petroleum Performance
― Safety/Environment
― Volumes
― Costs
― Growth-Replenishment
Results
Petroleum Year End Review FY2008Slide 27
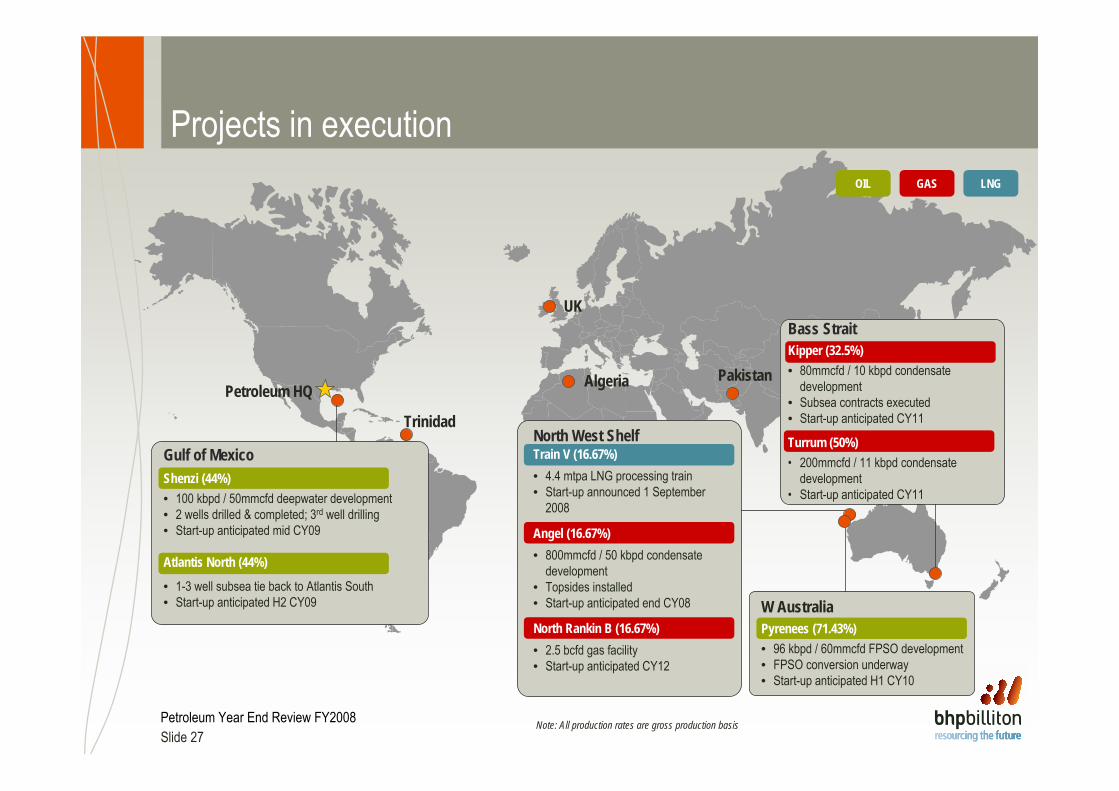
Projects in execution
Petroleum HQ Algeria Pakistan
Trinidad
Gulf of MexicoShenzi (44%)• 100 kbpd / 50mmcfd deepwater development• 2 wells drilled & completed; 3rd well drilling• Start-up anticipated mid CY09
Atlantis North (44%)
• 1-3 well subsea tie back to Atlantis South• Start-up anticipated H2 CY09
North West ShelfTrain V (16.67%)• 4.4 mtpa LNG processing train• Start-up announced 1 September
2008
Angel (16.67%)• 800mmcfd / 50 kbpd condensate
development• Topsides installed• Start-up anticipated end CY08
North Rankin B (16.67%)• 2.5 bcfd gas facility• Start-up anticipated CY12
W AustraliaPyrenees (71.43%)• 96 kbpd / 60mmcfd FPSO development• FPSO conversion underway• Start-up anticipated H1 CY10
Bass StraitKipper (32.5%)• 80mmcfd / 10 kbpd condensate
development• Subsea contracts executed• Start-up anticipated CY11
Turrum (50%)• 200mmcfd / 11 kbpd condensate
development• Start-up anticipated CY11
OIL GAS LNG
Note: All production rates are gross production basis
UK

Petroleum Year End Review FY2008Slide 28
Shenzi (44% working interest, BHP Billiton operated)
TLP and subsea wells4,300ft water depth – 2nd deepest TLP in the world100 kbpd and 50mmcfd capacity (gross)Fabrication in progress; 2 wells drilled & completed; 3rd well being drilledStart-up mid CY09
Project overview

Petroleum Year End Review FY2008Slide 29
Pyrenees (71.43% working interest, BHP Billiton operated)
FPSO and subsea wells96 kbpd and 60 mmcfd capacity (gross)FPSO conversion underwayDrilling to commence December 2008Start-up H1 CY10
Project overview

Petroleum Year End Review FY2008Slide 30
Kipper (32.5% working interest, non-operated)
Subsea tie-back10 kbpd and 80 mmcfd capacity (gross)Subsea contracts executedStart-up CY11
Project overview

Petroleum Year End Review FY2008Slide 31
Turrum (50% working interest, non-operated)
New bridge linked platform11 kbpd and 200 mmcfd capacity (gross)Currently in executionStart-up CY11
Project overview

Petroleum Year End Review FY2008Slide 32
North West Shelf (16.67% working interest, non-operated)Train 5, Angel, North Rankin B
Train 5: 4.4 mpta (gross) LNG train – Start-up announced 1 September 2008Angel: 50 kbpd and 800 mmcfd (gross) - end CY08NRB: 2,500 mmcfd (gross) - CY12All currently in execution
Project overview
Petroleum Year End Review FY2008Slide 33
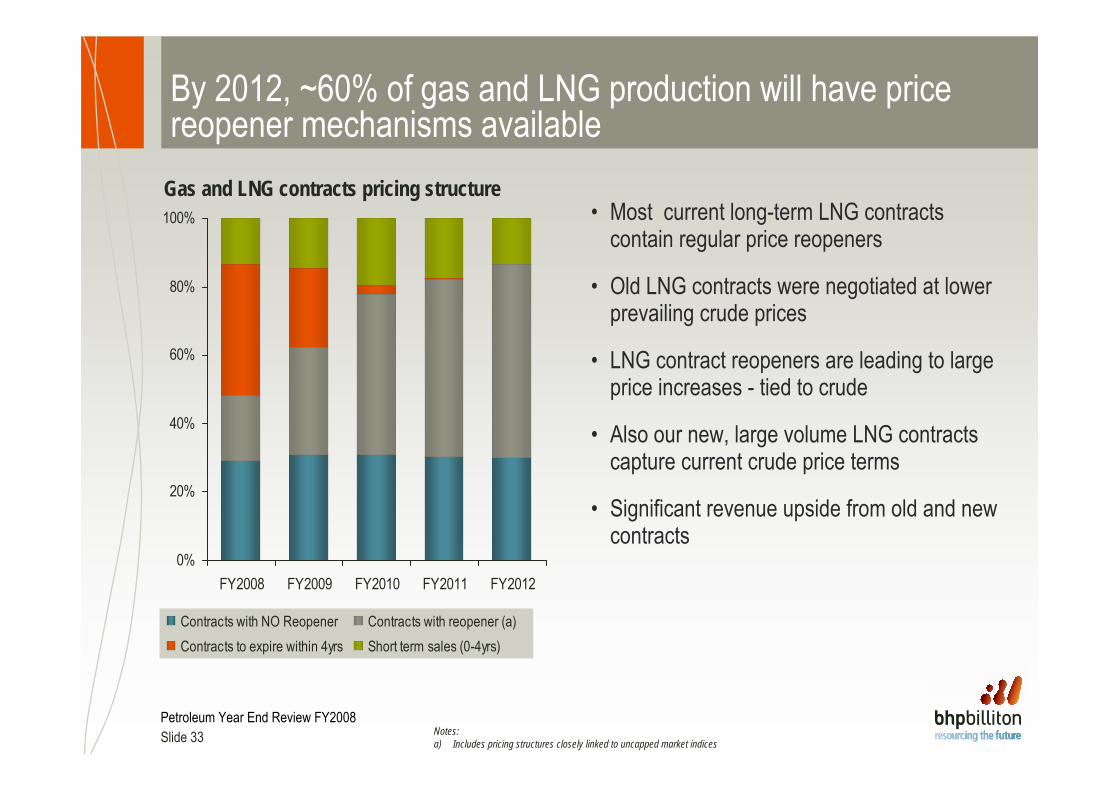
By 2012, ~60% of gas and LNG production will have price reopener mechanisms available
• Most current long-term LNG contracts contain regular price reopeners
• Old LNG contracts were negotiated at lower prevailing crude prices
• LNG contract reopeners are leading to large price increases - tied to crude
• Also our new, large volume LNG contracts capture current crude price terms
• Significant revenue upside from old and new contracts
Gas and LNG contracts pricing structure
0%
20%
40%
60%
80%
100%
FY2008 FY2009 FY2010 FY2011 FY2012
Contracts with NO Reopener Contracts with reopener (a)Contracts to expire within 4yrs Short term sales (0-4yrs)
Notes:a) Includes pricing structures closely linked to uncapped market indices

Petroleum Year End Review FY2008Slide 34
Projects – Pre-execution
Petroleum HQ Algeria
UK
Pakistan
Gulf of MexicoMad Dog WestSubsea tie-back
PumaSubsea tie-back
Shenzi NSubsea tie-back
Neptune NSubsea tie-back
Knotty HeadDeepwater development
MacedonSubsea wells and gas plant
ThebeLNG development
ScarboroughLNG development
Browse LNGLNG development
W Australia
OIL GAS LNG
NWS CWLHReplacement of FPSO and associated subsea facilities
North West Shelf
NWS WFGHGas field development
AlgeriaROD/OhanetDevelopment Drilling
PakistanZamzamaDevelopment Drilling
UKLiverpool BayDevelopment Drilling
Eastern AustraliaBass StraitDevelopment Drilling
TrinidadAngostura Gas (45%)
• Gas field development• Startup anticipated H1 CY11

Petroleum Year End Review FY2008Slide 35
Exploration FY2008 results

Petroleum Year End Review FY2008Slide 36
A rejuvenated exploration program is now underway• Increased spending by 75% to
US$692m in FY08 from US$395m in FY07 (net)
• Spent US$284m to capture 84 GoMblocks
– Total of 376 Blocks, 264 Operated• Progressed multiple 3D seismic
programs– Malaysia offshore– Western Australia offshore– Colombia offshore
• Captured large acreage offshore Falklands Islands
• Progressed strategy to own higher working interest and operate

Petroleum Year End Review FY2008Slide 37
Key exploration and appraisal wells anticipated over coming years
Canadian Laurentian1 well planned
Gulf of Mexico8 wells planned
Falklands2 wells planned
NW Australia6 wells planned
Malaysia4 wells planned
Gippsland1 well plannedMaterial in size to BHP Billiton
Balance proven plays and frontier explorationOpportunities with potential for multiple successesControl and Operatorship
Exploration Strategy
Colombia2 wells planned

Petroleum Year End Review FY2008Slide 38
Today’s agenda
FY2008 Financial Results – BHP Billiton and Petroleum
How We Run BHP Billiton Petroleum
FY2008 Petroleum Performance
― Safety/Environment
― Volumes
― Costs
― Growth-Replenishment
Results

Petroleum Year End Review FY2008Slide 39
Delivering results in FY08Financial Results • Underlying EBIT of US$5.5bn, 22% of BHP Billiton, 82% year-on-year growth
• EBIT ROCE of 68%• EBIT margin of 67.5%, highest in BHP Billiton
How we run BHP Billiton Petroleum
• Functional business model has been established • An experienced management team is in place and executing• The core strategy is clear and simple
Performance • Top quartile industry safety performance• Produced 355 kboed, 13% increase over FY07• 93.8% production uptime• Low cost operations• Gas and LNG contract reopeners, coupled with new volumes, capture current prices
Growth-Replenishment
• Capital expenditure of US$2.1bn, 27% of BHP Billiton• Deep inventory of development projects• Over 100% reserve replacement two years in a row• Exploration portfolio has been rejuvenated with new acreage acquired• 75% increase in exploration expenditure to US$692m (net)• Increased working interest equity and Operatorship• Forecast volume growth of ~10% CAGR to FY11, underpinned by projects in execution

Petroleum Year End Review FY2008Slide 40
Forecast volume growth of ~10% CAGR to FY11, underpinned by projects in execution
0
50
100
150
200
FY07 FY08 FY09E FY10E FY11E
BHP Billiton net production forecast(mmboe/yr)
Gas
Liquids
~10% CAGR
