lehman financial services...
TRANSCRIPT

Lehman Financial Services ConferenceNew York
September 11, 2007

2
Notices
Forward Looking Statements
Certain statements made in these presentations that are not historical facts may constitute “forward-looking” statements under the Private Securities Litigation Reform Act of 1995, including those that are signified by words such as “anticipate”, “believe”, “expect”, “estimate”, “target”, and similar expressions. These forward-looking statements reflect the current views of CIT and its management and are subject to risks, uncertainties, and changes in circumstances. CIT’s actual results or performance may differ materially from those expressed in, or implied by, such forward-looking statements. Factors that could affect actual results and performance include, but are not limited to, potential changes in interest rates, competitive factors and general economic conditions, changes in funding markets, industry cycles and trends, uncertainties associated with risk management, risks associated with residual value of leased equipment, and other factors described in our Form 10-K for the year ended December 31, 2006 and 10-Q for the quarter ended June 30, 2007. CIT does not undertake to update any forward-looking statements.
This presentation is derived from CIT’s publicly available information and is to be used solely as part of CIT management’s continuing investor communications program. This presentation has not been prepared in connection with, and should not be used in connection with, any offering of securities by CIT. For the sale of any securities by CIT you are directed to rely only upon the offering document for those particular securities.
Data as of or for the period ended June 30, 2007 unless otherwise noted.
3
Building on Nearly 100 Years of Success
$7 Billion Market Capitalization
Global Servicing Capabilities
Customized Financial Solutions
Strong Credit Culture
Managed Assets $80 Billion
Premium Brand
Diverse Portfolio

4
Agenda
What’s New?
What’s the Same?
Evolving business environmentDecisions on home lending Migration of funding strategy
Strong business franchisesStrategic initiativesCore value proposition

5
Evolving Business Environment
Re-pricingof
Risk
ReducedMarket
Competition
FragileInvestor
Sentiment
ReducedMarketLiquidity
WeakenedHousingSector

6
Diverse and Liquid Asset Base
• High quality and liquid portfolio• Strong asset cash flows support
franchise• No industry represents more than
15% of asset base• Less than 20% of assets are
encumbered• Broad geographic spread of risk• Prudent loan loss reserves
Services
Portfolio Assets
13%
14%
9%11%
4%2%2%
5%
7%
14%19%Other*
Manufacturing
Home Lending
Educational Lending
RetailCommercial Air
Consumer-OtherWholesale
Transportation
Healthcare
Services
*No other industry greater than 2%

7
Flexible Funding Model
• Match-funded portfolio• Resilient liability structure• Proven secured programs• Strong capital generation• Solid credit ratings
15%
53%
8%
7%
2%8% 7%
Capital Structure
Commercial Paper
Secured –on B/S
LTD –Due < 1year
LTD – Due > 1 year
Secured – off B/S
Common Equity
Preferred & Sub Debt
Data as of June 30, 2007

8
Funding Plan Progressing
~$5 billion of unsecured commercial paper outstanding
Continue to issue commercial paper daily
Costs have increased with overall market
Short-term Financing
Long-term Financing
Second half 2007 term funding needs of approximately $6-8 billion
Completed about half of that funding in the secured markets since June 30, 2007$1.8B Student lending$1.5B Trade Finance$0.3B Equipment
Opportunistically tap the capital markets if economics are right
Data as of August 31, 2007

9
Strong Alternate Liquidity
$12B of committed and available liquidity$7.5B unsecured facilities available
No material adverse change clause
1 financial covenant: Net worth >$4B
$4.5B secured facilities available
Bank sponsored multi-issuer conduits
Diverse asset classes (equipment, vendor, trade and student loans)
Ability to fund against other portfolio assets (asset based loans, mortgages, SBA loans, airplanes and railcars)
Data as of August 31, 2007

10
Continued Progress on Home Lending
Announced intent to exit home lending business on July 18, 2007Classified assets as held for sale Recorded a $731M pre-tax charge reflecting fair-value adjustment
Established task force to evaluate strategic options
Announced closing of origination operations on August 28, 2007
Analyzing optimal liquidation strategy and related accounting treatment
Maximizing loan collection and servicing efforts to ensure best performance
Monitoring results in Q3 and Q4:Portfolio to generate $40-$50 million of pre-tax earnings per quarter which will bolster the home lending equity base (excludes $35M restructuring charge in Q3)Expected losses of ~$50 million per quarter largely factored into 6/30 fair value adjustment
Completed Actions
On-going Initiatives

11
Home Lending Portfolio Statistics
~ 90% 1st liens and owner occupied
Geographically diverse portfolio
Limited ‘interest only’ exposure
No ‘negative am’ or ‘option ARMS’
59% fully documented loans
43% fixed rate
50% of reset risk in 2009 or beyond
Better than sub-prime industry stats:129 bps losses (YTD)6.5% delinquency (60+) 2.1% foreclosure rate
82%Loan-to-value
41%Debt to Income
20 MonthsSeasoning*
8 yearsEmployment
6 yearsResidence
$128KLoan Size
636FICO
Portfolio averages at June 30, 2007
Demographics Characteristics
* Weighted AverageIndustry data cited from: LoanPerformance, A Subsidiary of First American Real Estate Solutions

12
Franchise Businesses Drive Earnings and Growth
Transportation Finance
Trade Finance
Corporate Finance
Vendor Finance
Student / SBL
10% 14%
29% 25%
16%24%
17%
25%14%
5%14%7%
Home Lending
Based on full year 2006
% Managed Assets % Income

13
Market leader with global presence
Thousands of vendor relationships including Dell, Microsoft, Avaya and Snap-on-Tools
Efficient and scalable platforms
Collateral and residual management expertise
Vendor Finance: Remains Strong
Continuing to invest capital in high growth / high ROE segment
Maintaining strong credit performance and residual realization
Strong organic originations off-setting lower Dell Financial Services volumes
Focused on realizing synergies from recent Barclays and Citi acquisitions
Microsoft roll-out remains on schedule
Studying feasibility of funding vendor assets in CIT Bank
17%0.58%51%
$452M$17.0B
YTD6/30/07
ROECharge-offsEfficiencyRevenueManaged Assets
Business ProfileFinancial Profile
Business Update

14
Leading factoring business in the U.S.
Long-term client relationships with thousands of customer credit profiles
Track record of navigating retail credit cycles and highly efficient processing
Annuity-like earnings and consistent returns
Trade Finance: A Recognized Leader
Commission rates poised to recover following dip on benign credit
Seasonal build-up in inventories/volume in progress
Focused on expanding international presence
Further efficiency studies underway
17%0.51%38%
$199M$6.9B
YTD 6/30/07
ROECharge-offsEfficiencyRevenueManaged Assets
Business ProfileFinancial Profile
Business Update

15
Top 3 global aerospace and North American railcar lessor
Attractive and modern fleets
Experts in managing and maximizing collateral values and residual realization
Strong relationships with deep market penetration
Transportation Finance: Utilization Remains High
Air:Full economic utilization at strong lease rates and good returnsRobust and attractively priced order book will benefit near-term returns
Rail:Strong utilization continues - around 95% Lease rates solid, although coming off cyclical highs
17%-2.02%
34%$227M$12.7B
YTD 6/30/07
ROECharge-offsEfficiencyRevenueManaged Assets
Business ProfileFinancial Profile
Business Update

16
Preeminent lender to middle-market companies
Long-standing referral relationships
Re-invigorated sales culture
Industry focused teams in healthcare, communications, media, entertainment, energy, commercial and industrial.
Corporate Finance: Leveraging Deep Relationships
Balancing liquidity between existing clients and attractive market opportunities
Improved pricing for lenders with a return to more conventional covenants
Slow syndications market impacting fees, but restructuring business gearing up
Originations in less cyclical industries continue strong
13%0.25%47%
$457M$19.8B
YTD 6/30/07
ROE*Charge-offsEfficiency*Revenue*Managed Assets
Business ProfileFinancial Profile
Business Update
* Excludes $229 million (pre-tax) gain on construction sale

17
Top 15 originator Complete front to back end operation Preferred Lender at over 1,400 schoolsPredominantly govt. guaranteed FFELP collateral
Student Lending: An Evolving Story
Operating performance exceeding expectationsNew legislation does not impact current portfolioEvaluating impact of legislation on profitability of future originations
Business ProfileFinancial Profile
Business Update
NMCharge-offs10%ROE
61%Efficiency$76MRevenue
$10.3BManaged Assets
YTD 6/30/07
18
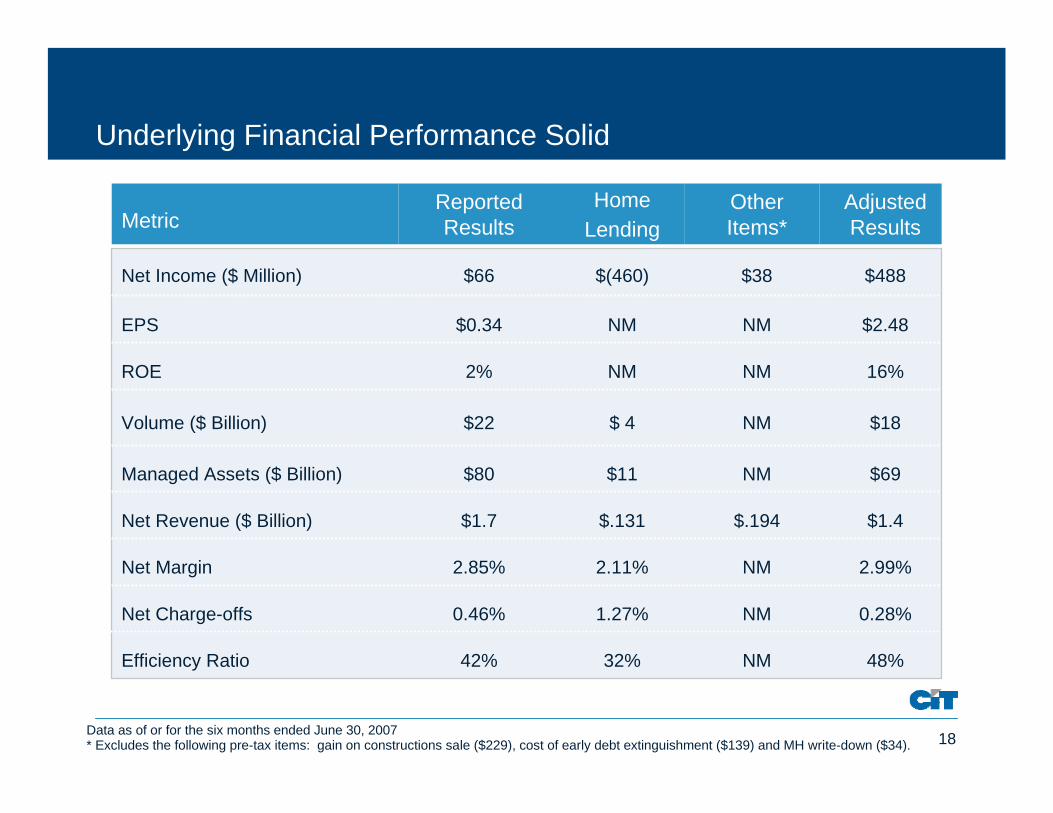
Underlying Financial Performance Solid
$2.48NMNM$0.34EPS
NM
NM
NM
$.194
NM
NM
NM
$38
Other Items*
48%32%42%Efficiency Ratio
0.28%
2.99%
$1.4
$69
$18
16%
$488
Adjusted Results
1.27%
2.11%
$.131
$11
$ 4
NM
$(460)
Home Lending
$22Volume ($ Billion)
$1.7Net Revenue ($ Billion)
2%ROE
0.46%Net Charge-offs
2.85%Net Margin
$80Managed Assets ($ Billion)
$66Net Income ($ Million)
Reported ResultsMetric
Data as of or for the six months ended June 30, 2007* Excludes the following pre-tax items: gain on constructions sale ($229), cost of early debt extinguishment ($139) and MH write-down ($34).

19
$329
$580
$421 $349 $346
2003 2004 2005 2006 6/30/07
0.83%0.94%1.13%
2.02%
1.40%
$588$493
$443 $458$478
2003 2004 2005 2006 6/30/07
1.16%1.43% 1.29%1.64%
2.04%
$495
$263$207
$70$151
2003 2004 2005 2006 YTD '07
0.34%0.66% 0.45%
0.89%
1.79%
Non-Performing Assets
Commercial Credit Quality Remains Excellent
% of FRRepoNon-Accrual
Credit Losses
Delinquent % of FR
Charge-offs % of AFR
Delinquency 60+ Days
Owned portfolio statistics: excludes home lending and student lending

20
Model Designed to Deliver Earnings Through All Cycles
Strong Economy
Growth Capital
Mergers and Acquisitions
Real Estate Packages
Equipment Utilization
Vendor Sales Financing
Competitors enter,margins decline
Weak Economy
Factoring
Restructuring / DIP
Distressed Debt
Advisory Services
Vendor Renewals
Competitors exit, margins improve
Performance Improves Performance Improves

21
Progress on 2007 Strategic Initiatives
Leverage asset manager model
Executed first CLO in MayCompleted Healthcare REIT IPO in JuneAerospace offering in registration
Proactively manage risk and capital
Managing portfolio investmentsProceeds from construction saleInvested in vendor and corporate finance
Completed $500M share repurchase program
Expand global footprint
Acquired Barclays UK/German vendor businessOpened aerospace operation in ChinaExpanded our European leveraged finance team
Drive operational excellence
Reduced second quarter headcountEliminated the operating group structureDriving acquisition synergies

22
CIT: Proven Value Proposition
Leading provider of capital to middle-
market…
… with 100 years of successDiverse Portfolio
Broad-based Revenues
Disciplined Credit Culture
Global Operations
Long-Standing Relationships
Deep Industry Expertise
Sustainable Earnings Growth & Returns

23