leisure and hospitality hotel britain 2015 · leisure and hospitality hotel britain 2015 the guide...
TRANSCRIPT

LEISURE AND HOSPITALITY
HOTEL BRITAIN 2015THE GUIDE TO THE PERFORMANCE OF HOTELS IN THE UK

CONTENTSECONOMY AND TOURISM
UK HOTEL TRANSACTIONS
UK HOTEL DEVELOPMENT TRENDS
2014 SURVEY RESULTS
WINNERS AND LOSERS
SUMMARY OF FIVE YEAR PERFORMANCE
THE ROAD AHEAD
COMPETITION
CLAIRVOYANT CORNER
SURVEY COVERAGE
BDO LEISURE AND HOSPITALITY SERVICES
4
10
14
20
26
29
34
36
38
40
42

THE GUIDE TO THE PERFORMANCE OF HOTELS IN THE UK | HOTEL BRITAIN 2015 2
As we write, global economic and geopolitical uncertainty is still upon us. The European Union continues to be plagued by a stagnating economy and sovereign debt issues; developments in the Ukrainian-Russian conflict have greatly affected international relations and consequently the economy of the Russian Federation; while, further afield, the Chinese economy grew at one of the slowest rates for the last 24 years in 2014.
However, despite the somewhat gloomy scenario, there is still some light at the end of the tunnel. In 2014, the US economy grew by 2.2-2.4% and is forecast to rise above 3% in 2015, the strongest economic growth in a decade for the country. But it is the UK that experienced the strongest rate of growth amongst all developed countries, up 2.8% on the previous year. This was driven by strong consumer spending. The drop in the oil price kept inflation at a record low, and boosted both consumer and business confidence, resulting in reduced unemployment and wage growth.
As a result of this overall economic optimism, hotels in the UK experienced a stellar 2014. Bucking the trend of last year, regional hotels outperformed their London counterparts. Rooms yield for hotels in the regions experienced double digit growth. As demand for hotels remained strong, hoteliers succeeded in pushing AARR up, and resulting in regional hotels experiencing a higher compound annual growth rate over the last five years when compared to the capital.
However, London hotels did not stand still. Despite the significant 4% increase in supply, occupancy remained robust, confirming the importance of the hotel sector in the capital, where hotel’s occupancy is one of the highest across Europe. In the capital, AARR continued to grow, albeit modestly and at a varying speed within different segments. Overall, London hotels continued to post growth in 2014,
with rooms yield for the year already surpassing the peak experienced in 2007.
The health of the UK hotel sector is confirmed by the increase in transactional activity, which reached £6.1bn in 2014, the highest figure since 2006. There has been a rush into regional transactions, where hotels have sold above the asking price last year.
2014 also cemented the importance of the budget segment. New concepts and a modernisation of the offer are underway, with a strong pipeline for the sector at about 47% of the total planned new supply.
Nevertheless, the outlook still remains unclear, especially as the general election in May could cast doubts in the short term, and the strength of the pound might affect inbound visitors. However, as already mentioned, the future of the hotel market is expected to continue on its upward path. The Rugby World Cup will showcase the UK abroad and should positively affect hotel performance for the current year. Furthermore, international visitors are expected to continue to increase in 2015, reaching 35m, boding well for future hotel performance.
FOREWORD
ROBERT BARNARDPartnerLeisure and Hospitality Services [email protected]
Go the regions!


THE GUIDE TO THE PERFORMANCE OF HOTELS IN THE UK | HOTEL BRITAIN 2015 4
ECONOMY AND TOURISM
In 2014, the UK economy grew at a faster rate than any other major advanced economy and recorded its best performance since 2007.The IMF estimates growth for the full year to be at 3.21%, however recent reports suggest that this momentum is now running out of steam, as the Office for National Statistics (ONS) claimed growth for 2014 was at 2.8%. Growth has primarily been attributable to the services sector, but forecasters believe that the recent fall in oil prices will help to fuel growth in the manufacturing sector. The IMF has forecast a slowdown of growth to less than 3% over the coming years.
CPI inflation remains below the Bank of England’s target of 2%, falling to 0.0% in February 2015. Tumbling energy prices, and the strength of the pound have been the main causes for this, and forecasters believe that this could turn negative in the short to medium term. However, this is generally good news for the UK economy, as it should fuel household spending which is an important driver. Inflation is expected to rebound by the end of the year as these effects are absorbed. The current account deficit stood at -4.22% of GDP. This figure highlights that with relatively stronger household spending the UK is becoming even more dependent on foreign capital.
The UK government’s gross debt increased slightly in 2014 to 91.89% of total GDP. According to the ONS, general government gross debt stood at £1,457.2bn at the end of November 2014, an increase of £89.7bn when compared with the previous year.
The labour market continues to show positive signs of recovery with the ONS reporting 30.9m people in work at the end of 2014. Between October and December 2014, the rate of unemployment fell to 5.7% (1.91m), the lowest level for six years. This was as a result of increasing
TABLE 1: UK economic indicators, 2012-2016f
2012 2013 2014f 2015f 2016f
Real GDP Growth (%) 0.28 1.74 3.21 2.71 2.44
CPI inflation (%) 2.82 2.56 1.63 1.80 2.00
Current account deficit (% GDP)
-3.83 -4.51 -4.22 -3.77 -3.30
Government gross debt (% GDP)
89.06 90.58 91.98 93.11 92.92
Unemployment (%) 7.95 7.60 6.35 5.78 5.47
SOURCE: International Monetary Fund, October 2014fforecast
VISITOR NUMBERS INCREASE International visitor numbers grew for the fourth consecutive year in 2014. Visitors increased by 5.8% to 34.8m, an all time high. Overall, the holiday segment remained the main driver of growth, up 7.7%, accounting for almost two-fifths of the total. However, results are still provisional and there is speculation that the total inbound visitor numbers will surpass the 35m mark during the current year.
signs of confidence in the economy and the number of vacancies at a 14 year high. Unemployment is forecast to continue declining further during 2015, albeit at a slower pace.
Notwithstanding the reported good figures, further struggles to grow in the Eurozone and uncertainty surrounding the imminent election could compromise recovery and a return to strong growth.

HOTEL BRITAIN 2015 | THE GUIDE TO THE PERFORMANCE OF HOTELS IN THE UK5
Europe continues to be the main inbound market for the UK, accounting for about three-quarters of the total, or 25.8m. North American visits for 2014 were up 4% to 3.7m. However, the segment has slowed its pace of growth, mainly due to the 11% drop in visits from Canada.
Figure 1 shows the seasonality of inbound visits to the UK. Total visits peaked during the month of June 2014, surpassing the 3m mark, up 13.6% on the same month the previous year. This was as a result of the increase in visits from Europe, while the North American market remained flat (-0.5%) and the rest of the world declined marginally by 1% to 444,000.
Overall January and March were the lowest performing months for inbound visits over the last two years, with the summer months generally welcoming more visitors to the UK.
Vis
itors
(in
thou
sand
s)
0
500
1,000
1,500
2,000
2,500
3,000
3,500
Dec
-14
Nov
-14
Oct
-14
Sep-
14Au
g-14
Jul-
14Ju
n-14
May
-14
Apr-
14M
ar-1
4Fe
b-14
Jan-
14D
ec-1
3N
ov-1
3O
ct-1
3Se
p-13
Aug-
13Ju
l-13
Jun-
13M
ay-1
3Ap
r-13
Mar
-13
Feb-
13Ja
n-13
Dec
-12
All visits Europe Other countries North America
FIGURE 1: Overseas visitors to UK, by source market 2013-2014
SOURCE: International Passenger Survey, ONS
2010 2011 2012 2013 2014 2014 % change 2014 market share
Holiday 11,668 12,008 11,961 12,781 13,760 7.7% 39.5%
Business 6,793 7,238 7,422 7,931 8,370 5.5% 24.1%
Visit friends or family (VFF) 8,408 8,841 8,948 9,369 9,840 5.0% 28.3%
Miscellaneous 2,935 2,710 2,752 2,812 2,830 0.6% 8.1%
All visits 29,803 30,798 31,084 32,893 34,800
Year-on-year growth -6.5% 3.3% 0.9% 5.8% 5.8%
SOURCE: VisitBritain Monthly Update: December 2014
2014 figures are provisional
TABLE 2: Overseas visitors to the UK, by purpose of visit (thousands)

THE GUIDE TO THE PERFORMANCE OF HOTELS IN THE UK | HOTEL BRITAIN 2015 6
Figure 2 shows the year-on-year percentage change for selected inbound markets to the UK during 2014. We note that visits from Southern Europe grew very strongly last year, with visits from Greece experiencing a second consecutive year of growth. Singapore (+24%) and Saudi Arabia (+29%) also grew considerably, with both countries reversing a negative trend experienced in 2013. Conversely, visits from Mexico (-15%) and China (-7%) declined during 2014 in contrast to the strong growth experienced during the previous year.
Figure 3 shows a comparison between inbound and domestic visits and spending to the UK. However, domestic visitor numbers for the full year were not available at the time of writing. Inbound visitor expenditure in 2014 mirrored the increase in visits. Expenditure was up 3.5% to £21.7bn. Domestic visitors for the year to date to October 2014 were down -6.5% to 96.7m when compared to the previous year. Domestic expenditure was also down, albeit to a lesser extent (-2.5% to £19.6bn). We note that, generally speaking, November is a strong month for corporate activity, and December sees a lot of visits to family and friends during the Christmas period, which could result in different figures for the full year.
TABLE 3: Domestic tourism by purpose of visit (YTD October)
2010 2011 2012 2013 20142013-2014 % change
Holiday 50.2 53.0 51.2 50.8 47.7 -6.1%
Business 13.5 15.4 15.4 15.1 13.9 -8.0%
Visit friends or family (VFF)
33.8 35.9 33.5 34.0 32.5 -4.5%
Miscellaneous 2.8 3.4 3.5 3.5 2.6 -26.2%
All visits 100.4 107.6 103.6 103.5 96.7
Year-on-year growth 7.2% -3.8% -0.1% -6.6%
SOURCE: ONS, Overseas Travel and Tourism; Great Britain Tourism Survey October 2014, Great Britain Tourism Survey 2013
-20
-10
0
10
20
30
40
Gre
ece
Port
ugal
Turk
ey
Sing
apor
e
Can
ada
Mex
ico
27%
35%
28%24%
-7%
-13%
Nig
eria
-11%-15%
Braz
il
New
Zea
land
Saud
i Ara
bia
Chi
na
12%
21%
29%
FIGURE 2: Percentage change in visits from selected countries
SOURCE: VisitBritain, Monthy Inbound Update: December 2014 (2014 figures are provisional)
0
20
40
60
80
100
120
140
2010 2011 2012 2013 2014
Vis
itors
(mill
ions
)
Spen
d (£
billi
ons)
Domestic visitors (millions)Inbound visitors (millions)
Domestic visitors (millions)Inbound visitors (millions)
0
5
10
15
20
25
30
FIGURE 3: All UK visitors expenditure 2010-2014
SOURCE: ONS, Overseas Travel and Tourism; Great Britain Tourism Survey October 2014, Great Britain Tourism Survey 2013 (Domestic figures as per October 2014)

HOTEL BRITAIN 2015 | THE GUIDE TO THE PERFORMANCE OF HOTELS IN THE UK7
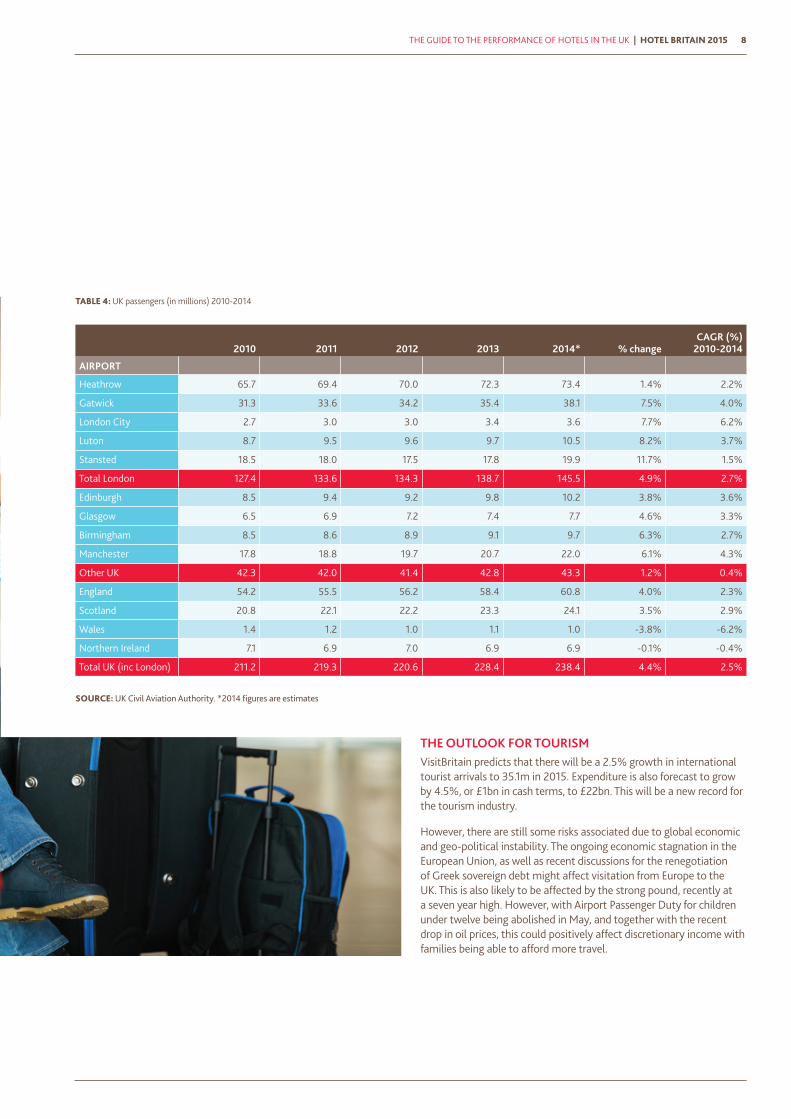
PASSENGER NUMBERSAccording to the UK Civil Aviation Authority (CAA), UK airports experienced another year of strong growth with passenger numbers up 4.4% to 238.4m in 2014, the fourth year of growth. The growth in passengers was distributed fairly evenly between London (up 4.9% to 145.5m) and regional UK (up 3.5% to 92.8m).
Excluding London airports, England was the best performing region for passenger traffic, up 4% to 60.8m. However, Scotland experienced the best compound of annual growth rate (CAGR) (2.9%), with strong growth reported by both Glasgow and Edinburgh. Edinburgh Airport surpassed the 10m mark, thanks to the addition of new long haul routes. The Barclays Tourist Dynamic Report also predicts that visitors to Scotland will increase by 40% by 2017, boding well for future tourism performance.
In Wales, Cardiff International Airport saw a -3.8% decline in passenger numbers to 1m. On the other hand, the flat performance for Northern Ireland airports is likely to reverse in 2015, with the introduction of seasonal Virgin Atlantic flights from Belfast during the summer.
Stansted was the only London airport to experience double digit growth in 2014, up 11.7% to 19.9m passengers. The airport now serves more than 170 destinations worldwide and it is linked to more EU destinations than any other UK airport. Acquired by the Manchester Airport Group in 2013, the airport has been under redevelopment with further talks at government levels for improved rail connections to the Essex hub.
Southend Airport also experienced strong growth in 2014, with a 13.6% increase in passenger numbers to 1.1m. The airport saw Flybe adding six new routes in the year, and also easyJet strengthening its presence at the airport.
Prestwick Airport saw a 20.3% decline in passenger numbers to 912,000 in 2014. After been purchased by the Scottish Government for one pound, the airport saw Ryanair moving some flights to Glasgow International. At present there are discussions about the possibility of the airport been made into the first UK spaceport.
Cambridge was the top performing airport for year on year growth in 2014, up a staggering 123.4% to 21,000 passengers. This was the result of Cityjet running summer flights to Dublin and Amsterdam. However, these air links were cancelled in the autumn and despite a £17m deal to upgrade its runway, the airport continues to suffer from the impact of strong seasonality.
THE GUIDE TO THE PERFORMANCE OF HOTELS IN THE UK | HOTEL BRITAIN 2015 8
TABLE 4: UK passengers (in millions) 2010-2014
2010 2011 2012 2013 2014* % changeCAGR (%)
2010-2014
AIRPORT
Heathrow 65.7 69.4 70.0 72.3 73.4 1.4% 2.2%
Gatwick 31.3 33.6 34.2 35.4 38.1 7.5% 4.0%
London City 2.7 3.0 3.0 3.4 3.6 7.7% 6.2%
Luton 8.7 9.5 9.6 9.7 10.5 8.2% 3.7%
Stansted 18.5 18.0 17.5 17.8 19.9 11.7% 1.5%
Total London 127.4 133.6 134.3 138.7 145.5 4.9% 2.7%
Edinburgh 8.5 9.4 9.2 9.8 10.2 3.8% 3.6%
Glasgow 6.5 6.9 7.2 7.4 7.7 4.6% 3.3%
Birmingham 8.5 8.6 8.9 9.1 9.7 6.3% 2.7%
Manchester 17.8 18.8 19.7 20.7 22.0 6.1% 4.3%
Other UK 42.3 42.0 41.4 42.8 43.3 1.2% 0.4%
England 54.2 55.5 56.2 58.4 60.8 4.0% 2.3%
Scotland 20.8 22.1 22.2 23.3 24.1 3.5% 2.9%
Wales 1.4 1.2 1.0 1.1 1.0 -3.8% -6.2%
Northern Ireland 7.1 6.9 7.0 6.9 6.9 -0.1% -0.4%
Total UK (inc London) 211.2 219.3 220.6 228.4 238.4 4.4% 2.5%
SOURCE: UK Civil Aviation Authority. *2014 figures are estimates
THE OUTLOOK FOR TOURISMVisitBritain predicts that there will be a 2.5% growth in international tourist arrivals to 35.1m in 2015. Expenditure is also forecast to grow by 4.5%, or £1bn in cash terms, to £22bn. This will be a new record for the tourism industry.
However, there are still some risks associated due to global economic and geo-political instability. The ongoing economic stagnation in the European Union, as well as recent discussions for the renegotiation of Greek sovereign debt might affect visitation from Europe to the UK. This is also likely to be affected by the strong pound, recently at a seven year high. However, with Airport Passenger Duty for children under twelve being abolished in May, and together with the recent drop in oil prices, this could positively affect discretionary income with families being able to afford more travel.


THE GUIDE TO THE PERFORMANCE OF HOTELS IN THE UK | HOTEL BRITAIN 2015 10
The UK hotel transaction market continued in an upward direction, building on the gains made in 2013. JLL reported that in 2014 the total of commercial real estate investment in the UK amounted to £65bn. This was 3% higher than the 2006 peak, as well as 13% higher than the 2013 figure. During the same year, hotel deals accounted for about 10% of the total, with Savills reporting that the total transaction value for UK hotels in 2014 was £6.1bn, the highest since 2006.
Our predictions in the 2014 issue of Hotel Britain proved correct. In 2014, the majority of transactions, i.e. about two-thirds of the total, were of single assets. Last year we also predicted notable activity in the midscale/ budget end of the market. This was evidenced by Kew Green buying 25 Holiday Inn hotels in four different transactions, as well as the sale of 144 Travelodges bought by a consortium of Avenue Capital, Goldentree Asset Management and Goldman Sachs for an estimated £520m. In addition, Lone Star and Somerston Capital bought twelve Holiday Inn Express hotels across the UK.
Notable single transactions for the year include the 200 bedroom Harrington Hall Hotel in London, bought for £89m by Middle Eastern investors; the 50% stake acquisition of The Savoy Hotel sold by Lloyds Banking Group; the acquisition of the Grand Hotel Brighton by a company owned by Galen & Hilary Weston; and the acquisition of the Turnberry Resort in Scotland sold by Leisurecorp to The Trump Organisation for an estimated £35.7m.
The average transaction value in 2014 was £66m, up 30.6% from the previous year. This was mainly attributed to the improved UK economic conditions which continued to boost investor confidence. Secondly, 2014 experienced less portfolio transactions when compared to the previous year, with only one-third of all transactions being multiple asset deals. This is also reflected in the average price per key, which increased by 5.3% to £169,085 in 2014 when compared to the previous year.
However, despite the increase in the overall value of transactions, the price per room did not increase significantly due to the high amount of mid- and lower-scale hotel transactions, as well as investors moving out of primary locations to seek better value for money.
UK HOTEL TRANSACTIONS
0
10
20
30
40
50
60
70
80
2009 2010 2011 2012 2013 2014
14.902
66.763
54.700
32.403
50.521
65.968
Aver
age
valu
e pe
r tra
nsac
tion
(£m
)
FIGURE 4: Average value of transaction
SOURCE: BDO research
2009 2010 2011 2012 2013 2014
£149,045
£319,316
£197,967£216,525
£160,563 £169,085
Aver
age
pric
e pe
r roo
m (£
m)
0
£50,000
£100,000
£150,000
£200,000
£250,000
£300,000
£350,000
FIGURE 5: Average price per room in UK hotel transactions
SOURCE: BDO research

HOTEL BRITAIN 2015 | THE GUIDE TO THE PERFORMANCE OF HOTELS IN THE UK11
INVESTMENT TRANSACTIONS ARE ABOVE ASKING PRICESDespite seeking good value for money deals, investors were ready to pay above the asking price to secure assets. An example of this was the KSL acquisition of the De Vere Village Urban Resorts portfolio for a reported £480m, 6% above the asking price.
Kew Green is also reported to have paid £30m above the price tag for a deal including 19 Holiday Inn Hotels across UK. This represents a staggering 42.8% above the asking price.
The trend is likely to continue in 2015, with the Radisson Blu Royal Mile Hotel in Edinburgh being sold for more than the £59m price tag. This is primarily the result of increased economic conditions and a returning appetite for investments.
THE YEAR OF REGIONAL TRANSACTIONSJLL reported that overall the total commercial real estate investment in the UK regions was up 70% in 2014 to a combined value of £28bn. This is reflected in our study: about two-thirds of total hotel transactions were carried out in the regions during 2014. Investors continued to seek good investment opportunities in primary regional locations. However, the market also started looking to secondary locations.
Examples include the continued expansion of Topland in the regional market, with the company acquiring Hallmark Hotels in 2014 and The Feathers Group at the beginning of 2015. Starwood Capital also consolidated its presence by the acquisition of the Four Pillars hotel portfolio.
LONDON HOTEL PRICES STABILISE, REGIONAL HOTELS PRICES PICK UPTable 5 shows the comparison of price per room for transactions in London and the regions in 2014. It is interesting to note that the average price per room in regional UK was up by 30% when compared to the previous year. The median price was also up by about 14%.
However, as no hotel in London surpassed the £1m price per room tag, the average prices for the capital declined by 10% to £337,774 when compared to the previous year. We note that this was mirrored in the 8.8% decline in the highest price paid per room, which was for the Park City Hotel Kensington in December (£967,742).
As mentioned earlier, London hotels saw more stable average prices in 2014 when compared to the previous year. The average price per room was £337,774 and this was despite an increase in the top end of the market hotel transactions. However, the highest price per room paid in London in 2014 was below the £1m mark per room paid for the Parkes hotel in 2013. On the other hand, the lowest price per room paid in the capital was for the Travelodge Enfield, at £75,758, up 13.6% when compared to the comparable transaction last year.
In the regions, the highest price per room was for the five-star Lowry Hotel in Manchester, sold by Rocco Forte Hotels to Westmont Hospitality Group and Mount Kellett Capital Management for a total of £40m, or £272,727 per room. This compared to the Park Inn by Radisson Leigh which commanded a £18,519 price per room tag when purchased by Kro Hotels.
TABLE 5: Comparison of price per room for transactions in London and the regions 2014
Price per room (£)
Average (mean) Median Highest Lowest
London 337,774 258,621 967,742 75,758
Regions 97,236 71,148 272,727 18,519

THE GUIDE TO THE PERFORMANCE OF HOTELS IN THE UK | HOTEL BRITAIN 2015 12
THE FUTURE – 2015
2015 is expected to see continuing robust trading activity. Early indicators of this are the divestment of the Moorfield Real Estate Funds, as well as KSL seeking a buyer for the Malmaison and Hotel du Vin portfolio and the sale of the Jurys Inn group to Lone Star.
The year ahead will continue to see an increase in lenders willing to offer finance as their appetite for investment returns due to the improved overall economic conditions. There is also the possibility of an increase in sales of assets to crystallise profits from properties acquired during or shortly after the economic downturn.
Overall, there is still pressure on operating performance, with hotels needing to shore up their bottom lines in order to command premium prices during the sale process.

HOTEL BRITAIN 2015 | THE GUIDE TO THE PERFORMANCE OF HOTELS IN THE UK13
THE GUIDE TO THE PERFORMANCE OF HOTELS IN THE UK | HOTEL BRITAIN 2015 14
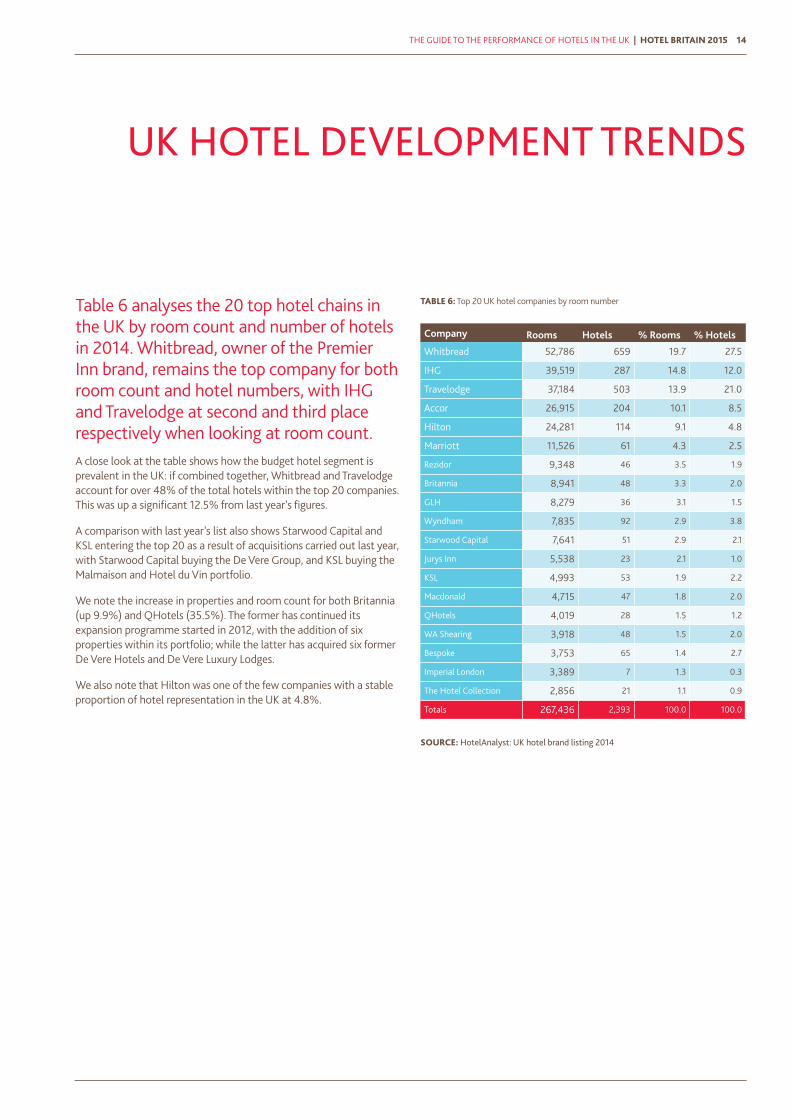
Table 6 analyses the 20 top hotel chains in the UK by room count and number of hotels in 2014. Whitbread, owner of the Premier Inn brand, remains the top company for both room count and hotel numbers, with IHG and Travelodge at second and third place respectively when looking at room count. A close look at the table shows how the budget hotel segment is prevalent in the UK: if combined together, Whitbread and Travelodge account for over 48% of the total hotels within the top 20 companies. This was up a significant 12.5% from last year’s figures.
A comparison with last year’s list also shows Starwood Capital and KSL entering the top 20 as a result of acquisitions carried out last year, with Starwood Capital buying the De Vere Group, and KSL buying the Malmaison and Hotel du Vin portfolio.
We note the increase in properties and room count for both Britannia (up 9.9%) and QHotels (35.5%). The former has continued its expansion programme started in 2012, with the addition of six properties within its portfolio; while the latter has acquired six former De Vere Hotels and De Vere Luxury Lodges.
We also note that Hilton was one of the few companies with a stable proportion of hotel representation in the UK at 4.8%.
UK HOTEL DEVELOPMENT TRENDS
TABLE 6: Top 20 UK hotel companies by room number
Company Rooms Hotels % Rooms % Hotels
Whitbread 52,786 659 19.7 27.5
IHG 39,519 287 14.8 12.0
Travelodge 37,184 503 13.9 21.0
Accor 26,915 204 10.1 8.5
Hilton 24,281 114 9.1 4.8
Marriott 11,526 61 4.3 2.5
Rezidor 9,348 46 3.5 1.9
Britannia 8,941 48 3.3 2.0
GLH 8,279 36 3.1 1.5
Wyndham 7,835 92 2.9 3.8
Starwood Capital 7,641 51 2.9 2.1
Jurys Inn 5,538 23 2.1 1.0
KSL 4,993 53 1.9 2.2
Macdonald 4,715 47 1.8 2.0
QHotels 4,019 28 1.5 1.2
WA Shearing 3,918 48 1.5 2.0
Bespoke 3,753 65 1.4 2.7
Imperial London 3,389 7 1.3 0.3
The Hotel Collection 2,856 21 1.1 0.9
Totals 267,436 2,393 100.0 100.0
SOURCE: HotelAnalyst: UK hotel brand listing 2014
HOTEL BRITAIN 2015 | THE GUIDE TO THE PERFORMANCE OF HOTELS IN THE UK15
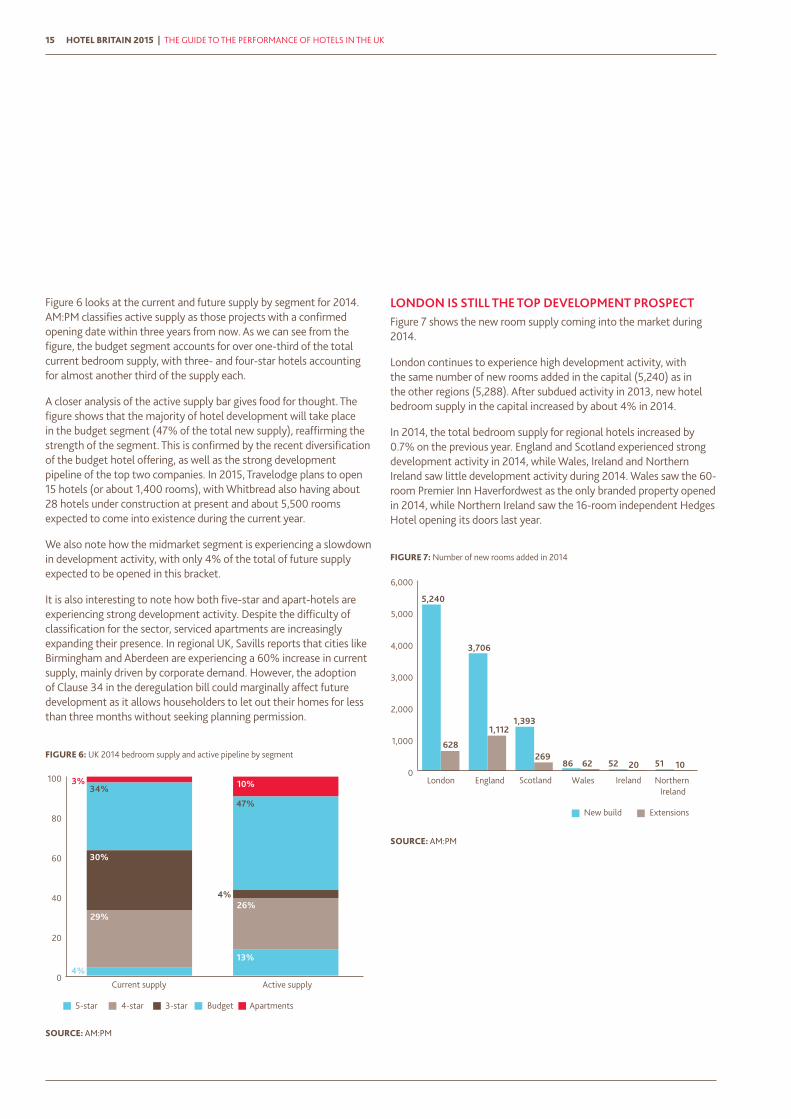
Figure 6 looks at the current and future supply by segment for 2014. AM:PM classifies active supply as those projects with a confirmed opening date within three years from now. As we can see from the figure, the budget segment accounts for over one-third of the total current bedroom supply, with three- and four-star hotels accounting for almost another third of the supply each.
A closer analysis of the active supply bar gives food for thought. The figure shows that the majority of hotel development will take place in the budget segment (47% of the total new supply), reaffirming the strength of the segment. This is confirmed by the recent diversification of the budget hotel offering, as well as the strong development pipeline of the top two companies. In 2015, Travelodge plans to open 15 hotels (or about 1,400 rooms), with Whitbread also having about 28 hotels under construction at present and about 5,500 rooms expected to come into existence during the current year.
We also note how the midmarket segment is experiencing a slowdown in development activity, with only 4% of the total of future supply expected to be opened in this bracket.
It is also interesting to note how both five-star and apart-hotels are experiencing strong development activity. Despite the difficulty of classification for the sector, serviced apartments are increasingly expanding their presence. In regional UK, Savills reports that cities like Birmingham and Aberdeen are experiencing a 60% increase in current supply, mainly driven by corporate demand. However, the adoption of Clause 34 in the deregulation bill could marginally affect future development as it allows householders to let out their homes for less than three months without seeking planning permission.
LONDON IS STILL THE TOP DEVELOPMENT PROSPECTFigure 7 shows the new room supply coming into the market during 2014.
London continues to experience high development activity, with the same number of new rooms added in the capital (5,240) as in the other regions (5,288). After subdued activity in 2013, new hotel bedroom supply in the capital increased by about 4% in 2014.
In 2014, the total bedroom supply for regional hotels increased by 0.7% on the previous year. England and Scotland experienced strong development activity in 2014, while Wales, Ireland and Northern Ireland saw little development activity during 2014. Wales saw the 60-room Premier Inn Haverfordwest as the only branded property opened in 2014, while Northern Ireland saw the 16-room independent Hedges Hotel opening its doors last year.
0
1,000
2,000
3,000
4,000
5,000
6,000
London England Scotland Wales Ireland
New build Extensions
Northern Ireland
5,240
628
3,706
1,1121,393
26951 1086 62 52 20
FIGURE 7: Number of new rooms added in 2014
SOURCE: AM:PM
0
20
40
60
80
100
Current supply Active supply
20.0%29%
4%
34%3%
30%
26%
13%
47%
10%
5-star 4-star 3-star Budget Apartments
4%
FIGURE 6: UK 2014 bedroom supply and active pipeline by segment
SOURCE: AM:PM

THE GUIDE TO THE PERFORMANCE OF HOTELS IN THE UK | HOTEL BRITAIN 2015 16
NEW TRENDSSharing economy
The rise of the likes of Airbnb is likely to affect future demand patterns for hotels. While the impact of such alternative forms of accommodation is not fully understood in the EU market, the reaction to this form of accommodation has varied. Barcelona has fined Airbnb €30,000 as the company breached local tourism laws, while Berlin has claimed that the rise of the practice led to an increase in rental prices and has banned short term lettings.
However, Amsterdam has passed a law aimed to allow the short term rentals in return for tax payments, while London’s proposal to overturn a 40 year-old law banning short term rental has encountered opposition from its local authorities.
Emergence of new markets
The emergence of travellers from other parts of the world will influence the offering and marketing of hotels across the globe, as widely demonstrated by hotels and hotel companies fully exploiting social media channels.
Tech and app friendly rooms
Hotel rooms are increasingly becoming an extension of mobile phones and other technology. Following the introduction of i-Pads to control room temperature and lighting and mobile key technology, there is a clear demand for techno-savvy hotel rooms. Smart TV, interactive tourism guides, and improved Wi-Fi connectivity are only some of the new improvements introduced by hotels. The latest example is the refurbishment of the Express by Holiday Inn concept which will be rolled out in Europe during the next three years.
Continued interest in the budget segment
Having driven strong growth in 2014, the budget segment has reaffirmed its status as one of the most important segments for the industry. Recently new brands and concepts have entered the UK hotel market, and this is expected to continue even further as customers remain highly price conscious and seek good value for money deals.

HOTEL BRITAIN 2015 | THE GUIDE TO THE PERFORMANCE OF HOTELS IN THE UK17
PLANNED HOTEL OPENINGS 2015:A selection of planned hotel rooms openings in key cities
Source: BDO Research and Hotelsdata
London
6,400
Aberdeen
540
Bath
99
Brentford
124
Birmingham
166
Chester
63
Edinburgh
304
Exeter
120
Glasgow
492
Liverpool
472
Manchester
838
Middlesbrough
138
Newcastle
250
Southampton
259
Southend on Sea
80Heathrow
184

THE GUIDE TO THE PERFORMANCE OF HOTELS IN THE UK | HOTEL BRITAIN 2015 18
LONDON (CIRCA 6,400)
CitizenM: 2 hotelsCompany: CitizenMRooms: 616
Crowne Plaza Albert EmbankmentCompany: Intercontinental Hotel GroupRooms: 130
Hilton London BanksideCompany: Splendid Hotel GroupRooms: 292
Holiday Inn Express London ExcelCompany: Intercontinental Hotel GroupRooms: 204
InterContinental Hotel The 02 Company: Intercontinental Hotel GroupRooms: 453
M by Montcalm Royal LondonCompany: Montcalm HotelsRooms: 269
Premier Inn: 3 hotels (Premier Inn, Hub by Premier Inn)Company: WhitbreadRooms: 358
Roomzzz London StratfordCompany: Roomzzz aparthotelRooms: 82
Travelodge: 3 hotelsCompany: TravelodgeRooms: 276
Z Hotels: 2 hotelsCompany: Z hotels Rooms: 221
REGIONAL (CIRCA 9,400)
AberdeenDean by Urban VillaCompany: Union Hanover SecuritiesRooms: 182
Holiday Inn- Crowne Plaza Aberdeen Airport ABZ ParkCompany: Dominvs GroupRooms: 358
BathThe Gainsborough, Bath SPA Company: YTL HotelsRooms: 99
BrentfordPremier Inn Brentford (opened February 2015)Company: WhitbreadRooms: 124
BirminghamIbis Styles Birmingham NECCompany: AccorRooms: 166
ChesterRoomzzz Aparthotel, Chester CityCompany: RoomzzzRooms: 63
EdinburghMercure Edinburgh QuayCompany: AccorRooms: 110
Premier Inn and Hub by Premier Inn (2 hotels)Company: WhitbreadRooms: 294
ExeterPremier Inn ExeterCompany: WhitbreadRooms: 120
GlasgowApex GlasgowCompany: Apex HotelsRooms: 100
Ibis Style GlasgowCompany: AccorRooms: 101
Travelodge Queen StreetCompany: Scot Sheridan/ TravelodgeRooms: 171
Villa Hotel Pacific QuayCompany: De Vere Village Urban ResortsRooms: 120
HeathrowMercure London Heathrow (opened March)Company: AccorRooms: 184
LiverpoolDoubletree Hilton Company: Sanguine HospitalityRooms: 87
Pullman Kings DockCompany: AccorRooms: 216
Roomzzz Aparthotel Liverpool CityCompany: Roomzzz HotelsRooms: 108
Shankley HotelCompany: Signature Living Rooms: 61
ManchesterGotham Hotel (opened April 2015)Company: Bespoke HotelsRooms: 60
Hotel Football (opened March 2015)Company: Gary Neville- Ryan Giggs/ GG HospitalityRooms: 140
Innside Manchester Company: Melia Hotels InternationalRooms: 208
King Street TownhouseCompany: Eclectic HotelsRooms: 40
Motel One PiccadillyCompany: Motel One hotelsRooms: 330
MiddlesbroughHoliday Inn ExpressCompany: Intercontinental Hotel GroupRooms: 138
NewcastleCrowne Plaza Stephenson QuarterCompany: Intercontinental Hotel GroupRooms: 250
SouthamptonHilton at the Ageas Bowl, SouthamptonCompany: HiltonRooms: 175
Travelodge West Quay (opened March 2015)Company: TravelodgeRooms: 84
Southend on SeaPremier Inn Easter Esplanade (opened March 2015)Company: WhitbreadRooms: 80
Source: BDO Research and Hotelsdata

THE GUIDE TO THE PERFORMANCE OF HOTELS IN THE UK | HOTEL BRITAIN 2015 20
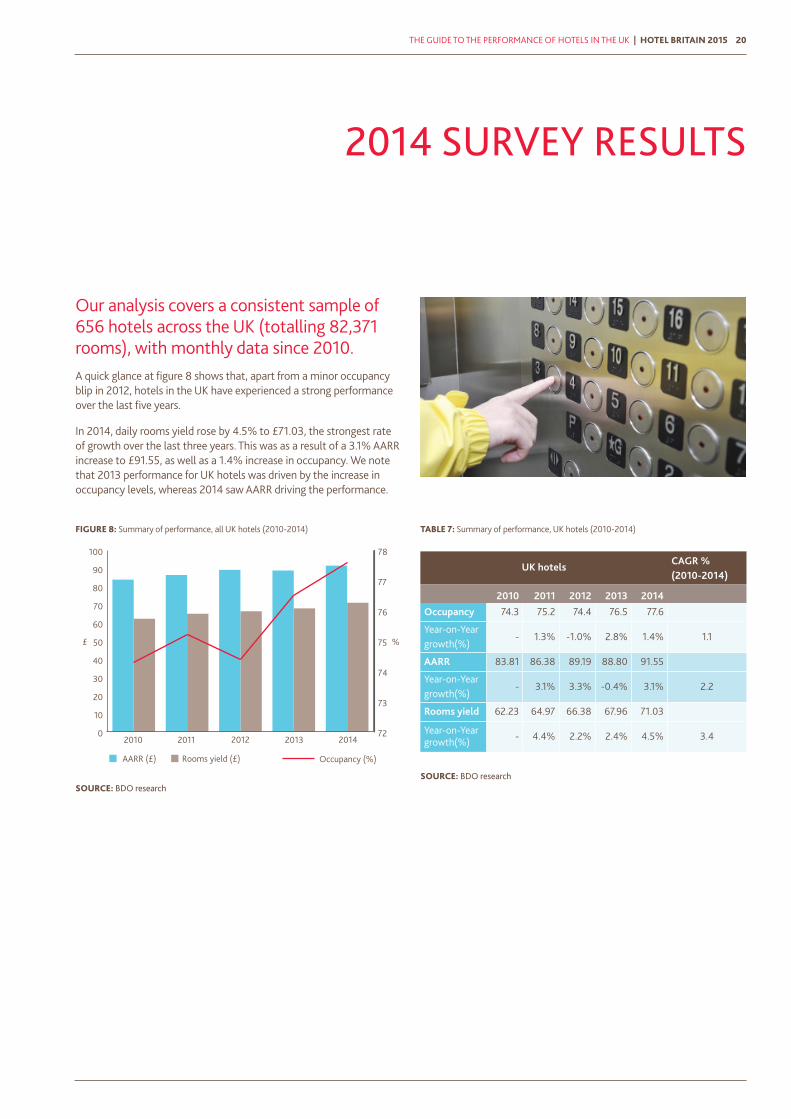
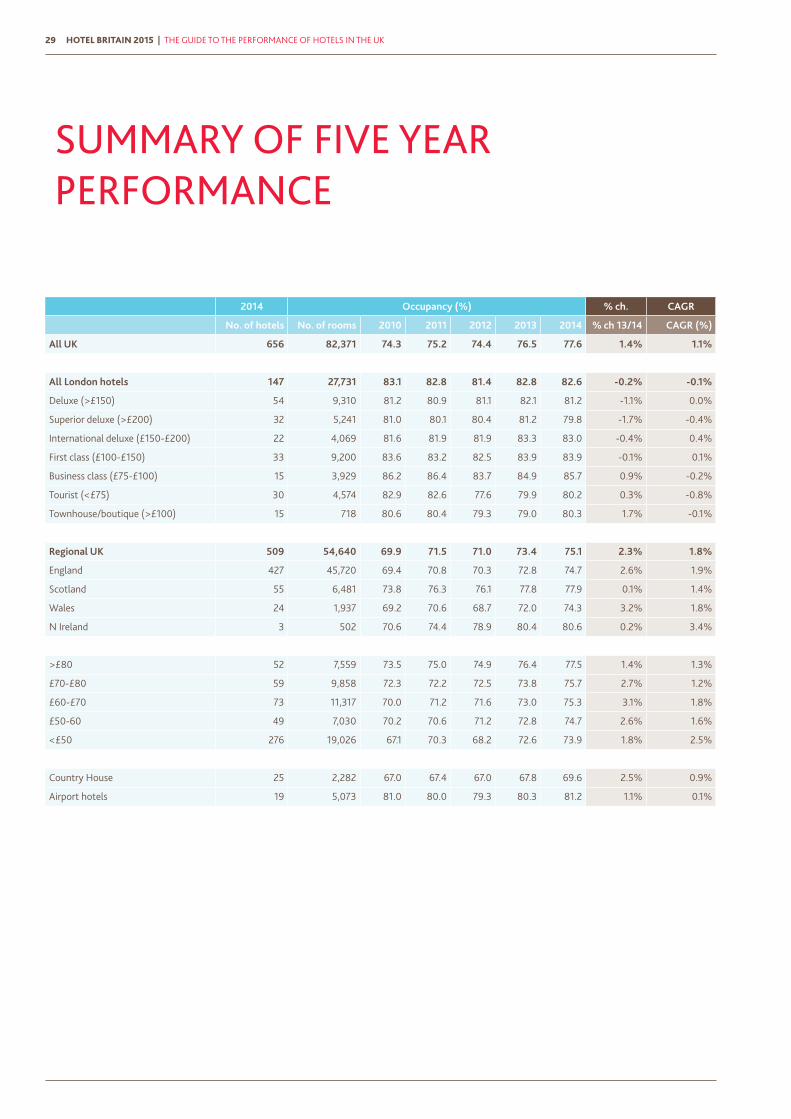
Our analysis covers a consistent sample of 656 hotels across the UK (totalling 82,371 rooms), with monthly data since 2010. A quick glance at figure 8 shows that, apart from a minor occupancy blip in 2012, hotels in the UK have experienced a strong performance over the last five years.
In 2014, daily rooms yield rose by 4.5% to £71.03, the strongest rate of growth over the last three years. This was as a result of a 3.1% AARR increase to £91.55, as well as a 1.4% increase in occupancy. We note that 2013 performance for UK hotels was driven by the increase in occupancy levels, whereas 2014 saw AARR driving the performance.
2014 SURVEY RESULTS
TABLE 7: Summary of performance, UK hotels (2010-2014)
UK hotels CAGR % (2010-2014)
2010 2011 2012 2013 2014
Occupancy 74.3 75.2 74.4 76.5 77.6
Year-on-Year growth(%)
- 1.3% -1.0% 2.8% 1.4% 1.1
AARR 83.81 86.38 89.19 88.80 91.55
Year-on-Year growth(%)
- 3.1% 3.3% -0.4% 3.1% 2.2
Rooms yield 62.23 64.97 66.38 67.96 71.03
Year-on-Year growth(%) - 4.4% 2.2% 2.4% 4.5% 3.4
SOURCE: BDO research
0
10
20
30
40
50
60
70
80
90
100
2010 2011 2012 2013 2014
£ %
AARR (£) Rooms yield (£) Occupancy (%)
72
73
74
75
76
77
78
FIGURE 8: Summary of performance, all UK hotels (2010-2014)
SOURCE: BDO research
HOTEL BRITAIN 2015 | THE GUIDE TO THE PERFORMANCE OF HOTELS IN THE UK21
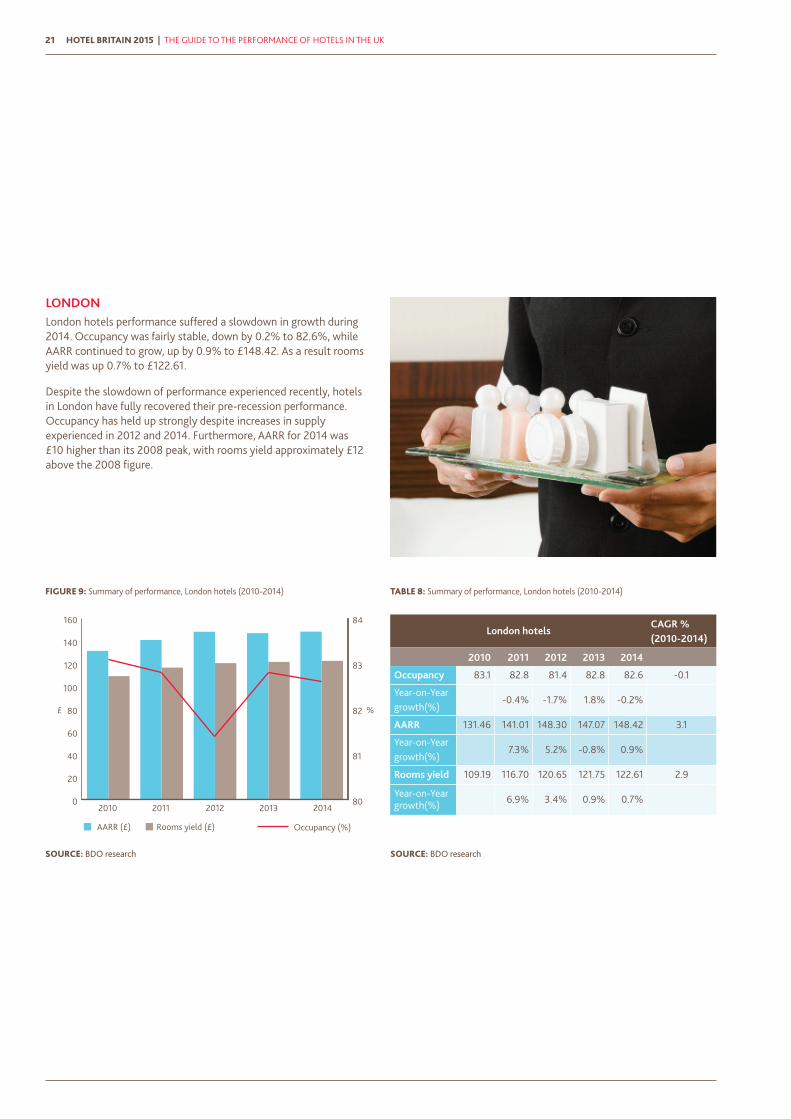
LONDON London hotels performance suffered a slowdown in growth during 2014. Occupancy was fairly stable, down by 0.2% to 82.6%, while AARR continued to grow, up by 0.9% to £148.42. As a result rooms yield was up 0.7% to £122.61.
Despite the slowdown of performance experienced recently, hotels in London have fully recovered their pre-recession performance. Occupancy has held up strongly despite increases in supply experienced in 2012 and 2014. Furthermore, AARR for 2014 was £10 higher than its 2008 peak, with rooms yield approximately £12 above the 2008 figure.
TABLE 8: Summary of performance, London hotels (2010-2014)
London hotelsCAGR % (2010-2014)
2010 2011 2012 2013 2014
Occupancy 83.1 82.8 81.4 82.8 82.6 -0.1
Year-on-Year growth(%)
-0.4% -1.7% 1.8% -0.2%
AARR 131.46 141.01 148.30 147.07 148.42 3.1
Year-on-Year growth(%)
7.3% 5.2% -0.8% 0.9%
Rooms yield 109.19 116.70 120.65 121.75 122.61 2.9
Year-on-Year growth(%) 6.9% 3.4% 0.9% 0.7%
SOURCE: BDO research
0
20
40
60
80
100
120
140
160
2010 2011 2012 2013 2014
£ %
AARR (£) Rooms yield (£) Occupancy (%)
80
81
82
83
84
FIGURE 9: Summary of performance, London hotels (2010-2014)
SOURCE: BDO research

THE GUIDE TO THE PERFORMANCE OF HOTELS IN THE UK | HOTEL BRITAIN 2015 22
REGIONAL UK 2014 was a strong year for regional hotels, which experienced more robust results than their London counterparts. Occupancy was up by 2.3% to 75.1%. This is the first time that regional hotels experienced occupancy levels above the 75% since the compilation of our Hotel Britain statistics began in 2004.
However, AARR was the main driver behind this successful growth. Hotels in the regions posted a 7.7% increase in average room rate, up to £60.71. However we note that this is still about £15 below the rate achieved in 2008.
As a result of the increases in occupancy and AARR, regional UK hotel rooms yield grew by 10.2% to £45.60 in 2014. Regional hotels have experienced the fourth consecutive year of rooms yield increase, with strong rates of growth experienced in 2013 and 2014. We note that thanks to the increases in occupancy, rooms yield is only about £10 below its 2008 peak figure.
TABLE 9: Summary of performance, regional hotels (2010-2014)
Regional hotelsCAGR % (2010-2014)
2010 2011 2012 2013 2014
Occupancy 69.9 71.5 71.0 73.4 75.1 1.8
Year-on-Year growth(%)
- 2.3% -0.7% 3.4% 2.3%
AARR 55.93 55.29 55.80 56.35 60.71 2.1
Year-on-Year growth(%)
- -1.2% 0.9% 1.0% 7.7%
Rooms yield 39.11 39.54 39.62 41.39 45.60 3.9
Year-on-Year growth(%) - 1.1% 0.2% 4.5% 10.2%
SOURCE: BDO research
0
10
20
30
40
50
60
70
2010 2011 2012 2013 2014
£ %
AARR (£) Rooms yield (£) Occupancy (%)
67
68
69
70
71
72
73
74
75
76
FIGURE 10: Summary of performance, regional hotels (2010-2014)
SOURCE: BDO research

HOTEL BRITAIN 2015 | THE GUIDE TO THE PERFORMANCE OF HOTELS IN THE UK23
FOCUS ON: THE BUDGET SEGMENT2014 saw the budget end of the market outperforming the other segments both in London and regional UK. One of the main reasons for this is the diversification of the budget offering with the development of new budget concepts such as Citizen M, hub by Premier Inn, Tune and the Qbic hotels among others. Furthermore, the two biggest budget hotel brands in the UK, namely Premier Inn and Travelodge, rolled out a major modernisation of their UK properties recently. Customers have changed and they are willing to sacrifice space for central locations, especially in the capital, while in the regions consumers still remain budget-conscious and seek out value for money deals.
In London, tourist hotels saw a year-on-year rooms yield increase of 9.9% in 2014, beating every other segment. This was driven by hoteliers being able to raise the average room rate as demand for the segment remained strong. We note that the top end of the market suffered a decline in rooms yield in 2014. This was mainly as a result of the increase in supply which introduced new competition.
CAGR ANALYSISFigure 11 analyses the compound of annual growth rate (CAGR) for occupancy, AARR and rooms yield for hotels in London and regional UK from 2010 to 2014.
As we can see from the graph, London hotels have experienced a flat occupancy over the last five years. However, this is despite the increase in supply experienced during the run-up to the Olympics in 2012, as well as increases in supply at the top end of the market experienced in 2014. In the capital, AARR continued to be the main driver behind hotel growth, as its five year rate of growth was 2.9%.
It is interesting to note that regional hotels experienced a higher occupancy CAGR rate over the same period, which grew by 1.8%. This was the result of record numbers of inbound visits in 2013 and 2014, as well as improved economic conditions. AARR also continued to grow on the back of strong demand. As a consequence, the compound of annual growth rate of rooms yield for regional hotels grew at a faster rate than that seen in London. This is the first time since the 2001-2005 period, emphasising the exceptional year experienced by regional hotels.
-1
0
1
2
3
4
5
Occupancy AARR Rooms Yield
CAG
R %
cha
nge
London Regional UK hotels
FIGURE 11: CAGR Analysis for UK hotels 2010-2014
SOURCE: BDO research
-6% -4% -2% 0% 2% 4% 6% 8% 10% 12%
2014 2013 2012 2011
Deluxe
Superior deluxe
International deluxe
First class
Business class
Tourist
Townhouse/boutique
FIGURE 12: Rooms yield growth, London hotels
SOURCE: BDO research

THE GUIDE TO THE PERFORMANCE OF HOTELS IN THE UK | HOTEL BRITAIN 2015 24
TABLE 11: Rooms yield growth regional hotels
Rooms yield growth regional hotels
Segment (AARR) 2011 2012 2013 2014
Country House 2.5% -0.8% 2.4% 3.5%
>£80 4.7% 2.1% 6.0% 5.5%
£70-£80 0.8% 0.2% 4.0% 8.4%
£60-£70 1.3% 1.4% 3.8% 9.2%
£50-60 0.1% 2.2% 2.8% 10.7%
<£50 -1.6% -4.1% 5.0% 17.9%
SOURCE: BDO research
TABLE 10: Rooms yield growth London hotels
Rooms yield growth London hotels
Segment (AARR) 2011 2012 2013 2014
Deluxe (>£150) 6.3% 4.5% 0.1% -1.8%
Superior deluxe (>£200) 5.1% 5.9% 0.1% -3.3%
International deluxe (£150-200) 8.3% 1.7% 0.4% 1.4%
First class (£100-150) 8.5% 3.2% 1.9% 2.8%
Business class (£75-100) 7.3% 1.1% 3.5% 4.1%
Tourist (<£75) 2.2% -4.7% 1.7% 9.9%
Townhouse/boutique (>£100) 4.4% 3.0% 2.0% -0.5%
SOURCE: BDO research
Hotels in the regions witnessed a similar pattern. In 2014, the top end of the market continued to post growth, although it was the slowest growing segment for rooms yield. Over £80 hotels’ rooms yield was up by 5.5%, well below the 17.9% increase experienced by the Under £50 hotels.
It is interesting to note that in the regions, AARR was the main driver for growth, as demand remained strong for all segments analysed.
-5% 0% 5% 10% 15% 20%
2014 2013 2012 2011
Country House
>£80
£70-£80
£80-£70
£50-60
<£50
FIGURE 13: Rooms yield growth, regional UK hotels
SOURCE: BDO research

THE GUIDE TO THE PERFORMANCE OF HOTELS IN THE UK | HOTEL BRITAIN 2015 26
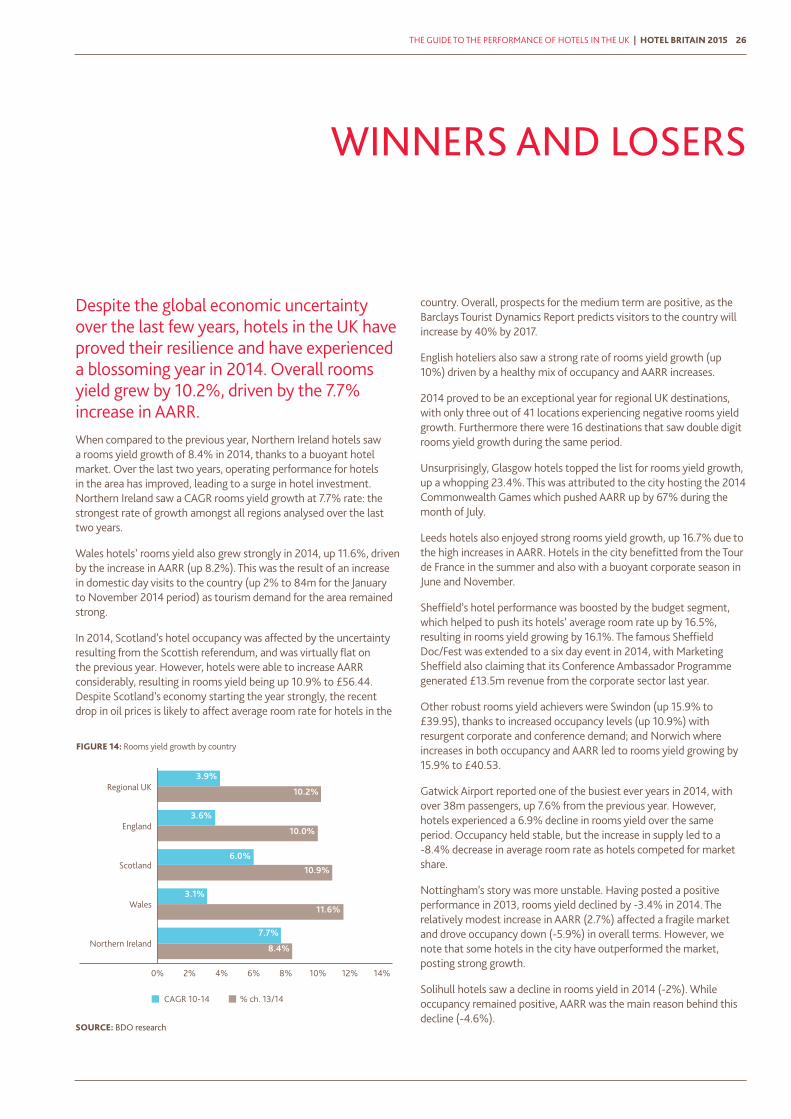
Despite the global economic uncertainty over the last few years, hotels in the UK have proved their resilience and have experienced a blossoming year in 2014. Overall rooms yield grew by 10.2%, driven by the 7.7% increase in AARR. When compared to the previous year, Northern Ireland hotels saw a rooms yield growth of 8.4% in 2014, thanks to a buoyant hotel market. Over the last two years, operating performance for hotels in the area has improved, leading to a surge in hotel investment. Northern Ireland saw a CAGR rooms yield growth at 7.7% rate: the strongest rate of growth amongst all regions analysed over the last two years.
Wales hotels’ rooms yield also grew strongly in 2014, up 11.6%, driven by the increase in AARR (up 8.2%). This was the result of an increase in domestic day visits to the country (up 2% to 84m for the January to November 2014 period) as tourism demand for the area remained strong.
In 2014, Scotland’s hotel occupancy was affected by the uncertainty resulting from the Scottish referendum, and was virtually flat on the previous year. However, hotels were able to increase AARR considerably, resulting in rooms yield being up 10.9% to £56.44. Despite Scotland’s economy starting the year strongly, the recent drop in oil prices is likely to affect average room rate for hotels in the
WINNERS AND LOSERS
country. Overall, prospects for the medium term are positive, as the Barclays Tourist Dynamics Report predicts visitors to the country will increase by 40% by 2017.
English hoteliers also saw a strong rate of rooms yield growth (up 10%) driven by a healthy mix of occupancy and AARR increases.
2014 proved to be an exceptional year for regional UK destinations, with only three out of 41 locations experiencing negative rooms yield growth. Furthermore there were 16 destinations that saw double digit rooms yield growth during the same period.
Unsurprisingly, Glasgow hotels topped the list for rooms yield growth, up a whopping 23.4%. This was attributed to the city hosting the 2014 Commonwealth Games which pushed AARR up by 67% during the month of July.
Leeds hotels also enjoyed strong rooms yield growth, up 16.7% due to the high increases in AARR. Hotels in the city benefitted from the Tour de France in the summer and also with a buoyant corporate season in June and November.
Sheffield’s hotel performance was boosted by the budget segment, which helped to push its hotels’ average room rate up by 16.5%, resulting in rooms yield growing by 16.1%. The famous Sheffield Doc/Fest was extended to a six day event in 2014, with Marketing Sheffield also claiming that its Conference Ambassador Programme generated £13.5m revenue from the corporate sector last year.
Other robust rooms yield achievers were Swindon (up 15.9% to £39.95), thanks to increased occupancy levels (up 10.9%) with resurgent corporate and conference demand; and Norwich where increases in both occupancy and AARR led to rooms yield growing by 15.9% to £40.53.
Gatwick Airport reported one of the busiest ever years in 2014, with over 38m passengers, up 7.6% from the previous year. However, hotels experienced a 6.9% decline in rooms yield over the same period. Occupancy held stable, but the increase in supply led to a -8.4% decrease in average room rate as hotels competed for market share.
Nottingham’s story was more unstable. Having posted a positive performance in 2013, rooms yield declined by -3.4% in 2014. The relatively modest increase in AARR (2.7%) affected a fragile market and drove occupancy down (-5.9%) in overall terms. However, we note that some hotels in the city have outperformed the market, posting strong growth.
Solihull hotels saw a decline in rooms yield in 2014 (-2%). While occupancy remained positive, AARR was the main reason behind this decline (-4.6%).
0% 2% 4% 6% 8% 10% 12% 14%
CAGR 10-14 % ch. 13/14
Northern Ireland
Wales
Scotland
England
Regional UK 3.9%
10.2%
3.6%
10.0%
6.0%
10.9%
3.1%
11.6%
7.7%
8.4%
FIGURE 14: Rooms yield growth by country
SOURCE: BDO research

HOTEL BRITAIN 2015 | THE GUIDE TO THE PERFORMANCE OF HOTELS IN THE UK27
-8% -3% 2% 7% 12% 17% 22% 27%
Gatwick
Nottingham
Solihull
Oxford
Windsor/Maidenhead
Aberdeen
Inverness
Heathrow
Edinburgh
Portsmouth
Reading
Chester
Leicester
Manchester
Newcastle
Belfast
Bournemouth
Liverpool
Brighton
Birmingham
Cambridge
Cardiff
Maidstone
Bradford
Northampton
Stratford-upon-Avon
Derby
Gloucester
Milton Keynes
Southampton
Ashford
Bristol
York
Bath
Cheltenham
Coventry
Norwich
Swindon
Sheffield
Leeds
Glasgow
% ch. 13/14 CAGR 10-14
FIGURE 15: Rooms yield growth, regional UK cities
SOURCE: BDO research

THE GUIDE TO THE PERFORMANCE OF HOTELS IN THE UK | HOTEL BRITAIN 2015 28
HOTEL BRITAIN 2015 | THE GUIDE TO THE PERFORMANCE OF HOTELS IN THE UK29
2014 Occupancy (%) % ch. CAGR AARR (£) % ch. CAGR Rooms yield (£) % ch. CAGR
No. of hotels No. of rooms 2010 2011 2012 2013 2014 % ch 13/14 CAGR (%) 2010 2011 2012 2013 2014 % ch 13/14 CAGR (%) 2010 2011 2012 2013 2014 % ch 13/14 CAGR (%)
All UK 656 82,371 74.3 75.2 74.4 76.5 77.6 1.4% 1.1% 83.81 86.38 89.19 88.80 91.55 3.1% 2.2% 62.23 64.97 66.38 67.96 71.03 4.5% 3.4%
All London hotels 147 27,731 83.1 82.8 81.4 82.8 82.6 -0.2% -0.1% 131.46 141.01 148.30 147.07 148.42 0.9% 3.1% 109.19 116.70 120.65 121.75 122.61 0.7% 2.9%
Deluxe (>£150) 54 9,310 81.2 80.9 81.1 82.1 81.2 -1.1% 0.0% 219.82 234.85 244.89 242.05 240.24 -0.7% 2.2% 178.60 189.90 198.52 198.81 195.16 -1.8% 2.2%
Superior deluxe (>£200) 32 5,241 81.0 80.1 80.4 81.2 79.8 -1.7% -0.4% 269.61 286.58 302.18 299.55 294.67 -1.6% 2.2% 218.37 229.52 243.03 243.25 235.28 -3.3% 1.9%
International deluxe (£150-£200) 22 4,069 81.6 81.9 81.9 83.3 83.0 -0.4% 0.4% 156.86 169.25 172.13 169.78 172.83 1.8% 2.5% 127.95 138.56 140.96 141.48 143.50 1.4% 2.9%
First class (£100-£150) 33 9,200 83.6 83.2 82.5 83.9 83.9 -0.1% 0.1% 108.95 118.81 123.68 123.86 127.41 2.9% 4.0% 91.11 98.89 102.07 103.96 106.88 2.8% 4.1%
Business class (£75-£100) 15 3,929 86.2 86.4 83.7 84.9 85.7 0.9% -0.2% 76.16 81.52 85.05 86.73 89.50 3.2% 4.1% 65.64 70.40 71.16 73.65 76.66 4.1% 4.0%
Tourist (<£75) 30 4,574 82.9 82.6 77.6 79.9 80.2 0.3% -0.8% 51.04 52.35 53.06 52.41 57.38 9.5% 3.0% 42.32 43.24 41.19 41.89 46.02 9.9% 2.1%
Townhouse/boutique (>£100) 15 718 80.6 80.4 79.3 79.0 80.3 1.7% -0.1% 258.27 270.36 282.23 289.19 282.97 -2.2% 2.3% 208.12 217.30 223.79 228.34 227.15 -0.5% 2.2%
Regional UK 509 54,640 69.9 71.5 71.0 73.4 75.1 2.3% 1.8% 55.93 55.29 55.80 56.35 60.71 7.7% 2.1% 39.11 39.54 39.62 41.39 45.60 10.2% 3.9%
England 427 45,720 69.4 70.8 70.3 72.8 74.7 2.6% 1.9% 55.18 54.42 54.95 54.95 58.93 7.2% 1.7% 38.29 38.55 38.62 40.01 44.02 10.0% 3.6%
Scotland 55 6,481 73.8 76.3 76.1 77.8 77.9 0.1% 1.4% 60.51 61.17 61.42 65.40 72.43 10.8% 4.6% 44.68 46.68 46.75 50.91 56.44 10.9% 6.0%
Wales 24 1,937 69.2 70.6 68.7 72.0 74.3 3.2% 1.8% 57.68 55.23 55.75 56.06 60.64 8.2% 1.3% 39.92 38.98 38.32 40.36 45.04 11.6% 3.1%
N Ireland 3 502 70.6 74.4 78.9 80.4 80.6 0.2% 3.4% 54.96 52.87 55.41 59.85 64.74 8.2% 4.2% 38.80 39.33 43.71 48.11 52.16 8.4% 7.7%
>£80 52 7,559 73.5 75.0 74.9 76.4 77.5 1.4% 1.3% 82.29 84.42 86.24 89.71 93.34 4.1% 3.2% 60.47 63.31 64.63 68.54 72.31 5.5% 4.6%
£70-£80 59 9,858 72.3 72.2 72.5 73.8 75.7 2.7% 1.2% 68.46 69.17 68.98 70.49 74.42 5.6% 2.1% 49.53 49.91 50.01 51.99 56.37 8.4% 3.3%
£60-£70 73 11,317 70.0 71.2 71.6 73.0 75.3 3.1% 1.8% 60.13 59.90 60.36 61.47 65.12 5.9% 2.0% 42.08 42.63 43.23 44.88 49.01 9.2% 3.9%
£50-60 49 7,030 70.2 70.6 71.2 72.8 74.7 2.6% 1.6% 50.41 50.14 50.90 51.11 55.16 7.9% 2.3% 35.40 35.42 36.21 37.23 41.21 10.7% 3.9%
<£50 276 19,026 67.1 70.3 68.2 72.6 73.9 1.8% 2.5% 37.04 34.78 34.36 33.90 39.25 15.8% 1.5% 24.85 24.46 23.45 24.62 29.02 17.9% 4.0%
Country House 25 2,282 67.0 67.4 67.0 67.8 69.6 2.5% 0.9% 85.03 86.66 86.50 87.48 88.34 1.0% 1.0% 56.96 58.41 57.96 59.34 61.45 3.5% 1.9%
Airport hotels 19 5,073 81.0 80.0 79.3 80.3 81.2 1.1% 0.1% 59.47 61.13 62.00 62.35 64.47 3.4% 2.0% 48.16 48.89 49.18 50.08 52.35 4.5% 2.1%
SUMMARY OF FIVE YEAR PERFORMANCE

THE GUIDE TO THE PERFORMANCE OF HOTELS IN THE UK | HOTEL BRITAIN 2015 30
2014 Occupancy (%) % ch. CAGR AARR (£) % ch. CAGR Rooms yield (£) % ch. CAGR
No. of hotels No. of rooms 2010 2011 2012 2013 2014 % ch 13/14 CAGR (%) 2010 2011 2012 2013 2014 % ch 13/14 CAGR (%) 2010 2011 2012 2013 2014 % ch 13/14 CAGR (%)
All UK 656 82,371 74.3 75.2 74.4 76.5 77.6 1.4% 1.1% 83.81 86.38 89.19 88.80 91.55 3.1% 2.2% 62.23 64.97 66.38 67.96 71.03 4.5% 3.4%
All London hotels 147 27,731 83.1 82.8 81.4 82.8 82.6 -0.2% -0.1% 131.46 141.01 148.30 147.07 148.42 0.9% 3.1% 109.19 116.70 120.65 121.75 122.61 0.7% 2.9%
Deluxe (>£150) 54 9,310 81.2 80.9 81.1 82.1 81.2 -1.1% 0.0% 219.82 234.85 244.89 242.05 240.24 -0.7% 2.2% 178.60 189.90 198.52 198.81 195.16 -1.8% 2.2%
Superior deluxe (>£200) 32 5,241 81.0 80.1 80.4 81.2 79.8 -1.7% -0.4% 269.61 286.58 302.18 299.55 294.67 -1.6% 2.2% 218.37 229.52 243.03 243.25 235.28 -3.3% 1.9%
International deluxe (£150-£200) 22 4,069 81.6 81.9 81.9 83.3 83.0 -0.4% 0.4% 156.86 169.25 172.13 169.78 172.83 1.8% 2.5% 127.95 138.56 140.96 141.48 143.50 1.4% 2.9%
First class (£100-£150) 33 9,200 83.6 83.2 82.5 83.9 83.9 -0.1% 0.1% 108.95 118.81 123.68 123.86 127.41 2.9% 4.0% 91.11 98.89 102.07 103.96 106.88 2.8% 4.1%
Business class (£75-£100) 15 3,929 86.2 86.4 83.7 84.9 85.7 0.9% -0.2% 76.16 81.52 85.05 86.73 89.50 3.2% 4.1% 65.64 70.40 71.16 73.65 76.66 4.1% 4.0%
Tourist (<£75) 30 4,574 82.9 82.6 77.6 79.9 80.2 0.3% -0.8% 51.04 52.35 53.06 52.41 57.38 9.5% 3.0% 42.32 43.24 41.19 41.89 46.02 9.9% 2.1%
Townhouse/boutique (>£100) 15 718 80.6 80.4 79.3 79.0 80.3 1.7% -0.1% 258.27 270.36 282.23 289.19 282.97 -2.2% 2.3% 208.12 217.30 223.79 228.34 227.15 -0.5% 2.2%
Regional UK 509 54,640 69.9 71.5 71.0 73.4 75.1 2.3% 1.8% 55.93 55.29 55.80 56.35 60.71 7.7% 2.1% 39.11 39.54 39.62 41.39 45.60 10.2% 3.9%
England 427 45,720 69.4 70.8 70.3 72.8 74.7 2.6% 1.9% 55.18 54.42 54.95 54.95 58.93 7.2% 1.7% 38.29 38.55 38.62 40.01 44.02 10.0% 3.6%
Scotland 55 6,481 73.8 76.3 76.1 77.8 77.9 0.1% 1.4% 60.51 61.17 61.42 65.40 72.43 10.8% 4.6% 44.68 46.68 46.75 50.91 56.44 10.9% 6.0%
Wales 24 1,937 69.2 70.6 68.7 72.0 74.3 3.2% 1.8% 57.68 55.23 55.75 56.06 60.64 8.2% 1.3% 39.92 38.98 38.32 40.36 45.04 11.6% 3.1%
N Ireland 3 502 70.6 74.4 78.9 80.4 80.6 0.2% 3.4% 54.96 52.87 55.41 59.85 64.74 8.2% 4.2% 38.80 39.33 43.71 48.11 52.16 8.4% 7.7%
>£80 52 7,559 73.5 75.0 74.9 76.4 77.5 1.4% 1.3% 82.29 84.42 86.24 89.71 93.34 4.1% 3.2% 60.47 63.31 64.63 68.54 72.31 5.5% 4.6%
£70-£80 59 9,858 72.3 72.2 72.5 73.8 75.7 2.7% 1.2% 68.46 69.17 68.98 70.49 74.42 5.6% 2.1% 49.53 49.91 50.01 51.99 56.37 8.4% 3.3%
£60-£70 73 11,317 70.0 71.2 71.6 73.0 75.3 3.1% 1.8% 60.13 59.90 60.36 61.47 65.12 5.9% 2.0% 42.08 42.63 43.23 44.88 49.01 9.2% 3.9%
£50-60 49 7,030 70.2 70.6 71.2 72.8 74.7 2.6% 1.6% 50.41 50.14 50.90 51.11 55.16 7.9% 2.3% 35.40 35.42 36.21 37.23 41.21 10.7% 3.9%
<£50 276 19,026 67.1 70.3 68.2 72.6 73.9 1.8% 2.5% 37.04 34.78 34.36 33.90 39.25 15.8% 1.5% 24.85 24.46 23.45 24.62 29.02 17.9% 4.0%
Country House 25 2,282 67.0 67.4 67.0 67.8 69.6 2.5% 0.9% 85.03 86.66 86.50 87.48 88.34 1.0% 1.0% 56.96 58.41 57.96 59.34 61.45 3.5% 1.9%
Airport hotels 19 5,073 81.0 80.0 79.3 80.3 81.2 1.1% 0.1% 59.47 61.13 62.00 62.35 64.47 3.4% 2.0% 48.16 48.89 49.18 50.08 52.35 4.5% 2.1%

HOTEL BRITAIN 2015 | THE GUIDE TO THE PERFORMANCE OF HOTELS IN THE UK31
2014 Occupancy (%) % ch. CAGR AARR (£) % ch. CAGR Rooms yield (£) % ch. CAGR
No. of hotels No. of rooms 2010 2011 2012 2013 2014 % ch 13/14 CAGR (%) 2010 2011 2012 2013 2014 % ch 13/14 CAGR (%) 2010 2011 2012 2013 2014 % ch 13/14 CAGR (%)
Aberdeen 8 989 72.5 75.7 79.3 77.8 76.1 -2.2% 1.2% 69.86 73.50 78.31 93.58 98.48 5.2% 9.0% 50.64 55.68 62.07 72.83 74.93 2.9% 10.3%
Ashford 3 391 67.7 69.5 69.5 71.1 71.8 1.0% 1.5% 46.28 48.65 48.65 49.32 54.13 9.8% 4.0% 31.33 33.81 33.81 35.05 38.87 10.9% 5.5%
Bath 3 238 74.9 76.3 75.8 76.5 79.3 3.8% 1.5% 50.93 49.71 46.88 47.63 51.43 8.0% 0.2% 38.14 37.93 35.53 36.42 40.80 12.0% 1.7%
Belfast 3 502 70.6 74.4 78.9 80.4 80.6 0.2% 3.4% 54.96 52.87 55.41 59.85 64.74 8.2% 4.2% 38.80 39.33 43.71 48.11 52.16 8.4% 7.7%
Birmingham 10 1,453 67.1 65.4 65.0 69.3 70.4 1.7% 1.2% 55.27 52.54 50.41 50.24 53.88 7.3% -0.6% 37.09 34.34 32.77 34.81 37.96 9.0% 0.6%
Bournemouth 3 262 71.6 75.0 73.3 75.3 77.7 3.1% 2.1% 82.77 80.24 81.94 80.93 85.13 5.2% 0.7% 59.23 60.16 60.05 60.97 66.13 8.5% 2.8%
Bradford 3 220 62.9 64.2 64.2 67.5 70.1 3.8% 2.7% 42.55 36.49 36.49 36.63 38.71 5.7% -2.3% 26.77 23.44 23.44 24.72 27.13 9.7% 0.3%
Brighton 4 703 69.2 72.8 73.3 74.0 74.9 1.2% 2.0% 62.15 65.69 66.68 67.19 72.12 7.3% 3.8% 43.01 47.85 48.85 49.75 54.04 8.6% 5.9%
Bristol 8 1,255 73.1 71.2 70.1 74.7 77.0 3.1% 1.3% 63.80 63.85 63.21 63.98 69.37 8.4% 2.1% 46.66 45.49 44.32 47.83 53.44 11.7% 3.4%
Cambridge 4 367 73.6 75.7 75.2 78.4 79.5 1.5% 1.9% 57.95 56.37 57.54 58.41 62.85 7.6% 2.1% 42.67 42.65 43.27 45.78 49.99 9.2% 4.0%
Cardiff 10 1,133 73.0 73.8 72.0 75.2 77.4 2.9% 1.5% 66.77 65.17 66.22 67.01 71.35 6.5% 1.7% 48.74 48.12 47.65 50.43 55.22 9.5% 3.2%
Cheltenham 3 351 71.9 71.0 71.0 72.5 75.4 4.0% 1.2% 53.23 52.72 51.89 53.20 57.98 9.0% 2.2% 38.28 37.42 36.85 38.58 43.73 13.3% 3.4%
Chester 4 402 65.9 67.5 68.9 72.3 74.4 2.8% 3.1% 58.92 56.00 56.90 59.42 61.28 3.1% 1.0% 38.82 37.78 39.23 42.99 45.59 6.0% 4.1%
Coventry 5 392 66.3 67.5 66.4 70.2 71.8 2.3% 2.0% 51.83 49.97 50.51 48.82 54.15 10.9% 1.1% 34.37 33.74 33.54 34.29 38.90 13.4% 3.1%
Derby 4 444 62.3 66.5 71.6 71.2 72.2 1.3% 3.7% 54.79 51.80 54.58 53.10 57.71 8.7% 1.3% 34.16 34.47 39.06 37.83 41.66 10.1% 5.1%
Edinburgh 15 1,985 75.4 79.3 77.3 79.5 78.3 -1.5% 1.0% 68.22 70.89 71.00 76.11 80.62 5.9% 4.3% 51.45 56.20 54.91 60.50 63.15 4.4% 5.3%
Gatwick 4 846 80.0 79.3 81.6 79.0 80.3 1.6% 0.1% 73.14 74.11 75.48 78.59 71.99 -8.4% -0.4% 58.52 58.79 61.56 62.11 57.82 -6.9% -0.3%
Glasgow 11 2,155 77.4 77.7 77.2 79.2 81.5 3.0% 1.3% 57.80 57.01 55.97 56.01 67.12 19.8% 3.8% 44.76 44.28 43.22 44.35 54.72 23.4% 5.2%
Gloucester 3 326 70.9 70.5 70.5 75.8 74.9 -1.2% 1.4% 51.95 48.85 48.85 49.26 55.01 11.7% 1.4% 36.83 34.43 34.43 37.32 41.20 10.4% 2.8%
Heathrow 13 3,953 81.3 79.5 77.8 78.8 80.3 1.9% -0.3% 59.67 61.57 62.54 61.82 62.95 1.8% 1.3% 48.52 48.95 48.66 48.72 50.55 3.8% 1.0%
Inverness 3 256 70.0 71.6 71.6 73.2 69.7 -4.8% -0.1% 48.24 45.68 45.68 47.97 51.99 8.4% 1.9% 33.76 32.71 32.71 35.10 36.22 3.2% 1.8%
Leeds 10 1,433 71.1 72.1 72.3 77.1 77.8 1.0% 2.3% 54.02 52.21 53.21 55.45 64.11 15.6% 4.4% 38.40 37.66 38.50 42.73 49.87 16.7% 6.8%
Leicester 4 568 64.9 64.7 62.3 70.3 71.0 1.0% 2.3% 56.63 56.24 55.84 55.24 58.57 6.0% 0.8% 36.73 36.40 34.81 38.86 41.60 7.1% 3.2%
Liverpool 9 1,351 70.8 70.4 67.2 68.3 71.8 5.1% 0.3% 61.03 60.28 59.30 64.15 66.18 3.2% 2.0% 43.21 42.44 39.84 43.81 47.51 8.5% 2.4%
Luton 3 640 62.4 69.2 68.5 71.0 69.9 -1.5% 2.9% 61.30 60.43 59.11 54.59 52.18 -4.4% -3.9% 38.27 41.79 40.49 38.76 36.50 -5.8% -1.2%
Maidstone 4 389 67.3 69.9 72.1 73.2 75.6 3.3% 3.0% 56.90 55.72 55.49 55.78 59.10 5.9% 1.0% 38.29 38.94 40.02 40.82 44.68 9.5% 3.9%
Manchester 15 2,304 71.2 73.6 73.3 75.2 77.6 3.2% 2.2% 59.21 59.60 59.85 62.39 65.24 4.6% 2.5% 42.13 43.87 43.89 46.93 50.64 7.9% 4.7%
Milton Keynes 3 501 72.3 74.6 74.3 76.2 76.0 -0.3% 1.2% 58.20 61.63 62.98 65.89 72.96 10.7% 5.8% 42.10 45.97 46.79 50.20 55.44 10.4% 7.1%
Newcastle 8 1,129 73.9 74.6 72.0 72.4 75.8 4.8% 0.7% 57.27 56.11 54.77 52.89 54.52 3.1% -1.2% 42.29 41.87 39.46 38.28 41.34 8.0% -0.6%
Northampton 3 285 67.4 65.9 69.2 70.4 73.9 5.0% 2.3% 57.20 58.24 56.85 56.64 59.26 4.6% 0.9% 38.57 38.38 39.35 39.89 43.81 9.8% 3.2%
Norwich 5 458 67.4 70.2 68.3 73.8 77.0 4.4% 3.4% 49.23 48.08 48.59 47.38 52.63 11.1% 1.7% 33.20 33.76 33.20 34.96 40.53 15.9% 5.1%
Nottingham 11 1,298 62.9 66.0 65.8 69.9 65.8 -5.9% 1.1% 52.38 51.62 52.41 51.03 52.41 2.7% 0.0% 32.95 34.05 34.49 35.68 34.49 -3.4% 1.1%
Oxford 4 538 73.4 73.8 74.4 81.2 78.9 -2.8% 1.8% 54.85 57.10 57.16 59.08 62.13 5.2% 3.2% 40.25 42.13 42.51 47.98 49.03 2.2% 5.1%
Portsmouth 4 576 79.1 79.0 77.3 81.9 81.1 -1.0% 0.6% 69.15 67.98 70.96 72.09 76.24 5.8% 2.5% 54.72 53.71 54.85 59.02 61.81 4.7% 3.1%
Reading 9 982 61.3 65.7 67.0 70.4 68.8 -2.3% 2.9% 49.36 50.20 53.11 54.77 59.15 8.0% 4.6% 30.28 33.00 35.59 38.57 40.71 5.5% 7.7%
Sheffield 3 424 60.7 66.4 62.8 70.8 70.5 -0.4% 3.8% 38.68 37.21 38.46 37.67 43.90 16.5% 3.2% 23.49 24.72 24.16 26.65 30.94 16.1% 7.1%
Solihull 4 754 65.7 63.5 63.8 65.9 67.7 2.7% 0.7% 79.36 76.79 76.95 78.13 74.52 -4.6% -1.6% 52.17 48.80 49.12 51.47 50.44 -2.0% -0.8%
Southampton 4 507 71.4 74.9 75.8 78.5 81.6 3.9% 3.4% 54.50 49.70 51.41 52.13 55.43 6.3% 0.4% 38.92 37.23 38.95 40.93 45.22 10.5% 3.8%
Stratford-upon-Avon 4 512 67.8 69.9 67.8 68.8 70.4 2.3% 0.9% 69.51 68.55 68.63 69.25 74.46 7.5% 1.7% 47.14 47.91 46.52 47.65 52.44 10.0% 2.7%
Swindon 5 702 61.3 64.2 63.5 66.9 74.2 10.9% 4.9% 51.06 52.35 55.77 51.54 53.86 4.5% 1.3% 31.30 33.63 35.43 34.46 39.95 15.9% 6.3%
Windsor/Maidenhead 3 425 70.8 71.9 74.7 73.7 72.5 -1.7% 0.6% 72.14 74.91 76.97 79.45 82.82 4.2% 3.5% 51.07 53.86 57.51 58.59 60.01 2.4% 4.1%
York 5 542 77.3 78.7 78.7 78.9 82.0 3.9% 1.5% 58.90 59.14 59.14 58.33 62.77 7.6% 1.6% 45.51 46.57 46.57 46.04 51.49 11.8% 3.1%

THE GUIDE TO THE PERFORMANCE OF HOTELS IN THE UK | HOTEL BRITAIN 2015 32
2014 Occupancy (%) % ch. CAGR AARR (£) % ch. CAGR Rooms yield (£) % ch. CAGR
No. of hotels No. of rooms 2010 2011 2012 2013 2014 % ch 13/14 CAGR (%) 2010 2011 2012 2013 2014 % ch 13/14 CAGR (%) 2010 2011 2012 2013 2014 % ch 13/14 CAGR (%)
Aberdeen 8 989 72.5 75.7 79.3 77.8 76.1 -2.2% 1.2% 69.86 73.50 78.31 93.58 98.48 5.2% 9.0% 50.64 55.68 62.07 72.83 74.93 2.9% 10.3%
Ashford 3 391 67.7 69.5 69.5 71.1 71.8 1.0% 1.5% 46.28 48.65 48.65 49.32 54.13 9.8% 4.0% 31.33 33.81 33.81 35.05 38.87 10.9% 5.5%
Bath 3 238 74.9 76.3 75.8 76.5 79.3 3.8% 1.5% 50.93 49.71 46.88 47.63 51.43 8.0% 0.2% 38.14 37.93 35.53 36.42 40.80 12.0% 1.7%
Belfast 3 502 70.6 74.4 78.9 80.4 80.6 0.2% 3.4% 54.96 52.87 55.41 59.85 64.74 8.2% 4.2% 38.80 39.33 43.71 48.11 52.16 8.4% 7.7%
Birmingham 10 1,453 67.1 65.4 65.0 69.3 70.4 1.7% 1.2% 55.27 52.54 50.41 50.24 53.88 7.3% -0.6% 37.09 34.34 32.77 34.81 37.96 9.0% 0.6%
Bournemouth 3 262 71.6 75.0 73.3 75.3 77.7 3.1% 2.1% 82.77 80.24 81.94 80.93 85.13 5.2% 0.7% 59.23 60.16 60.05 60.97 66.13 8.5% 2.8%
Bradford 3 220 62.9 64.2 64.2 67.5 70.1 3.8% 2.7% 42.55 36.49 36.49 36.63 38.71 5.7% -2.3% 26.77 23.44 23.44 24.72 27.13 9.7% 0.3%
Brighton 4 703 69.2 72.8 73.3 74.0 74.9 1.2% 2.0% 62.15 65.69 66.68 67.19 72.12 7.3% 3.8% 43.01 47.85 48.85 49.75 54.04 8.6% 5.9%
Bristol 8 1,255 73.1 71.2 70.1 74.7 77.0 3.1% 1.3% 63.80 63.85 63.21 63.98 69.37 8.4% 2.1% 46.66 45.49 44.32 47.83 53.44 11.7% 3.4%
Cambridge 4 367 73.6 75.7 75.2 78.4 79.5 1.5% 1.9% 57.95 56.37 57.54 58.41 62.85 7.6% 2.1% 42.67 42.65 43.27 45.78 49.99 9.2% 4.0%
Cardiff 10 1,133 73.0 73.8 72.0 75.2 77.4 2.9% 1.5% 66.77 65.17 66.22 67.01 71.35 6.5% 1.7% 48.74 48.12 47.65 50.43 55.22 9.5% 3.2%
Cheltenham 3 351 71.9 71.0 71.0 72.5 75.4 4.0% 1.2% 53.23 52.72 51.89 53.20 57.98 9.0% 2.2% 38.28 37.42 36.85 38.58 43.73 13.3% 3.4%
Chester 4 402 65.9 67.5 68.9 72.3 74.4 2.8% 3.1% 58.92 56.00 56.90 59.42 61.28 3.1% 1.0% 38.82 37.78 39.23 42.99 45.59 6.0% 4.1%
Coventry 5 392 66.3 67.5 66.4 70.2 71.8 2.3% 2.0% 51.83 49.97 50.51 48.82 54.15 10.9% 1.1% 34.37 33.74 33.54 34.29 38.90 13.4% 3.1%
Derby 4 444 62.3 66.5 71.6 71.2 72.2 1.3% 3.7% 54.79 51.80 54.58 53.10 57.71 8.7% 1.3% 34.16 34.47 39.06 37.83 41.66 10.1% 5.1%
Edinburgh 15 1,985 75.4 79.3 77.3 79.5 78.3 -1.5% 1.0% 68.22 70.89 71.00 76.11 80.62 5.9% 4.3% 51.45 56.20 54.91 60.50 63.15 4.4% 5.3%
Gatwick 4 846 80.0 79.3 81.6 79.0 80.3 1.6% 0.1% 73.14 74.11 75.48 78.59 71.99 -8.4% -0.4% 58.52 58.79 61.56 62.11 57.82 -6.9% -0.3%
Glasgow 11 2,155 77.4 77.7 77.2 79.2 81.5 3.0% 1.3% 57.80 57.01 55.97 56.01 67.12 19.8% 3.8% 44.76 44.28 43.22 44.35 54.72 23.4% 5.2%
Gloucester 3 326 70.9 70.5 70.5 75.8 74.9 -1.2% 1.4% 51.95 48.85 48.85 49.26 55.01 11.7% 1.4% 36.83 34.43 34.43 37.32 41.20 10.4% 2.8%
Heathrow 13 3,953 81.3 79.5 77.8 78.8 80.3 1.9% -0.3% 59.67 61.57 62.54 61.82 62.95 1.8% 1.3% 48.52 48.95 48.66 48.72 50.55 3.8% 1.0%
Inverness 3 256 70.0 71.6 71.6 73.2 69.7 -4.8% -0.1% 48.24 45.68 45.68 47.97 51.99 8.4% 1.9% 33.76 32.71 32.71 35.10 36.22 3.2% 1.8%
Leeds 10 1,433 71.1 72.1 72.3 77.1 77.8 1.0% 2.3% 54.02 52.21 53.21 55.45 64.11 15.6% 4.4% 38.40 37.66 38.50 42.73 49.87 16.7% 6.8%
Leicester 4 568 64.9 64.7 62.3 70.3 71.0 1.0% 2.3% 56.63 56.24 55.84 55.24 58.57 6.0% 0.8% 36.73 36.40 34.81 38.86 41.60 7.1% 3.2%
Liverpool 9 1,351 70.8 70.4 67.2 68.3 71.8 5.1% 0.3% 61.03 60.28 59.30 64.15 66.18 3.2% 2.0% 43.21 42.44 39.84 43.81 47.51 8.5% 2.4%
Luton 3 640 62.4 69.2 68.5 71.0 69.9 -1.5% 2.9% 61.30 60.43 59.11 54.59 52.18 -4.4% -3.9% 38.27 41.79 40.49 38.76 36.50 -5.8% -1.2%
Maidstone 4 389 67.3 69.9 72.1 73.2 75.6 3.3% 3.0% 56.90 55.72 55.49 55.78 59.10 5.9% 1.0% 38.29 38.94 40.02 40.82 44.68 9.5% 3.9%
Manchester 15 2,304 71.2 73.6 73.3 75.2 77.6 3.2% 2.2% 59.21 59.60 59.85 62.39 65.24 4.6% 2.5% 42.13 43.87 43.89 46.93 50.64 7.9% 4.7%
Milton Keynes 3 501 72.3 74.6 74.3 76.2 76.0 -0.3% 1.2% 58.20 61.63 62.98 65.89 72.96 10.7% 5.8% 42.10 45.97 46.79 50.20 55.44 10.4% 7.1%
Newcastle 8 1,129 73.9 74.6 72.0 72.4 75.8 4.8% 0.7% 57.27 56.11 54.77 52.89 54.52 3.1% -1.2% 42.29 41.87 39.46 38.28 41.34 8.0% -0.6%
Northampton 3 285 67.4 65.9 69.2 70.4 73.9 5.0% 2.3% 57.20 58.24 56.85 56.64 59.26 4.6% 0.9% 38.57 38.38 39.35 39.89 43.81 9.8% 3.2%
Norwich 5 458 67.4 70.2 68.3 73.8 77.0 4.4% 3.4% 49.23 48.08 48.59 47.38 52.63 11.1% 1.7% 33.20 33.76 33.20 34.96 40.53 15.9% 5.1%
Nottingham 11 1,298 62.9 66.0 65.8 69.9 65.8 -5.9% 1.1% 52.38 51.62 52.41 51.03 52.41 2.7% 0.0% 32.95 34.05 34.49 35.68 34.49 -3.4% 1.1%
Oxford 4 538 73.4 73.8 74.4 81.2 78.9 -2.8% 1.8% 54.85 57.10 57.16 59.08 62.13 5.2% 3.2% 40.25 42.13 42.51 47.98 49.03 2.2% 5.1%
Portsmouth 4 576 79.1 79.0 77.3 81.9 81.1 -1.0% 0.6% 69.15 67.98 70.96 72.09 76.24 5.8% 2.5% 54.72 53.71 54.85 59.02 61.81 4.7% 3.1%
Reading 9 982 61.3 65.7 67.0 70.4 68.8 -2.3% 2.9% 49.36 50.20 53.11 54.77 59.15 8.0% 4.6% 30.28 33.00 35.59 38.57 40.71 5.5% 7.7%
Sheffield 3 424 60.7 66.4 62.8 70.8 70.5 -0.4% 3.8% 38.68 37.21 38.46 37.67 43.90 16.5% 3.2% 23.49 24.72 24.16 26.65 30.94 16.1% 7.1%
Solihull 4 754 65.7 63.5 63.8 65.9 67.7 2.7% 0.7% 79.36 76.79 76.95 78.13 74.52 -4.6% -1.6% 52.17 48.80 49.12 51.47 50.44 -2.0% -0.8%
Southampton 4 507 71.4 74.9 75.8 78.5 81.6 3.9% 3.4% 54.50 49.70 51.41 52.13 55.43 6.3% 0.4% 38.92 37.23 38.95 40.93 45.22 10.5% 3.8%
Stratford-upon-Avon 4 512 67.8 69.9 67.8 68.8 70.4 2.3% 0.9% 69.51 68.55 68.63 69.25 74.46 7.5% 1.7% 47.14 47.91 46.52 47.65 52.44 10.0% 2.7%
Swindon 5 702 61.3 64.2 63.5 66.9 74.2 10.9% 4.9% 51.06 52.35 55.77 51.54 53.86 4.5% 1.3% 31.30 33.63 35.43 34.46 39.95 15.9% 6.3%
Windsor/Maidenhead 3 425 70.8 71.9 74.7 73.7 72.5 -1.7% 0.6% 72.14 74.91 76.97 79.45 82.82 4.2% 3.5% 51.07 53.86 57.51 58.59 60.01 2.4% 4.1%
York 5 542 77.3 78.7 78.7 78.9 82.0 3.9% 1.5% 58.90 59.14 59.14 58.33 62.77 7.6% 1.6% 45.51 46.57 46.57 46.04 51.49 11.8% 3.1%


THE GUIDE TO THE PERFORMANCE OF HOTELS IN THE UK | HOTEL BRITAIN 2015 34
After a strong 2014, the UK economy is forecast to continue to expand throughout 2015, with GDP growth expected to be between 2.5 and 2.7%. However, there are some variables that might reduce the pace of growth. The general election in May is one of the most obvious factors that could pose uncertainties in the short term. While companies remain positive, they are vigilant about possible scenarios that might arise from the election. In addition, the drop in the oil price is expected to continue to drive consumers’ consumption. However, there is a possible risk of short term deflation for the UK, as already experienced by some of its European counterparts. At the time of writing, UK inflation has fallen to essentially zero, a record low level, halting prospects of an imminent interest rate increase by the Bank of England.
Having said that, despite all the uncertainty surrounding future economic performance, the fundamentals of the economy in the UK remain strong, with wages continuing to grow and unemployment falling well below 6%, and the manufacturing sector growing at its fastest rate for over six months in February, according to the CBI.
CONTINUED GROWTH FOR UK HOTELSThe record number of visitors in 2014, coupled with the improved economic outlook, are likely to continue to have a positive affect on hotels across the country, with tourism expected to break the 35m barrier during 2015, assisted by the increase in disposable income.
London
After experiencing a somewhat bumpy 2013 and a difficult start to 2014, hotels in London enjoyed growth for the rest of 2014. The capital still continues to be one of the top global cities for hotel development. 2015 is poised to continue on an upward path, with both occupancy and AARR benefitting from strong demand. Occupancy is at one of the highest levels in the capital, and rates have also continued to grow throughout. We expect this healthy mix of growth to continue in 2015 for hotels in the capital.
Regions
After their record year in 2014, hotels in the regions are still poised to continue to post growth throughout 2015. However, the pace of growth could be affected by the troubles experienced in the Eurozone and the pound- euro exchange rate which could deter inbound visits.
THE ROAD AHEAD
CHANGES IN TOURISM VISITOR PATTERNSRecently there has been a slowdown of visitors from the BRIC economies that is likely to continue for the short to medium term. Apart from the obvious slowdown of incoming visitor numbers from countries like Russia, the Chinese market has also shown a decline in visitors in 2014. In the People’s Republic of China, GDP growth for 2014 has not matched earlier forecasts. Having said that, Asian companies are still investing and expanding in the UK, with the latest news that Peninsula Hotels have secured a London property, reaffirming the importance of the relationships between the UK and the Far East for both trade and tourism flows.
In addition to the reduced number of incoming visitors from the BRIC economies, the recent rise in the value of the pound, at a seven year historic high against the euro, is likely to affect the number of visitors from the continent, assuming that this trend is likely to continue during the current year.
However, Britons are expected to take more holidays in 2015 as a result of the recent decline in oil prices, lower inflation and increased household income. This should definitely boost domestic tourism and expenditure, as consumers remain confident, but, coupled with the exchange rate, could also result in increased outbound tourism to the continent as holidays may become cheaper.
RUGBY WORLD CUPHotels in the UK will be exposed globally when the Rugby World Cup takes place in the autumn. Apart from the obvious benefits of improvements for both occupancy and AARR, the country will have the opportunity to repeat its global showcase as experienced during the Olympic Games in 2012. This is likely to result in renewed interest in the UK and in turn to increased inbound visits. Hotels in the country traditionally have benefited from sporting events such as the Olympics, the Commonwealth Games, and indeed the Rugby World Cup.
CONTINUED TRANSACTION ACTIVITY2015 is poised to continue the trend for hotel transactions both in London and in the regions. As mentioned earlier, lenders are opening up to the improved economic conditions and are prepared to pay premium prices for the right property.

HOTEL BRITAIN 2015 | THE GUIDE TO THE PERFORMANCE OF HOTELS IN THE UK35
The prize includes a one night stay for two at the Conrad London St James including breakfast and dinner. Subject to availability, valid until November 2016.
WIN A ONE NIGHT STAY FOR TWO AT THE CONRAD LONDON ST JAMES HOTEL, COURTESY OF THE SPLENDID HOSPITALITY GROUP

THE GUIDE TO THE PERFORMANCE OF HOTELS IN THE UK | HOTEL BRITAIN 2015 36
ABOUT THE GROUP AND THE HOTELControlled and directed by Shiraz and Nadeem Boghani, Splendid Hospitality Group is one of the UK’s fastest growing privately-owned hotel groups which has made a name for itself through the design, construction and operation of a full range of hotel styles and locations.
The group owns 15 properties across the UK, both franchised and unbranded. Splendid Hospitality Group are proud to be developing hotels in some of the UK’s best destinations including the 5 Star Conrad St James, the Grand Hotel and Spa in York, Vanbrugh House Oxford, Indigo Edinburgh, the Holiday Inn Wembley, as well as a the planned Hilton London Bankside and Indigo Hotel in York.
Ideally situated just steps from St James’s Park, Buckingham Palace and the Houses of Parliament, Conrad London St James offers a smart choice for the modern traveller. Navigate around the city with ease with convenient transport links nearby the hotel.
Encased in a historic 19th Century façade, the chic and contemporary interior of Conrad London St James showcases original art installations and locally inspired design.
HOTEL BRITAIN 2015 COMPETITION
HOW TO ENTERAll you need to do to enter is predict as accurately as you can the occupancy and average achieved room rate (AARR) per occupied room in BDO’s sample of hotels in Britain for the 2015 calendar year. Answers should be submitted in the following format:
1. Occupancy: ....................% (to 1 decimal place)
2. AARR: £..................... (to 2 decimal places)
You can submit your answer at the Hotel Britain Launch Event using the slips provided, or by emailing [email protected], with ‘Hotel Britain Competition Entry’ in the subject line. Entries close on 31 May 2015. Only one entry per person. The winner will be notified by 5 March 2016. The winner will receive a voucher valid for redemption until November 2016.


THE GUIDE TO THE PERFORMANCE OF HOTELS IN THE UK | HOTEL BRITAIN 2015 38
CLAIRVOYANT CORNERFROM LAST YEAR’S COMPETITION WINNER
JAKE EGBERTS Asset Manager – Hotels
Topland Group of Companies
When asked about the outlook for the UK hotel market last year during the Hotel Britain event, several influencing factors crossed my mind. These included the UK’s economic recovery, new supply entering the market adding further pressure on under-invested assets, the ongoing sophistication by guests to achieve a competitive rate and the Glasgow Commonwealth Games. London continues to be strong, combined with the continued resurgence in Provincial UK, has influenced the UK hotel market’s performance. I am really pleased that my prediction came within a whisker of the actual performance.
Following Topland’s acquisition in December 2013 of the Menzies Hotel Group, 2014 started with a rush which continued as the year progressed, it was a very exciting year for Topland as we further established ourselves in the UK hotel sector. The subsequent acquisition of Hallmark Hotels in August 2014 was soon followed in quarter four with a period of due diligence and travels around the North East as Topland evaluated The Feather Hotel portfolio. This culminated in the acquisition of Feathers in mid-January 2015. During the thirteen months from December 2013 to January 2015 Topland increased from one owned and operated hotel to twenty-eight hotels in addition to our Royal Crescent Hotel in Bath and nine more hotels leased to Thistle, Hilton and Ramada owned by Topland since 2006. Topland’s internal asset management team works closely with Bespoke who operate the hotels on behalf of Topland. Topland’s combined asset management expertise will continue to focus on driving revenue and exceeding EBITDA expectations across the portfolio to maximise value. Topland has exciting plans to consolidate the three portfolios which will assist in achieving growth through improved revenue strategies and procurement benefits from enhanced scale. Topland is investing capital to enhance its hotel portfolio and constantly seizing new opportunities to further grow the portfolio. We look forward to continued buoyancy in the hotel sector through 2015 and onwards.


THE GUIDE TO THE PERFORMANCE OF HOTELS IN THE UK | HOTEL BRITAIN 2015 40
Hotel Britain is the definitive guide to the performance and prospects of the UK’s hotel industry. It is compiled from the responses of a representative cross section of 656 hotels comprising 82,371 rooms, and including 147 London hotels and 509 around the rest of the country.The results of this survey are grouped for convenience according to geographic location. We breakdown the performance of hotels in key centres across the country, and analyse both London and the regions in terms of average room rate.
Hotels in the capital are divided into four main bands according to the average room rate achieved during 2014. The top rate band, Deluxe, comprises Superior Deluxe and International Deluxe properties. This is followed by First Class and Business properties, with the final category being Tourist hotels. There is also a separate performance breakdown, which extends across all these rate boundaries, for townhouse properties. Regional hotels have been placed in one of five rate bandings, with a separate performance breakdown, which extends across all these rate boundaries, for Country House properties.
To ensure that our year-on-year results are directly comparable, only properties able to contribute data from the last five years have been included. Hotels which have closed for a period of refurbishment or have opened during this period have been excluded.
GLOSSARYDefinitions of some of the terms used in this report are provided below.
• Room occupancy: the ratio of total occupied rooms to total available.
• Average achieved room rate (AARR): rooms revenue divided by the total number of guest rooms occupied during the year (also known as ADR).
• (Average daily) rooms yield: room occupancy multiplied by the average achieved room rate (also known as RevPar).
• Current values: values expressed on an actual basis, including the effects of inflation.
• Constant values: historic and future values rebased to a base year by removing the inflation element.
• Compound Annual Growth Rate (CAGR): average growth rate on an annualised basis.
SURVEY COVERAGE
ABOUT THIS REPORTResearch and editorial: Michele Pasqui
To order further copies of the report please contact:
Michele PasquiTel: (+44) 020 7893 3654Email: [email protected]
PARTICIPATING HOTEL COMPANIESAlongside the many individual properties who so kindly contributed data to this survey, we would like to recognise the invaluable participation of the following hotel companies:
Accor
Bryant Hospitality
Carlson Rezidor Hotel Group
Choice Hotels Europe
Como Hotels
Dominvs
English Lakes
Exclusive Hotels
Firmdale Hotels
First Inns
Focus Hotels
Four Seasons Hotels and Resorts
glh Hotels
Hallmark hotels
Hand Picked Hotels
Hyatt Hotels and Resorts
InterContinental Hotel Group
Interstate hotels
Jumeirah
Jurys Inn
Kew Green Hotels
Macdonald Hotels & Resorts
Malmaison
Marriott International
Menzies
MyHotels Group
New Light hotels
NH Hoteles
The Hotel Collection
QHotels
Park Plaza Hotels
Principal Hayley
Ramada hotels
Red Carnation Hotels
Rocco Forte Collection
Shire Hotels
Sol Melia International
Starwood Hotels and Resorts
Taj Hotels Resorts & Palaces
The Doyle Collection Group
Travelodge
Wyndham


THE GUIDE TO THE PERFORMANCE OF HOTELS IN THE UK | HOTEL BRITAIN 2015 42
Our team works with international businesses across the leisure industries, including restaurants and bars, betting and gaming, hotels, professional sports and fitness, and travel and tourism.We provide assurance, tax and advisory services to our clients who range from small owner-managed businesses to large corporations in both the private and public sectors, many of whom are market leaders.
HOTELSExperience says a lot about a firm. BDO’s hotel involvement stretches back almost 100 years and our London office established its sector consultancy in the early 1970s. Since then we have undertaken thousands of assignments throughout Europe, the Middle East, Africa and the Caribbean.
This expertise covers the entire spectrum of investment and operating activities and our involvement brings credibility, competence and independence to any project.
Our team of dedicated professionals have experience gained from a range of industry disciplines. This means that we have a wider perspective and can use their practical knowledge to achieve the best possible outcome for our clients.
BDO LEISURE AND HOSPITALITY SERVICES
There is no other sector consultancy in Europe with a research and performance database that stretches back as far as ours, or contains the volume of information that we possess. Our research and publications team, and our archive facility, ensures that our clients and consultants have immediate access to the latest authoritative data.
In short, if you are active in the hotel industry then you should be talking to BDO.
Specialist advice we provide to the sector includes:
• Feasibility studies
• Valuations
• Strategic consulting
• Litigation support/expert witness services
• Transaction support
• Operator searches
• Mergers and acquisitions including MBOs, MBIs and flotations
• Fund raising and refinancing
• Financial investigations
• Systems reviews
• Turnaround and distressed situations
• Need analysis.

HOTEL BRITAIN 2015 | THE GUIDE TO THE PERFORMANCE OF HOTELS IN THE UK43
BETTING AND GAMINGBDO acts as auditor, tax adviser and consultant to many UK and international betting and gaming businesses, both private and publicly quoted. Our clients have ranged from many of the major ‘bricks and mortar’ bookmaking and casino operators to major offshore telephone and internet sports books, casinos, poker and other online gaming activities. As well as the more traditional forms of betting and gaming, we also act for FCA regulated businesses in the financial trading, financial spread betting and CFD sector.
Specialist advice we can provide to the sector includes:
• International tax planning and structuring
• Corporate financing and flotations
• Property and corporate acquisitions and disposals
• Financial Services Act regulations and compliance
• Installation of management reporting and controls and internal audit functions
• IT controls, environment reviews and systems improvement advice
• Feasibility studies
• Valuations
• Economic impact assessments
• Strategy and business planning.
RESTAURANTS, BARS AND PUBSBDO is recognised as the leading adviser to the restaurants and bars sector, blending sector knowledge and experience with practical advice which is aimed at making a real difference to our clients’ performance.
We are one of the market leaders in the sector, advising more restaurant groups in the UK than any other accounting firm. We have strong industry insight and experience in restaurants, bars, clubs, coffee bars and food retailers.
This industry-focused approach ensures our clients benefit from the specialist expertise and diverse skills of people that know their business, market and industry.
Services we provide to our clients include:
• Corporate financing and flotations
• Business assurance and risk assurance services
• Tax planning and structuring
• Employment tax, including specialism in troncs, NESTs etc
• IT controls, environment reviews and systems improvement advice
• Business reviews and strategic planning
• Property and corporate acquisition and disposals
• Installation of management reporting and controls and internal audit functions
• Working capital improvement reviews and administrative receiverships.
PROFESSIONAL SPORTS AND EVENTSOur sports and events client base includes businesses as broad as individual golf courses and public sector clubs to fitness centre chains and listed football clubs. BDO has a bank of experienced specialists in this sector to help with your particular business needs, no matter how niche you may believe them to be, we can help you realise your potential.
Specialist advice we can provide to the sector includes:
• Funding for redevelopment and/or expansion
• Private/public partnerships
• Risk assessment and planning for site redevelopment or relocation
• Tax planning and compliance.

THE GUIDE TO THE PERFORMANCE OF HOTELS IN THE UK | HOTEL BRITAIN 2015 44
TRAVEL AND TOUR OPERATORSThe travel sector has undergone some of the biggest changes we have witnessed to one particular industry over the last few years. It has been a roller-coaster ride of new entrants and new technology, consolidation and unpredicted new challenges to business, such as SARS and terrorism.
BDO has helped its travel clients turn a turbulent time into one of opportunity. Our commitment to this sector has seen us attract some of the best known names in the business – from owner managed private businesses through to large listed companies with international networks. By working with leading organisations from the travel industry, we ensure we are always developing new ways to address your industry and regulatory issues. BDO is an ABTA Travel Industry Partner and provides the section on Travel Agents and Tour Operators for Butterworth’s Financial Reporting and Accounting for Specialised Sectors. We have members on the ICAEW/ABTA Working Group instigated by ABTA and also on the ICAEW/CAA Working Group instigated by the CAA.
Specialist advice we can provide for your sector includes:
• ATOL applications
• Tour Operator Margin Scheme
• Industry regulation and compliance
• Flotations, acquisitions and disposals
• Tax planning and compliance for the travel industry
• Business continuity planning.
OUR HOTELS TEAMFor more information on any of our services for the hotel industry, please contact the relevant BDO expert below
MANAGEMENT CONSULTINGROBERT [email protected]
AUDITDAVID [email protected]
AUDITSTUART [email protected]
TAXATIONJAMES [email protected]
BUSINESS RESTRUCTURINGSARAH [email protected]
CORPORATE FINANCE,PETER [email protected]

HOTEL BRITAIN 2015 | THE GUIDE TO THE PERFORMANCE OF HOTELS IN THE UK45

THE GUIDE TO THE PERFORMANCE OF HOTELS IN THE UK | HOTEL BRITAIN 2015 46

This publication has been carefully prepared, but it has been written in general terms and should be seen as broad guidance only. The publication cannot be relied upon to cover specific situations and you should not act, or refrain from acting, upon the information contained therein without obtaining specific professional advice. Please contact BDO LLP to discuss these matters in the context of your particular circumstances. BDO LLP, its partners, employees and agents do not accept or assume any liability or duty of care for any loss arising from any action taken or not taken by anyone in reliance on the information in this publication or for any decision based on it.
BDO LLP, a UK limited liability partnership registered in England and Wales under number OC305127, is a member of BDO International Limited, a UK company limited by guarantee, and forms part of the international BDO network of independent member firms. A list of members’ names is open to inspection at our registered office, 55 Baker Street, London W1U 7EU. BDO LLP is authorised and regulated by the Financial Conduct Authority to conduct investment business.
BDO is the brand name of the BDO network and for each of the BDO Member Firms.
BDO Northern Ireland, a partnership formed in and under the laws of Northern Ireland, is licensed to operate within the international BDO network of independent member firms.
Copyright © April 2015 BDO LLP. All rights reserved.
www.bdo.co.uk