lemons from argentina - usda aphis · argentina’s lemon industry expanded significantly when...
TRANSCRIPT
United States Department of Agriculture
Animal and Plant Health Inspection Service
March 2015
Initial Regulatory Flexibility Analysis Proposed Rule APHIS 2014-0092
RIN 0579-AE17
Fresh Lemon from Argentina
Policy & Program Development
Policy Analysis & Development
i
Summary
This analysis examines potential economic impacts for small entities of a proposed rule
that would allow the importation of fresh lemon from a region in northwest Argentina into the
continental United States. A systems approach to pest risk mitigation would provide
phytosanitary protection against pests of quarantine concern. Economic effects of the rule for
both U.S. producers and consumers are not expected to be significant. While producers’ welfare
would be negatively affected, welfare gains for consumers would outweigh producer losses,
resulting in a net benefit to the U.S. economy.
Commercial lemon production takes place in California and Arizona. For the 2013/14
season, lemon-bearing acres totaled 54,500 (California 46,000, Arizona 8,500). In the same
season, the value of U.S. production of lemons was $647 million, 92 percent earned by
California’s growers and 8 percent by Arizona’s growers. Over the five seasons, 2008/09 to
2012/13, U.S. fresh lemon production averaged about 497,350 metric tons (MT) per year. Over
the same period, annual imports averaged about 45,751 MT and exports averaged about 95,574
MT. Because of the provisions of the rule, we expect that most lemons would be exported
between April 1 and August 31, a period that coincides roughly with the months in which U.S.
lemon exports are declining and imports are increasing.
Effects of the proposed rule are estimated using a partial equilibrium model of the U.S.
lemon sector. Annual imports of fresh lemon from Argentina are expected to range between
15,000 and 20,000 MT, with volumes averaging 18,000 MT. Quantity, price and welfare changes
are estimated for these three import scenarios.
If the United States were to import 18,000 MT of fresh lemon from Argentina and there
were no displacement of lemon imports from other countries, the price would decrease by an

ii
estimated 4 percent. Consumer welfare gains of about $25 million would outweigh producer
welfare losses of about $22 million, resulting in a net welfare gain of about $3 million. The
15,000 MT and 20,000 MT scenarios show similar effects.
More reasonably, partial import displacement would occur, and price and welfare effects
would be proportional to the net increase in U.S. lemon imports. If one-half of the quantity of
fresh lemon imported from Argentina were to displace U.S. fresh lemon imports from elsewhere,
then for the 18,000 MT scenario the price decline would be about 2 percent; consumer welfare
gains and producer welfare losses would be about $12.2 million and $10.9 million, respectively,
yielding a net welfare benefit of about $1.3 million.
The majority of businesses that may be affected by the proposed rule are small entities,
including lemon producers, packers, wholesalers, and related establishments. APHIS welcomes
informed public comment in order to better determine the extent to which U.S. small entities
may be affected by this proposed rule.

iii
Table of Contents Summary ......................................................................................................................... i
Introduction .....................................................................................................................1
Production and Trade of Lemon by the United States and Argentina ............................2
U.S. Lemon Production and Trade ...............................................................................2
Argentina Lemon Production and Trade ......................................................................3
Expected Benefits and Costs of the Rule ......................................................................5
The Baseline and Modeling Assumptions ....................................................................5
Results ........................................................................................................................8
Benefits ..................................................................................................................... 12
Costs ......................................................................................................................... 12
Reasons Action is Being Considered.............................................................................. 12
Objectives of and Legal Basis for the Rule .................................................................... 13
Potentially Affected Small Entities ................................................................................ 13
Projected Reporting, Recordkeeping, and Other Compliance Requirements ................... 17
Duplication, Overlap, or Conflict with Existing Rules and Regulations .......................... 17
Alternatives to minimize Significant Economic Impacts of the Rule .............................. 17
References ..................................................................................................................... 18
1
Introduction
APHIS received a request from Argentina to allow the importation of fresh lemon (Citrus
limon (L.) Burm. F.) fruit from northwest Argentina into the continental United States. In
response to this request, APHIS’ division of Plant Protection and Quarantine prepared a pest risk
assessment and risk management document.1,2 APHIS proposes to allow the importation of
lemon into the continental United States under a systems approach described in the risk
management document that would provide phytosanitary protection against pests of quarantine
concern.3 The proposed rule is consistent with our commitment under the International Plant
Protection Convention to allow the importation of plants and plant products subject to the least
restrictive measures that ensure phytosanitary security.
This document examines the potential economic effects of the proposed rule on small
entities, as required by the Regulatory Flexibility Act. This Act requires agencies to evaluate the
potential effects of their proposed and final rules on small businesses, small organizations and
small governmental jurisdictions. In the following sections of the Introduction, we provide an
overview of production and trade of fresh lemon by the United States and Argentina, followed by
1 USDA. 2014. Risk Assessment for the Importation of Fresh Lemon (Citrus limon (L.) Burm. F.) Fruit from Northwest Argentina into the continental United States. Animal and Plant Health Inspection Service, Center for Plant Health Science and Technology, Plant Epidemiology and Risk Analysis Laboratory, Raleigh, NC. 2 USDA. 2014. Importation of Fresh Lemon (Citrus limon (L.) Burm. F.) from Northwest Argentina into the Continental United States, Risk Management Document. Animal and Plant Health Inspection Service, Plant Health Programs, Regulatory, Permits and Manuals, Riverdale, MD. 3 FAO, “International Standards for Phytosanitary Measures (ISPM) No. 14, The use of integrated measures in a systems approach for pest risk management 2002,” http://www.acfs.go.th/sps/downloads/16210_ISPM_14_E.pdf According to FAO-ISPM No 14, the systems approach is “the integration of different pest risk management measures, at least two of which act independently, and which cumulatively achieve the appropriate level of phytosanitary protection.” Updates (January 8, 2014) https://www.ippc.int/publications/use-integrated-measures-systems-approach-pest-risk-management, and other ISPMs relevant to the proposed rule are: No. 1 (Principles of plant quarantines as related to international trade), No. 2 (Guidelines for pest risk analysis), No. 8 (Determination of pest status in an area), No. 12 (Guidelines for phytosanitary certificates), No. 20 (Guidelines for a phytosanitary import regulatory system), and No. 28 (Phytosanitary treatments for regulated pests).
2
a discussion of expected benefits and costs of the rule as estimated using a partial equilibrium
model.
Production and Trade of Lemon by the United States and Argentina
U.S. Lemon Production and Trade
Lemons are among the most popular fresh fruits consumed in the United States. Lemon
juice, rind, and zest are used in a variety of foods and drinks. In the 2012/13 crop year, U.S. per
capita consumption of fresh lemon was about 3.4 pounds, up from 2.6 pounds in 1992.4 In 2012,
lemons generated $430 million in cash receipts, about 2 percent of the $26 billion in cash
receipts for fruits overall.5
Commercial lemon production in the United States takes place in California and Arizona.
For the 2013/14 season, lemon bearing acres totaled 54,500 (California 46,000, Arizona 8,500).
California yields stood at 413 boxes per acre, while Arizona produced 212 boxes per acre.6 In the
same season, the value of U.S. production of lemons was $647 million, 92 percent earned by
California’s growers and 8 percent by Arizona’s growers. The marketing season for California
runs from August to July (year-round) and for Arizona, from September to March.
Over the five production seasons, 2008/09 to 2012/13, fresh lemon output averaged about
524,110 metric tons (MT). Over the same period, imports averaged about 45,751 MT and exports
averaged about 95,574 MT (table 1).
The main export markets for U.S. fresh lemon over the period 2010/11 to 2012/13 are
Canada (35 percent), Japan (31 percent), South Korea (9 percent), and Hong Kong and China (6
4 USDA, Economic Research Service. Imports Contribute to Year-Round Fresh Fruit Availability, 5 USDA, Economic Research Service. Fruit and Tree Nuts, Table A-8: U.S. Cash Receipts 1980 to date. 6 A box weighs approximately 80 pounds.
3
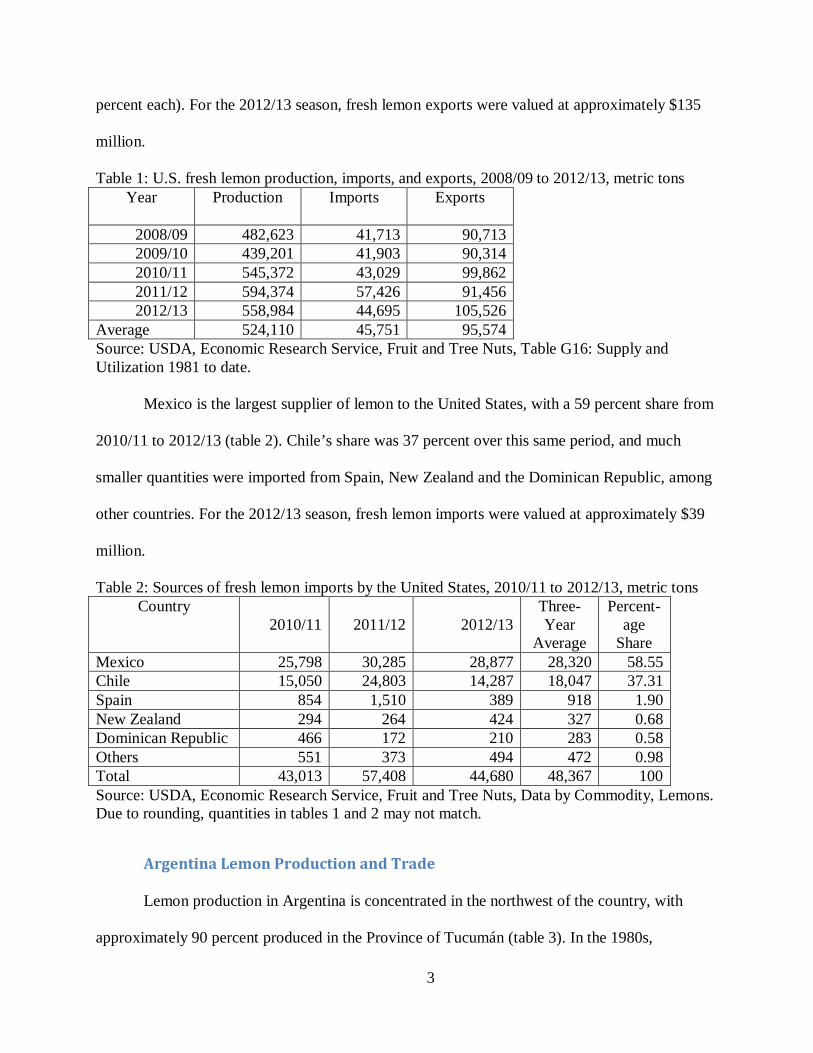
percent each). For the 2012/13 season, fresh lemon exports were valued at approximately $135
million.
Table 1: U.S. fresh lemon production, imports, and exports, 2008/09 to 2012/13, metric tons
Source: USDA, Economic Research Service, Fruit and Tree Nuts, Table G16: Supply and Utilization 1981 to date. Mexico is the largest supplier of lemon to the United States, with a 59 percent share from
2010/11 to 2012/13 (table 2). Chile’s share was 37 percent over this same period, and much
smaller quantities were imported from Spain, New Zealand and the Dominican Republic, among
other countries. For the 2012/13 season, fresh lemon imports were valued at approximately $39
million.
Table 2: Sources of fresh lemon imports by the United States, 2010/11 to 2012/13, metric tons Country
2010/11 2011/12 2012/13 Three-Year
Average
Percent-age
Share Mexico 25,798 30,285 28,877 28,320 58.55 Chile 15,050 24,803 14,287 18,047 37.31 Spain 854 1,510 389 918 1.90 New Zealand 294 264 424 327 0.68 Dominican Republic 466 172 210 283 0.58 Others 551 373 494 472 0.98 Total 43,013 57,408 44,680 48,367 100 Source: USDA, Economic Research Service, Fruit and Tree Nuts, Data by Commodity, Lemons. Due to rounding, quantities in tables 1 and 2 may not match.
Argentina Lemon Production and Trade
Lemon production in Argentina is concentrated in the northwest of the country, with
approximately 90 percent produced in the Province of Tucumán (table 3). In the 1980s,
Year Production Imports Exports
2008/09 482,623 41,713 90,713 2009/10 439,201 41,903 90,314 2010/11 545,372 43,029 99,862 2011/12 594,374 57,426 91,456 2012/13 558,984 44,695 105,526
Average 524,110 45,751 95,574
4
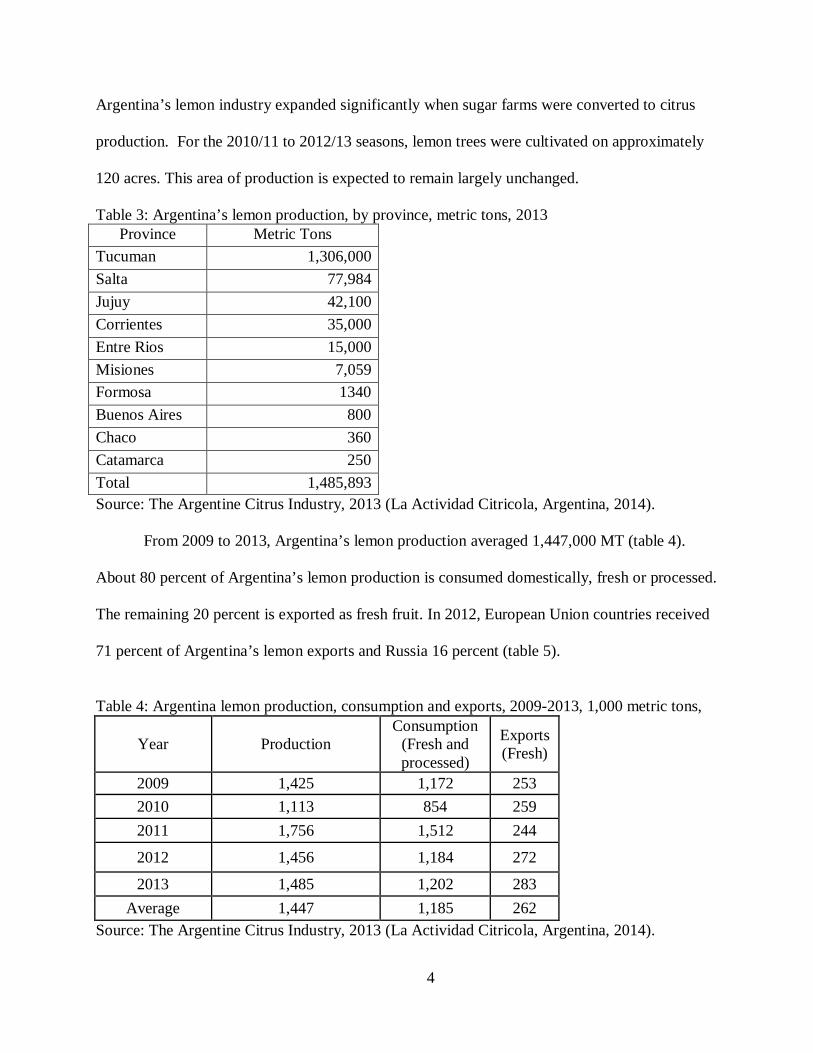
Argentina’s lemon industry expanded significantly when sugar farms were converted to citrus
production. For the 2010/11 to 2012/13 seasons, lemon trees were cultivated on approximately
120 acres. This area of production is expected to remain largely unchanged.
Table 3: Argentina’s lemon production, by province, metric tons, 2013 Province Metric Tons
Tucuman 1,306,000 Salta 77,984 Jujuy 42,100 Corrientes 35,000 Entre Rios 15,000 Misiones 7,059 Formosa 1340 Buenos Aires 800 Chaco 360 Catamarca 250 Total 1,485,893 Source: The Argentine Citrus Industry, 2013 (La Actividad Citricola, Argentina, 2014).
From 2009 to 2013, Argentina’s lemon production averaged 1,447,000 MT (table 4).
About 80 percent of Argentina’s lemon production is consumed domestically, fresh or processed.
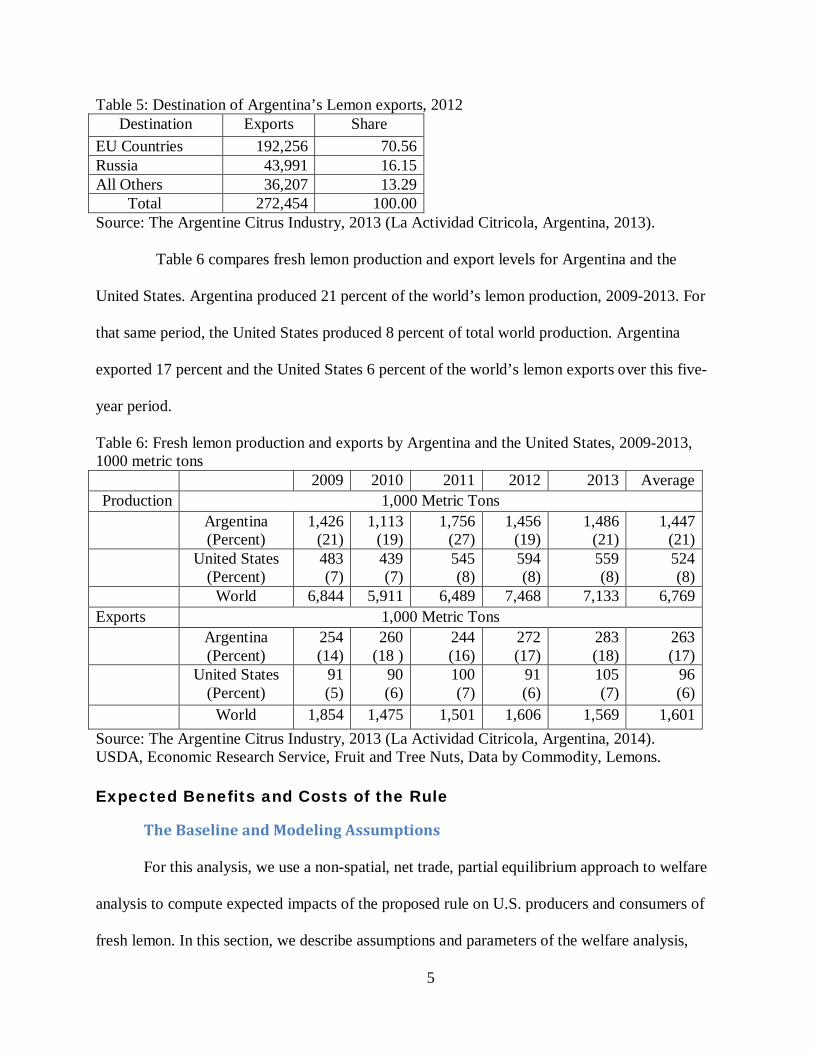
The remaining 20 percent is exported as fresh fruit. In 2012, European Union countries received
71 percent of Argentina’s lemon exports and Russia 16 percent (table 5).
Table 4: Argentina lemon production, consumption and exports, 2009-2013, 1,000 metric tons,
Source: The Argentine Citrus Industry, 2013 (La Actividad Citricola, Argentina, 2014).
Year Production Consumption
(Fresh and processed)
Exports (Fresh)
2009 1,425 1,172 253 2010 1,113 854 259 2011 1,756 1,512 244
2012 1,456 1,184 272
2013 1,485 1,202 283 Average 1,447 1,185 262
5
Table 5: Destination of Argentina’s Lemon exports, 2012 Destination Exports Share
EU Countries 192,256 70.56 Russia 43,991 16.15 All Others 36,207 13.29
Total 272,454 100.00 Source: The Argentine Citrus Industry, 2013 (La Actividad Citricola, Argentina, 2013).
Table 6 compares fresh lemon production and export levels for Argentina and the
United States. Argentina produced 21 percent of the world’s lemon production, 2009-2013. For
that same period, the United States produced 8 percent of total world production. Argentina
exported 17 percent and the United States 6 percent of the world’s lemon exports over this five-
year period.
Table 6: Fresh lemon production and exports by Argentina and the United States, 2009-2013, 1000 metric tons
2009 2010 2011 2012 2013 Average Production 1,000 Metric Tons
Argentina (Percent)
1,426 (21)
1,113 (19)
1,756 (27)
1,456 (19)
1,486 (21)
1,447 (21)
United States (Percent)
483 (7)
439 (7)
545 (8)
594 (8)
559 (8)
524 (8)
World 6,844 5,911 6,489 7,468 7,133 6,769 Exports 1,000 Metric Tons
Argentina (Percent)
254 (14)
260 (18 )
244 (16)
272 (17)
283 (18)
263 (17)
United States (Percent)
91 (5)
90 (6)
100 (7)
91 (6)
105 (7)
96 (6)
World 1,854 1,475 1,501 1,606 1,569 1,601 Source: The Argentine Citrus Industry, 2013 (La Actividad Citricola, Argentina, 2014). USDA, Economic Research Service, Fruit and Tree Nuts, Data by Commodity, Lemons. Expected Benefits and Costs of the Rule
The Baseline and Modeling Assumptions
For this analysis, we use a non-spatial, net trade, partial equilibrium approach to welfare
analysis to compute expected impacts of the proposed rule on U.S. producers and consumers of
fresh lemon. In this section, we describe assumptions and parameters of the welfare analysis,
6
including the baseline price and quantities, projected imports from Argentina, and domestic price
elasticities of demand and supply. We then discuss the modeling results. The model evaluates
how domestic market prices and quantities may adjust to the proposed policy change, and how
producers and consumers may potentially be impacted.
We assume that demand and supply functions are approximately linear near the initial
equilibrium point. For small parallel shifts in supply and demand, this assumption results in
reasonably accurate measures of consumer and producer surplus changes. Lemon imports from
Argentina would affect prices and quantities of fresh lemon on the U.S. market, and therefore
result in welfare impacts as reflected in changes in consumer and producer surplus. Consumer
surplus is the difference between what the consumer pays for a unit of a good or service and the
maximum price that the consumer would be willing to pay for that unit. Producer surplus is the
difference between the price a producer is paid for supplying a unit of a good or service and the
minimum price that the producer would be willing to accept to supply that unit.
Our analysis is non-spatial in that the price and quantity effects obtained from the model
are assumed to be average effects across geographically separate markets. Partial equilibrium
means that the model results are based on maintaining a commodity-price equilibrium in a
limited portion of the overall economy. All other economic sectors not explicitly included in the
model are assumed to have a negligible influence on the model results. A partial equilibrium
analysis is appropriate because the proposed rule is specific to imports of fresh lemon from
Argentina and is therefore expected to have only limited effects on other sectors of the economy.
Baseline data for fresh lemon are shown in tab1e 7. Baseline quantities are based on five-
year averages for 2008/09 through 2012/13. Domestic supply is equated to fresh production
minus exports, where fresh lemon exports are set equal to zero. In a net trade model, such as the
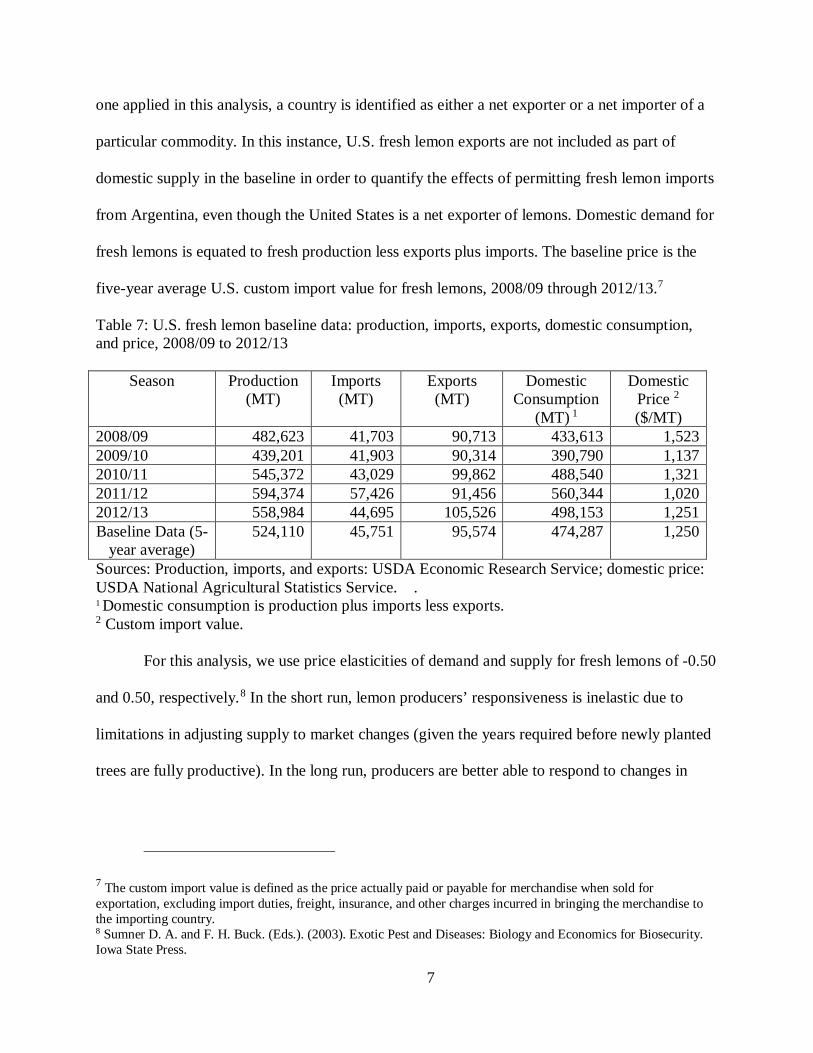
7
one applied in this analysis, a country is identified as either a net exporter or a net importer of a
particular commodity. In this instance, U.S. fresh lemon exports are not included as part of
domestic supply in the baseline in order to quantify the effects of permitting fresh lemon imports
from Argentina, even though the United States is a net exporter of lemons. Domestic demand for
fresh lemons is equated to fresh production less exports plus imports. The baseline price is the
five-year average U.S. custom import value for fresh lemons, 2008/09 through 2012/13.7
Table 7: U.S. fresh lemon baseline data: production, imports, exports, domestic consumption, and price, 2008/09 to 2012/13
Season Production (MT)
Imports (MT)
Exports (MT)
Domestic Consumption
(MT) 1
Domestic Price 2 ($/MT)
2008/09 482,623 41,703 90,713 433,613 1,523 2009/10 439,201 41,903 90,314 390,790 1,137 2010/11 545,372 43,029 99,862 488,540 1,321 2011/12 594,374 57,426 91,456 560,344 1,020 2012/13 558,984 44,695 105,526 498,153 1,251 Baseline Data (5-
year average) 524,110 45,751 95,574 474,287 1,250
Sources: Production, imports, and exports: USDA Economic Research Service; domestic price: USDA National Agricultural Statistics Service. . 1 Domestic consumption is production plus imports less exports. 2 Custom import value.
For this analysis, we use price elasticities of demand and supply for fresh lemons of -0.50
and 0.50, respectively.8 In the short run, lemon producers’ responsiveness is inelastic due to
limitations in adjusting supply to market changes (given the years required before newly planted
trees are fully productive). In the long run, producers are better able to respond to changes in
7 The custom import value is defined as the price actually paid or payable for merchandise when sold for exportation, excluding import duties, freight, insurance, and other charges incurred in bringing the merchandise to the importing country. 8 Sumner D. A. and F. H. Buck. (Eds.). (2003). Exotic Pest and Diseases: Biology and Economics for Biosecurity. Iowa State Press.
8
price. Likewise, a more price-elastic long-run demand is indicative of increased price
responsiveness of consumers over time.
Results
Argentina’s fresh lemon exports to the United States are expected to range from 15,000
MT to 20,000 MT, with 18,000 MT the most likely quantity. This range and most likely quantity
are based on Argentina’s historical level of lemon exports.
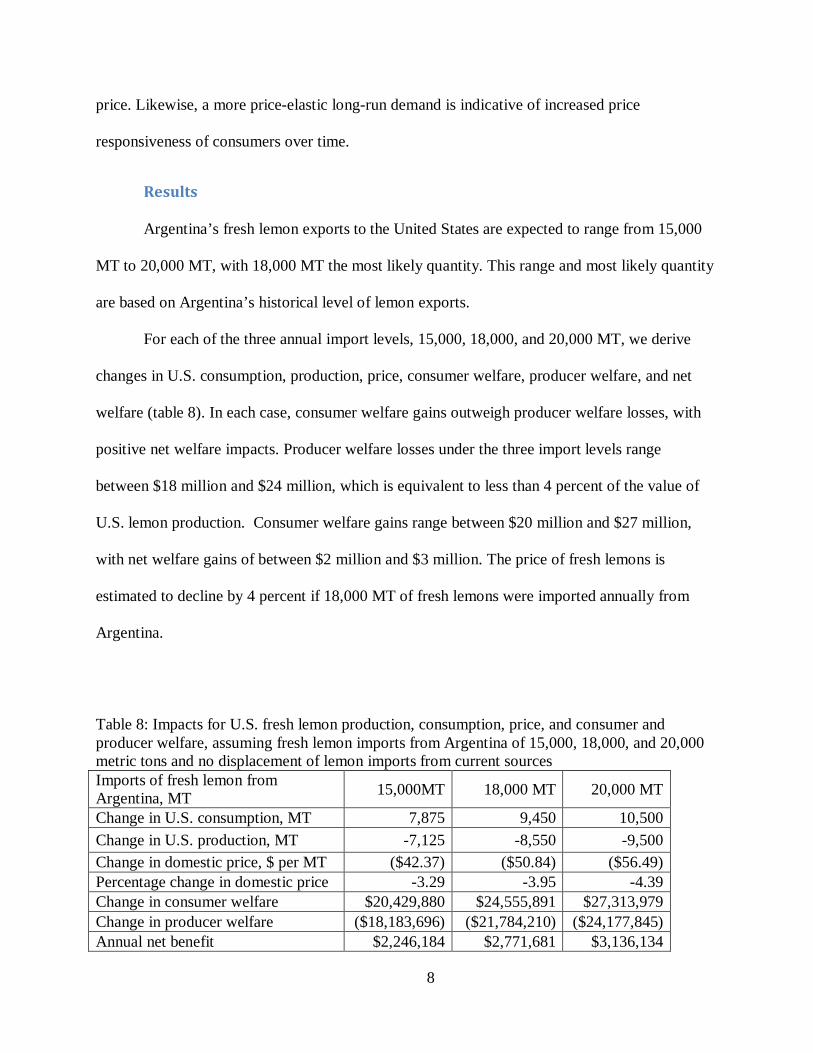
For each of the three annual import levels, 15,000, 18,000, and 20,000 MT, we derive
changes in U.S. consumption, production, price, consumer welfare, producer welfare, and net
welfare (table 8). In each case, consumer welfare gains outweigh producer welfare losses, with
positive net welfare impacts. Producer welfare losses under the three import levels range
between $18 million and $24 million, which is equivalent to less than 4 percent of the value of
U.S. lemon production. Consumer welfare gains range between $20 million and $27 million,
with net welfare gains of between $2 million and $3 million. The price of fresh lemons is
estimated to decline by 4 percent if 18,000 MT of fresh lemons were imported annually from
Argentina.
Table 8: Impacts for U.S. fresh lemon production, consumption, price, and consumer and producer welfare, assuming fresh lemon imports from Argentina of 15,000, 18,000, and 20,000 metric tons and no displacement of lemon imports from current sources Imports of fresh lemon from Argentina, MT 15,000MT 18,000 MT 20,000 MT
Change in U.S. consumption, MT 7,875 9,450 10,500 Change in U.S. production, MT -7,125 -8,550 -9,500 Change in domestic price, $ per MT ($42.37) ($50.84) ($56.49) Percentage change in domestic price -3.29 -3.95 -4.39 Change in consumer welfare $20,429,880 $24,555,891 $27,313,979 Change in producer welfare ($18,183,696) ($21,784,210) ($24,177,845) Annual net benefit $2,246,184 $2,771,681 $3,136,134

9
Some percentage of the lemons that would be imported from Argentina can be expected
to partially displace lemons that would otherwise be imported from current sources (Chile and
Mexico, in particular). U.S. lemon imports peak from July to October, when U.S. lemon exports
are at their lowest levels (figure 1). Partial import displacement is all the more likely because the
period during which we expect most lemons to be exported, from April 1 to August 31, coincides
roughly with the months in which U.S. lemon imports from current sources are on the rise.
Argentina’s lemon exports in recent years have begun in March and ended in October (figure 2).
In contrast, U.S. lemon exports peak from November to May. With approximately 25 percent of
U.S. lemon production exported, November to May is also the period when the U.S. lemon
harvest likely peaks.
0
5,000
10,000
15,000
Met
ric
Tons
Figure 1: United States Lemon Imports and Exports, 2010 to 2013 Average
Export Volume Import Volume
010,00020,00030,00040,00050,00060,00070,00080,000
Met
ric
Tons
Figure 2: Argentina Lemon Exports, 2010 to 2013 Average
Export Volume
10
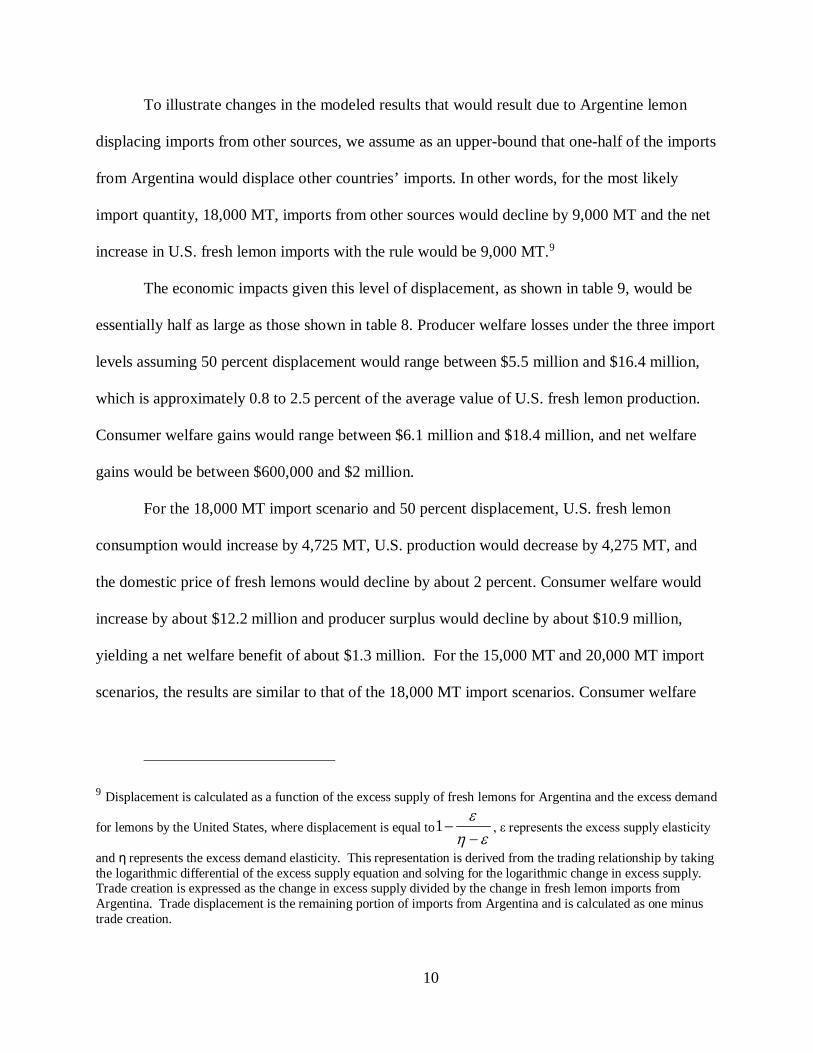
To illustrate changes in the modeled results that would result due to Argentine lemon
displacing imports from other sources, we assume as an upper-bound that one-half of the imports
from Argentina would displace other countries’ imports. In other words, for the most likely
import quantity, 18,000 MT, imports from other sources would decline by 9,000 MT and the net
increase in U.S. fresh lemon imports with the rule would be 9,000 MT.9
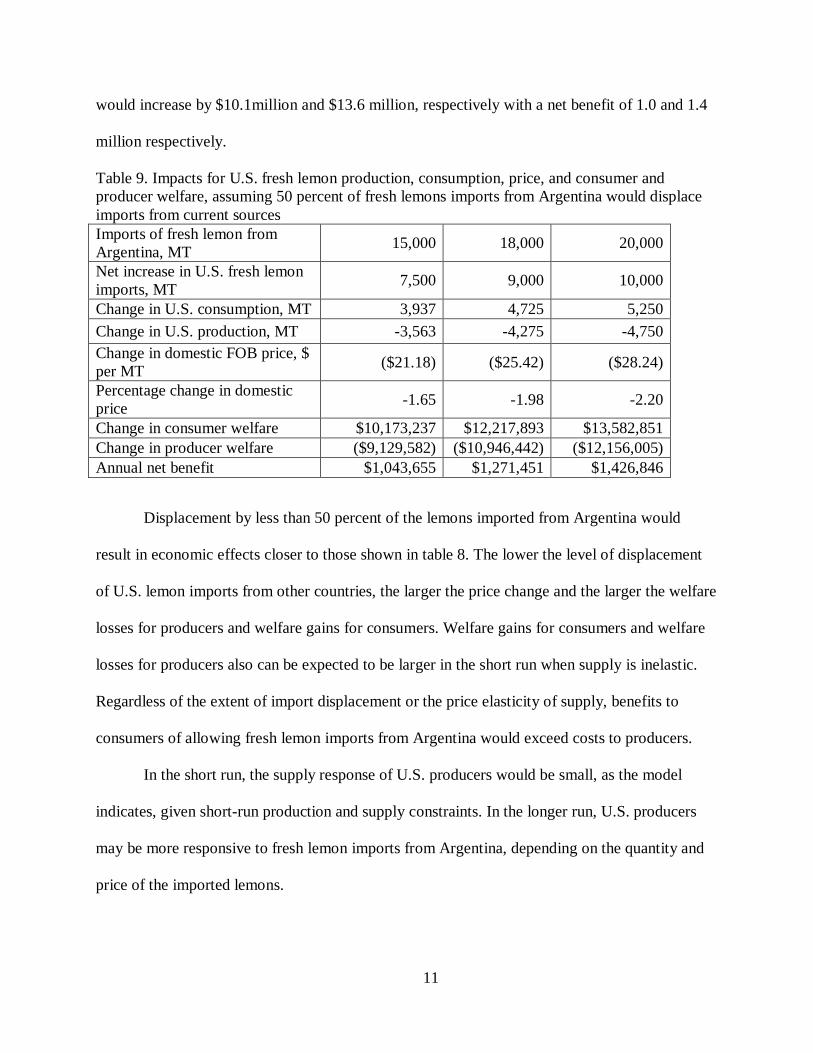
The economic impacts given this level of displacement, as shown in table 9, would be
essentially half as large as those shown in table 8. Producer welfare losses under the three import
levels assuming 50 percent displacement would range between $5.5 million and $16.4 million,
which is approximately 0.8 to 2.5 percent of the average value of U.S. fresh lemon production.
Consumer welfare gains would range between $6.1 million and $18.4 million, and net welfare
gains would be between $600,000 and $2 million.
For the 18,000 MT import scenario and 50 percent displacement, U.S. fresh lemon
consumption would increase by 4,725 MT, U.S. production would decrease by 4,275 MT, and
the domestic price of fresh lemons would decline by about 2 percent. Consumer welfare would
increase by about $12.2 million and producer surplus would decline by about $10.9 million,
yielding a net welfare benefit of about $1.3 million. For the 15,000 MT and 20,000 MT import
scenarios, the results are similar to that of the 18,000 MT import scenarios. Consumer welfare
9 Displacement is calculated as a function of the excess supply of fresh lemons for Argentina and the excess demand
for lemons by the United States, where displacement is equal toεη
ε−
−1 , ε represents the excess supply elasticity
and η represents the excess demand elasticity. This representation is derived from the trading relationship by taking the logarithmic differential of the excess supply equation and solving for the logarithmic change in excess supply. Trade creation is expressed as the change in excess supply divided by the change in fresh lemon imports from Argentina. Trade displacement is the remaining portion of imports from Argentina and is calculated as one minus trade creation.
11
would increase by $10.1million and $13.6 million, respectively with a net benefit of 1.0 and 1.4
million respectively.
Table 9. Impacts for U.S. fresh lemon production, consumption, price, and consumer and producer welfare, assuming 50 percent of fresh lemons imports from Argentina would displace imports from current sources Imports of fresh lemon from Argentina, MT 15,000 18,000 20,000
Net increase in U.S. fresh lemon imports, MT 7,500 9,000 10,000
Change in U.S. consumption, MT 3,937 4,725 5,250 Change in U.S. production, MT -3,563 -4,275 -4,750 Change in domestic FOB price, $ per MT ($21.18) ($25.42) ($28.24)
Percentage change in domestic price -1.65 -1.98 -2.20
Change in consumer welfare $10,173,237 $12,217,893 $13,582,851 Change in producer welfare ($9,129,582) ($10,946,442) ($12,156,005) Annual net benefit $1,043,655 $1,271,451 $1,426,846
Displacement by less than 50 percent of the lemons imported from Argentina would
result in economic effects closer to those shown in table 8. The lower the level of displacement
of U.S. lemon imports from other countries, the larger the price change and the larger the welfare
losses for producers and welfare gains for consumers. Welfare gains for consumers and welfare
losses for producers also can be expected to be larger in the short run when supply is inelastic.
Regardless of the extent of import displacement or the price elasticity of supply, benefits to
consumers of allowing fresh lemon imports from Argentina would exceed costs to producers.
In the short run, the supply response of U.S. producers would be small, as the model
indicates, given short-run production and supply constraints. In the longer run, U.S. producers
may be more responsive to fresh lemon imports from Argentina, depending on the quantity and
price of the imported lemons.

12
Benefits
Imports of fresh lemons from Argentina would result in overall net welfare gains. Actual changes
in import levels and effects on producer and consumer welfare would depend on a variety of factors.
Imports from Argentina would help meet the demand for fresh lemons especially during the summer
months when demand peaks. Argentina’s production season is counter that of the United States. We
anticipate that most lemons would be exported between April 1 and August 31, which is the period in
which demand is highest and imports supplement domestic supply. Consumers would benefit from the
additional supply of fresh lemons. Importers and distributors of fresh lemons from Argentina would
also benefit from the new business opportunities, although lemon imports from Argentina may
result in increased competition and partial displacement of current imports.
Costs
As noted in previous sections, the United States relies on fresh lemon imports to augment
supply, especially during the summer months. Argentina would ship lemons during this off-
season when demand is high and U.S. production is low. The extent to which imports from
Argentina would result in greater competition for U.S. producers and for current foreign
suppliers would depend on several factors including the relative prices and the quantities
shipped. Welfare losses for U.S. producers, as shown in tables 8 and 9, may range between $11
million and $22 million due to annual imports of 18,000 MT of fresh lemon from Argentina,
depending on the extent to which these imports displace fresh lemon imports from other
countries.
Reasons Action is Being Considered
Argentina has requested access of commercial shipments of fresh lemon into the
continental United States. APHIS has determined that the current prohibition on imports of fresh
lemon from Argentina is unnecessary because the pest risks posed to U.S. agriculture can be
13
successfully mitigated using a systems approach prescribed in APHIS’ risk management
document for this proposed rule.
Objectives of and Legal Basis for the Rule
The objective of the proposed rule is to allow the importation of fresh lemon into the
continental United States from Argentina. The proposed rule would amend the current
regulations found in Title 7 § 319.56 of the Code of Federal Regulations that set phytosanitary
requirements for the importation of fruits and vegetables into the United States.
The legal basis for this action is the Plant Protection Act (7 U.S.C. 7701-7772), which
authorizes the Secretary of Agriculture to prohibit or restrict the importation of any plant product
if the Secretary determines that the prohibition or restriction is necessary to prevent the
introduction of a plant pest or noxious weed into the United States. The proposed rule is part of
a continuing program to allow the importation of foreign agricultural products that APHIS has
determined are without significant risk of introducing pests or diseases into the United States, if
appropriate mitigation measures are applied.
Potentially Affected Small Entities
The entities potentially affected by the rule would be primarily U.S. producers of fresh
lemon. Other stakeholders that may be affected include industries that support the production
and distribution of fresh lemon in the United States, and importers of fresh lemon.
More specifically, entities potentially affected by the rule are classified within the
following industries, according to the North American Industry Classification System (NAICS):
Citrus Groves (except orange groves) (NAICS 111320), (Postharvest Crop Activities (except
cotton ginning) (NAICS 115114), Fresh Fruit and Vegetable Merchant Wholesalers (NAICS
424480), Pesticide and Other Agricultural Chemical Manufacturing (NAICS 325320), Farm
14
Product Warehousing and Storage (NAICS 493130), Nursery and Tree Production (NAICS
111421), Fruit and Vegetable Markets (NAICS 445230), Packing and Crating (NAICS 488991),
General Freight Trucking, local (NAICS 484110), and Wood Container and Pallet
Manufacturing (NAICS 321920).
According to 2012 Census of Agriculture, there were a total of 3,007 lemon farms in the
United States in 2012, up from 2,607 in 2007.10 In the same year, a total of 2,839 farms
produced citrus other than oranges as their primary product and were thus classified as Citrus
Groves (except orange groves) (NAICS 111320).11 Establishments classified within NAICS
11320 are considered to be small by the SBA standard of annual sales of not more than
$750,000. The average market value of crops sold by non-orange citrus groves in 2012 was
about $223,000, which is well below the small-entity standard.
Establishments classified within Postharvest Crop Activities (except cotton ginning)
(NAICS 115114) are considered to be small by the SBA standard of annual sales of not more
than $27.5 million. This industry comprises establishments primarily engaged in performing
services on crops subsequent to their harvest to prepare them for market or further processing,
such as crop cleaning, sun drying, shelling, fumigating, curing, sorting, grading, packing, and
cooling. The percentage of establishments that meet the SBA standard is not known; neither the
Census of Agriculture nor the Economic Census reports revenue for these establishments.
However, we note that available information on packinghouses indicates these entities are
10 The number of citrus farms in the United States, as reported by the 2012 Census of Agriculture, includes operations that produced citrus for processing as well as fresh utilization. 11The reported number of lemon farms exceeds the number of operations classified within NAICS 111320 because some lemon growers produce oranges or other citrus as their primary crop.

15
predominantly small. In 2010, there were 74 packinghouses in California.12 Approximately 60
percent of these packinghouses market the final product through cooperatives such as Sunkist
Growers, Inc., the Central California Orange Growers Cooperative, and DNE World Fruit
Sales.13 The remaining packinghouses market their final product independently.
Establishments classified within Fresh Fruit and Vegetable Merchant Wholesalers
(NAICS 424480) are considered to be small by the SBA standard of not more than 100
employees. According to the 2012 Economic Census, there were 4,854 fresh fruit and vegetable
merchant wholesalers in the United States with a total of 101,854 paid employees, for an average
of 21 employees per business. It is likely that domestic fruit merchant wholesalers that may be
affected by the rule are predominantly, if not entirely, small entities.
Establishments classified within Pesticide and Other Agricultural Chemical
Manufacturing (NAICS 325320) are considered to be small by the SBA standard of not more
than 500 employees. According to the 2012 Economic Census, there were 210 pesticide and
other agricultural chemical manufacturers in the United States with a total of 10,075 paid
employees. Of these 210 manufacturers, about 87 percent employed fewer than 100 people.
Establishments classified within Farm Product Warehousing and Storage (NAICS
493130) are considered to be small by the SBA standard of annual sales of not more than $25.5
million. While complete data from the 2012 Economic Census is not yet available for this
industry category, the 2007 Economic Census reports that there were 713 establishments, with
about 48 percent reporting sales revenue of less than $25.5 million.
12 California Citrus Mutual Report to the CDFA Board- June 30, 2010. Bob Blakely, Director of Industry Relations. <http://www.californiacitrusmutual.com/pdf/CDFA_Board_Report_6302010.pdf > Retrieved on: September 9, 2011. 13 United States International Trade Commission (USITC), “Conditions of Competition for Certain Oranges and Lemons in the U.S. Fresh Market, Inv 332-469,” Publication 3863, Washington, D.C., July 2006.

16
Fruit and Vegetable Markets (NAICS 445230) are considered to be small by the SBA
standard of annual sales of not more than $7.0 million. According to the 2007 Economic Census,
there were 3,314 fruit and vegetable market establishments in this category, and more than 92
percent had annual sales of less than $5 million.
Nursery and Tree Production establishments (NAICS 111421) are considered to be small
by the SBA standard of annual sales of not more than $750,000. According to the 2012
Economic Census, there were 32,048 of these operations having average sales revenue of about
$221,000. Virtually all Nursery and Tree Production establishments are small entities.14
Establishments in Packing and Crating (NAICS 488991) are considered to be small by
the SBA standard of annual sales of not more than $25.5 million. According to the 2012
Economic Census, there were 1,432 packing and crating establishments in the United States with
a total of 21,475 employees. Of these 1,432 establishments, approximately 93 percent reported
revenues of less than $25 million.
Establishments in General Freight Trucking, local (NAICS 484110) are considered to be
small by the SBA standard of annual sales of not more than $27.5 million. According to the
2012 Economic Census, there were 28,595 local general freight trucking establishments in the
United States in 2012. Approximately 95 percent of these establishments reported revenues of
less than $25 million.
Establishments classified within Wood Container and Pallet Manufacturing (NAICS
321920) are considered to be small by the SBA standard of not more than 500 employees.
According to the 2012 Economic Census, there were 2,666 wood container and pallet
manufacturers in the United States with a total of 49,155 paid employees. Of the 2,666 wood
14 U.S. 2007 Agriculture Census table 37 http://www.agcensus.usda.gov/Publications/2007/Full_Report/Volume_1,_Chapter_1_US/
17
container and pallet manufacturers, 99.9 percent of the establishments in this category employed
fewer than 500 people.
Projected Reporting, Recordkeeping, and Other Compliance Requirements
Reporting and recordkeeping requirements associated with the proposed rule are
discussed in the rule under the heading "Paperwork Reduction Act."
Duplication, Overlap, or Conflict with Existing Rules and Regulations
APHIS has not identified any duplication, overlap, or conflict of the proposed rule with
other Federal rules.
Alternatives to minimize Significant Economic Impacts of the Rule
APHIS does not expect the proposed rule to have a significant economic impact on small
entities. We have prepared this initial regulatory flexibility analysis because our understanding
of possible economic effects of the rule on small entities may be incomplete. In the absence of
apparent significant economic impacts, we have not identified alternatives that would minimize
such impacts.
18
References
Census of Agriculture, 2007, http://www.agcensus.usda.gov/Publications/2007/Full_Report/index.asp Census of Agriculture, 2012, http://www.agcensus.usda.gov/Publications/2012/ Census Bureau, 2007, County Business Patterns and 2007 Economic Census. 2007 Annual Tabulations , http://www.census.gov/econ/susb/data/susb2007.html Economic Census, 2012, County and Business Patterns (CBP) data. http://www.census.gov/econ/cbp/index.html Economic Research Service, Fruit and Tree Nuts, Data by Commodity, Lemons: http://ers.usda.gov/data-products/fruit-and-tree-nut-data/data-by-commodity-imports-and-exports.aspx?reportPath=/TradeR3/TradeTables&programArea=fruit&stat_year=2009&top=5&HardCopy=True&RowsPerPage=25&groupName=Citrus&commodityName=Lemons#Pd51210d4e46b416ab9d065403c0c69c1_2_292 Small Business Administration. A Guide for Government Agencies How to Comply with the Regulatory Flexibility Act. http://www.sba.gov/advo/laws/regflex.html Small Business Administration. Small Business Standard Match to North American Industry Classification System http://www.sba.gov/size/sizetable2002.html