lenslet array to further suppress star light for direct
TRANSCRIPT
Updated 5/15/2016
Lenslet Array to Further Suppress Star Light for Direct Exoplanet
Detection
Qian Gong*a, Michael McElwaina, Ron Shiria
aNASA Goddard Space Flight Center, 8800 Greenbelt Road, Greenbelt, MD, USA 20771
ABSTRACT
Direct imaging plays a key role in the detection and characterization of exoplanets orbiting within its host star’s
habitable zone. Many innovative ideas for starlight suppression and wavefront control have been proposed and
developed over the past decade. However, several technological challenges still lie ahead to achieve the required
contrast, including controlling the observatory pointing performance, fabricating occulting masks with tight optical
tolerances, developing wavefront control algorithms, controlling stray light, advancing single photon detecting detectors,
and integrated system-level issues. This paper explores how a lenslet array and pinhole mask may be implemented to
further suppress uncorrected starlight that leaks through the occulting mask. An external occulter, or star shade, is
simulated to demonstrate this concept, although this approach can be implemented for internal coronagraphs as well.
We describe how to use simple relay optics to control the scene near the inner working angle and the level of the
suppression expected. Furthermore, if the lenslet array is the input to an integral field spectrograph, as planned for the
WFIRST mission, the spectral content of the exoplanet atmospheres can be obtained to determine if the observed planet
is habitable and ultimately, if it is inhabited.
Keywords: Integral field spectrometer, lenslet array, coronagraph, pinhole mask
1. INTRODUCTION
Nearly 2000 exoplanets have been discovered to date1, mostly found by precise monitoring of the host star with the transit1
or radial velocity technique2. The development of new technologies for exoplanet detection and characterization has
advanced rapidly over the previous decade3, but to date, only a handful of exoplanets have been imaged directly4-8. These
exoplanets have been imaged by their thermal emission at wide separations, which are shown to be rare9. However, to
meet the scientific interest in the search for extraterrestrial life, reflected light spectroscopy in the visible is critical to
determine planetary habitability. A lenslet array based integral field spectrometer (IFS) is an ideal choice for this task due
to its ability to simultaneously obtain spatial and spectral content10-12.
In this paper, we describe how to use the lenslet based IFS in an innovative way so that it not only provides the spectrum
of the exoplanet, but also further suppresses the star light. This method aims at further suppressing the residual star light
not blocked by a stellar occulter, either external, called starshades, or internal, called coronagraphs. The key element of
this invention uses a pinhole mask at the focal plane of the lenslet array. The pinhole mask was originally proposed to
reduce the diffracted light created by each square lenslet13. However, it can be used to further suppress star light by
combining a specialized optical design with the pinhole layout. It is noted that this approach can be applied to most star
light suppression architectures proposed to date, including the baselined and back-up coronagraphs on WFIRST (e.g.,
Hybrid-Lyot Coronagraph (HLC), Shaped Pupil Coronagraph (SPC), and Phase Induced Amplitude Apodization (PIAA),
respectively14-16 and a formation-flying starshade17.
In this paper, we use the starshade starlight suppression approach as an example to discuss the theory, design, and analysis
of this Speckle Suppression IFS (SSIFS). The limitation of this approach at the inner working angle is described in
Section 3.4. As mentioned above, in general it can work with any coronagraph algorithm.
*[email protected]; phone 1 301 296-1490; fax 1 301-286-7230
2. THEORY
The theory relies on two important parts: 1) The stellar and exoplanet phase front (wavefront) versus the field positions
at the IFS object plane where the coronagraph image passes through the relay optics. 2) A specialized design of relay
optics makes the chief ray angles in the exoplanet field different at the spatial locations at the lenslet array.
A high contrast lenslet-based IFS has been baselined for both the WFIRST and IFS missions, and this instrument design
will be validated as part of the WFIRST technology development program using the PISCES instrument18-19. In the
lenslet based IFS design, the size of each lenslet is generally much larger than the detector pixel size in order to provide
enough space on the detector to interleave the spectra. Therefore, relay optics are necessary to magnify the astrophysical
scene at the lenslet array. The combination of the relay optics design and the pinhole mask at the focal plane of lenslet
array provides the optical architecture to take advantage of additional starlight suppression with the IFS, a SSIFS.
There has been more than a decade of technology development centered on investigating the intensity of the star at the
coronagraph image plane. However, the phase front information at that image plane has been largely neglected. It is
true that without the lenslet IFS, the phase front will not provide any means of increasing the coronagraph contrast.
With the existence of the SSIFS, the phase front becomes a powerful tool to further suppress starlight. This is because
such a system can be designed to separate the chief ray angles of the exo-planet field from the residual starlight. From
an optical point of view, each lenslet is an independent optical element that follows the ray tracing path to the formation
of point spread function at the lenslet surface. The shape of the formed PSF at a lenslet focal plane is dependent on the
phase front of the incoming beam on that specific lenslet. From the spectrograph’s point of view, each lenslet is an
independent channel to provide a spectrum at the FOV of that particular lenslet. The phase front of the residual starlight
is fixed as long as the coronagraph masks are designed. The relay optics design offers the freedom to manipulate the
phase front distribution to differentiate the phase front from the residual star. The relay optics can be designed to any
telecentricity: from telecentric to very non-telecentric.
2.1 Starshade Coronagraph Model
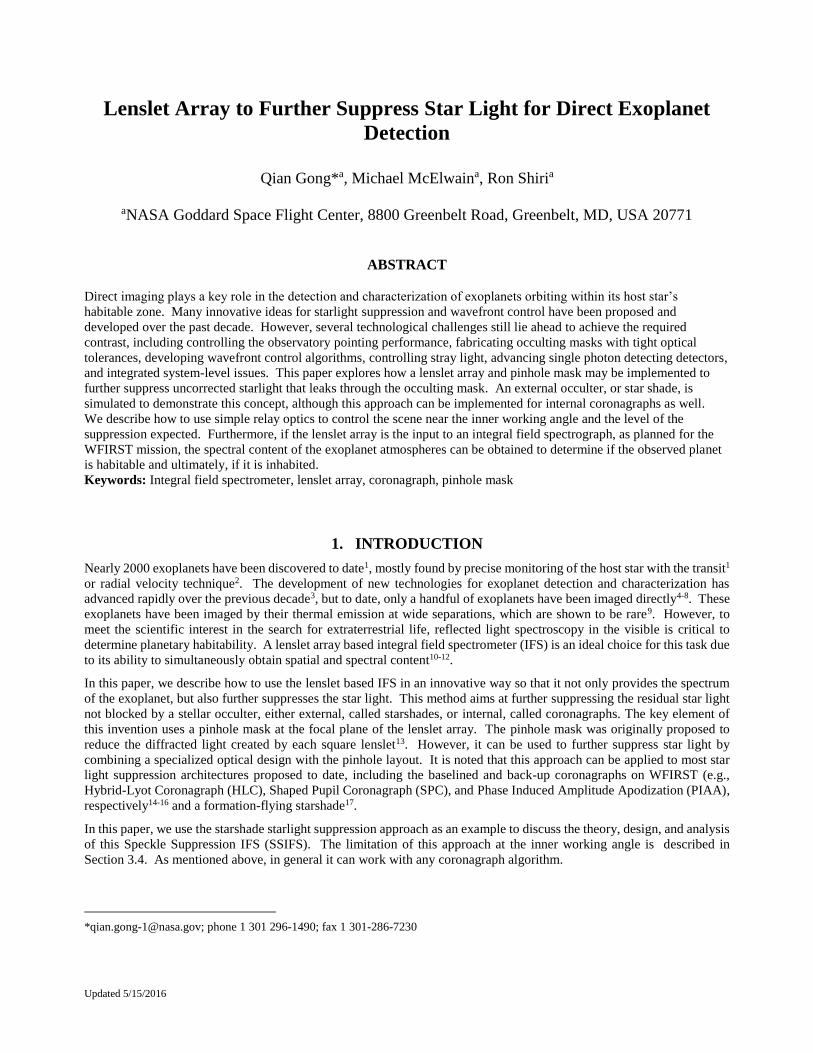
A starshade is used to prove the theory. The coronagraph part of the model is shown in Figure 1. Figure 1. The
starshade coronagraph model used to prove the concept. The IFS lenslet array is located at the image plane of the
coronagraph relay optics.
Figure 2. The starshade coronagraph model used to prove the concept. The IFS lenslet array is located at the image plane of
the telescope relay optics.
The parameter for modeling the starshade starlight suppression efficiency is shown in the Table 1. The starlight is modeled
by a collimated beam using a 81928192 grid to cover a 80 m x 80 m area. A typical 16-petal starshade occulter is place
at 78000km in front of the coronagraph telescope. The diameter of the occulter is 50 meters. The wavelength is 550nm.
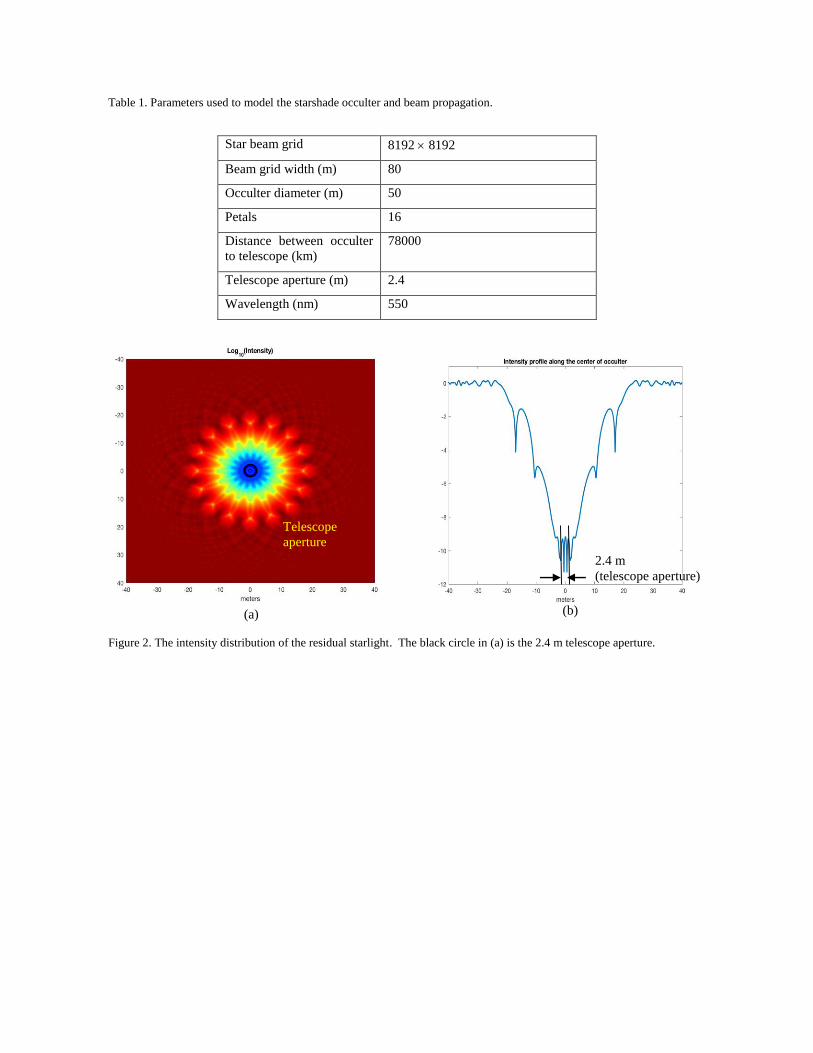
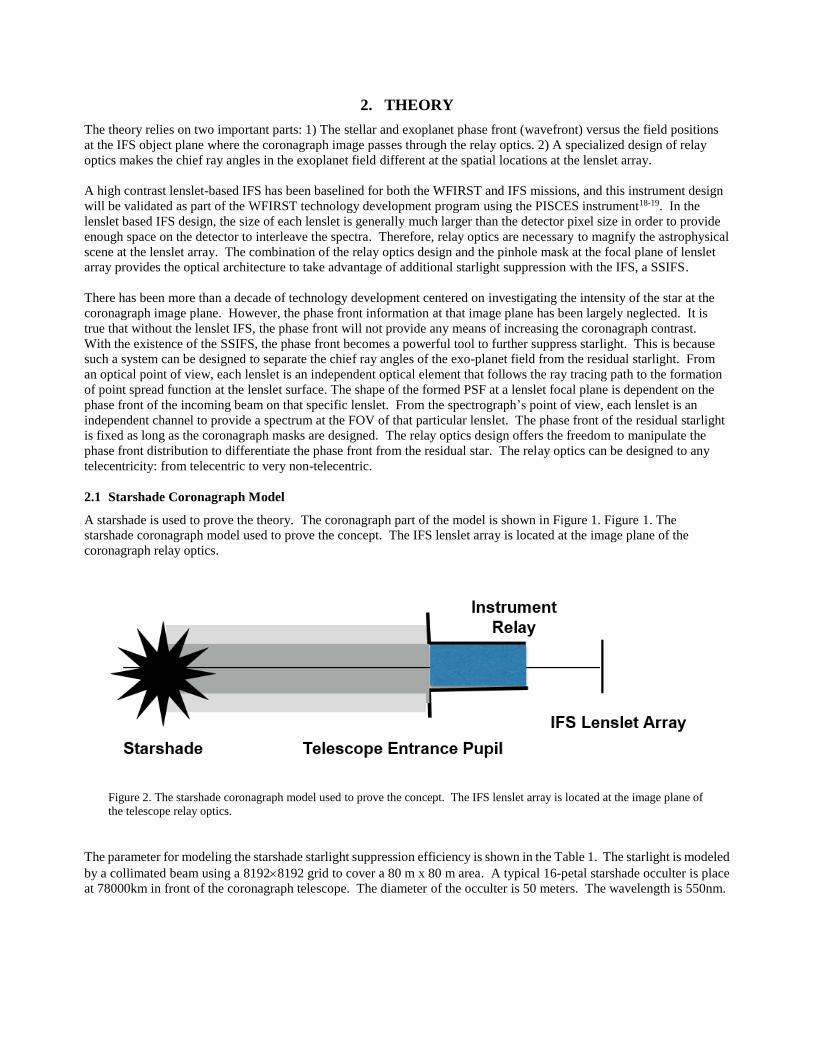
Table 1. Parameters used to model the starshade occulter and beam propagation.
Star beam grid 8192 8192
Beam grid width (m) 80
Occulter diameter (m) 50
Petals 16
Distance between occulter
to telescope (km)
78000
Telescope aperture (m) 2.4
Wavelength (nm) 550
Figure 2. The intensity distribution of the residual starlight. The black circle in (a) is the 2.4 m telescope aperture.
2.4 m
(telescope aperture)
Telescope
aperture
(a) (b)

Figure 3. The unwrapped phase distribution of the residual starlight. The black circle in (a) is the 2.4 m telescope aperture.
Figure 2 shows the beam intensity at the telescope pupil. Figure 2 (a) is a 2D intensity map, and (b) is the cross cut along
the center of the occulter. The aperture of the telescope is only 2.4 m. Figure (b) shows that the starlight that passes
through the telescope aperture has compressed to less than 10-9. Figure 3 shows the phase of the same beam.
2.2 Phase Front at Coronagraph Image Plane
The beam at the telescope aperture, expressed by a complex array, is the light from the shadow of the starshade. From
this point forward, the beam as input to the lenslet array is modeled with a Fourier Transform diffraction model using the
GLAD software20. For convenience, some parameters from our previous PISCES relay optics design19 is used: the f/# at
the lenslet is 870. There is no coronagraphic mask applied to this model. Figure 4 (a) shows the Point Spread Function
(PSF) of the starlight with the external occulter in place, while Figure 4 (b) shows the normal PSF without occulter. Two
propagations use exactly same parameters: the same wavelength, beam intensity before the occulter, and the same optical
system. The PSF structure is similar in the occulted and non-occulted scenes, but the intensities on average are
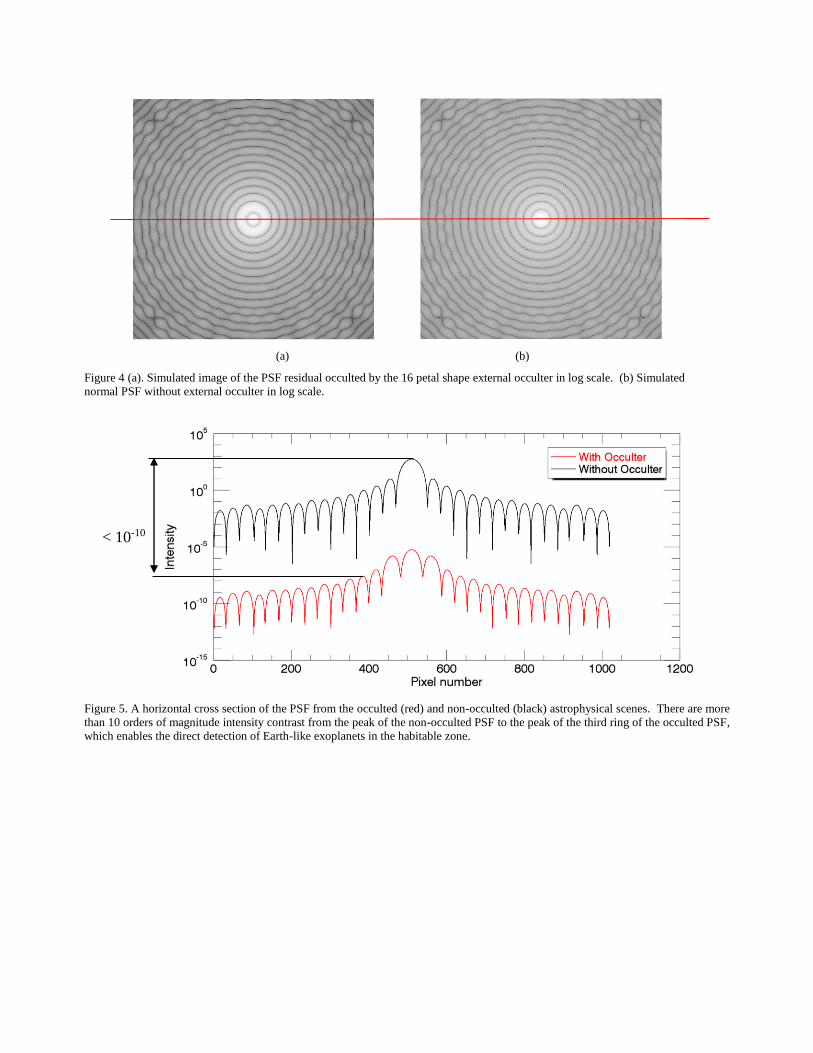
approximately 7 orders of magnitude different between the two PSFs. Figure 5 shows the horizontal cut cross sections of
the PSFs marked with the red line in Figure 4. The PSF does have subtle changes, however, such as the core size of the
occulted PSF becomes smaller while the first diffraction ring becomes wider. After the third ring, all rings aligned well
for the both PSFs. Figure 5 indicates that with an perfect starshade, the contrast of the third ring in the occulted PSF is
already more than 10-10, that is 10 orders of magnitude contrast is achieved at less than 3λ/D, and 10-9 at less than 2λ/D.
This contrast would enable the direct detection and characterization of Earth-like planets in the habitable zone21. However,
in reality, there are extremely tight tolerances on the shape of starshade and its alignment relative to the target star and the
telescope assembly. The lenslet array and pinhole mask combination can ease the tolerance requirements on the starshade
making its deployment and external profile less challenging.
(a) (b)
Telescope
aperture
(a) (b)
Figure 4 (a). Simulated image of the PSF residual occulted by the 16 petal shape external occulter in log scale. (b) Simulated
normal PSF without external occulter in log scale.
Figure 5. A horizontal cross section of the PSF from the occulted (red) and non-occulted (black) astrophysical scenes. There are more
than 10 orders of magnitude intensity contrast from the peak of the non-occulted PSF to the peak of the third ring of the occulted PSF,
which enables the direct detection of Earth-like exoplanets in the habitable zone.
< 10-10

Figure 6. A horizontal cross section of occulted and non-occulted phase (wavefront). Both curves have a similar overall shape.
The phase distribution of Figure 6 indicates the following facts:
1. The phase variation versus λ/D for both cases is very similar.
2. The phase period of the occulted PSF is not exactly the same as non-occulted, but the periodic behavior is similar
with a switch at the dark rings.
3. The phase is fairly flat in the entire FOV (half is 15λ/D), which is the most important field of regard for direct
detection of exoplanet observations. Please note that the phase variation in the entire FOV is less than , if the
jump is ignored. The jump is due to the amplitude change the sign from positive to negative or vice versa. That
means the phase variation across the entire lenslet array is less than a half wave and can be treated as a flat phase
front for separating starlight and planet light with a difference in incident angle.
The third item is the most critical information for designing pinhole mask to further suppressing the residual starlight. The
details regarding how to use the phase difference in order to suppress leaked starlight is described in the following section.
2.3 Starlight Suppression by a Lenslet Array and Pinhole Mask Combination
The lateral position of the PSF at the lenslet focus follows ray trace rule being determined by the chief ray angle for the
portion of the beam on each lenslet: dis = f*tan(θ), where dis is the distance from lenslet axis to PSF in lenslet focal plane,
f is the lenslet effective focal length, and θ is the chief ray angle of an off-axis exoplanet. This is true for both starlight
and planet light. The nearly flat wavefront of the residual starlight guarantees its PSF is on the axis of every lenslet.
Therefore, if we design a largely non-telecentric relay optics that makes the chief ray angle of an off-axis exoplanet a
function of the angle from on-axis, then the PSF formed by the star residual with a near normal incident angle and that of
the exoplanet with a tilted incident angle will be separated and displaced in the lenslet focal plane. This enable us to design
a pinhole mask in such a way that only the light from exoplanet could pass through the pinholes.
Figure 7 shows the principle of a lenslet and pinhole mask working together to increase starlight suppression. The power
of each lenslet is introduced by the radius of curvature on the front surface of the lenslet array substrate, typically fused
silica. The thickness of the substrate is designed in such a way that the focal plane of each lenslet is on the back surface
of the substrate. Therefore, a pinhole mask can be easily applied onto the back surface18-19,22. This not only simplifies the
mask fabrication and reduces positional errors, but also increase the stability that is critical for not vignetting the desired
beam.
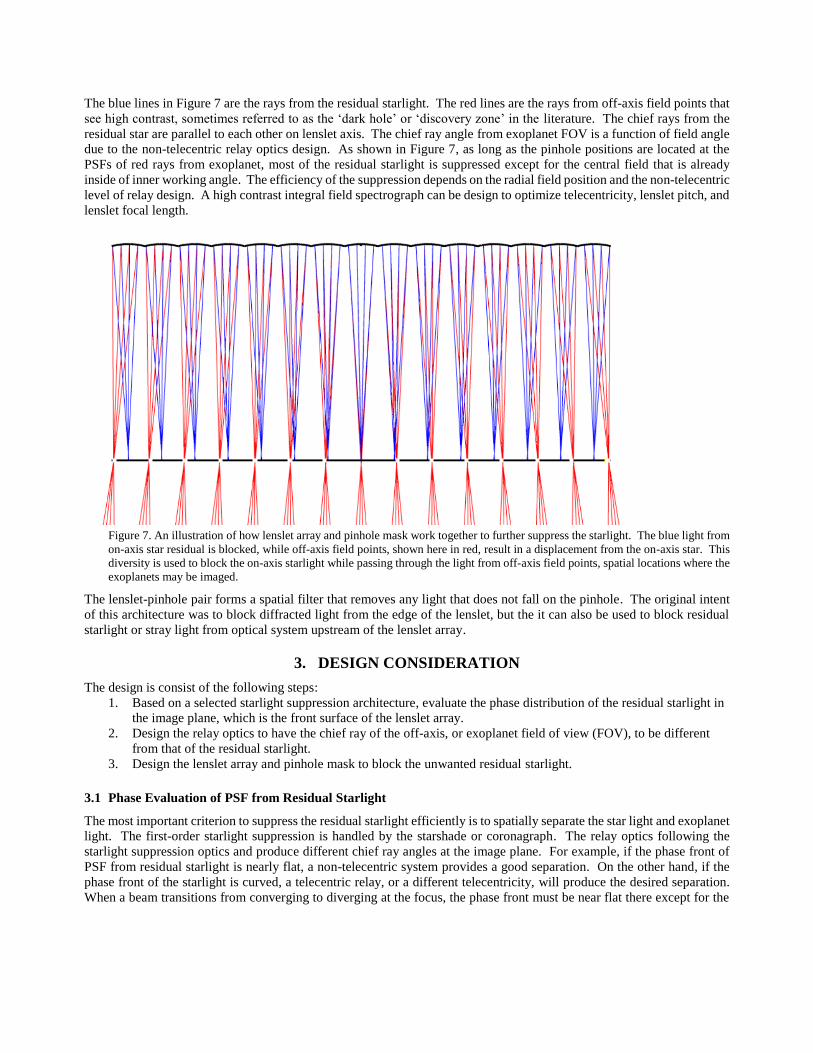
The blue lines in Figure 7 are the rays from the residual starlight. The red lines are the rays from off-axis field points that
see high contrast, sometimes referred to as the ‘dark hole’ or ‘discovery zone’ in the literature. The chief rays from the
residual star are parallel to each other on lenslet axis. The chief ray angle from exoplanet FOV is a function of field angle
due to the non-telecentric relay optics design. As shown in Figure 7, as long as the pinhole positions are located at the
PSFs of red rays from exoplanet, most of the residual starlight is suppressed except for the central field that is already
inside of inner working angle. The efficiency of the suppression depends on the radial field position and the non-telecentric
level of relay design. A high contrast integral field spectrograph can be design to optimize telecentricity, lenslet pitch, and
lenslet focal length.
Figure 7. An illustration of how lenslet array and pinhole mask work together to further suppress the starlight. The blue light from
on-axis star residual is blocked, while off-axis field points, shown here in red, result in a displacement from the on-axis star. This
diversity is used to block the on-axis starlight while passing through the light from off-axis field points, spatial locations where the
exoplanets may be imaged.
The lenslet-pinhole pair forms a spatial filter that removes any light that does not fall on the pinhole. The original intent
of this architecture was to block diffracted light from the edge of the lenslet, but the it can also be used to block residual
starlight or stray light from optical system upstream of the lenslet array.
3. DESIGN CONSIDERATION
The design is consist of the following steps:
1. Based on a selected starlight suppression architecture, evaluate the phase distribution of the residual starlight in
the image plane, which is the front surface of the lenslet array.
2. Design the relay optics to have the chief ray of the off-axis, or exoplanet field of view (FOV), to be different
from that of the residual starlight.
3. Design the lenslet array and pinhole mask to block the unwanted residual starlight.
3.1 Phase Evaluation of PSF from Residual Starlight
The most important criterion to suppress the residual starlight efficiently is to spatially separate the star light and exoplanet
light. The first-order starlight suppression is handled by the starshade or coronagraph. The relay optics following the
starlight suppression optics and produce different chief ray angles at the image plane. For example, if the phase front of
PSF from residual starlight is nearly flat, a non-telecentric system provides a good separation. On the other hand, if the
phase front of the starlight is curved, a telecentric relay, or a different telecentricity, will produce the desired separation.
When a beam transitions from converging to diverging at the focus, the phase front must be near flat there except for the

jump due to edge diffraction at the pupil. Generally speaking, if the entrance pupil of an optical system is at the front
focal plane, an exact flat phase front can be obtained assuming the jump is ignored.
The phase evaluation in the focal plane can be simulated with commercially available software. The most popular ones
are Fourier transform based (e.g., GLAD) or Gaussian beamlet based (e.g., ASAP) propagation methods. The analysis
presented here uses the Fourier transform based propagation. It has to be emphasized that the phase front or wavefront
mentioned here is not the wavefront at the pupil. It is the wavefront at the focal plane of the relay optics, which is where
a lenslet array is placed for a lenslet-based integral field spectrograph. This is different from traditional optics designs that
tend to naturally relate the wavefront to the pupil rather than the focal plane.
3.2 Relay Optical Design and Image Space Telecentricity
The relay optical design is based on the phase front of the beam at the focus, with the goal of separating the off-axis
exoplanet light from the residual on-axis starlight. The key for separating chief rays is to control the level of telecentricity
in the relay image space. It is known that when the stop is located at the front focal plane of a focal system, the exit pupil
is at infinity, and the system is image-space telecentric. Figure 8 illustrates the relation between pupil (stop) location and
image space telecentricity for a collimated object space.
Figure 8. Illustration of the relationship between the pupil (or pupil image) position and image space telecentricity. The black
dots indicate the front and back focal planes of the relay system. The thicker lines present the chief rays of each field. (a) Pupil is
before the front focal plane; (b) Pupil is at the front focal plane (producing a telecentric beam at the image plane); (c) Pupil is at
the lens (or principle plane); (d) Pupil is after lens and before the back focal plane.
Pupil
Pupil
Pupil
Pupil
It is seen in Figure 8 that the chief ray angles in the image space is controlled by the pupil position. When the pupil is
located before the front focal plane, the chief ray bundle converges towards the image plane as shown in Figure 8 (a). In
Figure 8 (b), the pupil located in the front focal plane. The chief rays are parallel towards image plane, which produces a
telecentric system. When the pupil moves back from the front focal plane, the chief ray bundle starts diverge in the image
space. As in Figure 8 (c), the pupil is located at the lens, a diverged chief ray bundle is towards the image plane. When
the pupil moves behind the lens, the chief ray bundle becomes more divergent. In Figure 8 (d), an even greater divergent
chief ray bundle is obtained.
With the knowledge of phase front of residual starlight and knowing how to manipulate pupil location to obtain desired
chief ray bundle telecentricity, a relay optical system is ready to be designed to further suppress the starlight and increase
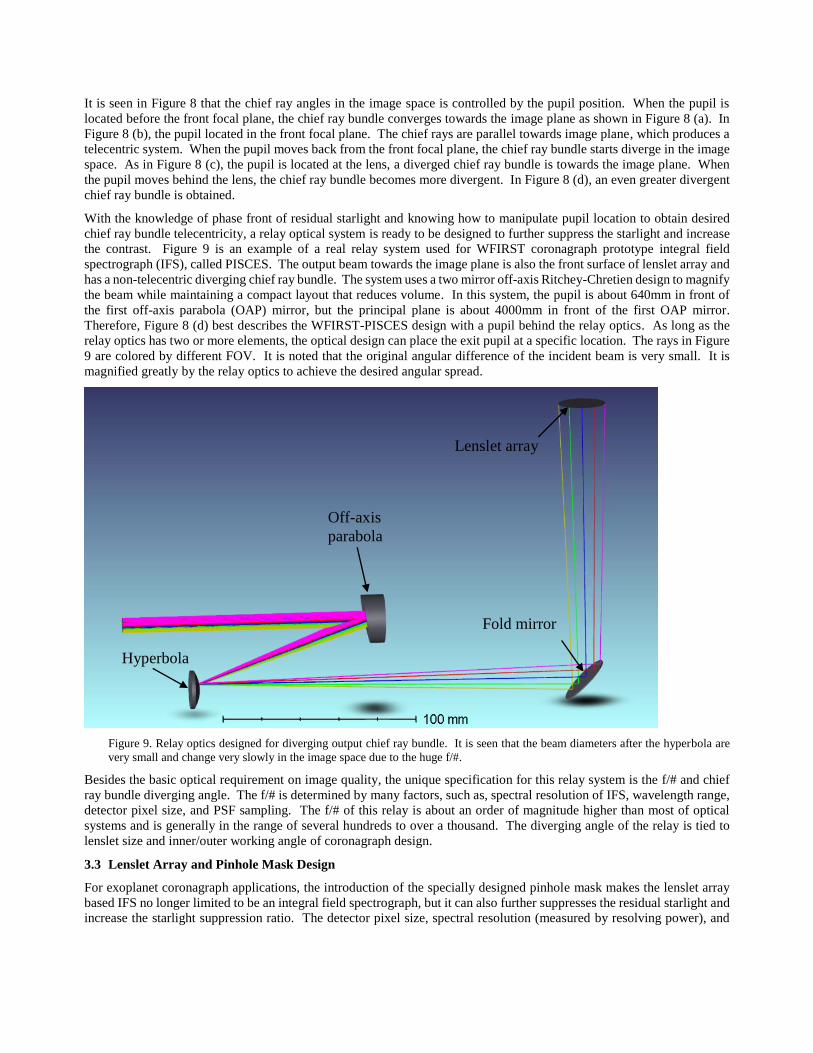
the contrast. Figure 9 is an example of a real relay system used for WFIRST coronagraph prototype integral field
spectrograph (IFS), called PISCES. The output beam towards the image plane is also the front surface of lenslet array and
has a non-telecentric diverging chief ray bundle. The system uses a two mirror off-axis Ritchey-Chretien design to magnify
the beam while maintaining a compact layout that reduces volume. In this system, the pupil is about 640mm in front of
the first off-axis parabola (OAP) mirror, but the principal plane is about 4000mm in front of the first OAP mirror.
Therefore, Figure 8 (d) best describes the WFIRST-PISCES design with a pupil behind the relay optics. As long as the
relay optics has two or more elements, the optical design can place the exit pupil at a specific location. The rays in Figure
9 are colored by different FOV. It is noted that the original angular difference of the incident beam is very small. It is
magnified greatly by the relay optics to achieve the desired angular spread.
Figure 9. Relay optics designed for diverging output chief ray bundle. It is seen that the beam diameters after the hyperbola are
very small and change very slowly in the image space due to the huge f/#.
Besides the basic optical requirement on image quality, the unique specification for this relay system is the f/# and chief
ray bundle diverging angle. The f/# is determined by many factors, such as, spectral resolution of IFS, wavelength range,
detector pixel size, and PSF sampling. The f/# of this relay is about an order of magnitude higher than most of optical
systems and is generally in the range of several hundreds to over a thousand. The diverging angle of the relay is tied to
lenslet size and inner/outer working angle of coronagraph design.
3.3 Lenslet Array and Pinhole Mask Design
For exoplanet coronagraph applications, the introduction of the specially designed pinhole mask makes the lenslet array
based IFS no longer limited to be an integral field spectrograph, but it can also further suppresses the residual starlight and
increase the starlight suppression ratio. The detector pixel size, spectral resolution (measured by resolving power), and
Off-axis
parabola
Hyperbola
Fold mirror
Lenslet array

FOV (measured by λ/D) set constraints that should be optimized first. The spectral resolution and detector pixel size,
coupled with the spectral spacing on the detector rows (row) and in pixels (pixel) (see Figure 10) also need to be considered
for determining the lenslet size. For simplicity, a square lenslet is used in this paper, which was chosen following a trade
study for the PISCES instrument. In principle, hexagonal, triangular, or other geometric shapes can be used for the lenslet
array. The f/# of the output beam from the lenslet array is another important parameter, which is very different from the
huge relay f/# . To avoid confusion, an italic ‘f’ is used for lenslet focus. From the IFS image point of view, each lenslet
is equivalent to a detector pixel in spectrograph systems that introduce no magnification. For spectral resolution, each
detector pixel is used to determine lenslet size. In order to control the spectral resolution and cross talk between spectral
traces, the f/# out of lenslet is usually somewhere between 4 – 16 depending upon the detector pixel size and sampling.
The lenslet size calculation works from the detector in the following steps:
1. Calculate the length of spectral traces L in pixels using the specified resolving power.
2. Define the row separation row and pixel separation pixel based on application’s cross talk requirement.
3. Calculate lenslet size (ll) to make sure there is enough space to lay the spectra without overlapping. The detailed
calculation is beyond the scope of this paper, interesting readers could get the information from23. But the rule
of thumb is the total number of detector pixel has to be more than (L+ pixel) row, that means, the lenslet size,
assuming 1:1 magnification from lenslet focus to detector chip, is more than rowpixelpix L )( in
width. The pix is the physical detector pixel size.
4. The lenslet array size, that is, how many lenslets on the array, is determined by outer FOV (half) n*λ/D, where n
is an integer number. If the sampling is 3 lenslets per λ/D, the total lenslet number in a row or column is 6n.
Because the lenslet array is clocked relative to detector, so additional lenslets need to be included. The number
of additional lenslets depends on the clocking angle θ.
5. Finally, the lenslet longitudinal design. The effective focal length of each lenslet array is the product of lenslet
size (ll) and the f /#. In order to integrate pinhole mask to the lenslet array, the focal plane of the lenslet is
designed on the back surface of lenslet array in Figure 11.
Figure 10. The IFS output is designed such that the spectra from lenslets are well separated on the detector. In this cartoon, the
Cartesian grid represents the lenslet array that samples the image plane. The spectral traces are aligned to detector rows, andthe
angle θ indicates the lenslet array rotation relative to detector rows.
row
pixel
θ
ll
Pixel row direction

Figure 11. Single lenslet layout. The substrate of the lenslet is fused silica with the focal plane optimized to the back surface of
the substrate.
After lenslet size is determined, the f/# of the relay output can be easily obtained using the desired sampling for an Airy
disk. For example, if the number of sampling is 3 lenslets per λ/D, then the f/# needs to be:
ll
3/#f with
ll and λ
in same unit. This f/# is an important parameter for relay optics design.
The pinhole mask design is what makes this design innovative. The combination of lenslet and its pinhole act together as
a spatial filter to remove unwanted light. Because the residual starlight presents a near flat phase front, its incident angle
on each lenslet is near normal. From ray trace theory, it focuses on lenslet axis. Conversely, the beam from exoplanet
field has a field dependent angle with an off-axis focus. The offset amount is determined by the incident angle of the field
on each lenslet. Therefore if the pinhole positions follow the offsets, most of the residual starlight will be filtered out,
especially for some application that needs a relative large FOV. The pinhole mask design follows the steps below:
1. Create a table to record the relay optics chief ray angle on each lenslet using any ray trace software.
2. Use the chief ray angle to calculate the PSF offset for every lenslet and create a PSF offset table.
3. Transfer the offset of each lenslet to the global coordinate of the lenslet array. Use the calculated Xi, Yi positions
in global coordinate to create the final pinhole mask position table.
4. Determine the diameter of pinholes. The pinhole size has to be large enough to not vignette the exoplanet light.
So the fabrication tolerance and vibration introduced wavefront drift need to be considered in the design.
3.4 Inner Working Angle and Suppression Efficiency
The suppression efficiency is directly related to the PSF offset from the lenslet axis. Figures 12 and 13 demonstrate the
relation between the two.
Figure 12 is a PSF from residual starlight at the focus of a square lenslet with a f/8 beam from side to side. The lenslet
size is 165 165 µm. The simulated wavelength is 550nm with an equivalent Airy disk diameter 8.8 µm. The pinhole
size is selected as 20 µm in diameter. The colored lines in Figure 12 show the pinhole at different offsets from the lenslet
axis. Only the light in the pinhole area could get through and propagate to the detector chip. The x-axis in the figure is
the distance in µm with the total range of 200 µm, a little larger than the lenslet dimension. The y-axis is the relative
intensity in log scale. It is a typical PSF for a square aperture. It is seen that when the pinhole moves away from the
center, the residual starlight included in the pinhole is getting less and less.
Figure 13 shows the pinhole suppression versus pinhole offset. It is normalized to the maximum output when pinhole is
centered at the lenslet axis. When the offset increases, the amount of starlight leaked out of pinhole decreases. At the
boundary of the lenslet, the additional SSIFS starlight suppression reaches 10-3. Beyond the boundary, the diffraction from
the adjacent lenslet dominates the suppression becomes less efficient. It is obvious that larger lenslet size provides more
efficient suppression at the expense of having a using the detector pixels less efficiently. In this simulation, the lenslet is
Back surface
of lenslet
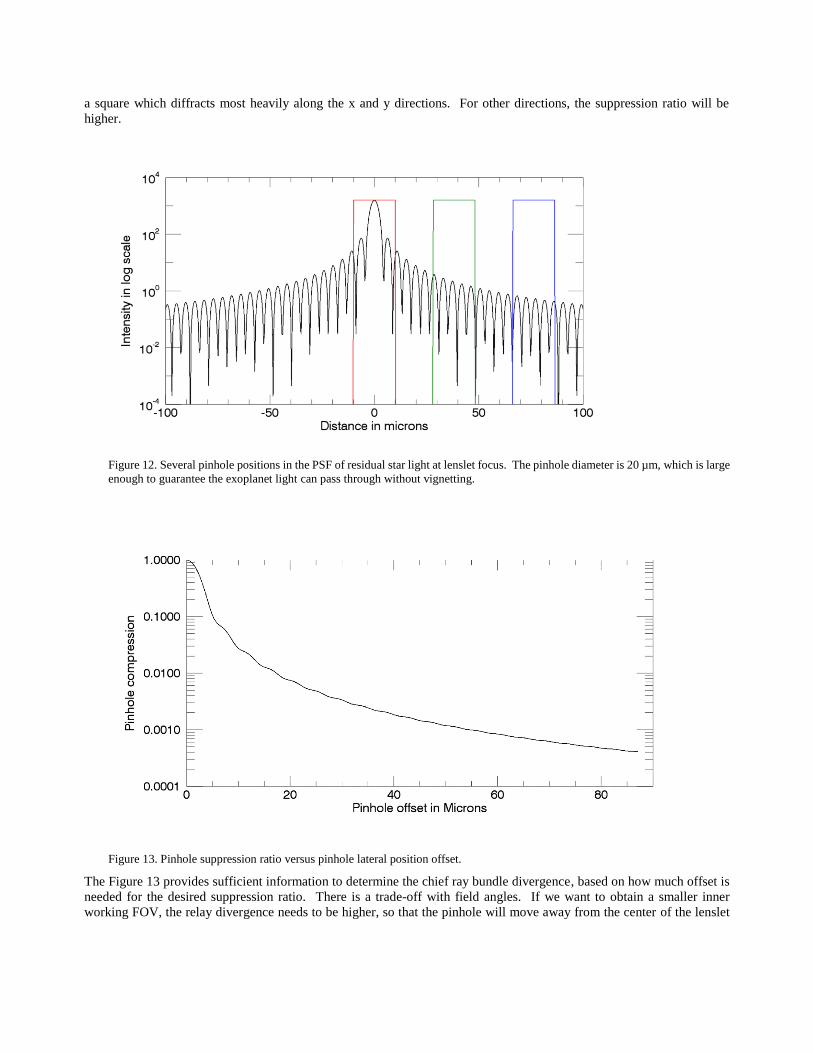
a square which diffracts most heavily along the x and y directions. For other directions, the suppression ratio will be
higher.
Figure 12. Several pinhole positions in the PSF of residual star light at lenslet focus. The pinhole diameter is 20 µm, which is large
enough to guarantee the exoplanet light can pass through without vignetting.
Figure 13. Pinhole suppression ratio versus pinhole lateral position offset.
The Figure 13 provides sufficient information to determine the chief ray bundle divergence, based on how much offset is
needed for the desired suppression ratio. There is a trade-off with field angles. If we want to obtain a smaller inner
working FOV, the relay divergence needs to be higher, so that the pinhole will move away from the center of the lenslet
faster to help smaller λ/D. However, the PSF from the outer exoplanet FOV might cross its own lenslet boundary, as a
consequence the residual starlight may be suppressed less efficiently for outer field. The optimal design depends on the
application.
4. PINHOLE MASK COMPRESSION FOR STARSHADE CASE
4.1 Analysis and Modeling
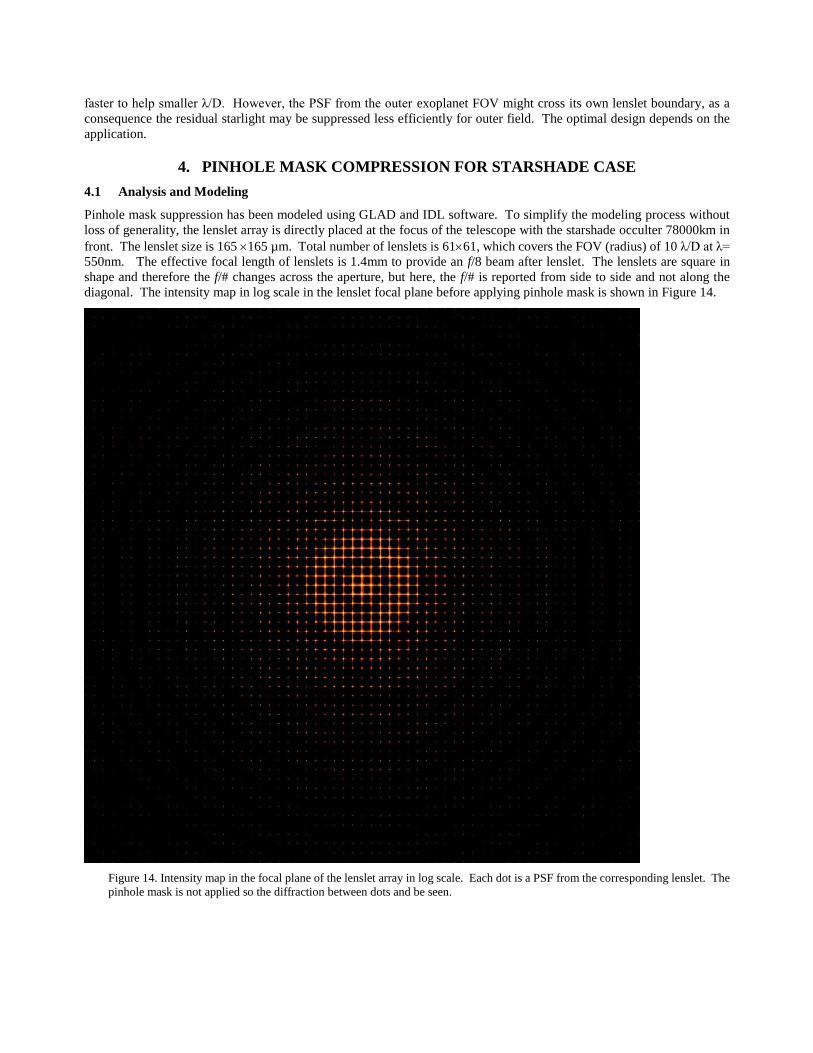
Pinhole mask suppression has been modeled using GLAD and IDL software. To simplify the modeling process without
loss of generality, the lenslet array is directly placed at the focus of the telescope with the starshade occulter 78000km in
front. The lenslet size is 165 165 µm. Total number of lenslets is 6161, which covers the FOV (radius) of 10 λ/D at λ=
550nm. The effective focal length of lenslets is 1.4mm to provide an f/8 beam after lenslet. The lenslets are square in
shape and therefore the f/# changes across the aperture, but here, the f/# is reported from side to side and not along the
diagonal. The intensity map in log scale in the lenslet focal plane before applying pinhole mask is shown in Figure 14.
Figure 14. Intensity map in the focal plane of the lenslet array in log scale. Each dot is a PSF from the corresponding lenslet. The
pinhole mask is not applied so the diffraction between dots and be seen.

The pinhole mask was created using an image processing software IDL. The pinhole size is defined as 20 µm in diameter.
The pinhole positions are obtained using the method described in Section 3.5. For this simulation, the lenslet dimension
is 0.165 0.165 mm. The chief ray angle θ out of relay optics can be expressed as a function of lenslet position r in
polynomial form: θ= 1.04510-4 r3 – 1.05210-3 r2 + 3.44510-1 r +4.14910-4, where r is the distance from the center of
each lenslet to the center of the entire lenslet array in mm (See Figure 15). The delta of each pinhole relative the center
of each lenslet is: xi = f · tan(θ) · xi/ri, and yi = f · tan(θ) · yi/ri. The value of pinhole areas is unit, and the rest is zero.
The created mask is multiplied to the intensity map shown in Figure 14. The final intensity map after the pinhole mask is
shown in Figure 16.
Figure 15. Lenslet array geometry.
c
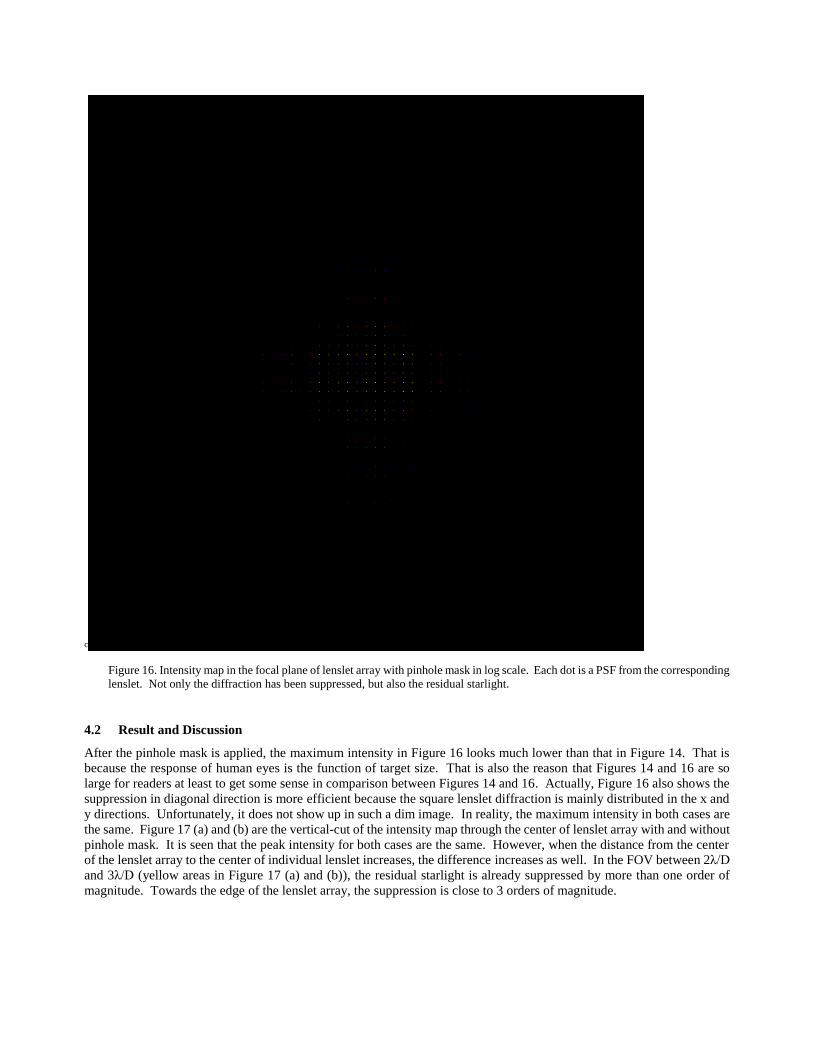
Figure 16. Intensity map in the focal plane of lenslet array with pinhole mask in log scale. Each dot is a PSF from the corresponding
lenslet. Not only the diffraction has been suppressed, but also the residual starlight.
4.2 Result and Discussion
After the pinhole mask is applied, the maximum intensity in Figure 16 looks much lower than that in Figure 14. That is
because the response of human eyes is the function of target size. That is also the reason that Figures 14 and 16 are so
large for readers at least to get some sense in comparison between Figures 14 and 16. Actually, Figure 16 also shows the
suppression in diagonal direction is more efficient because the square lenslet diffraction is mainly distributed in the x and
y directions. Unfortunately, it does not show up in such a dim image. In reality, the maximum intensity in both cases are
the same. Figure 17 (a) and (b) are the vertical-cut of the intensity map through the center of lenslet array with and without
pinhole mask. It is seen that the peak intensity for both cases are the same. However, when the distance from the center
of the lenslet array to the center of individual lenslet increases, the difference increases as well. In the FOV between 2λ/D
and 3λ/D (yellow areas in Figure 17 (a) and (b)), the residual starlight is already suppressed by more than one order of
magnitude. Towards the edge of the lenslet array, the suppression is close to 3 orders of magnitude.

This result shows that with a careful IFS relay design and pinhole mask design, the starlight is further suppressed and the
inner working angle can also be reduced. Furthermore, the lenslet – pinhole combination provides a great degree of
freedom for obtaining the maximum suppression efficiency in the FOV that is most important to the application.
Figure 17. Comparison of the intensity of residual starlight with and without pinhole mask. It is seen that the mask efficiently
suppresses the starlight. It is also seen that the suppression ratio starts from 100 at the center to 10-3 at the edge.
5. CONCLUSION
We have demonstrated that lenslet based IFS is not only capable of detecting the spectrum of exoplanet, but it can also
play a role in further suppressing the residual starlight and increasing the contrast. It is flexible enough to be used with
any existing starlight suppression architecture. The extra suppression provided by lenslet-pinhole combination can also
be used to relax mechanical and pointing tolerances, surface figures, and wavefront control. The lenslet-pinhole innovation
will contribute to a successful exoplanet mission in the near future: the extra 1 – 3 order of magnitude will reduce the
tolerance and cost, while making the mission more scientifically productive.
REFERENCES
[1] W. Borucki, D. G. Koch, G. Basri, N. Batalha, T. M. Brown, S. T. Bryson, D. Caldwell, J. Christensen-Dalsgaard, W.
D. Cochran, E. DeVore, E. W. Dunham, T. N. Gautier III, J. C. Geary, R. Gilliland, A. Gould, S. B. Howell, J. M.
Jenkins, D. W. Latham, J. J. Lissauer, G. W. Marcy, J. Rowe, D. Sasselov, A. Boss, D. Charbonneau, D. Ciardi, L.
Doyle, A. K. Dupree, E. B. Ford, J. Fortney, M. J. Holman, S. Seager, J. H. Steffen, J. Tarter, W. F. Welsh, C. Allen,
L. A. Buchhave, J. L. Christiansen, B. D. Clarke, S. Das, J.-M. Désert, M. Endl, D. Fabrycky, F. Fressin, M. Haas, E.
Horch, A. Howard, H. Isaacson, H. Kjeldsen, J. Kolodziejczak, C. Kulesa, J. Li, P. W. Lucas, P. Machalek, D.
McCarthy, P. MacQueen, S. Meibom, T. Miquel, A. Prsa, S. N. Quinn, E. V. Quintana, D. Ragozzine, W. Sherry, A.
Shporer, P. Tenenbaum, G. Torres, J. D. Twicken, J. Van Cleve, L. Walkowicz, F. C. Witteborn, M. Still,
“Characteristics of Planetary Candidates Observed by Kepler. II. Analysis of the First Four Months of Data,” ApJ,
736, 19 (2011)
[2] G. Marcy, R. P. Butler, D. Fischer, S. Vogt, J. T. Wright, C. G. Tinney, H. R. A. Jones, “Observed Properties of
Exoplanets: Masses, Orbits, and Metallicities,” Progress of Theoretical Physics Supplement, 158, 24 (2005)
[3] F. Pepe, D. Ehrenreich, M. R. Meyer, “Instrumentation for the detection and characterization of exoplanets,” Nature,
513, 358 (2014)
[4] C. Marois, B. Macintosh, T. Barman, B. Zuckerman, I. Song, J. Patience, D. Lafrenière, R. Doyon, “Direct Imaging
of Multiple Planets Orbiting the Star HR 8799”, Science, 322(5906), pp. 1348- (2008)
[5] Lagrange, A.-M.; Gratadour, D.; Chauvin, G.; Fusco, T.; Ehrenreich, D.; Mouillet, D.; Rousset, G.; Rouan, D.;
Allard, F.; Gendron, É.; Charton, J.; Mugnier, L.; Rabou, P.; Montri, J.; Lacombe, F., “A probable giant planet
imaged in the beta Pictoris disk. VLT/NaCo deep L'-band imaging”, Astronomy and Astrophysics, Volume 493, Issue
2, pp.L21-L25, (2009) http://adsabs.harvard.edu/abs/2009A%26A...493L..21L
[6] Kuzuhara, M.; Tamura, M.; Kudo, T.; Janson, M.; Kandori, R.; Brandt, T. D.; Thalmann, C.; Spiegel, D.; Biller, B.;
Carson, J.; Hori, Y.; Suzuki, R.; Burrows, A.; Henning, T.; Turner, E. L.; McElwain, M. W.; Moro-Martín, A.;
Suenaga, T.; Takahashi, Y. H.; Kwon, J.; Lucas, P.; Abe, L.; Brandner, W.; Egner, S.; Feldt, M.; Fujiwara, H.;
Goto, M.; Grady, C. A.; Guyon, O.; Hashimoto, J.; Hayano, Y.; Hayashi, M.; Hayashi, S. S.; Hodapp, K. W.;
Ishii, M.; Iye, M.; Knapp, G. R.; Matsuo, T.; Mayama, S.; Miyama, S.; Morino, J.-I.; Nishikawa, J.; Nishimura, T.;
Kotani, T.; Kusakabe, N.; Pyo, T.-S.; Serabyn, E.; Suto, H.; Takami, M.; Takato, N.; Terada, H.; Tomono, D.;
Watanabe, M.; Wisniewski, J. P.; Yamada, T.; Takami, H.; Usuda, T., “Direct Imaging of a Cold Jovian Exoplanet in
Orbit around the Sun-like Star GJ 504”, The Astrophysical Journal, Volume 774, Issue 1, article id. 11, 18 pp. (2013)
http://adsabs.harvard.edu/abs/2013ApJ...774...11K
[7] Rameau, J.; Chauvin, G.; Lagrange, A.-M.; Meshkat, T.; Boccaletti, A.; Quanz, S. P.; Currie, T.; Mawet, D.;
Girard, J. H.; Bonnefoy, M.; Kenworthy, M., “Confirmation of the Planet around HD 95086 by Direct Imaging”, The
Astrophysical Journal Letters, Volume 779, Issue 2, article id. L26, 5 pp. (2013).
http://adsabs.harvard.edu/abs/2013ApJ...779L..26R
[8] Macintosh, B.; Graham, J. R.; Barman, T.; De Rosa, R. J.; Konopacky, Q.; Marley, M. S.; Marois, C.; Nielsen, E. L.;
Pueyo, L.; Rajan, A.; Rameau, J.; Saumon, D.; Wang, J. J.; Patience, J.; Ammons, M.; Arriaga, P.; Artigau, E.;
Beckwith, S.; Brewster, J.; Bruzzone, S.; Bulger, J.; Burningham, B.; Burrows, A. S.; Chen, C.; Chiang, E.;
Chilcote, J. K.; Dawson, R. I.; Dong, R.; Doyon, R.; Draper, Z. H.; Duchêne, G.; Esposito, T. M.; Fabrycky, D.;
Fitzgerald, M. P.; Follette, K. B.; Fortney, J. J.; Gerard, B.; Goodsell, S.; Greenbaum, A. Z.; Hibon, P.; Hinkley, S.;
Cotten, T. H.; Hung, L.-W.; Ingraham, P.; Johnson-Groh, M.; Kalas, P.; Lafreniere, D.; Larkin, J. E.; Lee, J.;
Line, M.; Long, D.; Maire, J.; Marchis, F.; Matthews, B. C.; Max, C. E.; Metchev, S.; Millar-Blanchaer, M. A.;
Mittal, T.; Morley, C. V.; Morzinski, K. M.; Murray-Clay, R.; Oppenheimer, R.; Palmer, D. W.; Patel, R.;
Perrin, M. D.; Poyneer, L. A.; Rafikov, R. R.; Rantakyrö, F. T.; Rice, E. L.; Rojo, P.; Rudy, A. R.; Ruffio, J.-B.;
Ruiz, M. T.; Sadakuni, N.; Saddlemyer, L.; Salama, M.; Savransky, D.; Schneider, A. C.; Sivaramakrishnan, A.;
Song, I.; Soummer, R.; Thomas, S.; Vasisht, G.; Wallace, J. K.; Ward-Duong, K.; Wiktorowicz, S. J.; Wolff, S. G.;
Zuckerman, B., “Discovery and spectroscopy of the young jovian planet 51 Eri b with the Gemini Planet Imager”,
Science, Volume 350, Issue 6256, pp. 64-67 (2015). http://adsabs.harvard.edu/abs/2015Sci...350...64M
[9] T. D. Brandt, M. W. McElwain, E. L. Turner, K. Mede, D. S. Spiegel, M. Kuzuhara, J. E. Schlieder, J. P. Wisniewski,
L. Abe, B. Biller, W. Brandner, J. Carson, T. Currie, S. Egner, M. Feldt, T. Golota, M. Goto, C. A. Grady, O. Guyon,
J. Hashimoto, Y. hayano, S. Hayashi, T. Henning, K. W. Hidapp, S. Inutsuka, M. Ishii, M. Iye, M. Hanson, R. Kandori,
G. R. Knapp, T. Kudo, N. Kusakabe, J. Kwon, T. Matsuo, S. Miyama, J.-I. Morino, A. Moro-Martín, T. Nishimura,
Pyo, T.-S.; Serabyn, E.; Suto, H.; Suzuki, R.; Takami, M.; Takato, N.; Terada, H.; Thalmann, C.; Tomono, D.; M.
Watanabe, T. Yamada, H. Takami, T. Usuda, M. Tamura, “A Statistical Analysis of SEEDS and Other High-
contrast Exoplanet Surveys: Massive Planets or Low-mass Brown Dwarfs?”, The Astrophysical Journal, Volume 794,
Issue 2, article id. 159, 25 pp. (2014) http://adsabs.harvard.edu/abs/2014ApJ...794..159B
[10] D. Spergel, N. Gehrels, C. Baltay, D. Bennett, J. Breckinridge, M. Donahue, A. Dressler, B. S. Gaudi, T. Greene, O.
Guyon, C. Hirata, J. Kalirai, N. J. Kasdin, B. Macintosh, W. Moos, S. Perlmutter, M. Postman, B. Rauscher, J. Rhodes,
Y. Wang, D. Weinberg, D. Benford, M. Hudson, W.-S. Jeong, Y. Mellier, W. Traub, T. Yamada, P. Capak, J. Colbert,
D. Masters, M. Penny, D. Savransky, D. Stern, N. Zimmerman, R. Barry, L. Bartusek, K. Carpenter, E. Cheng, D.
Content, F. Dekens, R. Demers, K. Grady, C. Jackson, G. Kuan, J. Kruk, M. Melton, B. Nemati, B. Parvin, I.
Poberezhskiy, C. Peddie, J. Ruffa, J. K. Wallace, A. Whipple, E. Wollack, F. Zhao, “Wide-Field InfrarRed Survey
Telescope-Astrophysics Focused Telescope Assets WFIRST-AFTA 2015 Report”,
http://adsabs.harvard.edu/abs/2015arXiv150303757S
[11] Karl R. Stapelfeldt ; Frank G. Dekens ; Michael P. Brenner ; Keith R. Warfield ; Ruslan Belikov ; Paul B. Brugarolas
; Geoffrey Bryden ; Kerri L. Cahoy ; Supriya Chakrabarti ; Serge Dubovitsky ; Robert T. Effinger ; Brian Hirsch ;
Andrew Kissil ; John E. Krist ; Jared J. Lang ; Mark S. Marley ; Michael W. McElwain ; Victoria S. Meadows ; Joel
Nissen ; Jeffrey M. Oseas ; Chris Pong ; Eugene Serabyn ; Eric Sunada ; John T. Trauger ; Stephen C. Unwin ; “Exo-
C: a probe-scale space observatory for direct imaging and spectroscopy of extrasolar planetary systems”,
http://adsabs.harvard.edu/abs/2015SPIE.9605E..0TS
[12] Cahoy et al., 2016, cross-reference
[13] S. Brakken-Thai, B. Woodgate, G. Hilton, “Goddard’s Coronagraphic Intergral Field Spectrograph Upgrade at APO”,
Telophase poster, (2011) http://www.slideshare.net/sbrakken/telophase-poster
[14] John Trauger, Dwight Moody, John Krist, Brian Gordon, “Hybrid Lyot coronagraph for WFIRST-AFTA:
coronagraph design and performance metrics”, J. Astron. Telesc. Instrum. Syst. 2(1), 011013 (2016). http://astronomicaltelescopes.spiedigitallibrary.org/article.aspx?articleid=2482759
[15] Neil T. Zimmerman ; A. J. Eldorado Riggs ; N. Jeremy Kasdin ; Alexis Carlotti ; Robert J. Vanderbei, “Shaped pupil
Lyot coronagraphs: High-contrast solutions for restricted focal planes”, J. Astron. Telesc. Instrum. Syst. 2(1), 011012
(2016). http://astronomicaltelescopes.spiedigitallibrary.org/article.aspx?articleid=2482760
[16] Brian Kern; Olivier Guyon ; Ruslan Belikov ; Daniel Wilson ; Richard Muller ; Erkin Sidick; Bala Balasubramanian;
John Krist ; Ilya Poberezhskiy ; Hong Tang, “Phase-induced amplitude apodization complex mask coronagraph mask
fabrication, characterization, and modeling for WFIRST-AFTA”, J. Astron. Telesc. Instrum. Syst. 2(1), 011014
(2016). http://astronomicaltelescopes.spiedigitallibrary.org/article.aspx?articleid=2486699
[17] Sara Seager ; Margaret Turnbull ; William Sparks ; Mark Thomson ; Stuart B. Shaklan ; Aki Roberge ; Marc Kuchner
; N. Jeremy Kasdin ; Shawn Domagal-Goldman ; Webster Cash ; Keith Warfield ; Doug Lisman ; Dan Scharf ; David
Webb ; Rachel Trabert ; Stefan Martin ; Eric Cady ; Cate Heneghan, “The Exo-S probe class starshade mission”, Proc.
SPIE 9605, Techniques and Instrumentation for Detection of Exoplanets VII, 96050W (2015), http://adsabs.harvard.edu/abs/2015SPIE.9605E..0WS
[18] Michael W. McElwain ; Marshall D. Perrin ; Qian Gong ; Ashlee N. Wilkins ; Karl R. Stapelfeldt ; Bruce E. Woodgate
; Timothy D. Brandt ; Sara R. Heap ; George M. Hilton ; Jeffrey W. Kruk ; Dwight Moody ; John Trauger, “PISCES:
an integral field spectrograph to advance high contrast imaging technologies”, Proc. SPIE 8864, Techniques and
Instrumentation for Detection of Exoplanets VI, 88641O (September 26, 2013) http://proceedings.spiedigitallibrary.org/proceeding.aspx?articleid=1744200&resultClick=1
[19] Qian Gong ; Michael McElwain ; Bradford Greeley ; Bryan Grammer ; Catherine Marx ; Nargess Memarsadeghi ;
Karl Stapelfeldt ; George Hilton ; Jorge Llop Sayson ; Marshall Perrin ; Richard Demers ; Hong Tang ; Brian Kern ;
Janan Ferdosi, “Prototype imaging spectrograph for coronagraphic exoplanet studies (PISCES) for WFIRST/AFTA”,

Proc. SPIE 9605, Techniques and Instrumentation for Detection of Exoplanets VII, 96050G (September 11, 2015); http://proceedings.spiedigitallibrary.org/proceeding.aspx?articleid=2442643&resultClick=1
[20] GLAD Theory Manual, Version 5.8, Copyright 1986-2013 Applied Optics Research. All Rights Reserved.
[21] David J. Des Marais, Martin O. Harwit, Kenneth W. Jucks, James F. Kasting, Douglas N.C. Lin, Jonathan I. Lunine,
Jean Schneider, Sara Seager, Wesley A. Traub, and Neville J. Woolf. “Remote Sensing of Planetary Properties and
Biosignatures on Extrasolar Terrestrial Planets”, Astrobiology. 2(2): 153-181, (July 2004)
http://adsabs.harvard.edu/abs/2002AsBio...2..153D
[22] Mary Anne Peters-Limbach ; Tyler D. Groff ; N. Jeremy Kasdin ; Dave Driscoll ; Michael Galvin ; Allen Foster ;
Michael A. Carr ; Dave LeClerc ; Rad Fagan ; Michael W. McElwain ; Gillian Knapp ; Timothy Brandt ; Markus
Janson ; Olivier Guyon ; Nemanja Jovanovic ; Frantz Martinache ; Masahiko Hayashi ; Naruhisa Takato, “The optical
design of CHARIS: an exoplanet IFS for the Subaru telescope”, Proc. SPIE 8864, Techniques and Instrumentation
for Detection of Exoplanets VI, 88641N (September 26, 2013); http://adsabs.harvard.edu/abs/2013SPIE.8864E..1NP
[23] McElwain et al., 2016 SPIE cross-reference