leonardo horta investor relations director brazil day 2003 november 17th, 2003 new york
Post on 22-Dec-2015
216 views
TRANSCRIPT

Leonardo Horta
Investor Relations Director
BRAZIL DAY 2003November 17th, 2003
New York

2
Increase Total Shareholder ReturnIncrease Total Shareholder Return
Goal
Board of Directors
CST’s organization
Share price Share price appreciationappreciationDividendDividend

3
49
171
59
138
113
232
61 493
66
184
34
58
165
78
197
23
115
40
109
108
1993 1994 1995 1996 1997 1998 1999 2000 2001 2002 YTD
Dividends: US$ 582 MM
Investments: US$ 1,911 MM
49
171
59
138
113
232
61 493
66
184
34
58
165
78
197
23
115
40
109
108
1993 1994 1995 1996 1997 1998 1999 2000 2001 2002 YTD
Dividends: US$ 582 MM
Investments: US$ 1,911 MM
Dividends + Growth
• Investment Capacity aligned with dividend
(US$ MM)

4
Growth Strategy
Growth Strategy
Board of Directors
CST’s organization
Increase Total Shareholder ReturnIncrease Total Shareholder Return

5
Growth Strategy
Board of Directors
CST’s organization
Increase Total Shareholder ReturnIncrease Total Shareholder Return
Strategy support
Commercial Initiatives
Operational Excellence
Capital Structure
Knowledge management

6
Cutting-edge
Higher Value Added Steel
53% of revenues
CC # 1IR-UT
CC # 2RH
CONTINUOUS CASTING
RH
API
Capped + Rimmed
SK + Killed (Cont.Casting.)
HSM
Expansion
Optimization
1993 1994 1995 1996 1997 1998 1999 2000 2001 2002 2003 2004 2005 2006
Hot coils
Sales (thousand tons)
80
201
261
313
4Q02 1Q03 2Q03 3Q03
80
201
261
313
4Q02 1Q03 2Q03 3Q03

7
Higher Value Added Mix
• Differentiated relationship with customers
Product Product PerformancePerformance
VolumeVolume
ReliabilityReliability
Prompt responsePrompt response PredictabilityPredictability
ServicesServices
8
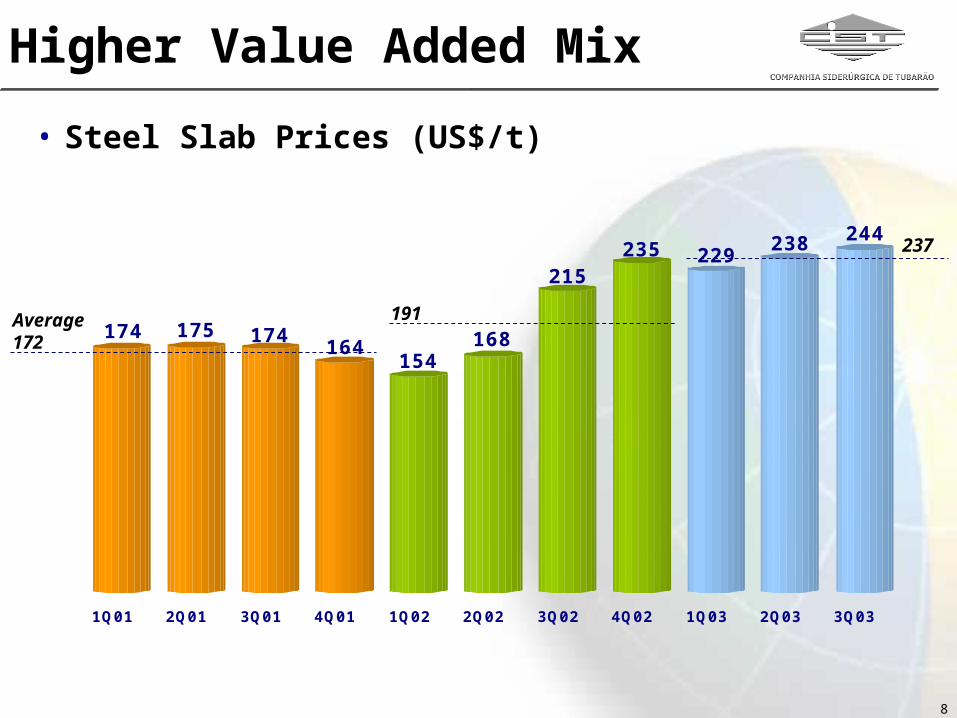
Higher Value Added Mix
• Steel Slab Prices (US$/t)
174 175 174164
154168
215235 229
238 244
1Q01 2Q01 3Q01 4Q01 1Q02 2Q02 3Q02 4Q02 1Q03 2Q03 3Q03
Average172
191
237

9
Recognition
• Preferential supplier of quality semi-finished steel focused on future demand
Customization turned into customer Customization turned into customer loyaltyloyalty
Consolidate its positioning at the Consolidate its positioning at the basebase of of the value chainthe value chain
Focus on the customerFocus on the customer’s’s core business core businessDetailed knowledge of customersDetailed knowledge of customers’’ market marketss

10
Strategy support
Growth Strategy
Board of Directors
CST’s organization
Increase Total Shareholder ReturnIncrease Total Shareholder Return
Commercial Initiatives
Operational Excellence
Capital Structure
Knowledge management

11
Asset Maximization Asset longevity and performance sustainability
• Blast Furnace 1
– In operation since 1983
– 1st in productivity in the world
– Outstanding operating performance allowed revamping to be postponed from 2003 to 2008
– More than 64 million tons produced (largest volume produced by a single blast furnace)
• Blast Furnace 2
– World Benchmark
– 5 years of operation
– Total Pig Iron Production of 6.7 Mt

12
Strategy support
Growth Strategy
Board of Directors
CST’s organization
Increase Total Shareholder ReturnIncrease Total Shareholder Return
Commercial Initiatives
Operational Excellence
Capital Structure
Knowledge management

13
ASSET MANAGEMENT•Working Capital
•Depreciation
•Useful Life Optimization
•Maintenance Policy
• Investment Payback
Capital Structure
• Cash Generation
CONSISTENT
EBITDA
TAX CREDITS• INCOME TAX / CSLL
• ICMS
• EXCISE TAX
COMPATIBLE FREE CASH FLOW
LT Debt Amortization
Dividends
CAPEX
New Investments •70% DEBT
•30% EQUITY

14
Capital Structure
Note: - Gearing : Net Debt / Shareholders’ equity
Source: FitchSource: CSTSource: FitchSource: CST
(time – x)
New investments – Enhance Capital New investments – Enhance Capital StructureStructure
Debt Equity70% 30%
43 4438
41
31
22
1998 1999 2000 2001 2002 3T03
43 4438
41
31
22
1998 1999 2000 2001 2002 3T03
1,42,5
4,8
2,2
7,1
9,0
4,97,9
5,5 3,64,6
1998 1999 2000 2001 2002 3T03
Brazilian Steel Industry
CST
Gearing Ratio- % (US GAAP)
Net Debt / EBITDA

15
434
123
126
439
121
110
442
113
143
Mar/ 31/ 03 Jun/ 30/ 03 Sep/ 30/ 03
Long Term Current Portion of LT Debt Working Capital
698670
66%
18%
16%
Net Debt (US$ MM)
LT Maturity
63%
16%
21%
Capital Structure
• Indebtedness
Due Date of Long Term DebtPosition on Sep/2003 – US$ million
2004 * 35
2005 112
2006 80
2007 a 2014 215
TOTALTOTAL 442442(*) From October to December
683
64%
18%
18%

16
Strategy support
Growth Strategy
Board of Directors
CST’s organization
Increase Total Shareholder ReturnIncrease Total Shareholder Return
Commercial Initiatives
Operational Excellence
Capital Structure
Knowledge management

17
Knowledge management
GlobalGlobal BenchmarkingBenchmarking
Learning Learning OrganizatioOrganizatio
nn
TI Processes
People

18
People
16.5 Years with CST (average)16.5 Years with CST (average)
SchoolingSchooling TrainingTraining
92
128
162180
1999 2000 2001 2002
Training hours / employee / year
92
128
162180
1999 2000 2001 2002
Training hours / employee / year
R$ 4 millionR$ 4
millionR$ 7
millionR$ 7
millionR$ 8
millionR$ 8
millionR$ 11 millionR$ 11 million
Employee Employee Satisfaction Satisfaction
SurveySurvey
1999: 54%
2007: 76%BSC’s Goal
3rd in Brazil
2nd in Brazil1st in the Industry
1st in Brazil
2001: 71%
2002: 73%
2003: 73%

19Social Responsibility
Community Commitment
Growth Strategy
Board of Directors
CST’s organization
Increase Total Shareholder ReturnIncrease Total Shareholder Return
Commercial Initiatives
Operational Excellence
Capital Structure
Knowledge management

20
342 354 366386
427446 461 473 481
1994 1995 1996 1997 1998 1999 2000 2001 2002
US$ milhõesMW
m3 / t. placas
Water Consumption
Gigajoule / t aço bruto
Energy consumption
Investment on Equipment Electric Energy Generation
Community Commitment Sustainable Development
138120
136149
182
210197
210 203
1994 1995 1996 1997 1998 1999 2000 2001 2002
5 5 5 55
4 4 4 4
1994 1995 1996 1997 1998 1999 2000 2001 2002
20
2121
19
18
19
20
19
19
1994 1995 1996 1997 1998 1999 2000 2001 2002
Accum.

21
Increase Total Shareholder Return
Social Responsibility
Growth Strategy
Board ofDirectors
CST´s OrganizationCST´s Organization
Commercial Actions
Industrial Actions
Capital Structure
Knowledge management
Outlook
Positive Convergence
Market demand larger than
capacity
CompetitiveExpansion (7.5 million
tons)
Operational Excellence
Capital Structure
Increase Total Shareholder Return
Growth Strategy
Board ofDirectors