leonardo rios solis - ucl...
TRANSCRIPT

1
MICROSCALE EVALUATION OF DE NOVO ENGINEERED WHOLE CELL
BIOCATALYSTS
Leonardo Rios Solis
A thesis submitted for the degree of
Doctor of Philosophy
to
University College London
Department of Biochemical Engineering University College London
Torrington Place London
WC1E 7JE 2012

2
‘I, Leonardo Rios Solis, confirm that the work presented in this thesis is my own.
Where information has been derived from other sources, I confirm that this has been
indicated in the thesis.’
ABSTRACT
Biocatalysis has emerged as a powerful tool for the synthesis of high value optically
pure compounds. With advances in synthetic biology, it is now possible to design de
novo non-native pathways to perform non-natural chiral bioconversions. However
these systems are difficult to assemble and operate productively, severely hampering
their industrial application.
The purpose of this study was to develop a microscale toolbox for the rapid design
and evaluation of synthetic pathways, in order to increase their operational
productivities and speed-up their process development.
The first aim of this work was to establish a microscale platform to accelerate the
evaluation of different variants of transketolase (TK) and transaminase (TAm), in
order to design and construct a de novo pathway for the one-pot synthesis of chiral
amino alcohols. The second aim was to develop a microscale methodology to rapidly
establish the complete kinetic models of the selected TKs and TAms, which would
allow efficient operation of the one-pot synthesis. The third aim was to scale-up the
production of the biocatalyst to pilot plant, while controlling and maintaining the
desired level of expression of each enzyme. Finally the fourth aim of this project was
to scale-up and simulate the complete one-pot syntheses to preparative scale, while
predicting and applying the best reaction strategies and reactor configurations.
The experimental microscale toolbox was based on 96 microwell plates with
automation capacities, where the one-pot syntheses of the diastereoisomers (2S,3S)-2
aminopentane-1,3-diol (APD) and (2S,3R)-2-amino-1,3,4-butanetriol (ABT) were
designed and performed with final product yields of 90% and 87% mol/mol
respectively. For the synthesis of ABT and APD, the wild type E. coli TK and the
engineered D469E TK were identified as the best candidates respectively, and both
enzymes were paired with the TAm from Chromobacterium violaceum.

Abstract
A microscale methodology for kinetic model establishment was developed based on
programmable non linear methods. The TAm step was found to be the bottleneck of
the multi-step syntheses, due to the high a Michaelis constant of intermediate
substrate erythrulose for the synthesis of ABT, and the low catalytic constants for the
synthesis of APD. Also the amino donor substrate was discovered to be toxic for the
TAm, as well as causing side reactions, thus affecting the overall performance of the
de novo pathway.
The production of the E. coli whole cells containing the de novo pathway were
successfully scaled-up to pilot plant without losing catalytic activity. By manipulating
the fermentation temperature and induction time of TAm, it was found the desired
level of expression of each enzyme could be achieved.
Finally, the complete one-pot syntheses were simulated using the previously
established microscale kinetic models, which were found to be predictive of
preparative scale bioconversions. A reactor with fed-batch addition of the amino
donor was predicted as the best operating strategy in each case. Using this strategy,
the one-pot syntheses allowed up to a 6-fold increase in product yield (% mol/mol),
while using concentrations one order of magnitude higher than previously published
preparative scale data.
As a conclusion, this work is the first of its kind to develop such a microscale
modelling toolbox, which is designed to exploit the synthetic potential of engineered
and recombinant enzymes, in order to design, simulate and optimize de novo
engineered pathways. This makes the results of this work an original contribution for
the process development of synthetic pathways.
.

ACKNOWLEDGEMENTS
I would like to thank my supervisor Professor Gary J. Lye, for believing in me to
carry out this project. I also thank him for his support and guidance which lead to the
successful achievement of the aims of this project, and for making my PhD
experience so enjoyable. I thank also Dr. Frank Baganz for his invaluable advice
during the project, and for trusting me with new ideas to improve the quality of my
research. I would also like to thank Dr Paul A. Dalby for his help and support any
time I needed it.
I dedicate this thesis to my family, who are the most wonderful gift I have in my life:
they are my best friends. I thank them for inspiring me to set high goals in my life,
and for teaching me that above all, a high goal is to become a better man, and that to
become a better man, you need to first help your other friends. I thank them also for
inspiring me to fight for this PhD, and for never letting me feel alone, even if half a
world was separating us.
Following those principles, I want to thank Patty Morris and Homam Al-bahrani, who
started with me this PhD adventure, and at the end they became more than friends:
they are part of my family nowadays. I thank them for all the fun we had together in
lab, promoting unlimited collaborations between protein engineering, microfluidics
and microscale multi-step synthesis, while organizing parties in the office and singing
like rock stars in the lab. I thank them also for all the good moments we had outside
the lab, from trips to the end of the world, to the endless nights in the pub or the
typical football games in Wednesday´s nights. But especially I thank them for
supporting me in the difficult times, when I did even have to ask to receive a cheerful
hand.

Acknowledgements
6
A special mention with all my gratitude goes to Chuanjie and Murni, who showed me
how invaluable they are as friends. I thank them for all the collaborative research we
did together, making the hard times in the lab become funnier times.
I would like to thank Akin Odeleye for been such a fantastic student, and for his
important contributions in doing part of the pilot scale fermentations.
I would like to thank Armando Cázares for his important contributions synthesizing
my products and substrates standards, as well as helping me to purify and analyse
them.
Also, I acknowledge and would like to thank Nihal Bayir and Jian Hao for his
important contributions in the kinetic modelling studies.
Finally, I would like to thank all the members and ex members of the BiCe group
including Chris Grant, Raha Faharomi, Maria Francisca Villegas, Dawid Dreszcz,
Panyupa Pankhong, Amana Halim, Subhas Pradhan, Sandro Matosevic among many
others for all the inspiring discussions in the lab meetings relating with this project, as
well as for making the lab environment so cheerful and motivating.
CONTENTS
Section Page
ABSTRACT
3
ACKNOWLEDGEMENTS
5
CONTENTS
7
LIST OF FIGURES
14
LIST OF TABLES
21
NOMENCLATURE AND ABBREVIATIONS
23
1 INTRODUCTION
27
1.1 Introduction to multi-enzyme catalysis
27
1.2 Classification of multi-enzymatic processes 29 1.2.1 One-pot synthesis 30 1.2.1.1 Ex vivo one-pot synthesis 32 1.2.1.2 In vivo one-pot synthesis 34 1.2.1.3 De novo pathway design
37
1.3 Microscale high-throughput experimentation 38 1.3.1 Microscale processing techniques for de novo pathway
design
41
1.4 Modelling of biocatalytic processes 43
1.4.1 Strategies to establish biocatalytic kinetic models
46
1.5 De novo pathway for the synthesis of amino alcohols
48

Contents
8
1.5.1 Relevance of amino alcohols 48 1.5.2 Transketolase 50 1.5.2.1 Introduction to transketolase 50 1.5.2.2 Structure of transketolase 52 1.5.2.3 Kinetic mechanism of transketolase 54 1.5.2.4. Applications of transketolase in multi-step synthesis 56 1.5.3 Transaminase 58 1.5.3.1 Introduction to transaminases 58 1.5.3.2 Classification of transaminases 59 1.5.3.3 Structure of transaminases 60 1.5.3.4 Reaction mechanism of transaminaes 61 1.5.3.5 Applications of transaminase in multi-step synthesis 62 1.5.4 One-pot synthesis of chiral amino alcohols
65
1.6 Aim and objective of the project
70
2 MATERIALS AND METHODS
73
2.1 Materials 73 2.1.1 Reagents and suppliers 74 2.1.2 Media preparation 74 2.1.3 Luria Bertani agar plates 74 2.1.4 Antitiotic Solutions
74
2.2 Molecular biology techniques 74 2.2.1 DNA extraction and quantification 75 2.3.2 Restriction digests and agarose gels 75 2.3.3 Preparation of competent cells 75 2.3.4 Transformation of cells by heat shock technique 76 2.3.5. Master glycerol stocks
76
2.3 Plasmids 77 2.3.1 Transketolase plasmid pQR412 77 2.3.2 Site directed mutagenesis of TK 77 2.3.3 Transaminase plasmid pQR801 78 2.3.4 Plasmid sequencing
78
2.4 Shake flask fermentations 79 2.4.1 TK shake flask fermentations 79 2.4.2 TAm and TK-TAm shake flask fermentations 79

Contents
9
2.5 Laboratory and pilot scale fermentations 80 2.5.1 2 L Adaptive Biosystems batch fermentation 80 2.5.2 7.5 L New Brunswick batch fermentation
81
2.6 Biocatalyst preparation 82 2.6.1 Whole cell and lysate forms 83 2.6.2 Purified enzymes (His6-tag purification)
83
2.7 Synthesis of substrates and products 84
2.7.1 Chemical synthesis of hydroxypyruvate 84 2.7.2 Enzymatic synthesis of PKD 85 2.7.3 Chemical synthesis of ABT product standard 85 2.7.4 Enzymatic synthesis of ABT and APD 86 2.7.5 Synthesis of derivatizing reagent
87
2.8 Bioconversion kinetics 88 2.8.1 Microscale experimental platform 88
2.8.2 Preparative scale bioconversions
89
2.9 Analytical Techniques 89
2.9.1 Dry cell weight (DCW) measurement 89 2.9.2 Optical density measurements for biomass quantification 89 2.9.3 Bradford assay for lysate total protein quantification 90 2.9.4 Purified enzyme quantification by UV absorbance 90 2.9.5 SDS-PAGE electrophoresis 91 2.9.6 HPLC methods 91 2.9.7 LC−ECI−MS analysis of ABT
92
3 EVALUATION OF DE NOVO TK-TAM PATHWAYS IN A WHOLE CELL BIOCATALYST
94
3.1 Introduction
94
3.2 Aims and objectives
96
3.3 Results
97

Contents
10
3.3.1 Biocatalyst production (TK-TAm) 97 3.3.2 Considerations for one pot TK-TAM synthesis 101 3.3.3 Bioconversions with TK 108 3.3.4 Bioconversion with TAm 111 3.3.5 One pot synthesis of amino alcohols
116
3.4 Summary
122
4 KINETIC MODELLING OF TRANSAMINASE SYNTHESIS OF CHIRAL AMINO ALCOHOLS
123
4.1 Introduction
123
4.2 Aim and objectives
124
4.3 Results 125 4.3.1 Model driven methodology for TAm kinetic parameters
identification 125
4.3.2 Proportionality between reaction rate and enzyme concentration
127
4.3.3 Kinetic model of TAm and initial rate experiments 129 4.3.4 Enzyme stability 136 4.3.5 Kinetic parameter identification using progress curves 138 4.3.6 Reconciliation Step for determination of final kinetic
parameter values 144
4.3.7 Validation of the kinetic parameters
147
4.4 Discussion of TAm kinetic parameter results 149 4.4.1 Analysis of Michaelis-Menten constants 149 4.4.2 Analysis of equilibrium constants 150 4.4.3 Bottlenecks of the bioconversion 150 4.4.3.1 Michaelis constant of ERY 150 4.4.3.2 Second half reaction 151 4.4.3.3 Catalytic constant 152 4.4.3.4 Side reactions 152 4.4.3.5 Product inhibition 153 4.4.3.6 Reverse reaction 153 4.4.3.7 Toxicity of MBA towards TAm 154 4.4.4 Optimum reaction conditions
155
4.5 Summary
157

Contents
11
5 PRODUCTION OF THE DUAL TK-TAM E. COLI BIOCATALYST AT LABORATORY AND PILOT SCALE
158
5.1 Introduction
158
5.2 Aim and objectives
159
5.3 Results 160
5.3.1 2 L fermentation with different temperatures and induction times
160
5.3.2 Scale-up to a 7.5 L fermentor 166 5.3.3 Comparison of single and dual TAm expression levels 171 5.3.4 Kinetic comparison of the laboratory and pilot scale
biocatalyst
171
5.4 Summary
176
6 SCALE-UP AND MODELLING OF THE DE NOVO ONE-POT SYNTHESIS OF AMINO ALCOHOLS
178
6.1 Introduction
178
6.2 Aim and objectives 179
6.3 Results 180
6.3.1. Determination of kinetic parameters 180 6.3.1.1 Kinetic model of the E. coli D469E TK mediated synthesis
of PKD 180
6.3.1.2 Kinetic model of the CV2025 TAm mediated synthesis of APD
183
6.3.2 Scale-up and modelling of the one pot synthesis of APD 186 6.3.3 Scale-up and modelling of the one pot synthesis of ABT 192 6.3.4 Selection of the best reactor configuration 197 6.3.4.1 One-pot synthesis of ABT with fed-batch addition of MBA 197 6.3.4.2 One-pot synthesis of APD with fed-batch addition of IPA 201

Contents
12
6.4 Summary
204
7 CONCLUSIONS AND FUTURE WORK
205
7.1 Overall conclusions
205
7.2 Future work
208
8
REFERENCES
212
Appendix I
CALIBRATION PLOT OF BIOMASS IN FUNCTION OF OD OD600
227
Appendix II
BRADFORD ASSAY CALIBRATION 228
Appendix III
HPLC STANDARDS 229
Appendix IV
TK COMPARISON IN WHOLE CELL AND LYSATE 231
Appendix V
MATLAB PROGRAM FOR KINETIC PARAMETER ESTIMATION
233
Appendix VI
PROGRESS CURVES WITH MODEL PREDICTIONS FOR THE TAM SYNTHESIS OF ABT USING MBA
245
Appendix VII
SENSITIVITY ANALYSIS OF THE KINETIC PARAMETERS OF THE TAM MEDIATED SYNTHESIS OF ABT
248
Appendix VIII
PILOT PLANT FERMENTATION OF TRANSAMINASE
250

Contents
13
Appendix IX
PROGRESS CURVES WITH MODEL PREDICTIONS FOR THE TK D469E SYNTHESIS OF PKD
257
Appendix X
PROGRESS CURVES WITH MODEL PREDICTIONS FOR THE TAM SYNTHESIS OF APD USING MBA
260
Appendix XI
PROGRESS CURVES OF THE TAM MEDIATES SYNTHESIS OF ABT AND APD USING IPA AS AMINO DONOR
263
Appendix XII
LC-ECI-MS CHROMATOGRAMS 265
Appendix XIII
A TOOLBOX APPROACH FOR THE RAPID EVALUATION OF MULTI-STEP ENZYMATIC SYNTHESES COMPRISING A ´MIX AND MATCH´ E. COLI EXPRESSION SYSTEM WITH MICROSCALE EXPERIMENTATION (PAPER)
267
Appendix XIV
NON-α-HYDROXYLATED ALDEHYDES WITH EVOLVED TRANSKETOLASE ENZYMES (PAPER)
279

LIST OF FIGURES Figure 1.1. Classification of a multi-enzymatic process.
Figure 1.2. Configuration of multi-step synthesis.
Figure 1.3. Multi-step synthesis of N-acetyllactosamine.
Figure 1.4. Strategies for pathway design to perform one-pot in vivo
synthesis.
Figure 1.5. Diagram representation of individual microwell formats.
Figure 1.6. Methodology proposed in this work to design and optimize a de novo pathway for rapid process development.
Figure 1.7. Representation of different models applied in biocatalysis categorized in the order of increasing scope.
Figure 1.8. General common steps involved in the establishment of biocatalytic mathematical models, arrows indicate feedback loops between steps.
Figure 1.9. General reaction scheme of the carbon-carbon bon formation catalyzed by transketolase.
Figure 1.10. Reactions catalyzed by TK in vivo and ex vivo.
Figure 1.11. Ribbon structure of the E. coli transketolase homodimer.
Figure 1.12. Ribbon structure of a single subunit of E. coli transketolase.
Figure 1.13. Representation of the ping pong bi-bi ordered mechanism followed by TK using HPA as keto donor and any aldehyde (AL) as keto acceptor.
Figure 1.14. Molecular scheme of the TK ping pong bi-bi ordered kinetic reaction mechanism.
Figure 1.15. Chemoenzymatic multi-step synthesis of 4-deoxy D-fructose 6-phosphate using an epoxide hydrolase and S. cerevisiae TK.

List of Figures
15
Figure 1.16. General reaction scheme of a TAm reaction where an amino group is transferred to a carbonyl group.
Figure 1.17. Ribbon structure of homodimeric TAm from V. fluvialis JS17.
Figure 1.18. Two-Binding Site Model of TAm of V. fluvialis showing (a) the binding of the amino donor and (b) the binding of the amino acceptor.
Figure 1.19. Schematic representation of the ping ping bi-bi ordered reaction mechanism used of TAm.
Figure 1.20. Engineered multi-step pathway for the synthesis of L-aminoburyric acid.
Figure 1.21. Synthesis of chiral amines combining an enzymatic transamination and dehydrogenation step in order to shift to equilibrium towards the forward reaction.
Figure 1.22. The synthesis of chiral amino alcohol 2-amino1,3,4-buntanetriol (ABT) from achiral substrates glycolaldehyde and hydroxypyruvate using a de-novo TK–TAm pathway.
Figure 1.23. Aldehydes propionaldehyde and butanaldehyde docked into the TK active site containing the modeled TPP-enamine intermediate.
Figure 1.24. Two-step biocatalytic synthesis of 2-amino-1,3-diols using transketolase (TK) and transaminase (TAm).
Figure 1.25. Hypothetical manufacturing process flow sheet for the large-scale, two-step TK D469T (batch reactor 1) and CV2025 TAm (batch reactor 2) biocatalytic synthesis and purification of (2S,3S)-2-aminopentane-1,3-diol (APD).
Figure 2.1. Structure of the plasmid pQR412.
Figure 2.2. HPLC profiles from different reaction mixtures.
Scheme 3.1. Reaction scheme of the de-novo TK-TAm pathway for the synthesis of chiral amino alcohol (2S,3R)-2-amino-1,3,4-butanetriol (ABT), from achiral substrates glycolaldehyde (GA) and hydroxypyruvate (HPA).

List of Figures
16
Scheme 3.2. Reaction scheme of the de-novo TK-TAm pathway for the synthesis of chiral amino alcohol (2S,3S)-2-aminopentane-1,3-diol (APD) from achiral substrates propionaldehyde (PA) and hydroxypyruvate (HPA).Experimental kLa values taken from Figure 3.4.
Figure 3.1. Shake flask fermentation kinetics for E. coli BL21-Gold (DE3) grown in LB-glycerol medium.
Figure 3.2. SDS-PAGE gels showing expression of TK and TAm in cellular extracts of E. coli BL21(DE3)-Gold cells.
Figure 3.3. Effect of pH on the initial rate of PKD production by whole cells of E. coli expressing TK D469E.
Figure 3.4. Initial rate of ABT production by whole cell TAm in function of pH.
Figure 3.5. Non-specific consumption of reactatnts by E. coli cells at 37oC.
Figure 3.6. Effect of buffer composition on initial rate of ABT production by TAm in whole cell form.
Figure 3.7. Bioconversion kinetics showing ketodiol synthesis using different TK lysates and aldehyde acceptors
Figure 3.8. Bioconversion kinetics showing APD synthesis using CV2015 TAm in either lysate or whole cell form with different amino donors.
Figure 3.9. Bioconversion kinetics showing APD synthesis using CV2015 TAm in whole cell form with different amine donors.
Figure 3.10. Typical bioconversion kinetics for the one pot, whole cell TK-TAm catalytic synthesis of APD with addition of amine donor (MBA) after 4 hours.
Figure 3.11. Typical bioconversion kinetics for the one pot, whole cell TK-TAm catalytic synthesis of APD using IPA as amine donor.
Figure 3.12. Typical bioconversion kinetics for the one pot, whole cell TK-TAm catalytic synthesis of ABT using IPA as amine donor.
Figure 4.1. Schematic representation of the systematic procedure for rapid apparent kinetic parameter identification for an equilibrium controlled bioconversion such as the whole cell TAm mediated synthesis of ABT from ERY and MBA.
List of Figures
17
Figure 4.2. Apparent initial rate of ABT and AP TAm mediated synthesis (Scheme 3.1) as a function of TAm concentration in whole cell form.
Figure 4.3. Apparent initial rate of the forward TAm reaction for ABT and AP synthesis (Scheme 3.1) as a function of the substrate concentration.
Figure 4.4. Apparent initial rate of the TAm reverse reaction for the synthesis of ABT and MBA as function of the concentration of substrates.
Figure 4.5. Proposed King-Altman figure for the TAm mediated synthesis of ABT.
Figure 4.6. Stability experiments using the whole cell TAm biocatalyst: apparent forward initial reaction rates after different times of incubation.
Figure 4.7. Forward reaction experimental and predicted progress curves following (a) [ABT] for the complete length of the bioconversions and (b) [ABT] for the first 50 min of reaction time.
Figure 4.8. Reverse reaction predicted and experimental progress curves following MBA.
Figure 4.9. Verification of model predictions with an experimental data set not included in the original experimental design.
Figure 4.10. Experimental progress curves and simulations following TAm mediated synthesis of ABT using an initial concentration of (▲) 250 mM ERY and 40 mM MBA and (○) 250 mM MBA and 40 mM ERY.
Figure 5.1. Effect of temperature on batch growth profiles for 2 L fermentations of the double transformed E. coli BL21-Gold (DE3) cells with plasmids pQR412 and pQR801 constructed as described in Section 2.3.3 and 2.3.5.
Figure 5.2. Online measurements of pH (- -), temperature (•••) and DOT(−) for the fermentations shown in Figure 5.1.
Figure 5.3. Typical TK (●) and TAm (○) expression profiles for the 2 L fermentations shown in Figure 5.1.

List of Figures
18
Figure 5.4. Growth profiles for 7.5 L fermentations of the double transformed E. coli BL21-Gold (DE3) cells with plasmids pQR412 and pQR801s for pathway design to perform one-pot in vivo synthesis.
Figure 5.5. SDS-PAGE gel of cellular extracts of the 7.5 L fermentation at 37 oC with induction in the early exponential phase after 3 hr growth shown in Figure 5.4.
Figure 5.6. TK (●) and TAm (○) expression profiles for the 7.5 L fermentations shown in Figure 5.4.
Figure 5.7. Bioconversion kinetics comparison of the dual TK-TAm expressing E. coli BL21-Gold (DE3) cells produced at shake flask and 7.5 L fermentor scales.
Figure 5.8. Continuation of the one pot synthesis profiles shown in Figure 5.4 using a TK-TAm shake flask and 7.5 L biocatalyst showing the TAm bioconversion step after addition of MBA steps.
Figure 6.1. Apparent initial rate of PKD formation using TK D469E as a function of [PA] while maintaining [HPA] fixed.
Figure 6.2. Apparent TAm initial rate of AP for the forward reaction as a function of (○) [MBA] while maintaining [PKD] fixed at 100 mM, and as a function of (Δ) [PKD] while maintaining [MBA] fixed at 10 mM.
Figure 6.3. Scale-up and modelling of the whole cell E. coli, one pot synthesis of APD.
Figure 6.4. Scale-up and modelling of the whole cell one pot synthesis of ABT.
Figure 6.5. Typical progress curves and modelling of the one-pot synthesis of ABT with continuous fed-batch addition of MBA.
Figure 6.6.
Typical progress curves and modelling of the one-pot synthesis of APD with continuous fed-batch addition of IPA.
Figure A.I.1. Calibration graph of biomass in gDCW L-1 as a function of OD600.
Figure A.II.1.
Standard graph for Bradford assay of BSA concentration as a function of OD595.

List of Figures
19
Figure A.III.1. Figure A.III. 1. Calibration graph of ERY and HPA
concentration as a function of HPLC area.
Figure A.III.2. Calibration graph of ERY and HPA concentration as a function of HPLC area.
Figure A.IV.1. ERY production by TK wild type lysate and whole cell at 25oC
Figure A.IV.2. Figure A.IV. 2. Progress curves of the synthesis of ERY at 25oC with different TK lysates and whole cells. GA and HPA were 50 mM. Enzyme concentration was 0.1 mg/ml , pH 7.0 with 50 mM TRIS.
Figure A.VI.1. Progress curves of whole cell TAm mediated synthesis of ABT from substrates ERY and MBA.
Figure A.VI.2. Progress curves of whole cell TAm mediated synthesis of ABT from substrates MBA and ERY (continuation from Figure A.VI.1).
Figure A.VII.1. Effect of the parameter value of (a) kf, (b) kr, (c) KERY and (d) KMBA in the simulated yield of ABT (% mol/mol) considering a 24 hr reaction using 100 mM equimolar of [MBA] and [ERY] and 0.3 mg ml-1 of TAM.
Figure A.VII.2. Effect of the parameter value of (a) kAP, (b) kABT, (c) KiMBA, (d) KiABT and (e) KiMBAc in the simulated yield of ABT (% mol/mol) considering a 24 hr reaction using 100 mM equimolar of [MBA] and [ERY] and 0.3 mg ml-1 of TAM.
Figure A.VIII.1. Growth curve of E.coli cells with TAm for the fermentation with single shot addition of glycerol as described in Section 2.5.2.
Figure A.VIII.2. Logged pH, DO2, temperature and agitation speed for the E. coli fermentation of Figure VIII.1
Figure A.VIII.3. SDS PAGE gel of the cellular extracts at different intervals of time of the fermentation shown in Figure VIII.1
Figure A.VIII.4. Growth curve as a function of time for the fed batch fermentation of E. coli cells with plasmid pQR801 as described in Section 2.8.3.
Figure A.VIII.5. Logged pH, temperature, DOT and RPM for the fed batch fermentation of Figure VIII.4.
Figure A.VIII.6 SDS PAGE gel for different interval samples of the fermentation shown in Figure VIII.5.

List of Figures
20
Figure A.IX.1. Progress curves of whole cell TK mediated synthesis of APD from substrates PKD and MBA.
Figure A.IX.2. Progress curves of whole cell TK mediated synthesis of APD from substrates PKD and MBA (continuation from Figure A.IX.1).
Figure A.X.1. Progress curves of whole cell TK mediated synthesis of APD from substrates PKD and MBA.
Figure A.X.2. Progress curves of whole cell TK mediated synthesis of PKD from substrates PKD and MBA (continuation from Figure A.X.1).
Figure A.XI.1. TAm mediated synthesis of ABT with ERY and IPA as substrates.
Figure A.X1.2. TAm mediated synthesis of APD with PKD and IPA as substrates.
Figure A.XII.1. LC-ECI-MS analysis for reaction mixture with ABT produced from individual TAm bioconversion using ERY and MBA as substrates.
Figure A.XII.2. LC-ECI-MS analysis for reaction mixture with ABT produced from dual-TK-TAm multi-step bioconversion (Scheme 3.1).

LIST OF TABLES
Table 2.1. Composition of the LB-glycerol medium used in all batch E. coli fermentations.
Table 2.2. His6-tag enzyme purification buffers used in Section 2.6.2.
Table 3.1. Measured specific activities, product yields and ee for the TK lysate catalyzed bioconversions shown in Figure 3.7. The specific activities were determined as described in Section 2.8.1.
Table 3.2. Measured specific activities and product yields for the TAm catalyzed conversion of PKD and ERY. The specific activities were determined as describe in Section 2.8.1.
Table 4.1. Initial experimental substrate and enzyme concentrations for the 12 progress curves used to obtain the kinetic parameters in Steps 4 and 5 of the methodology described in Figure 4.1.
Table 4.2. Initial and final “reconciled” values for the parameters obtained in Step 5 of Figure 4.1 using the full kinetic model represented by Equation 4.1.
Table 5.1. Growth and enzyme expression results for the dual E. coli biocatalyst produced in shake flasks, 2 L and 7.5 L fermentations as shown in Figures 3.1, 5.1 and 5.4 respectively.
Table 5.2. Bioconversion kinetics comparison of the one pot APD synthesis shown in Figures 5.6 and 5.7 using biocatalyst produced at shake flask (Section 3.3.3) and 7.5 L fermentor (Section 5.3.1.2) scales.
List of Tables
23
Table 6.1. Experimental values of the apparent kinetic parameters of Equation 6.1 for the synthesis of PKD catalyzed by a whole cell E. coli biocatalysts containing the TK mutant D469E.
Table 6.2. Experimental values of the apparent kinetic parameters of Equation 6.2 for the synthesis of APD catalyzed by a whole cell E. coli biocatalyst containing the CV2025 TAm.
Table 6.3. Comparison of the different reaction conditions and bioreactors used for the scale-up of the multi-step syntheses from microscale parallel bioreactors (Section 2.8.1) to preparative scale synthesis (Section 2.8.2).
Table 6.4. Experimental and predicted apparent kinetic results for the one-pot synthesis of APD shown in Figure 6.3 using microscale experimentation (Section 3.8.1) and a preparative scale bioreactor (Section 3.8.2).
Table 6.5. Reported values by Chen et al., (2009) for the kinetic parameters of Equation 6.3 for the synthesis of ERY catalyzed by E. coli wild type TK.
Table 6.6. Experimental and predicted apparent kinetic results of the one pot synthesis of ABT shown in Figure 6.4 using microscale experimentation (2.8.1) and a preparative scale bioreactor (Section 2.8.2).
Table A.VI.1. Initial experimental substrate concentrations for the 12 progress curves used to obtain the kinetic parameters in Steps 4 and 5 of the methodology described in Figure 4.1 for the synthesis of ABT using CV2025 TAm whole cells.
Table A.IX.1 Initial experimental substrate and enzyme concentrations for the 9 progress curves used to obtain the kinetic parameters in Steps 4 and 5 of the methodology described in Figure 4.1 for the synthesis of PKD using TK D469E whole cells.
Table A.X.1. Initial experimental substrate and enzyme concentrations for the 9 progress curves used to obtain the kinetic parameters in Steps 4 and 5 of the methodology described in Figure 4.1 for the synthesis of APD using CV2025 TAm whole cells.

NOMENCLATURE AND ABBREVIATIONS
A260 Absorbance at 260 nm ABT (2S,3R)-2-amino-1,3,4-butanetriol AP Acetophenone APD (2S,3S)-2-aminopentane-1,3-diol BRENDA Braunschweig Enzyme Database c Protein concentration in mol L-1. CO2 Carbon dioxide CV20205 Chromacterium Violaceum 20205 dB Width of baffle (mm) di Diameter of impeller (mm) DNA Deoxyribonucleic acid DOT Dissolved oxygen tension (%) dT Diameter of vessel (mm) ε Extinction coefficient E. coli Escherichia coli EDTA Ethylenediaminetetraacetic acid ee Enantiomeric excess EiTAm Transaminase concentration EiTK Transketolase concentration E-PLP Transaminase –PLP complex E-PMP Transaminase –PMP complex EtOA Ethyl alcohol F Feed rate (L hr-1), FeedRate Feeding rate of MBA solution (L min-1) λ Path length equal to 1 cm g Gram GA Glycoaldehyde gDCW Grams of dry cell weight HEPES N−2−hydroxyethylpiperazine−N’−ethanesulphonic acid His6-tag 6x histidine- tagged
Nomenclature and Abbreviations
24
HPA Hydroxypyruvate HPLC High pressure liquid chromatography IPA Isopropylamine IPTG Isopropyl β-D-1-thiogalactopyranoside K1 Equilibrium constant of the first half reaction of transaminase
K2 Equilibrium constant of the second half reaction of transaminase KABT Michaelis-Menten constant of ABT KABT Michaelis-Menten constant of APT KAP Michaelis-Menten constant of AP kDa Kilo Dalton Keq Equilibrium constant KERY Michaelis-Menten constant of ERY kf Catalytic rate constant for the forward reaction KGA Michaelis-Menten constant of GA KHPA Michaelis-Menten constant of HPA KiABT Inhibition constant of ABT KiAP Inhibition constant of AP KiAPD Inhibition constant of APD KiERY Inhibition constant of ERY KiGA Inhibition constant of GA KiHPA Inhibition constant of HPA KiMBA Inhibition constants of MBA KiPA Inhibition constant of PA KiPKD Inhibition constant of PKD KMBA Michaelis-Menten constant of MBA KPA Michaelis-Menten constant of PA
kr Catalytic rate constant for the reverse reaction L Litre LB Luria Bertrani lGM Phosphoglucomutase MBA Methybenzylamine MBAFeed Concentration of MBA in the feed MeOH Methanol Mg Magnesium mg Milligram min Minute

Nomenclature and Abbreviations
25
mL Millilitre mM Millimolar mmol Millimol NaOH Sodium Hydroxide Ni Nickel OD600 Optical density at 600 nm PA Propionaldehyde PK Pyruvate kinase PKD (S)-1,3-dihydroxypentan-2-one PLP Pyridoxal 5´phospahte pmol Picomol PMP Pyridoxamine phosphate PP Pyrophsphate-binding domain PPG Polypropylene glycol Ri kinetic reaction rate of compound i (mM min-1) RO Reverse osmosis rpm Revolutions per minute SA Static surface area SDS-PAGE Sodium dodecyl sulfate polyacrylamide gel electrophoresis t Time TAm Transaminase TFA Trifluoroacetic acid TK Transketolase TPP Thiamine pyrophosphate TRIS Tris(hydroxymethyl)aminomethane U Units of enzyme activity (µmolmin-1) µ Specific growth rate (h-1) UDP Uridine 5'-diphosphate UDPGE UDP-galactose µL Microlitre µm Micrometer µmax Maximum specific growth rate (h-1) µmol Micromole UTP Uridine 5'-triphosphate UV/Vis Ultra violet / visible v Reaction rate (mmol/min) V Volume (L)

Nomenclature and Abbreviations
26
V.fluvialis Vibrio Fluvialis v/v Volume by volume Vol Working reaction volume (L) VW Total well volume Wt Wilde type x Cell biomass (gDCW L-1), Y Yield of cell mass per unit of carbon source of glycerol (g g-1 ) ω-TAm ω-transaminase

1. INTRODUCTION AND AIMS OF THE
PROJECT
The chemist who designs and completes an
original and aesthetically pleasing multi-step
synthesis is like the composer, artist or poet
who, with great individuality, fashions new
forms of beauty from the interplay of mind and
spirit (Elias James Corey, Nobel lecture, 1990).
1.1. Introduction to multi-enzyme catalysis
Enzymes have demonstrated their usefulness for chemical organic synthesis due to their
moderate reaction conditions, reduced environmental impact, and their high chemo-,
regio- and stereo-selectivity (Whitesides & Wong, 1985; Straathof et al., 2002; Woodley,
2008). In many cases, enzymes have emerged as the only tool to achieve the direct
preparation of optically active compounds, resulting in many commercial applications

Chapter 1: Introduction and Aims
28
where the key feature is the enzymatic asymmetrical synthesis (Schmid et al., 2001;
Breuer et al., 2004).
Conventional biocatalytic process development has focused on single reactions and their
optimization (Murzin, 2008). Nevertheless, Nature did not design enzymes to be used in
isolation, instead living beings have evolved effective multi-enzymatic strategies to
synthesize and build complex structures from simple substrates (Roessner & Scott,
1996b). Enzymes working in cascades lead to important advantages to the cells in terms
of storage and consumption of energy. It also enables them to minimize metabolic waste,
make a reversible reaction irreversible, avoid the purification step of intermediates, and
minimize inhibition or toxic effects of metabolites by keeping their concentration low
among many other benefits (Bruggink et al., 2003; Schultheisz et al., 2008).
It was not until the late 1980s, with the discovery of the polymerase chain reaction, and
the further development of metabolic engineering tools, that scientists started to mimic
the exquisite multi-step efficiency shown by enzymes in Nature (Chotani et al., 2000).
This has led to the successful investigation of multi-step, metabolically engineered
pathways towards application as pharmaceutical production platforms (Burkart, 2003).
Nowadays, it is possible to design de novo non-native engineered pathways in
heterologous hosts, to carry out specific non-natural bioconversions producing chiral
compounds, difficult to obtain by existing biosynthetic pathways or chemical synthesis
(Roessner & Scott, 1996; Prather & Martin, 2008; Martin et al.,2009; Dalby et al., 2009) .
This has led to the rapid expansion of molecular pathway construction, creating
opportunities for the synthesis of a broad range of fine chemicals and pharmaceutical
intermediates (Wilkinson and Bachmann, 2006). However, those opportunities have been
rarely applied beyond laboratory scale, because such de novo engineered pathways are
difficult to assemble, model, scale-up and operate productively (Meyer et al., 2007). In
order to overcome those complexities, recent advances in protein engineering (Hibbert et

Chapter 1: Introduction and Aims
29
al., 2005; Dalby et al., 2009), microscale high-throughput methods (Lye et al., 2003;
Micheletti & Lye, 2006), and modelling tools for biochemical processes (Chou & Voit,
2009; Sin et al., 2009) can be applied to facilitate the rational design of such systems.
This would enable to harvest the potential of de novo pathways, leading to a greater
integration of such systems in industrial scale synthesis (Lye et al., 2002).
1.2. Classification of multi-enzymatic processes
A multi-step enzymatic process uses two or more enzymes via parallel, cascade, or
network configurations to achieve a desired synthesis (Findrik, 2009). Several
classifications have been proposed for multi-enzymatic processes, depending on the
nature of the biocatalyst (living cell, artificial cell, lysate, pure enzymes etc), the number
of enzymes, vessels or recovery steps, integration with other type of catalysts
(enzymatic, chemo-enzymatic etc), the purpose of the extra steps (equilibrium shift,
cofactor regeneration, deracemization etc) among many other categories (Schilling et al.,
1999; Bruggink et al., 2003; Hailes et al., 2007; Murzin, 2008). In this work, a simplified
version of the classification proposed by Santacoloma et al., (2011) has been followed,
and is represented in Figure 1.2.
Figure 1.1. Classification of a multi-enzymatic process. Figure modified from Santacoloma et al.,
(2011).

Chapter 1: Introduction and Aims
30
In the first hierarchy, the multi-enzymatic processes have been classified as in vivo when
the biocatalytic steps are carried out inside a living cell, and ex vivo when the reactions
take place outside the cell.
Depending on the characteristics of the process and degree of compatibility of each
enzyme, an in vitro multi-enzymatic synthesis can be operated in multiple or single
reactors. For an in vivo synthesis, the metabolic pathway inside the cell cannot be
separated into individual reactions, therefore is not feasible to carry out the process in
more than one reactor (Findrik, 2009; Santacoloma et al., 2011). Those systems where a
bioconversion is carried out using two or more enzymes in a single bioreactor are referred
as “one-pot” synthesis, and the next sections will focus on this type of multi-step
bioconversions.
1.2.1. One-pot synthesis
The traditional step-by-step approach to convert a starting material A into a final product
D is using a single reactor for each enzymatic bioconversion step, in which intermediate
products B and C would be isolated and purified for each conversion step (Figure 1.2a)
(Bruggink et al., 2003). Such systems present the disadvantages of low overall yields due
to loses in each separation step, higher capital investment, longer reaction times,
laborious recycle loops and large amounts of waste produced in each downstream outlet
(Findrik, 2009). In contrast, in a multi-enzymatic one-pot synthesis, a starting material A
is converted by a set of enzymes in a single vessel to produce the final product D without
separation of intermediates B and C (Figure 1.2b) (Sheldon, 2008).

Chapter 1: Introduction and Aims
31
Figure 1.2. Configurations of a multi-step synthesis. (a) Traditional multiple bioreactors syntheses
used in industry which involves a recovery step after each bioconversion. (b) One-pot synthesis as it
is done in the cells which involves coupled reactions without intermediate recovery steps. Figure
adapted from Bruggink et al., (2003) and from Sheldon, (2008).
In such one-pot processes, all the enzymes working together can be exploited
simultaneously, leading to a reduction in the global reaction time, a decrease in the
concentration of toxic intermediates, an improvement in the half life of the enzymes, an
increase in the overall yield of the reaction, in addition to a considerable reduction in
downstream processing and operation costs (Ingram et al., 2007; Murzin, 2008; Findrik,
2009; Kalaitzakis & Smonou, 2010).
However, the one-pot multi-step synthesis offers many challenges, given that each
enzyme may have disparate optimal conditions; therefore optimum global conditions
need to be identified, usually at the expenses of the most favourable kinetic steps in order
to alleviate bottlenecks (Murzin, 2008). Non-beneficial side reactions between different
promiscuous enzymes and the intermediates that occur as a result, diminish the final yield
and severely affect the global economic performance of the process (Schmid et al.,
2001; Pollard & Woodley, 2007). In addition, the global rate of the steps should be
harmonized, avoiding the accumulation of toxic intermediates due to a fast reaction step,

Chapter 1: Introduction and Aims
32
as well as the substrate “starving” of another step, diminishing the benefits of the
sequential operation (Roessner & Scott, 1996; Murzin, 2008).
Many different one-pot syntheses have tackled those initial challenges, and have been
successfully demonstrated at laboratory scale with different objectives like in situ
cofactor regeneration (Chenault et al., 1998; Schultheisz et al., 2008; Van Hecke et al.,
2009), deracemization (Caligiuri et al., 2006; Koszelewski et al., 2009) and cascade
biocatalysis (Ingram et al., 2007; Chi et al., 2008). A very complete review has been
made by Bruggink et al., (2003) covering multi-step one-pot synthesis using pure
enzymatic, chemoenzymatic, homogeneous and heterogeneous catalytic reactions,
highlighting the many options and tools available for the synthetic scientist to design one-
pot process. In the following sections, the main advantages about in vivo and ex vivo
multi-enzymatic one-pot synthesis will discussed and relevant examples will be given;
special emphasis will be given to the in vivo de novo pathways.
1.2.1.1. Ex vivo one-pot synthesis
When an enzyme is taken out the cell to perform a specific function, the process is
considered ex vivo. Therefore, the application of several isolated enzymes in a single
vessel can be viewed as a multi-step ex vivo synthesis (Roessner & Scott, 1996). Ex vivo
processes can make use of catalysts in different forms, such as the trapping or enzymes in
polymeric microcapsules (artificial cells) (Chang, 1988; Chi et al., 2008), immobilized
enzymes (Sheldon, 2007; Matosevic et al., 2011) or cellular extracts and purified
enzymes (Li et al., 1993; Woodley, 2006).
Using all those different forms of biocatalysts, elegant one-pot syntheses have been
achieved, including an 8 enzyme one-pot synthesis of N-acetyllactosamine, involving the
required regeneration of uridine 5'-diphosphate as shown in Figure 1.3 (Wong et al.,
1982).

Chapter 1: Introduction and Aims
33
Figure 1.3. Multi-step synthesis of N-acetyllactosamine. Abbreviations: UDP: uridine 5'-
diphosphate; UTP: uridine 5'-triphosphate; UDPGE: UDP-galactose 4'-epimerase; Gal transferase:
galactosyl transferase; UDPGP: UDP-glucose pyrophosphorylase ; lGM: phosphoglucomutase; PK:
pyruvate kinase; β-D-Gal(14 )-D-GlcNAc: N-acetyllactosamine. Figure adapted from Wong et al.,
(1982).
A 12 step one-pot synthesis of a precursor of vitamin B12 has been achieved using
purified cells, reaching an individual yield higher than 90% for each step, leading to an
overall 20% yield mol/mol (Roessner et al., 1994; Scott, 1994; Roessner & Scott,
1996b). Of special interest is the 8 enzyme one-pot synthesis of riboflavin, where 6
enzymes performed synthetic steps and 2 were involved in cofactor regeneration
achieving a final yield of 35% mol/mol (Rumisch et al., 2002).
The previous syntheses demonstrated the potential of ex vivo multi step one-pot synthesis.
While it requires the isolation of the enzymes, ex vivo systems are not hampered by mass
transfer limitations caused by the cell wall, they can work at conditions toxic for a cell
such as high substrates or solvent concentrations, and avoid the cellular metabolic

Chapter 1: Introduction and Aims
34
pathway interference, which may compete for substrates (Roessner & Scott 1996a;
Schultheisz et al., 2008; Santacoloma et al., 2011). Apart from its potential in synthesis,
ex vivo systems are ideal for protein function identification due to the flexibility that they
offer to the scientist to manipulate the enzymes, substrates and intermediates without any
cellular background (Kajiwara et al., 2006).
The main drawback for ex vivo one-pot synthesis is that the cost associated to purify the
enzymes usually does not allow scaling up the process beyond research scale
(Rozzell, 1999; Meyer et al., 2007). It has been estimated that for a commercial process, a
metric defined as cost of product/cost of gram of enzyme should be at least 1000 for a
purified enzyme compared to 15 using a whole cell system, reflecting the difference in
costs for each biocatalyst form (Pollard & Woodley, 2007). Immobilization will play an
important role in lowering the associated costs of purification by recycling the enzyme
(Sheldon, 2007; Tufvesson et al., 2010).
In vivo biocatalysis is a solution that can reduce the cost of production of the several
enzymes involved in a multi-step synthesis; this type of system will be studied in more
detail in Section 1.2.3.
1.2.1.2. In vivo one-pot synthesis
In vivo biocatalysis is considered the cheaper alternative for multi-step synthesis,
because it has the potential to synthesize of all the desired enzymes within a single host,
without any further processing (Woodley, 2006). With the advances in fermentation
technology, using fed-batch strategies can allow cell cultures to easily reach bacterial
densities of 50 to 100 g L-1 with up to 40% of the total protein being the desired enzyme
(Lee, 1996; Shiloach & Fass, 2005). New trends in fermentation for biocatalyst
production using Pichia Pastoris as the host cells could increase the yield of the cell
density and the desired enzymes by 1 order of magnitude (Payne et al., 1997; Macauley-
Patrick et al., 2005).

Chapter 1: Introduction and Aims
35
In addition, in vivo biocatalysis has the potential advantages of increasing the stability of
the enzymes, especially for membrane bounds proteins or enzymes that require accessory
cellular systems, as well as enabling easy regeneration of expensive cofactors, including
sources of reducing equivalents and ATP among others (Wilkinson & Bachmann, 2006;
Tufvesson et al., 2010).
Nevertheless, optimizing an expression system for in vivo biocatalysis is not
straightforward, and many variables can have an impact on the production efficiency, like
the choice of the vector, inducer system, medium composition, and growth conditions
among others (Thiry & Cingolani, 2002). In vivo systems are generally more complex
than their ex vivo counterparts, due to the complexity of the cellular metabolic network
that is still present during the biocatalysis, therefore they present more challenges to be
assembled and operated efficiently (Tyo et al., 2007). Special care needs to be taken to
avoid side reactions, and a certain ‘insulation’ of the cellular metabolism can be obtained
through the overexpression of the target genes relative to the background (Meyer et al.,
2007). New approaches to minimize the harmful interference of the cellular metabolism
include the use of reduced genomes, like the E. coli minima genome project (Pósfai et al.,
2006).
Advances in metabolic engineering over the past 25 years have resulted in the
engineering of microorganisms for the production of high value products for industrial
scale (Burkart, 2003). Successful examples are the production of antibiotics (Li &
Townsend, 2006; Rokem et al., 2007) or amino acids (Lee et al., 2007; Sprenger, 2007)
using native engineered hosts. New tools of metabolic engineering have allowed the
complete expression of heterologous pathways in new hosts with better growth and
protein expression characteristics (Pfeifer, 2001; Carter et al., 2003).
Those previously mentioned examples show how in vivo one-pot synthesis using the
metabolic engineering tools have become a reality (Tyo et al., 2007). Those examples
focused on the manipulation and optimization of existing natural pathways. However in

Chapter 1: Introduction and Aims
36
order to take advantage of the full potential of the in vivo synthesis, it is necessary to shift
towards the design of new de novo engineered pathways for both natural and unnatural
compounds (Prather & Martin, 2008). The necessity arises due to the fact that the number
of compounds of commercial interest greatly outnumbers the available characterized
natural pathways and enzymes (Martin et al., 2009). From a top 12 list of biochemical
targets highlighted by the U.S Department of Energy, only half had a known biochemical
synthetic route (Werpy, 2004).
Prather & Martin (2008) classified synthetic engineered pathways not fully recruited from
a single source in three categories as described in Figure 1.4. In the first category,
different pathways can be gathered from different microorganisms and combined in a
single host. Secondly, pathways can also be modified to produce new non-natural
compounds. Lastly, by combining the previous two approaches, which are the
recruitment of biosynthetic components from different sources and the modification of
those components for new catalytic capabilities, lead to the third approach commonly
known as de novo pathway design, which will be discussed with more detail in the next
section 1.2.3.1.
Figure 1.4. Strategies for pathway design to perform one-pot in vivo synthesis. (a) The pathway
from S to I is from one organism while from I to P is from another. (b) New products Pi are produced
from modifications or extensions of an existing pathway. (c) Each step in the pathway is proposed
independently. This work will focus especially in this approach. Figure adapted from Prather &
Martin (2008).

Chapter 1: Introduction and Aims
37
1.2.1.3. De novo pathway design
The essence that distinguishes a de novo pathway from the previously mentioned
engineered pathways is that its design begins from scratch, without relying upon any
natural precedent (Tyo et al., 2007; McArthur & Fong, 2010). Its creation involves
linking unrelated enzymes towards the synthesis of unnatural compounds of high value.
In theory, this approach offers incredible opportunities to synthesize a wide range of
compounds, by taking advantage of the natural diversity of enzymes across species
(Ferrer et al., 2005). Nevertheless, several big challenges and obstacles remain to be
solved for de novo pathway design, due to the complete unnatural characteristic of the
pathway, which may result in no natural set of enzymes capable to integrate it (Sprenger,
2007) . Therefore protein engineering tools emerges as a solution to compensate for the
lack of natural enzymes to catalyze unnatural substrates (Dalby et al., 2009).
Few successful examples of de novo pathways exist nowadays which have solved this
challenge, like the synthesis of the energetic material precursor 1,2,4-butanetriol, were
multiple enzymes from Pseudomonas fragi and putida combined with native E. coli
enzymes were screened to successfully design the de novo the pathway (Niu et al. 2003).
Also several biofuels like isobutanol and 2-phenylethanol were successfully synthesized
using a de novo pathway, by screening and exploiting the promiscuity of several enzymes
of Lactococcus lactis and E. coli (Lee et al., 2008). An example of a de novo pathway
used engineered enzymes of Porphyromonas gingivalis combined with E. coli enzymes,
allowing the synthesis of 3-hydroxypropionic acid (Brazeau et al., 2006). A last elegant
example involved the combination of an engineered pyruvate decarboxylase and 2-
isopropylmalate synthase, which allowed the synthesis of a broad range of unnatural
alcohols (Zhang et al., 2008).
In the previous examples, the objective of designing a de novo pathway was to find the
best combination of enzymes that could work together in vivo to produce a new desired
compound. Those enzymes could be wild type or engineered, and theoretically many
Chapter 1: Introduction and Aims
38
possibilities will exist, therefore tools that would allow the identification and
characterization of the different enzymes to select the best combination is a central
challenge of de novo pathway design (McArthur & Fong, 2010). High throughput
microscale instrumentation combined with protein engineering and mathematical models
would create a powerful tool to rapidly solve those problems. Those tools will be
discussed in the Section 1.3.
1.3. Microscale high-throughput experimentation
Establishing an industrial biocatalytic bioconversion is usually a slow process compared
with the traditional chemical routes (Yazbeck et al., 2004). This is due to the necessity to
screen a large set of biocatalyst libraries in order to identify the appropriate enzymes,
followed by large amount of data that needs to be collected at each stage of the process
development (Lye et al., 2003; Fernandes, 2010). New strategies that could handle a large
quantity of experiments in order to test all the different enzymes are necessary. High-
throughput microscale techniques offer the potential to overcome those problems by
considerably speeding up the process development with a minimum quantity of materials
and time (Micheletti & Lye, 2006). The key advantages of such techniques are: (Lye et
al., 2002, Lye et al., 2003).
• Rapid evaluation of large enzyme libraries.
• Reduction in the quantity of materials including expensive enzymes and substrates
required for process development.
• Rapid generation of early data for process design and models establishment
predictive of larger scale operations.
• Early identification of the optimum reaction conditions and reactor configurations.
• Capacity to automate the complete bioprocess.
• Promotion of a rapid and efficient translation from discovery to pilot plant scale.
Chapter 1: Introduction and Aims
39
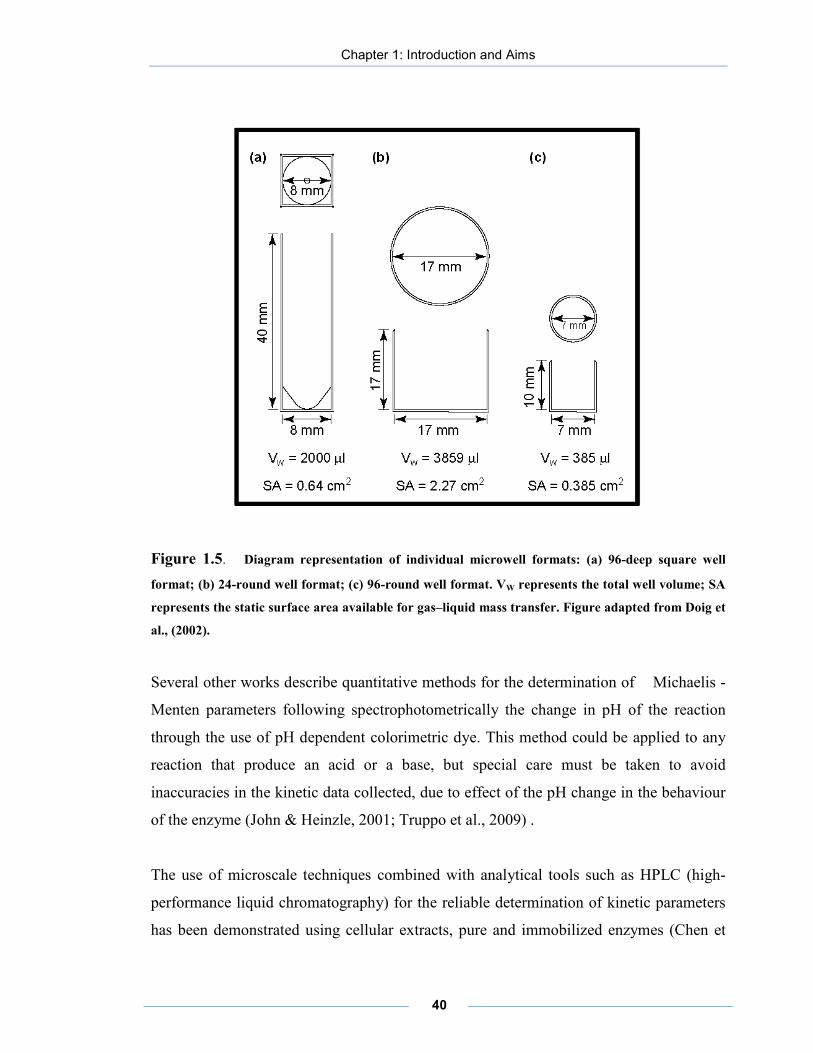
The majority of the microscale bioprocesses studies have been performed on microwell
systems of different geometries and sizes with scales ranging from 20 to 2000 µL (Doig
et al., 2002). Figure 1.5 shows the dimensions of 3 standard size microwell bioreactors.
Although the use of microscale techniques has been heavily used since the last 2 decades
for screening purposes, it is only recently that studies on fundamental engineering aspects
have been performed, including mass and heat transfer phenomena and scaling up
techniques (Zhang et al., 2008; Marques et al., 2009; Barrett et al., 2010).
Of special interest is the liquid mixing in such small reactors, which behave different
from larger scale processes in terms of the importance of diffusion and convection
(Matosevic et al., 2008). Orbital shaking of microwell plates has been found to be the
most efficient way to promote mixing, and several studies have been conducted to
determine the critical speed to assure an uniform mixing (Micheletti et al., 2006). These
studies have lead to a better understanding of the reaction conditions and engineering
principles of the microscale tools, allowing the establishment of key parameters for
efficient scale-up (Islam et al., 2008) .
Recent studies have also focused on the quantification of enzyme kinetics using
microscale tools (Lye et al., 2002). Of special interest is a study of a whole cell
cyclohexanone monooxygenase performing the oxidation of bicyclic ketones to
synthesize chiral lactones ( Doig et al., 2002). In that work, the authors were able to
characterize the oxygen mass transfer behavior under different reaction conditions and
microwell geometries, as well as determining accurately substrate inhibition parameters.
Chapter 1: Introduction and Aims
40
Figure 1.5. Diagram representation of individual microwell formats: (a) 96-deep square well
format; (b) 24-round well format; (c) 96-round well format. VW represents the total well volume; SA
represents the static surface area available for gas–liquid mass transfer. Figure adapted from Doig et
al., (2002).
Several other works describe quantitative methods for the determination of Michaelis -
Menten parameters following spectrophotometrically the change in pH of the reaction
through the use of pH dependent colorimetric dye. This method could be applied to any
reaction that produce an acid or a base, but special care must be taken to avoid
inaccuracies in the kinetic data collected, due to effect of the pH change in the behaviour
of the enzyme (John & Heinzle, 2001; Truppo et al., 2009) .
The use of microscale techniques combined with analytical tools such as HPLC (high-
performance liquid chromatography) for the reliable determination of kinetic parameters
has been demonstrated using cellular extracts, pure and immobilized enzymes (Chen et

Chapter 1: Introduction and Aims
41
al., 2008; Matosevic et al., 2011). Of special interest is the work from Chen et al., (2009),
where a full kinetic model was established using automated microscale tools, evaluating
key parameters such as substrate and product inhibition.
Therefore microscale bioprocessing techniques emerge as an ideal tool that can be used to
study and evaluate the different components of a complex bioprocess such as a de novo
pathway, in order to generate quantitative data early on to better inform the process
design, as will be discussed in the next Section 1.3.1 .
1.3.1. Microscale processing techniques for de novo pathway design
Microscale high-throughput would allow for the evaluation of each the de novo pathway,
allowing the determination of the best enzyme candidate of each step under the global
conditions of the one-pot synthesis.
Therefore, a retro-biosynthetic approach, similar to the one used in organic chemistry to
design the synthesis target compounds, could be applied to design the de novo pathway
(Prather & Martin, 2008). The approach would consider the bioconversion of functional
groups rather than considering entire structures or initial substrates (Yazbeck et al.,
2004). This retro-biosynthetic approach offers the challenge to be able to take advantage
of the huge diversity of enzymes across species and also the engineered ones.
Nevertheless a methodology is necessary to be able to cope with the expanded
possibilities of synthesis that de novo pathways offer, and microscale techniques emerge
as a powerful tool to assist in that aspect. Figure 1.6 shows the proposed retro-
biosynthetic methodology to design a de novo pathway, where microscale
instrumentation plays a crucial role.

Chapter 1: Introduction and Aims
42
Figure 1.6. Methodology proposed in this work to design and optimize a de novo pathway for rapid
process development.
Starting from a desired compound with specific functional groups, an enzyme recruitment
step needs to be performed selecting many potential candidates for each individual
reaction that needs to be performed. The recruitment could be made from databases like
BRENDA (Schomburg et al., 2004) or SWISE PROT (Wu et al., 2006), or from specific
previously developed libraries gathered in a particular laboratory. Using the high-
throughput microscale tools, all the candidates could be evaluate under a defined set of
conditions, and rankings could be given to each set of enzymes depending on their
performance. Those “rankings” would inform in the identification of the best candidates
for each reaction step, and also in the early determination of steps where new rounds of
protein engineering were necessary.
Further characterization of the selected enzymes could be rapidly achieved due to the
nature of the high-throughput platform, in order to develop mathematical models to
predict and characterize the kinetic behaviour of each selected enzyme. This would have
a considerable impact in the assembly of the de novo pathway, where cellular resources
and physical space limit the overexpression of all the enzymes in a single cell (Tyo et al.,
2007). Therefore the determination of the catalytic steps where strong overexpression

Chapter 1: Introduction and Aims
43
needs to be achieved to overcome the slower kinetic rate is necessary, at the expenses of
the expression of the most kinetically fast enzymes.
The scalable nature of the microscale tools discussed in Section 1.3 would allow
predicting larger scale operations. Hence the performance of the de novo pathway under
many scenarios and reactor configurations could be analyzed. This would speed up the
determination of the best reaction conditions, which would translate in a faster process
development to manufacturing scale. The development of such models will be review in
Section 1.4.
1.4. Modelling of biocatalytic processes.
Mathematical models are tools that contain information of a process in order to describe
its behaviour under a limited set of physical conditions (Jimenez-Gonzalez & Woodley,
2010). For biocatalytic processes, they usually consist on differential and non-linear
algebraic equations that describe the mass balance of substrates, intermediates and
products as well and the different reaction rates (Meyer et al. 2007). Apart from
promoting fundamental process understanding, such models can predict the outcomes
under different scenarios and reactor configurations, enabling substantial time saving for
the identification of the optimum reaction conditions (Chou & Voit, 2009; Santacoloma
et al.,2011).
Sin et al., (2009) classified the models developed in biocatalysis according to their scope
in the following categories:
• Enzyme: models aims to understand the molecular structure of the enzyme,
explaining the interaction of the enzyme-substrate at a molecular level, leading to
the prediction of the stereo-selectivity of an enzyme catalyzed conversion.
• Reaction: kinetic models describing reaction mechanism and reaction rate based on
detectable and controllable inputs like concentration, pH and temperature.

Chapter 1: Introduction and Aims
44
• Reactor configuration: kinetic models describing the reaction rates and final
outcomes in different reactor configurations. Those models include mass balance as
well as transport phenomena conditions.
• Process: models allowing the analysis of the global performance of a process,
including the interaction between different unit operations.
An illustrative representation of the different scopes of each type of model has been
shown in Figure 1.7.
Figure 1.7. Representation of different models applied in biocatalysis categorized in the order of
increasing scope: (1) intrinsic properties of the enzyme, (2) reaction kinetics, (3) reactor kinetics, and
(4) process dynamics. Figure adapted from Sin et al., (2009).
Each model scope and the combinations of them can have their own increasing
complexities. Nevertheless the more complex the model is, the more time and resources it
will consume to be established(Sin et al., 2009). This can hamper the overall objective of
establishing the models which is to speed up process development (Law et al., 2008).
Therefore simplifications of the models need to be done, in order to speed up the design
of a de novo pathway. For example, in the early screening procedure of the individual
enzymes using the microscale techniques described in Figure 1.6; simple models
describing the specific activity of the different enzymes could be used as the rankings for

Chapter 1: Introduction and Aims
45
decision making tools. Also, those simplified models could quickly permit the selection
of appropriate reaction conditions for the overall one-pot synthesis.
When a potential candidate has been selected, the model complexity should be increased
to establish the reaction kinetic model. The objective of the model would be to
understand possible bottlenecks of the step (in order to inform subsequent protein
engineering rounds), as well as to predict different scenarios to determine the best
reaction conditions. The kinetic model developed in this step should not necessarily be
very accurate in the enzyme scope level, as obtaining a complete understanding of the
interaction of the enzyme-substrate at a molecular level would be time consuming,
without necessarily bringing much extra information to impact in the decision making.
To finalize, when the kinetic models of the different steps have been established, they
should be compared in order to identify the major bottleneck of the reaction, which will
define the overall rate of the one-pot synthesis. Reactor models should be used to
determine the best reaction configuration that would benefit each individual step. The
reactor configuration should be selected to overcome the previously major detected
bottleneck step of the reaction.
Therefore a global reaction model should be constructed which should integrate all the
kinetic models and the selected reactor configuration. This model should enable to predict
the global performance of the one-pot synthesis as well as the different simultaneous
interactions between the different catalytic steps. In a one-pot synthesis, there is still
room to modify different reaction conditions and configurations over the time of the
bioconversion. For example, switching from a batch mode to a fed-batch transformation
or changing the pH to switch on and off different enzymes could bring benefits
(Schoevaart et al., 2000). The possibility to manipulate those conditions with perfect
timing in order to optimize the overall one-pot synthesis only becomes a possibility due
to the establishment of the different kinetic models.

Chapter 1: Introduction and Aims
46
1.4.1. Strategies to establish biocatalytic kinetic models
Figure 1.8 describes the general steps followed to establish kinetic mathematical models
for bioprocesses (Sin et al., 2009).
Figure 1.8. General common steps involved in the establishment of biocatalytic mathematical
models, arrows indicate feedback loops between steps. Figure adapted from Sin et al., (2007).
This procedure should be applied to the “model generation” section represented in Figure
1.6. After establishing the objective of the model which will define the scope of
mathematical model (reaction level scope for selected enzyme candidates) (Figure 1.7),
experimental work should be planned and performed in order to establish the model
structure and its corresponding parameters.
Traditional approaches were based on simplification of the kinetic models to linear plots,
like the Lineweaver-Burk method, where the kinetic parameters could be successively
determined using experimental initial rates (Lineweaver & Burk, 1934; Eisenthal &
Crosnish-Bowden, 1974). Those methods have been found to be theoretically
undesirable, because they distort the error weight after linearization of the equations, as

Chapter 1: Introduction and Aims
47
well as presenting large errors in the initial rate determination (Dowd & Rigss, 1965;
Ranaldi et al., 1999). In addition, those methods require a large amount of experiments to
establish all the kinetic parameters including inhibition constants, making them time
consuming and unsuitable for the purpose of speeding up process development (Chen et
al., 2008).
In order to overcome this problem, non-linear regression methods provide an alternative.
In order to determine the kinetic parameters, those methods use optimization algorithms
to fit a defined set of concentrations of substrates and products as a function of time,
minimizing an objective function that punishes deviation between experimental and
predicted data (Blackmond, 2005; Meyer et al., 2007).
The advantages of such techniques are that they consider the data of the full progress
curves, in comparison to the initial rates used in the linear methods, therefore requiring
much less experimentation. Also, they do not distort the error, are programmable and
consequently faster and more reliable (Morbiducci et al., 2005; Chou & Voit, 2009).
However, the large number of parameters that needs to be estimated, and the highly non -
linear nature of the equations can be difficult for the parameters determination (Gernaey
et al., 2010). Initial estimates have been found to play a major role in the quality of the
results using non-linear methods (Moros et al., 1996). Hybrid methods combining
traditional initial rates experiments to identify a solution in the vicinity of the global
minimum, with non-linear regression methods to determine the exact location of the
global minimum have been successful (Katare et al., 2004; Chen et al., 2009).
Establishing a systematic model development methodology will be beneficial and
necessary to design de novo engineered pathways for several reasons (Sin et al., 2009):
• Model development is more efficient, requiring less time and resources.

Chapter 1: Introduction and Aims
48
• Model development becomes a systematic routine, which can be easily applied to
all the different enzymes of the de novo pathway.
• Following the same methodology, the comparison of the kinetic results of the
different enzymes is more transparent.
• Communication and knowledge transfer among the members of a multidisciplinary
team is facilitated.
Nowadays, there are practically no studies where full kinetic analysis and modelling of de
novo engineered pathways have been performed. This is because such multi-step
synthesis are usually focused on non natural substrates with several engineered enzymes
in a same one-pot synthesis, which makes the process complex and requires large
amount of experimentation to characterize (Murzin et al., 2008). By combining the
advantages of high-throughput microscale instrumentation described in Section 1.3, with
a systematic procedure for the establishment of kinetic models, and protein engineering,
powerful toolboxes can be created to rapidly design and optimize de novo pathways as
described in Figure 1.6.
In this work, the de novo synthesis of optically pure amino alcohols using a transaminase
(TAm) and a transketolase (TK) was chosen as an example to demonstrate the
applicability of the toolbox described in Section 1.3.1. In the next Section a state of the
art of the de novo synthesis of amino alcohols will be given, as well as key information
about the enzymes TK and TAm which integrate the pathway.
1.5. De novo pathway for the synthesis of amino alcohols
1.5.1. Relevance of amino alcohols
Due to the fact that the human body functions using chiral metabolites, the trend for new
chiral pharmaceutical compounds is continuing to increase (Breuer et al., 2004). In 2000,
35% of intermediates were chiral and this number is expected to increase to 70% by 2010

Chapter 1: Introduction and Aims
49
(Pollard & Woodley, 2007). Therefore, it is not surprising that the main reasons for using
biocatalysis is to perform synthetic steps with regio- and stereoselective properties
(Schmid et al., 2001). Molecules with more than one chiral centre are compounds
difficult to synthesize with organic chemistry, like the case of amino alcohols which are
an ideal target for multi-step synthesis (Hailes, 2009).
Chiral amino alcohols are of great interest to the pharmaceutical and fine-chemical
industries, since they are used as building blocks for several commercial optically pure
compounds. For example they are necessary in the synthesis of protease inhibitors (Kwon
& Ko, 2002), in particular the protein kinase inhibitor sphingosine (Smal & De Meyts,
1989), or the glycosidase inhibitor deoxymannojirimycin (Fuhrmann et al., 1984) and the
HIV protease inhibitor Saquinavir (Kaldor et al., 1997). Optically pure amino alcohols
are also used in the synthesis of detoxifying agents against antibiotics in the treatment for
rice blast disease (Monache & Zappia, 1999) or serve as chiral starting material in the
synthesis of various optically active molecules such as (S)-amphetamine (Rozwadoska,
1993) or broad spectrum antibiotics like chloramphenicol and thiamphenicol (Bhaskar,
2004; Boruwa et al., 2005).
The standard chemical synthesis route to produce optically pure amino alcohols is usually
complex, requiring many steps in order to obtain the final product, resulting in low
overall productivities (Hailes et al., 2009; Smithies et al., 2009). Using the retro-
biosynthetic approach discussed in Section 1.3.1, TAm was selected to perform the amino
group addition (Ingram et al., 2009), because of its superior features in asymmetric
synthesis with high stereoselectivity and no need for cofactor recycling (Stewart, 2001).
For the chiral alcohol, TK was selected because it could enable asymmetric synthesis of
ketols with high stereoselectivity and no need of cofactors recycling (Ingram et al., 2009),
in addition that it allowed to perform carbon-carbon bond formation, enabling the
synthesis of complex molecules from simpler achiral starting substrates (Turner, 2000).
The principal characteristics of TK and TAm will be summarized in sections 1.5.2 and
1.5.3.
Chapter 1: Introduction and Aims
50
1.5.2. Transketolase
1.5.2.1. Introduction to transketolase
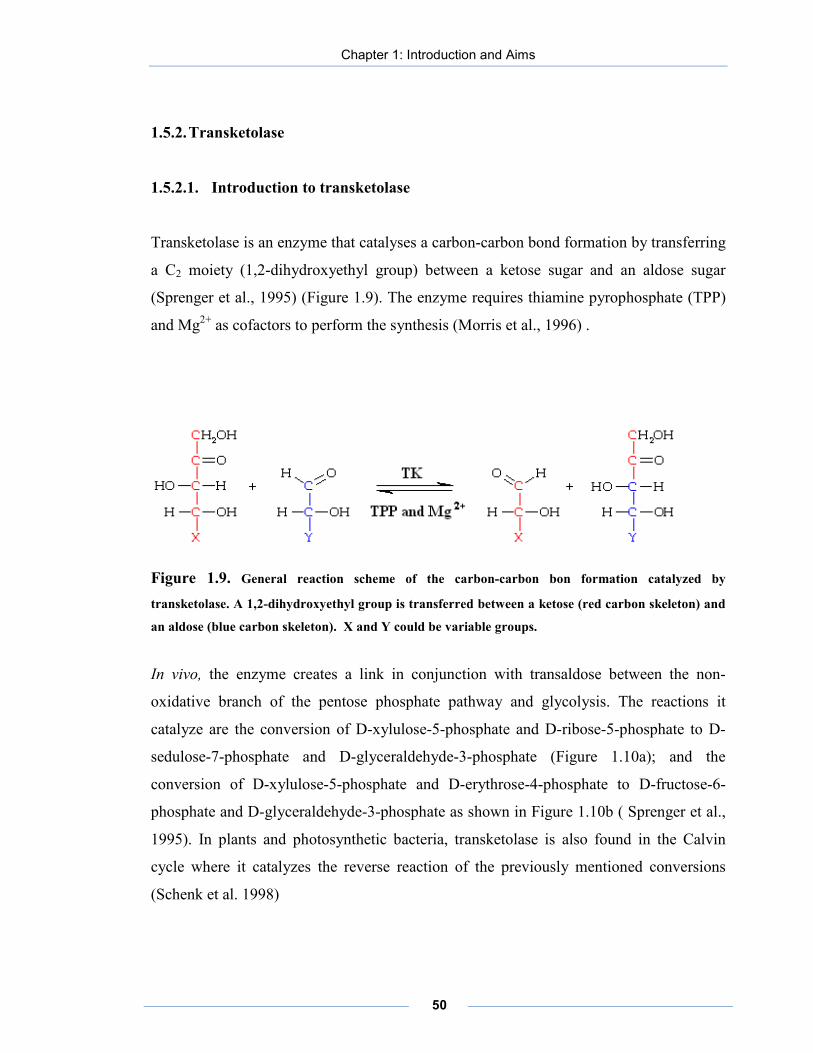
Transketolase is an enzyme that catalyses a carbon-carbon bond formation by transferring
a C2 moiety (1,2-dihydroxyethyl group) between a ketose sugar and an aldose sugar
(Sprenger et al., 1995) (Figure 1.9). The enzyme requires thiamine pyrophosphate (TPP)
and Mg2+ as cofactors to perform the synthesis (Morris et al., 1996) .
Figure 1.9. General reaction scheme of the carbon-carbon bon formation catalyzed by
transketolase. A 1,2-dihydroxyethyl group is transferred between a ketose (red carbon skeleton) and
an aldose (blue carbon skeleton). X and Y could be variable groups.
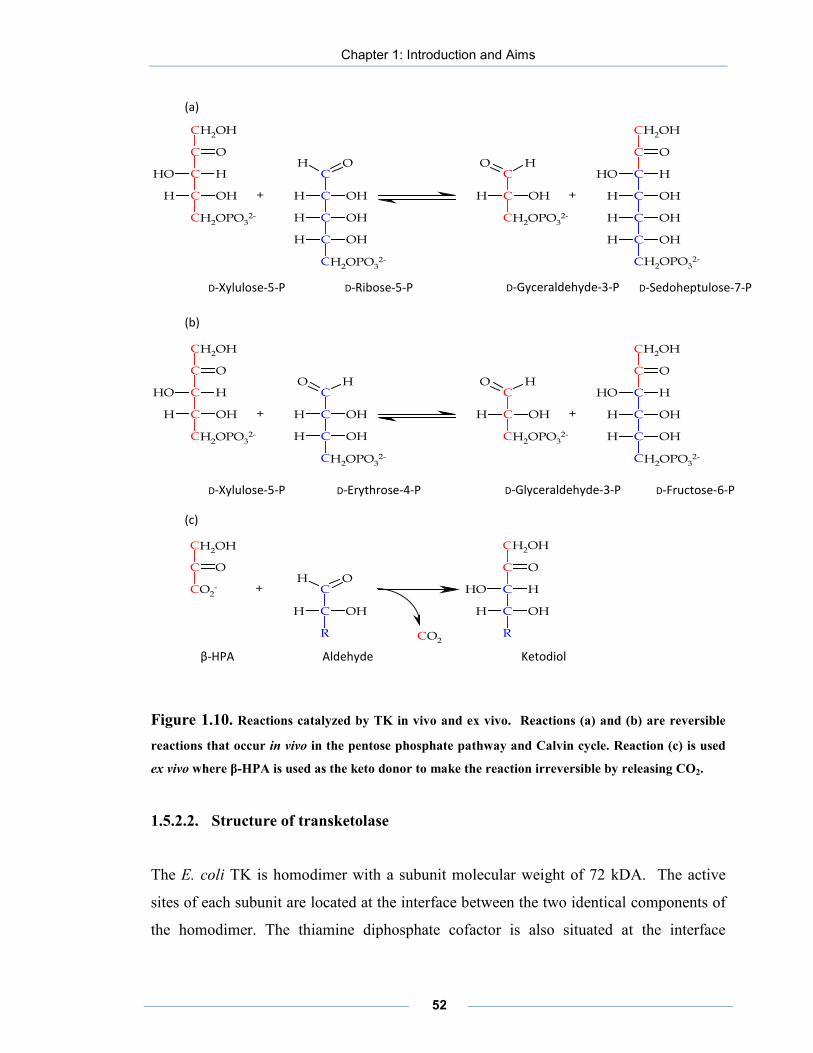
In vivo, the enzyme creates a link in conjunction with transaldose between the non-
oxidative branch of the pentose phosphate pathway and glycolysis. The reactions it
catalyze are the conversion of D-xylulose-5-phosphate and D-ribose-5-phosphate to D-
sedulose-7-phosphate and D-glyceraldehyde-3-phosphate (Figure 1.10a); and the
conversion of D-xylulose-5-phosphate and D-erythrose-4-phosphate to D-fructose-6-
phosphate and D-glyceraldehyde-3-phosphate as shown in Figure 1.10b ( Sprenger et al.,
1995). In plants and photosynthetic bacteria, transketolase is also found in the Calvin
cycle where it catalyzes the reverse reaction of the previously mentioned conversions
(Schenk et al. 1998)

Chapter 1: Introduction and Aims
51
Ex vivo, several transketolases have been found to accept a wide range of substrates,
making it ideal to integrate de novo pathways. Of particular interest is the use of β-
hydroxypyruvate (HPA) as keto donor so that CO2 is released as a side product, making
the reaction irreversible (Figure 1.10c) (Mitra & Woodley, 1996). Using HPA as a
substrate, the specific activity of the TK of E. coli has been found to be 6 and 30 times
higher than the yeast or spinach activities (Sprenger & Pohl, 1999), in addition the TK of
E. coli can form carbon–carbon bonds between a broader range of substrates including
hydroxylated and unphosphorylated compounds (Pohl et al., 2004).
The feasibility of the production of the enzyme at larger scale has been demonstrated up
to 1000 litres (Hobbs et al., 1996). The clarified cell extract these authors obtained
contained about 230 U/ml of the enzyme, which represented about 40% of the total cell
protein. Those results make the E. coli TK a very good candidate for industrial catalysis
(Turner, 2000) and to be part of a de novo pathway for the synthesis of amino alcohols.
Chapter 1: Introduction and Aims
52
C
C
C OH
OH
O
H
C
C
H C OH
C
C
C
OH
OH
H
H
H
OHC
C
C OH
OH H
C
O
C
H
OH
C
H
C
OHH
C OH
CHO
C
H
C
C O
C
CH3
C OH
C
R
H
OH
C OH
C
R
H
HOH
C O
C
C
C
C OH
OH
O
H
C
C
H C OH
C
C
C
OH
H
H
HOC
C
C OH
OH H
C
O
C
H
OH
C
H
C OH
CHO
C
H
+ +
H2OPO32-H2OPO3
2-
H2OPO32-
H2OHH2OH
H2OPO32-
H2OH
O2-
H2OH
+
CO2
+ +
H2OPO32-H2OPO3
2-
H2OPO32-
H2OHH2OH
H2OPO32-
Figure 1.10. Reactions catalyzed by TK in vivo and ex vivo. Reactions (a) and (b) are reversible
reactions that occur in vivo in the pentose phosphate pathway and Calvin cycle. Reaction (c) is used
ex vivo where β-HPA is used as the keto donor to make the reaction irreversible by releasing CO2.
1.5.2.2. Structure of transketolase
The E. coli TK is homodimer with a subunit molecular weight of 72 kDA. The active
sites of each subunit are located at the interface between the two identical components of
the homodimer. The thiamine diphosphate cofactor is also situated at the interface
(a)
D-Xylulose-5-P
D-Ribose-5-P D-Gyceraldehyde-3-P D-Sedoheptulose-7-P
(b)
D-Xylulose-5-P
D-Erythrose-4-P D-Glyceraldehyde-3-P D-Fructose-6-P
(c)
β-HPA Aldehyde Ketodiol
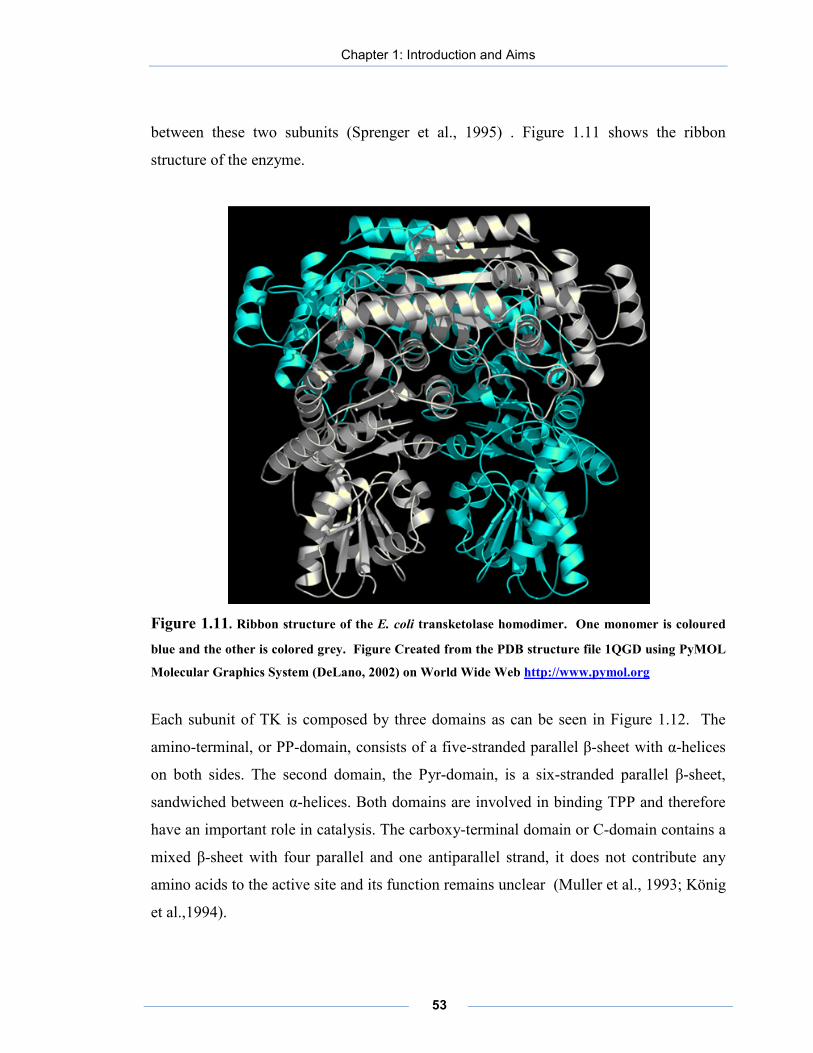
Chapter 1: Introduction and Aims
53
between these two subunits (Sprenger et al., 1995) . Figure 1.11 shows the ribbon
structure of the enzyme.
Figure 1.11. Ribbon structure of the E. coli transketolase homodimer. One monomer is coloured
blue and the other is colored grey. Figure Created from the PDB structure file 1QGD using PyMOL
Molecular Graphics System (DeLano, 2002) on World Wide Web http://www.pymol.org
Each subunit of TK is composed by three domains as can be seen in Figure 1.12. The
amino-terminal, or PP-domain, consists of a five-stranded parallel β-sheet with α-helices
on both sides. The second domain, the Pyr-domain, is a six-stranded parallel β-sheet,
sandwiched between α-helices. Both domains are involved in binding TPP and therefore
have an important role in catalysis. The carboxy-terminal domain or C-domain contains a
mixed β-sheet with four parallel and one antiparallel strand, it does not contribute any
amino acids to the active site and its function remains unclear (Muller et al., 1993; König
et al.,1994).

Chapter 1: Introduction and Aims
54
Figure 1.12. Ribbon structure of a single subunit of E. coli transketolase. Two TPP molecules,
which bind to the PP- and Pyr-domains are shown as spherical space-filling models. The divalent
metal ion Mg2+ binding to TPP required for catalytic activity is highlighted in cyan. Figure created
from the PDB structure file 1QGD using PyMOL Molecular Graphics System (DeLano, 2002) on
World Wide Web http://www.pymol.org.
1.5.2.3. Kinetic mechanism of transketolase
The kinetic mechanism of TK follows a ping pong bi-bi ordered mechanism, which can
be described as two half reactions which are represented in a condensed way in Figure
1.13 (Sayar et al., 2009). Using HPA as the keto donor and any aldehyde (AL) as keto
acceptor, in the first half reaction, HPA binds the enzyme (E) in the (through the cofactor
TTP) and is cleaved releasing CO2, while forming a covalently bound active
intermediate, the 2-α-carbanion of 1,2-dihydroxyethyl-TPP (F). In the second half of the
reaction, the 2-α-carbanion (F) suffers a nucleophilic attack by the aldehyde (AL),
PP-domain
Pyr-domain
C-domain

Chapter 1: Introduction and Aims
55
forming the second product, a ketose with an extended 2 carbon skeleton (K) while
releasing the enzyme in its original form (E).
Figure 1. 13. Representation of the ping pong bi-bi ordered mechanism followed by TK using HPA
as keto donor and any aldehyde (AL) as keto acceptor. E represents the enzyme in its original form,
K is the enzyme in its activated form, HPA is hydroxypyruate, and K is the final ketose product.
The reaction mechanism at a molecular level is shown in figure 1.14 (Wikner et al.,
1997). For modelling purposes, this is a fine example of the different scopes that a model
can cover as illustrated in Figure 1.7. Using the mechanism in Figure 1.13 would be
appropriate for developing models at reaction level, while using the mechanism
represented in Figure 1.14 would be necessary to develop a more complex model at
enzyme level. Although the model resulting from the Figure 1.14 would give more
information, due to time limit constrains of process development, all the kinetic models to
design and optimize the de novo pathway will be done in this work at the reaction level
scope.

Chapter 1: Introduction and Aims
56
Figure 1.14. Molecular scheme of the TK ping pong bi-bi ordered kinetic reaction mechanism. B1-
B3 represents catalytic groups involved in the proton transfer steps during the reaction. Figure
adapted from Wikner et al., (1997).
1.5.2.4. Applications of transketolase in multi-step synthesis
Due to the high demand of carbon-carbon bon formation with stereoselective properties,
TK has been applied in several multi-step syntheses to produce compounds of high value
(Turner, 2000). For example, TK has been employed in a chemoenzymatic reaction to
produce 6-deoxy-L-sorbose, which is a precursor of furanol that is used as a fragrance
component in the food industry (Hecquet, 1996) . In this bioconversion, HPA was
prepared from L-serine through the use of serine glyoxylate aminotransferase. The
aldehyde 4-deoxy-L-threose which would be the keto acceptor of TK was produced
through the microbial isomerisation of 4-deoxy-L-erythrulose using whole cells of
Corynebacterium equi or Serratia liquefaciens. TK was finally used to perform a carbon-
carbon bond formation between 4-deoxy-L-threose and HPA, thus yielding 6-deoxy-L-
sorbose (L Hecquet 1996).

Chapter 1: Introduction and Aims
57
TK has also been applied for the synthesis of the unnatural sugar 4-deoxy-D-fructose 6-
phosphate through another multi-step chemoenzymatic synthesis shown in Figure 1.15
(Guérard et al., 1999). (R,S)-1,1-diethoxy-3,4-eqoxybutane (1) was resolved using an
epoxide hydrolase from Aspergillus niger in order to give (S)-epoxide (2) with a yield of
30% and >98% enantiomeric excess. This epoxide was converted into the corresponding
phosphorylated (S)-aldehyde (3) (via a phosphate inorganic treatment followed by acidic
hydrolysis). The aldehyde was then reacted with (4) L-erythrulose in the presence of the
S. cerevisiae TK. This generated 4-deoxy-D-fructos 6-phosphate (5) with a yield of 52%.
The glycolaldehyde (6) that was released was reduced in situ using yeast alcohol
dehydrogenase and catalytic NADH.
Figure 1.15. Chemoenzymatic multi-step synthesis of 4-deoxy D-fructose 6-phosphate using an
epoxide hydrolase and S. cerevisiae TK. Figure adapted from Hecquet (1996) and Tuner (2000).

Chapter 1: Introduction and Aims
58
Another example of using TK in a multi step synthesis involved the synthesis of D-
xylulose 5-phosphate where TK was combined with an aldolase and isomerise to obtain a
final yield of 82 % mol/mol (Zimmermann et al., 1999).
1.5.3. Transaminase
1.5.3.1. Introduction to transaminases
A transaminase or an aminotransferase is included in the class of enzymes like the acid
dehydrogenases (Brunhuber & Blanchard, 1994) or the amine dehydrogenases ((Hyun &
Davidson, 1995) that convert a carbonyl group to an amino group as shown in Figure
1.16. The enzyme needs the cofactor pyridoxal 5´ phosphate (PLP) to catalyze the
reaction .(John, 1995)
Figure 1.16. General reaction scheme of a TAm reaction where an amino group is transferred to a
carbonyl group.
In vivo, TAms are one of the key enzymes for the formation of desired amino acids at the
expense of the catabolism of proteins. The main aim of a transaminase reaction within
amino acid metabolism is to collect the amino groups from several different amino acids
in the form of mainly L-glutamate (L-alanine in a lesser degree) (Lombardo et al., 1989;
Davies, 1961) . This L-glutamate then functions as an amino group donor for biosynthetic
anabolism or for the nitrogen excretion pathway (Urea Cycle) (Stitt et al., 2001).
Ex vivo, several transaminases with broad range of substrate specificity have been
identified (Taylor et al., 1998). This has lead to their increasing industrial application for
the synthesis of either natural or unnatural D- or L-amino acids (Stewart, 2001) .

Chapter 1: Introduction and Aims
59
1.5.3.2. Classification of transaminases
The classification of the different TAms has been done through sequence homologies,
this classification corresponded with the structural classification of the substrates utilized
by the enzymes according to the position of the amino group transferred with respect to
the carboxyl group of the substrate. Therefore the TAms have been divided in four
groups. Groups I, III, and IV are comprised of α-TAm whilst the ω-TAm make up Group
II (Mehta et al., 1993; Mehta & Christen, 1994). The ω-TAm has the potential to access
a range of substrates not accepted by the α-TAm, as the need for an α-amino acid or α-
keto acid is not necessary (Shin & Kim, 1999; Koszelewski et al., 2010a). Several ω-
TAm have been reported to show catalytic activity towards primary and secondary
amines which do not need to have a carboxylic group (Shin & Kim, 2001; Koszelewski
et al., 2010).
The α-transaminases have been studied more extensively due to their potential in the
industrial synthesis of amino acids (Stewart, 2001). However, in part due to the similarity
between the products and substrates, low equilibrium constants have prevented their
industrial use (Tufvesson et al., 2011).
The synthetic potential of several ω-TAms have been studied, including ω-TAms from
Klebsiella pneumoniae, Bacillus thuringiensis JS64, Vibrio fluvialis JS17, and
Arthrobacter sp among others (Shin & Kim, 1997; Shin & Kim, 2001; Iwasaki et al.,
2006; Yun & Kim, 2008). Among them, the ω−TAm from Vibrio fluvialis showed the
best performance for kinetic resolution and asymmetric synthesis of chiral amines (Shin
& Kim ,2001). The enzyme showed high selectivity towards (S)−enantiomers such as
(S)−α−methylbenzylamine (MBA), and was capable of convert a broad range of ketones,
making it ideal for asymmetric synthesis (Shin et al., 2003). Nevertheless the enzyme
suffered from strong product and substrate inhibition, and different studies using in situ
product removable have been developed. Examples are using a biphasic media (Shin &
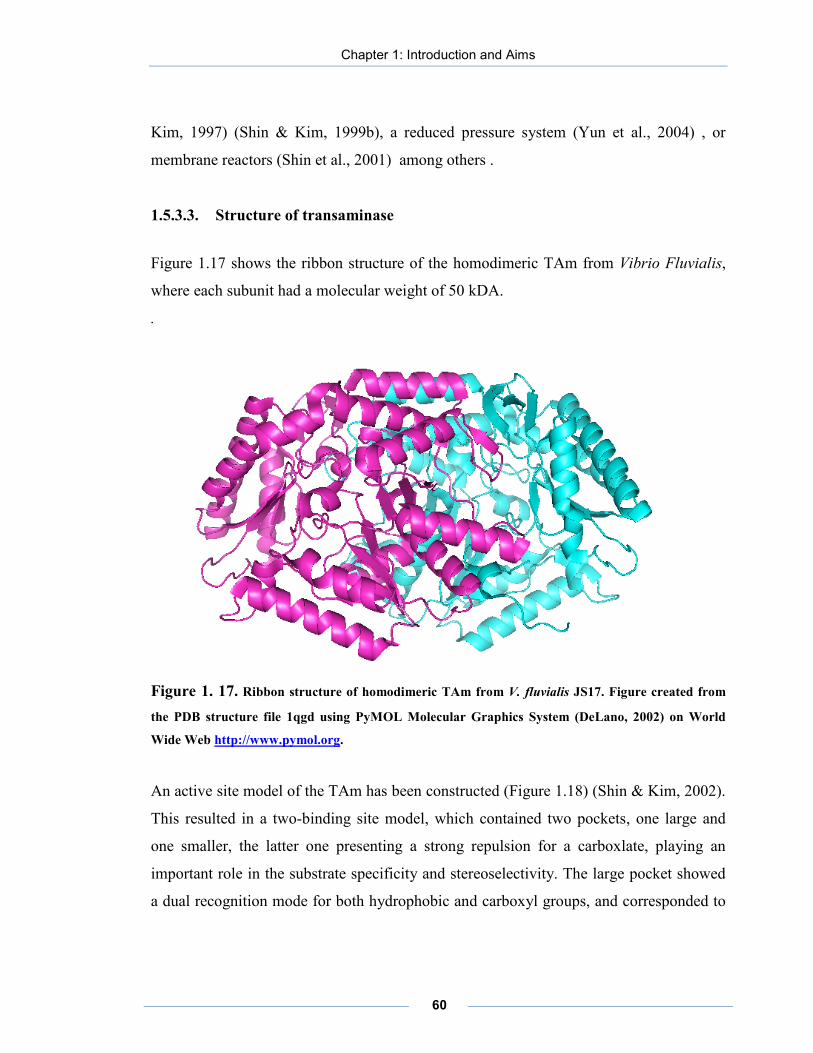
Chapter 1: Introduction and Aims
60
Kim, 1997) (Shin & Kim, 1999b), a reduced pressure system (Yun et al., 2004) , or
membrane reactors (Shin et al., 2001) among others .
1.5.3.3. Structure of transaminase
Figure 1.17 shows the ribbon structure of the homodimeric TAm from Vibrio Fluvialis,
where each subunit had a molecular weight of 50 kDA.
.
Figure 1. 17. Ribbon structure of homodimeric TAm from V. fluvialis JS17. Figure created from
the PDB structure file 1qgd using PyMOL Molecular Graphics System (DeLano, 2002) on World
Wide Web http://www.pymol.org.
An active site model of the TAm has been constructed (Figure 1.18) (Shin & Kim, 2002).
This resulted in a two-binding site model, which contained two pockets, one large and
one smaller, the latter one presenting a strong repulsion for a carboxlate, playing an
important role in the substrate specificity and stereoselectivity. The large pocket showed
a dual recognition mode for both hydrophobic and carboxyl groups, and corresponded to

Chapter 1: Introduction and Aims
61
a carboxylate trap, while the small pocket played the role of a side chain recognition site.
(Shin & Kim, 2002).
Figure 1.18. Two-Binding Site Model of TAm of V. fluvialis showing (a) the binding of the amino
donor and (b) the binding of the amino acceptor. L and S denote large and small binding pockets
respectively. Figure adapted from Shin & Kim (2002).
1.5.3.4. Reaction mechanism of transaminase
The TAm catalyzes the enzymatic amino transfer by a ping-pong bi–bi ordered
mechanism analogue to the one of TK shown in Section 1.5.2.3 (Bulos & Handler, 1965)
(Smith et al., 1998). The reaction mechanism is represented in Figure 1.19 where in the
first half reaction, the amino donor (AN) binds to the enzyme and the amino group is
transferred to the pyridoxal 5´phosphate (EPLP), which forms pyridoxamine 5-phosphate
(EPMP), and the respective keto product (A) is released. During the second half reaction,
the EPMP transfers the amino group to the acceptor substrate (B) and EPLP is
regenerated, while the new aminated compound is released (B-N) (Christen and Metzler,
1995).

Chapter 1: Introduction and Aims
62
Figure 1.19. Schematic representation of the ping pong bi-bi ordered reaction mechanism used of
TAm.
Some TAm have been reported to form “dead end complexes” between E-PLP or E-PMP
and an incorrect substrate (for example an amino acceptor binding E-PLP or an amino
donor binding E-PMP). Depending of the degree of inhibition that those abortive
complexes could cause, they may need to be taken into account in the modelling of the
reaction (Bulos & Handler, 1965; Shin & Kim, 1998).
1.5.3.5. Applications of TAm in multi-step synthesis
TAm has been used in many multi-step syntheses for chiral amine catalysis. The majority
of the multi-step syntheses involving TAm have had as objective to overcome the low
equilibrium constant which hampers the reaction (Talylor, 1998). A elegant example is
the in vivo production of L-2-aminobutyric acid, where the overexpression of E. coli
aromatic TAm, E. coli K12 threonine deaminase and Bacillus subtilis acetolate synthase
was achieved in a single host to perform the one-pot synthesis (Figure 1.20)
(Fotheringham et al., 1999). The threonine deaminase catalyzed the in situ formation of
transaminase substrate, 2-ketobutyrate from L-threonine, while the synthase eliminated
the pyruvate by-product which enabled to shift the equilibrium towards the forward
reaction, which normally was 50% using the TAm individually.

Chapter 1: Introduction and Aims
63
Figure 1. 20. Engineered multi-step pathway for the synthesis of L-aminoburyric acid. Figure
adapted from Fotheringhan et al., (1999).
Also, combining an enzymatic transamination and dehydrogenation step ex vivo, it was
possible to shift the equilibrium of the bioconversion to produce optically pure amines
with yields higher than 90% (Figure 1.21) (Truppo et al., 2010) .
OH
NH2 CO2HNH3
O
NH2 CO2H
CO2H
CO2H
CO2H
NH2 CO2H
O
CO2H
CO2HO
OHO
CO2H
OHO
H CO2
CO2
CO2
L-threonine
ThreonineDeaminase
TyrosineAminotransferase
Acetolacetate Synthase
2-ketobutyrate
L-aspartic acid
L-2-aminobutyrate
2x
Chemical

Chapter 1: Introduction and Aims
64
Figure 1.21. Synthesis of chiral amines combining an enzymatic transamination and
dehydrogenation step in order to shift to equilibrium towards the forward reaction. Figure adapted
from Truppo et al. ( 2010).
Recently, in our research group, the ω-TAm from Chromobacterium violaceum (TAm
CV2025), was identified to be the best TAm for stereoselective ketodiol amination from
a pool of 17 recombinant TAms (Kaulmann et al., 2007; Sayer et al., 2007). The enzyme
had a molecular weight of 51 kDa and exhibited 38% sequence identity to the TAm from
V. fluvialis studied in Section 1.5.3.3. It was also found to be a homodimer with a similar
catalytic site as the TAm from V. fluvialis illustrated in Figure 1.18 (no crystal structure
has been published). The CV2025 TAm was of special interest for the de novo pathway
design of amino alcohols as the majority of the TAms cannot catalyse the conversion of
ketodiols, which could be produced by TK. In the next section, a literature review of the
state of the art of the de novo engineered pathways for the synthesis of amino alcohols
will be discussed.

Chapter 1: Introduction and Aims
65
1.5.4. One-pot synthesis of chiral amino alcohols
The de novo pathway approach for the synthesis of amino alcohols was firstly
demonstrated for the synthesis of the single syn-diastereoisomer (2S,3R)-2-amino-1,3,4-
butanetriol (ABT) (Ingram et al., 2007). This was performed by using erythrulose (ERY)
and glycolaldehyde (GA) as achiral substrates for TK, and (S)-(α)-methyl benzylamine as
amino donor for the TAm, and by overexpressing the E. coli TK and the β-alanine-
pyruvate TAm from Pseudomonas aeruginosa in a single E. coli host to perform the in
vivo one-pot synthesis as shown in Figure 1.22. ABT is an important building block in
the pharmaceutical industry, which for example has the potential to be used to synthesize
the chiral core of the protease inhibitor drug NelfinavirTM (Kaldor et al., 1997).
Figure 1.22. The synthesis of chiral amino alcohol 2-amino1,3,4-buntanetriol (ABT) from achiral
substrates glycolaldehyde and hydroxypyruvate using a de-novo TK–TAm pathway. TPP is thiamine
pyrophosphate and PLP is pyridoxal 5´phospahte.

Chapter 1: Introduction and Aims
66
The main limitation of this one-pot synthesis was the low activity of the β-alanine-
pyruvate TAm causing a low overall yield of the reaction, as well as a lack of
mathematical models to determine the best reaction conditions (Ingram et al., 2007).
Consequently, several libraries of engineered TKs and novel TAms have been
constructed, which could be used as a recruitment source to design new de novo
engineered pathways for amino alcohols with increased performance (Hibbert et al.,
2007; Kaulmann et al., 2007; Hibbert, et al. 2008; Smith et al., 2008). Of special interest
was one work where I collaborated, where the potential of different E. coli TK mutants to
accept new substrates with high stereoselectivity was predicted using molecular
modelling bioinformatic tools like direct docking (Full paper attached in Appendix XIV)
(Cázares et al., 2010). The TK residue D469 was predicted to have a crucial role in
accepting new substrates like propionaldehyde (PA), which could be a useful starting
material for the de novo pathway of amino alcohols (Figure 1.23).
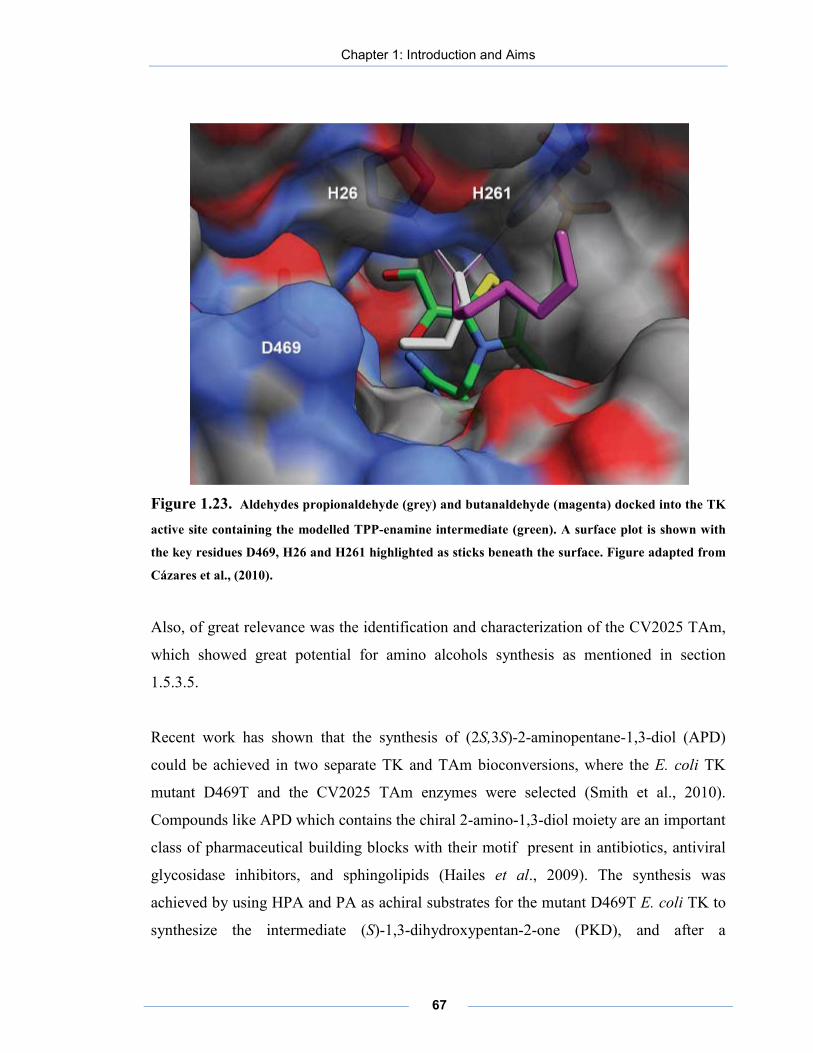
Chapter 1: Introduction and Aims
67
Figure 1.23. Aldehydes propionaldehyde (grey) and butanaldehyde (magenta) docked into the TK
active site containing the modelled TPP-enamine intermediate (green). A surface plot is shown with
the key residues D469, H26 and H261 highlighted as sticks beneath the surface. Figure adapted from
Cázares et al., (2010).
Also, of great relevance was the identification and characterization of the CV2025 TAm,
which showed great potential for amino alcohols synthesis as mentioned in section
1.5.3.5.
Recent work has shown that the synthesis of (2S,3S)-2-aminopentane-1,3-diol (APD)
could be achieved in two separate TK and TAm bioconversions, where the E. coli TK
mutant D469T and the CV2025 TAm enzymes were selected (Smith et al., 2010).
Compounds like APD which contains the chiral 2-amino-1,3-diol moiety are an important
class of pharmaceutical building blocks with their motif present in antibiotics, antiviral
glycosidase inhibitors, and sphingolipids (Hailes et al., 2009). The synthesis was
achieved by using HPA and PA as achiral substrates for the mutant D469T E. coli TK to
synthesize the intermediate (S)-1,3-dihydroxypentan-2-one (PKD), and after a

Chapter 1: Introduction and Aims
68
purification step to isolate PKD, IPA was used as the achiral amino donor using the
CV2025 TAm to synthesize APD with a final yield of 13% mol/mol respect to the initial
TK substrates. The overall reaction pathway without including the separation and
purification steps is shown in Figure 1.24.
Figure 1.24. Two-step biocatalytic synthesis of 2-amino-1,3-diols using transketolase (TK) and
transaminase (TAm). PA is propionaldehyde, HPA is hydroxypyruvate, TPP is thiamine
pyrophosphate, PKD is (S)-1,3-dihydroxypentan-2-one, PLP is pyridoxal 5´phospahte and APD is of
(2S,3S)-2-aminopentane-1,3-diol. Figure modified from Hailes et al., (2009).
In this case, the process required many downstream steps to isolate the TK product PKD
prior to the TAm bioconversion as has been shown in the proposed manufacturing
process by the authors in Figure 1.25.

Chapter 1: Introduction and Aims
69
Figure 1. 25. Hypothetical manufacturing process flow sheet for the large-scale, two-step TK
D469T (batch reactor 1) and CV2025 TAm (batch reactor 2) biocatalytic synthesis and purification
of (2S,3S)-2-aminopentane-1,3-diol (APD). HPA is hydroxypyruvate, IPA is isopropylamine and
EtOA is ethyl alcohol. Figure adapted from Smith et al., (2010).
During the purification steps, more than 30% mol/mol of the intermediate PKD was lost,
apart from the use of large quantities of waste used in the downstream steps shown
between the two reactors in Figure 1.25. Those problems could be potentially avoided by
using a one-pot synthesis strategy, which could be designed combining microscale
instrumentation with modelling tools, in order to select the best enzyme candidates and
identify the best reaction conditions, allowing to achieve higher yields of the final
product. As far as we know, no de novo engineered pathway has been designed, evaluated
and completely modelled using high-throughput microscale tools which would be
predictive of larger scale operations, increasing the challenge and impact of this work.
Chapter 1: Introduction and Aims
70
1.6. Aim and Objectives of the Project
To date most industrial bioconversion processes have focused on single-step enzymatic
transformations primarily for the synthesis of pharmaceuticals and chiral intermediates.
As described in Section 1.2.1.2, however, the de novo construction of multi-step
enzymatic synthesis in whole cell biocatalysts provides a number of advantages. These
include atom-efficient bioconversions in a single vessel potentially increasing space-time
yields and reducing the production costs of complex syntheses for a wider range of
products. Nevertheless, multi-step enzymatic systems have been relatively poorly
explored (Section 1.2.1.3). In contrast to single enzyme systems they display higher
levels of complexity, making them more difficult to construct and time consuming to
characterize and model.
Microscale bioprocessing techniques, as described in Section 1.3, offer the potential to
speed up the early characterization and optimization of biocatlaytic processes and the
design and scale-up of bioprocess unit operations. The linkage of microscale
experimentation with numerical approaches (Micheletti et al., 2006, Chen et al., 2008)
further enables modelling and simulation of different biocatalyst and process options.
The aim of this project is therefore to design and characterize whole cell E. coli
biocatalysts containing de novo engineered, multi-step enzymatic pathways for the
synthesis of chiral amino alcohols. In particular a generic “toolbox” approach will be
highlighted in order to simulate and optimize multi-step enzymatic syntheses using high-
throughput microscale methods that are predictive of larger scale operating conditions.
The enzymes transketolase (Section 1.5.2) and transaminase (Section 1.5.3), which do not
naturally work in series, were selected in order to exemplify options for the one-pot
synthesis of chiral amino-alcohols (Section 1.5.4) which are of special interest for the
pharmaceutical industry (Section 1.5.1). In order to achieve this aim the primary
objectives of the project are summarized below.

Chapter 1: Introduction and Aims
71
• The initial objective was to establish a microscale “toolbox” for the rapid evaluation of
different variants of TK and TAm for the one-pot synthesis of a range of amino-alcohols.
This required the construction of de novo engineered pathways that were based on a
double transformed E. coli expression system, which combined with the microscale high-
throughput experimentation, enabled systematic evaluation of different pairs of enzymes
with different substrates under a range of reaction conditions. The results of this work are
presented and discussed in Chapter 3.
• The next objective was to be able to model and simulate the bioconversion reactions.
In particular the TAm step was identified as the bottleneck of the multi-step synthesis
(Chapter 3) and so this work focused on a methodology to elucidate and determine the
TAm kinetic parameters. The kinetic parameters for the TAm mediated synthesis of ABT
and APD were thus determined based on a novel numerical approach and microscale
experimentation. As shown in Chapter 4 this enabled simulation of the TAm
bioconversion under a broad range of substrates concentrations facilitating selection of
the best reaction conditions. The results of this work are presented and discussed in
Chapter 4.
• The next objective was to scale-up the production of the biocatalyst, while obtaining a
desired TK-TAm expression that would match the kinetic properties determined in
Chapter 4. Here different fermentation conditions to manipulate the TK and TAm
expression levels within the E. coli biocatalyst were studied. The best conditions were
then used to scale-up the fermentation from shake flasks to a 7.5 litre fermentor, and the
kinetic properties of the larger and small scale biocatalyst were compared. The results of
this work are presented and discussed in Chapter 5.
• The last objective was to illustrate successful scale-up and predictive modelling of
selected one-pot syntheses. The scale-up and modelling of the complete one-pot TK-

Chapter 1: Introduction and Aims
72
TAm synthesis of APD and ABT were successfully performed from µl to preparative
scale, demonstrating the capacity of the microscale tools to speed up the development of
multi-step synthetic processes. Finally, the best reactor configurations were determined
and applied to optimize the de novo one-pot synthesis of chiral amino alcohols. The
results of this work are presented and discussed in Chapter 6.
• Finally, in Chapter 7, the generic outcomes of this work are highlighted and
suggestions for future work are presented.

2. MATERIALS AND METHODS
2.1. MATERIALS
2.1.1. Reagents and suppliers
Molecular biology enzymes were obtained from New England Bio-laboratories (NEB,
Hitchin, UK). Nutrient broth and nutrient agar were obtained from Fisher Scientific
(Leicestershire, UK). Competent E. coli BL21-Gold (DE3) cells were obtained from
Stratagene (Amsterdam, NL). Primers and oligonucleotides were purchased from Operon
(Cologne, DE). All other reagents were obtained from Sigma-Aldrich (Gillingham, UK)
unless noted otherwise and were of the highest purity available. Reverse osmosis (RO)
water was used in all experimental work.
2.1.2. Media preparation
All batch E. coli fermentations were performed using LB-glycerol medium the contents
of which are described in Table 2.1.
Table 2. 1. Composition of the LB-glycerol medium used in all batch E. coli fermentations.
Component Concentration (g L-1)
Yeast extract
5.0
Tryptone 10.0
NaCl 10.0
Glycerol 10.0

Chapter 2: Materials and Methods
74
The different components of the media were measured out and dissolved in RO water to 1
L. The pH of the media was adjusted to pH 7 with a solution of 1 M NaOH when
necessary. The medium was then autoclaved at 121 oC for 20 min for sterilization.
2.1.3. Luria Bertrani agar plates
LB-agar was prepared by adding 15 g L-1 of agar to LB-glycerol medium as described in
Table 2.1. The LB-agar preparation was then autoclaved at 121oC for 20 min. Once
cooled down to between 40-50 °C, 30 mL of media was poured into each standard size
Petri dish (Fisher Scientific, UK).
2.1.4. Antibiotic solutions
The antibiotics ampicillin and kanamycin were dissolved individually in RO water to a
concentration of 150 mg mL-1. The solutions were then sterilized by passing them slowly
through a 0.2 µm filter (Fisher Scientific, UK) and aseptically transferred into previously
sterilized 1.5 mL Eppendorf tubes and stored at -20 °C. The antibiotics were added to
either LB-glycerol medium or to LB-agar before the start of any culture. Ampicillin was
used when growing cells with plasmid pQR412 for TK expression (Section 2.3.1) at a
concentration of 150 µg mL-1 and kanamycin was used for growing cells with plasmid
pQR801 for TAm expression (Section 2.3.3) at a concentration of 150 µg mL-1. For
double transformed cells containing both plasmids pQR412 and pQR801, a concentration
of 50 µg mL-1 of each antibiotic was used (Section 2.4.2).
2.2. MOLECULAR BIOLOGY TECHNIQUES
2.2.1. DNA extraction and quantification
A QIAprep spin miniprep kit (Qiagen, Crawley, UK) was used to obtain plasmid DNA
from host E. coli cells, and the method was carried out following the techniques

Chapter 2: Materials and Methods
75
described by the supplier. The concentration of DNA was determined by measuring
absorbance at 260nm (A260) using a NanoDrop™ 1000 UV/vis spectrophotometer
(Thermo Fisher Scientific, Waltham, MA, USA). DNA concentrations were calculated
internally by the spectrophotometer by considering that 1.0 A260 unit of double-stranded
DNA was equivalent to 50 ng µL-1. Protein contamination was estimated from the
A260/A280 ratio. Readings were blanked with the same buffer solution used for DNA
elution.
2.2.2. Restriction digests and agarose gels
Analytical restriction digests were performed for four hours at 37oC in the recommended
restriction buffer, according to the enzyme used and following the manufacturer’s
protocol. To analyze the different DNA fragments, agarose DNA gels were run on 1%
w/v agarose gels with 1X TBE buffer. Molecular weight markers were lambda DNA
cleaved with pst1 or a 1 KB ladder (NEB, Hitchin, UK) while staining was performed
with ethidium bromide.
2.2.3. Preparation of competent cells
Competent cells were prepared in house from E. coli BL21-Gold (DE3) (Stratagene
(Amsterdam, NL) cells cultured in 250 mL shake flasks containing 20 mL of LB-glycerol
medium and 20 mM MgCl2 at 37oC, 250 rpm to an optical density of 0.5 (Section 2.9.2).
Cells were harvested by centrifugation and chilled on ice for 30 minutes. Resuspension
was carried out in 75 mM CaCl2 and the cells were re-pelleted by centrifugation. This
was carried out three times. Following the final centrifugation cells were suspended in 75
mM CaCl2 with 15 % v/v glycerol. Cells were then aliquoted and either placed on ice for
immediate transformation or stored at -80oC.

Chapter 2: Materials and Methods
76
2.2.4. Transformation of cells by heat shock technique
E. coli BL21-Gold (DE3) cells were used to carry out heat-shock transformations.
Competent cells were either prepared in house (Section 2.2.3) or purchased
commercially. Cells were first thawed on ice and 50 µL aliquots transferred into 15 mL
pre-chilled Falcon tubes. A sample of 1.5 µL of a single plasmid or a mixture of two
plasmids with a total concentration of 50 ng µL-1 of DNA was added to cells in each tube
which were then mixed gently and incubated on ice for 30 minutes. The cells were then
heat shocked in a 42 oC water bath (Grant Instruments, Cambridge, UK) for 30 seconds
and immediately placed on ice for 5 minutes. A volume of 0.9 mL of preheated (37 oC)
LB-glycerol media was added to each Falcon tube and the cells were incubated at 37 oC
for 1 h with shaking at 220 rpm in a SI 50 orbital shaker (Stuart Scientific, Redhill, UK).
Finally 100 µL of transformed cells were uniformly spread on LB-agar plates with the
corresponding antibiotic resistance (Section 2.1.4.) and left to incubate at 37oC overnight.
2.2.5. Master glycerol stocks
To prepare master stock cultures a single colony was picked from the plates containing
the desired transformed cells expressing either single enzymes or pairs of enzymes
(Section 2.2.4). This was then inoculated into a sterile 250 mL shake flask containing 25
mL of LB-glycerol medium with the corresponding antibiotic(s). When the culture
reached an OD of 0.5 at 600 nm (Section 2.9.2), 400 µL aliquots of cell broth were mixed
aseptically in sterilized 1.5 mL Eppendorf tubes with 200 µL of a 50% v/v filter sterilized
glycerol solution. The aliquots were then frozen and stored at -80 oC and were used
throughout the rest of this project.

Chapter 2: Materials and Methods
77
2.3. PLASMIDS
2.3.1. Transketolase plasmid pQR412
Plasmid pQR412 (11.2kb) contained the complete E. coli TK gene, tktA, with its native
promoter and an N-terminal His6-tag as constructed previously (Ingram et al., 2007). The
plasmid was provided by Professor John Ward (Institute of Structural and Molecular
Biology, UCL) and it was assembled using the expression vector pMMB67HE (8.8kb),
which has a RSF1010 origin of replication, the tac promoter, the Lac repressor and codes
for resistance to ampicillin (Figure 2.1). Even if the plasmid contained the inducible tac
promoter, the expression of the E. coli tktA was constitutive because of the presence of its
native promoter (Ingram et al., 2007).
Figure 2.1. Structure of the plasmid pQR412. Image obtained from Ingram et al. (2007).
2.3.2. Site directed mutagenesis of TK Site direct mutagenesis on the TK gene was performed using the Quikchange kit
(Stratagene, Amsterdan, NL) following the supplier’s instructions. The primers used for
the TK mutagenesis were the following:
1
1126
2251
3376
4501
5626
6751
7876
9001
10126
pQR41111256 bp
tkt1
BamHI 35
SacI 2481
Ori V
AmpR
HindIII 808HindIII 1138
PstI 1237EcoRI 1311
XbaI 29PstI 21
HindIII 5
NdeI 5523

Chapter 2: Materials and Methods
78
D469T: TCGGTCTGGGCGAAACTGGGCCGACTCACCAG
D469E: TCGGTCTGGGCGAACAAGGGCCGACTCACCAG
The resulting plasmid was transformed into commercially competent E. coli BL21-Gold
(DE3) cells as described in Section 2.2.4.
2.3.3. Transaminase plasmid pQR801
Plasmid pQR801 contained the complete Chromobacterium violaceum 2025 TAm gene
with an N-Terminal His6-tag (GenBank accession no. NP_901695) and was synthesized
in a previous work (Kaulmann et al., 2007). The plasmid was provided by Professor John
Ward (Institute of Structural and Molecular Biology, UCL) and was constructed using the
expression vector pET29(a)+ (5.3kb), which contained an inducible T7 promoter, the Lac
repressor and codes for resistance to kanamycin.
2.3.4. Plasmids sequencing
DNA sequencing was performed by the sequencing service of the UCL Wolfson Institute
for Biomedical Research. 12 µL of DNA sample were given to the service at a
concentration of 100 ng µL-1 in 1.5 mL Eppendorf tubes. Three main custom primers
were used to sequence the E. coli TK gene which were the following:
TKN 5’-GATCCAGAGATTTCTGA-3’;
TKmedSeq 5’-GTATGAAAGGCGAAAT GCCG TCTGACT-3’
TKC 3’-CAAAAGAACTGCTGTAA-5’.
Two main primers were used to sequence the CV2025 TAm gene which where the
following:
T7: 5' - GTA ATA CGA CTC ACT ATA GGG C - 3'
T7term: 5' - GCT AGT TAT TGC TCA GCG G - 3'
Chapter 2: Materials and Methods
79
Primers were prepared at a concentration of 5 pmoles L-1. Results were analyzed using
Bioedit software available on the internet (www.mbio.ncsu.edu/BioEdit/bioedit.html).
2.4. SHAKE FLASK FERMENTATIONS
2.4.1. TK shake flask fermentations
Competent E. coli BL21-Gold (DE3) cells were transformed with the plasmid pQR412
using the heat shock technique (Section 2.2.4) and were then grown in LB-agar plates in
the presence of ampicillin (150 ug mL-1). Using a single colony from the agar plates, an
overnight culture of the transformed cells was then inoculated in a 100 mL shake flask
(10 mL working volume) containing LB-glycerol broth as described in Table 2.1 again
with the addition of ampicillin. Growth was performed at 37 oC with orbital shaking at
250 rpm using an SI 50 orbital shaker during 8 hr (Stuart Scientific, Redhill, UK). The
total volume of this culture was used to inoculate a 1 litre shake flask (100 mL working
volume) which was left to grow for 8 hours. The cells were harvested and following the
removal of broth using a Universal 320R centrifuge (Buckinghamshire, UK) for 10 min
at 5000 rpm, they were resuspended in 50 mM TRIS buffer, pH 7.5 unless otherwise
noted. The cells were either used immediately for whole cell bioconversions (Section
2.8.1) otherwise they were stored at -20 oC following the removal of broth by
centrifugation.
2.4.2. TAm and TK-TAm shake flask fermentations
The double transformation of E. coli BL21-Gold (DE3) cells with the plasmid pQR801
and pQR412 or the single transformation of the cells with plasmid PQR801 and the
inoculum preparation were performed as described in Section 2.4.1, except that 150 µg
mL-1 of kanamycin were used for the single transformed cells and 50 µg mL-1 of both
kanamycin and ampicillin were used for the double transformed strain. To construct the
double transformed biocatalyst, 50 µL of competent E. coli BL21-Gold (DE3) cells were
double transformed with a 1.5 µL solution of plasmids pQR412 and pQR801 (50 µg mL-1

Chapter 2: Materials and Methods
80
total plasmid concentration) using the heat shock technique described in Section 2.2.4.
After inoculation of a 1 litre shake flask (100 mL working volume), when the OD600
reached a value of 0.8-1.0, Isopropyl β-D-1-thiogalactopyranoside (IPTG) was added to
final concentration of 0.2 mM. After 4 hr induction, the cells were harvested and
following the removal of broth by centrifugation, they were suspended in 50 mM HEPES
buffer, pH 7.5 unless noted otherwise and used for whole cell bioconversions, otherwise
they were stored at -20 oC following the removal of broth by centrifugation.
2.5. LABORATORY AND PILOT SCALE FERMENTATIONS
2.5.1. 2 L Adaptive Biosystems batch fermentation
A 2 L fermentor (Adaptive Biosystems, London, England), was used to grow E. coli
BL21(DE3) Gold double transformed cells with plasmids pQR412 and pQR801 and also
single transformed cells with plasmid pQR801 (1.4L working volume). The vessel was
equipped with two 6 bladed Rushton turbine impellers and four baffles equally spaced. It
also comprised a thermocouple, a pH probe, and a polarographic oxygen probe (Ingold
Messtechnik, Urdorf, Switzerland). All probes were steam sterilisable.
The vessel was filled with 1.26 L of LB-glycerol media and all the probe calibrations and
pre-sterilization procedures were performed following the manufacturer’s instructions.
The fermentor was sterilized as a complete unit in an autoclave at 121oC for 20 min and
after the media was cooled down the corresponding antibiotic (Section 2.1.4) and pre-
sterilized antifoam, polyethylene glycol (PPG) to a final concentration of 0.2 g L-1, was
added.
The fermentor was then inoculated with 140 mL of previously grown overnight shake
flasks cultures as described in Section 2.4.2. The pH was set at 7.0 and was controlled
with the addition of 85% v/v H3PO4 (acid) and 28% NH4OH v/v (base). The oxygen and
carbon dioxide content in the exhaust air were measured on-line by a TanDem gas

Chapter 2: Materials and Methods
81
analyzer (Adaptive Biosystems, London, England). Temperature was automatically
controlled via cold water circulation in the external jacket of the bioreactor and
maintained at 30 or 37°C using a heating jacket. The stirrer was set at a speed of 1200
rpm with an aeration rate of 2 L min-1. Ingoing air was sterilized by passage through a 0.2
μm membrane filter and dispersed in the vessel at the base of the lower turbine with a
ring sparger. The fermentor was linked to Biodirector proprietary control software to
control and monitor online the temperature, DOT, speed impeller and pH. Additionally,
the fermentation was monitored by taking regular OD600 measurements as described in
Section 2.9.2.
2.5.2. 7.5 L New Brunswick batch fermentation
Batch fermentations were carried out in a 7.5 L fermentor (BioFlo 110, New Brunswick,
Hertfordshire, UK) with a working volume of 5 L. The fermentor had an aspect ratio of
1.79:1 and comprised two six-bladed dual Rushton-type impellers (59 mm, di/dt = 0.25)
and four equally spaced baffles. The Temperature was monitored by a thermocouple and
automatically controlled at 30 or 37oC via cold water circulation in the external jacket of
the fermentor in addition to a heating jacket. The pH was measured by a Ingold gel filled
pH probe (Ingold Messtechnik, Urdorf, Switzerland) and was controlled with the addition
of 85% v/v H3PO4 (acid) and 28% NH4OH v/v (base). DOT was monitored by a
polarographic oxygen electrode (Ingold Messtechnik, Urdorf, Switzerland) and was set to
be maintained at 30% through a cascade control of the impeller speed. Ingoing air was
sterilized by passage through a membrane filter and dispersed in the vessel at the base of
the lower turbine with a ring sparger and the flow rate was 5 L min-1.
The vessel was filled with 4.5 L of LB-glycerol media and all the probe calibrations and
pre-sterilization procedures were performed following the manufacturer instructions. The
fermentor was then sterilized as a complete unit in an autoclave at 121oC for 20 min, and
after the media was cool down, the corresponding antibiotic (Section 2.1.4) and sterilized
antifoam PPG was added to a final concentration of 0.2 g L-1.

Chapter 2: Materials and Methods
82
The fermentor was then inoculated aseptically with five 100 mL shake flasks cultures
previously grown overnight as described in Section 2.4.2. The progress of the
fermentation was monitored as in Section 2.5.1. Data was logged by on-line
measurements of DOT, pH, temperature and speed of the impeller using the
BioCommand software (BioFlo 110, New Brunswick, Hertfordshire, UK) as well as by
taking regular OD600 measurements as described in Section 2.9.2.
2.5.3. Fed-batch fermentations
Both the 2 L and 7.5 L fermentors described above were also used to perform fed-batch
fermentations. This was performed in order to minimize the accumulation of toxic by-
products of an exponentially growing culture by maintaining a limited growth carbon
source, in order to achieve higher biomass and protein expression yields (Shiloach & Fass
2005). This protocol described in this work follows a simple glycerol-supplementation
method where cells were first grown in batch mode as described in Section 2.5.1 and
2.5.2, in a medium containing 10 g L-1 glycerol. After the initial glycerol was consumed,
which was detected by a sharp rise in the DOT, indicative of reduced oxygen
consumption and thus of glycerol becoming limiting, the culture was supplemented using
a Watson Marlow 501U pump (Cornwall, UK) with an increasing feed rate of pre-
sterilized medium containing 10 g L-1 of NaCL, 10 g L-1 of yeast extract, 20 g L-1 of
tryptone and 500 g L-1 of glycerol. The feeding rate was calculated according to Equation
2.1 (Bernard & Payton 2001) and was modified every hour:
where F is the feed rate (L hr-1), µ is the specific target growth rate (hr-1), V is the
fermentor volume (L), x is the cell biomass (gDCW L-1), Y is the yield of cell mass per unit
of carbon source of glycerol (g g-1 ), and [Gly] is the concentration of glycerol in the feed
solution (g L-1). A value of 80% of the maximum growth rate obtained in the batch
cultures (Sections 2.5.1 and 2.5.2) was used for µ and n standard estimate for Y of 0.3 g g
L-1 was applied to calculate the feed rate using Equation 2.1 (Bernard & Payton 2001) .
Chapter 2: Materials and Methods
83
2.6. BIOCATALYST PREPARATION
2.6.1. Whole cell and lysate forms
Fresh cells where always used for whole cell bioconversions and were obtained as
described in Section 2.4.1 and Section 2.4.2. When a cell-free lysate was needed, the cells
were sonicated with a Soniprep 150 sonicator (MSE, Sanyo, Japan) using 10 seconds
on/off at 10 µm amplitude for 10 cycles. Cells were placed on ice to stop overheating
during the sonication. The sonicated lysate was then centrifuged at 5000 rpm in Falcon
tubes for 5 min to remove cell debris, and the clarified supernatant was finally aliquoted
into 1.5 mL Eppendorf vials to be stored at -20 oC and used within 1 month. Prior to the
initiation of a bioconversion, the frozen lysates (300µL) were thawed in a water bath at
30oC for typically 10 min and then immediately incubated with cofactors.
2.6.2. Purified enzymes (His6-tag purification)
The E. coli TK and CV2025 TAm expressed from plasmids pQR412 and pQR801
respectively both have an N-terminal His6-tag (Section 2.3.1 and 2.3.3) to facilitate rapid
single-step purification using a His Bind Quick 900 cartridge (EMD Biosciences,
Darmstadt, Germany). The cartridges were purchased packed with a pre-charged
cellulose matrix with tethered Ni2+ complex immobilised on Nα,Nα-Bis [carboxymethyl]-
L-lysine (NTA). The composition of all buffers used for the enzyme purification
procedure is shown in Table 2.2, the pH of all buffers was 7 for TK and 7.5 for TAm.
After equilibration of the cartridge with 10 mL binding buffer, the purification was
performed loading the lysate solution prepared as described in Section 2.6.1, following
the loading of the sample, the cartridge was washed with 20 mL wash and 10 mL binding
buffer. Elution was carried out with either strip or elution buffer depending whether or
not the beads needed to be regenerated.

Chapter 2: Materials and Methods
84
Table 2.2. His6-tag enzyme purification buffers used in Section 2.6.2.
Buffer
Components
Binding
500 mM NaCl, 20 mM Tris-HCl, 5 mM imidazole
Wash
50 mM Tris-HCl
Strip
50 mM EDTA, 50 mM Tris-HCl
Elution
1 M imidazole, 500 mM NaCl and 20 mM Tris-HCl
Following the elution, in order to remove free EDTA and EDTA-nickel complexes from
the elution buffer, the enzyme solution was dialyzed against 500 mL of 50 mM TRIS
buffer at pH 7.0 or 50 mM HEPES pH 7.5 for TK and TAm solutions respectively. The
buffer exchange was performed using a flat packed semi-permeable membrane with a
molecular weight cut-off of 14,000 Da (BioDesign, Carmel, NY, USA). The membrane
was left overnight at 4oC with gentle magnetic stirring. The purity of the dialyzed
enzymes was determined by SDS-PAGE as described in Section 2.9.5. The dialyzed
enzyme solution was stored in the fridge at 4°C for a period of up to 2 weeks before use.
2.7. SYNTHESIS OF SUBSTRATES AND PRODUCTS
2.7.1. Chemical synthesis of hydroxypyruvate
Hydroxypyruvate (HPA) was synthesized by reacting bromopyruvic acid with LiOH
following a previously described method (Morris et al., 1996). The details of the
synthesis were as follows: bromopyruvic acid (0.06 mol) was dissolved in 100 mL water
followed by careful addition of aq. LiOH (1M) until a stable pH of 9 was reached. At no
time during the addition was the pH allowed to exceed 9. The reaction mixture was then
adjusted to pH 5.0 by addition of glacial acetic acid and concentrated under vacuum to

Chapter 2: Materials and Methods
85
approximately 20 mL. Following refrigeration at -20oC overnight, the crude product was
washed with ethanol and then suspended in 50 mL ethanol at 25oC for 30 min. After
filtration the solid product was dried under vacuum to give a white or slightly yellowish
powder (expected yield is 2-4 g per batch) which was stored at -20oC.
2.7.2. Enzymatic synthesis of PKD
PKD was synthesized in a 100 mL scale bioconversion with 300 mM HPA, 350 mM
propionaldehyde (PA), 9 mM MgCl2, 2.4 mM thiamine pyrophosphate (TPP), pH 7.0 and
30% v/v of D469E TK lysate (final TK concentration of 0.3 mg mL-1). The reaction was
stirred for 10 hours at room temperature in a sealed flask and the pH was maintained at
7.0 using a 718 STAT Titrino pH controller (Metrohm Ion Analysis, Switzerland). The
solution was dried on silica and purified by column chromatography (ethyl acetate:
hexane, 1:1) to yield PKD as a colourless oil that crystallized on standing. The PKD ee
was determined as described in Section 2.9.6.
2.7.3. Chemical synthesis of ABT product standard
The chemical synthesis of ABT was performed as described by Ingram et al. (2007).
Briefly L-erythrulose (4 g, 33 mmol), was suspended in acetone:dimethoxypropane 9:1
v/v (30 mL) and p-toluenesulfonic acid (catalyst) was added. The mixture was stirred at
room temperature under N2 for 3 h during which time the reaction mixture became
homogeneous. The reaction was monitored by TLC using a 2:1 v/v, ethyl acetate:hexane
running solvent.
Sodium acetate (0.5 g) was added and the reaction stirred for a further hour before the
mixture was filtered and concentrated to dryness. The residue was purified by flash
chromatography on silica gel (ethyl acetate/hexane 1:2 v/v) to yield the desired 3,4-O-
isopropylidene acetal.

Chapter 2: Materials and Methods
86
To an aliquot of the produced acetal (487 mg, 3.02 mmol) in methanol (10 mL) was
added benzylamine (660 µL, 6.04 mmol) and then sodium cyanoborohydride (570 mg,
9.06 mmol). The pH was adjusted to pH 6.0 using acetic acid and the reaction was stirred
at room temperature for 6 hours. The reaction was monitored by TLC (1:1, ethyl
acetate:hexane). The mixture was concentrated under vacuum and the residue partitioned
between dichloromethane (100 mL) and sodium hydrogen carbonate (aq, sat) (100 mL)
with vigorous stirring.
Solid sodium carbonate was added to the suspension in small portions to ensure that the
final pH of the aqueous layer was 9. The layers were then separated, the aqueous phase
was extracted with further dichloromethane (two times 100 mL) and the organic phases
combined and concentrated to dryness. The residue was purified by flash chromatography
on silica gel (ethyl acetate/hexane 1:1 v/v then neat ethyl acetate) to yield the desired
amine as a 1:1 mixture of diastereomers.
To a solution of the previously produced amine (200 mg, 0.80 mmol) in MeOH (5 mL)
was added drop wise 1 M HCl (aq) to give a mixture that gave a dark red colour to moist
litmus paper. The reaction was stirred at room temperature and was monitored by TLC
(1:1 v/v, ethyl acetate:hexane). After 2 h the reaction was complete and the mixture
concentrated to dryness to yield the crude amine as the hydrochloride salt. This residue
was re-dissolved in MeOH (5 mL) and hydrogenated (balloon pressure) in the presence of
palladium on carbon (10% wt/wt, 100 mg) at room temperature overnight. The catalyst
was removed by filtration and the solvent removed under vacuum to yield 2-amino-1,3,4-
butanetriol as a 1:1 mixture of threo and erythro diastereomers.
2.7.4. Enzymatic synthesis of ABT and APD
The enzymatic synthesis of APD was performed in a 100 mL scale bioconversion with
200 mM PKD, 0.2 mM PLP and 30% v/v of CV2025 TAm lysate (final enzyme
concentration of 0.3 mg mL-1). To this mixture, a solution of 300 mM IPA (pH 7.5) was
added in a fed batch mode using a P-1 peristaltic pump (Pharmacia Fine Chemicals,
Chapter 2: Materials and Methods
87
Uppsala, Sweden) with a volume rate of 2.1 mL hr-1 for 48 hr until the total volume of the
reaction was approximately 200 mL. The temperature of the TAm catalyzed reaction was
maintained at 30oC using a circulating water bath (Grant Instruments, Cambridge, UK),
and the pH was kept at 7.5 by the automatic addition of 1 M NaOH using a 718 STAT
Titrino pH controller (Metrohm Ion Analysis, Switzerland).
After the bioconversion, the enzyme was spun down (5000 rpm, at 4 °C for 15 min) and
the mixture was additionally filtered through a 0.2 μm sterile filter. 50 g of Amberlite
IRA-410 resin (Sigma-Aldrich, Gillingham, UK) were added to the reaction mixture for 1
hr, and the resin was then removed by filtration. The remaining aqueous mixture was then
passed through 80 g of an Isolute SCX-2 ion exchange column (Biotage, Uppsala,
Sweden), and the column was washed with 400 mL of methanol. The column was then
eluted with 500 mL 4 M NH3 and the eluent was evaporated to yield the desired product.
The enzymatic synthesis of ABT was performed the same way as the one for APD,
expect that ERY was used instead of PKD as initial substrate.
2.7.5. Synthesis of derivatizing reagent
The derivatizing agent 6-aminoquinolyl-N-hydroxysuccinimidyl carbamate (AQC) was
synthesized ‘in house’ according to a previously published protocol (Cohen & Michaud,
1993). Di(N-succinimidyl)carbamate (3 g, 6 mmol), was refluxed in 25 mL of dry
acetonitrile. Dropwise addition of a 6-aminoquinoline (1.5 g, 5 mmol) solution in dry
acetonitrile was carried out over 45 minutes. Following a further 30 minutes reflux,
concentration was carried out to half the original volume. The solution was stored at –
20oC overnight. The crystals were then filtered off and stored in vacuo.

Chapter 2: Materials and Methods
88
2.8. BIOCONVERSION KINETICS
2.8.1. Microscale experimental platform
All microscale bioconversions were performed in a glass 96-well, flat-bottomed
microtiter plate with individual wells having a diameter of 7.6 mm and height of 12 mm
unless noted otherwise (Radleys Discovery Technologies, Essex, UK). The microplate
was covered with a thermo plastic elastomer cap designed to work with automated
equipment (Micronic, Lelystad, Netherlands).
All the bioconversions were performed using 300 µL total volume at 30 oC unless noted
otherwise, and orbital shaking was provided at 300 rpm with a Thermomixer Comfort
shaker (shaking diameter of 6 mm, Eppendorf, Cambridge, UK). TK single step reactions
were performed in 50 mM TRIS buffer and the concentration of cofactors MgCl2 and
thiamine pyrophosphate (TTP) were 9 mM and 2.4 mM respectively for all reactions.
TAm single step reactions and all the two step syntheses were carried out in 50 mM
HEPES buffer pH 7.5 unless noted otherwise and the concentration of TAm cofactor
pyridoxal-5-phosphate (PLP) was 0.2 mM in all cases. The whole cell suspension or
lysate with the cofactor solutions were always added first in the corresponding well and
left to incubate for 20 min at 30 oC, prior to initiation of the reaction by addition of the
substrate solutions.
Preliminary experiments showed that the initial cofactor incubation helped to ensure all
expressed TK or TAm was in the active holo-form. This practice also enabled more
consistent measurement of specific activity results, by avoiding initial non linear reaction
kinetics believed to be caused in some cases by the binding of the enzyme and cofactors.
Aliquots of 20 μL were taken at various time intervals and quenched with 180 or 380 μL
of a 0.1% v/v trifluoroacetic acid (TFA) solution for TK and TAm experiments
respectively. They were then centrifuged for 5 min at 5000 rpm and transferred into an

Chapter 2: Materials and Methods
89
HPLC vial for further analysis. The specific activities were determined as the amount of
PKD, ERY, AP, APD and ABT formed per unit of time normalized by the amount of
enzyme used in the reaction. The specific activity was based on the measured mass of
TAm or TK present in each bioconversion. For whole cell experiments, it was calculated
based on 50% of the dry cell weight of the cells being protein (Watson, 1972), combined
with the measured result of the percentage of TK and TAm by SDS-PAGE analysis
described in Section 2.95.
2.8.2. Preparative scale bioconversions
Bioconversions at preparative scale (volumes from 30 to 120 mL) were performed in a
150 mL titration vessel with thermostat jacket (Metrohm Ion Analysis, Switzerland).
Temperature was maintained at 30oC using a circulating water bath (Grant Instruments,
Cambridge, UK), mixing was achieved using a magnetic stirrer at 300 rpm, and the pH
was maintained at pH 7.5 unless noted otherwise by the use of an automated addition of 1
M NaOH using a 718 STAT Titrino pH controller (Metrohm Ion Analysis, Switzerland).
For preparative scale fed batch reactions, a peristaltic P-1 pump (Pharmacia Fine
Chemicals, Uppsala, Sweden) was used to add the desired substrate solution over time.
Sampling procedures were performed in the same way as in Section 2.8.1.
2.9. ANALYTICAL METHODS
2.9.1. Dry cell weight (DCW) measurement
1.5 mL aliquots of cell suspension were added to pre-dried and pre-weighed 2.2 mL
Eppendorf tubes which were then centrifuged at 13,000 rpm for 5 minutes (Eppendorf
AG, Germany). The supernatant was discarded and the vials were left to dry at 90oC for
24 hours. The biomass concentration in gDCW L-1 of the culture could then be calculated.
2.9.2. Optical density measurements for biomass quantification

Chapter 2: Materials and Methods
90
Optical density measurements were performed at a wavelength of 600 nm (OD600) using
an Ultraspec 4000 variable wavelength spectrophotometer (Pharmacia Biotech, USA). A
small aliquot of E. coli BL21 culture medium was taken from the shake flask cultures of
the bioreactors and diluted with RO water so that the optical density measurement was
between 0.1-0.8 absorbance units. A calibration curve relating the OD600 measurement
from a serial dilution of broth sample to the corresponding gDCW L-1 measurement was
constructed and is shown in Appendix I. The calibration relationship determined was that
1 unit of (OD600) was equal to 0.4 gDCW L-1. This relationship was unaltered for cells
transformed with TK, TAm or the double transformed cells.
2.9.3. Bradford assay for lysate total protein quantification
Protein concentrations of the lysates were obtained using the Bradford assay method
(Bradford, 1976) following the instructions of a commercial protein assay kit (Bio-Rad
Laboratories Inc., Hemel Hempstead, UK). The protein concentration was calibrated
against a bovine serum albumin standard curve which was generated for each assay
(Appendix II). Absorbance measurements at 595 nm were carried out on an ATI Unicam
UV/VIS spectrophotometer (Spectronic, Leeds, United Kingdom).
2.9.4. Purified enzyme quantification by UV absorbance.
The quantification of pure enzyme concentration was performed by UV absorbance at
280 nm using an ATI Unicam UV/VIS spectrophotometer (Spectronic, Leeds, United
Kingdom). Readings were blanked with the appropriate buffer solution. Absorbance
measurements were converted to protein concentration using the Beer-Lambert law:
A = ελc Equation 2.2 where A was the absorbance at 280 nm, ε was the extinction coefficient previously
determined as 93,905 M.cm-1 for TK (Martinez-torres et al., 2007) and 78,000 M.cm-1
for TAm (Matosevic, 2009) , λ was the path length equal to 1 cm, and c was the protein
concentration in mol L-1.

Chapter 2: Materials and Methods
91
2.9.5. SDS-PAGE electrophoresis
SDS-PAGE for protein analysis was carried out on a Mini-Protean II system (Bio-Rad
Laboratories Inc., Hemel Hempstead, UK) using 8% w/v Tris-Glycine comercial gels (1.5
mm, 10 well, Invitrogen, Paisley, UK). Clarified lysate or pure enzyme solutions were
mixed (1:1) with 2X protein sample buffer (Sigma-Aldrich, UK) and heated to 99o C in a
PCR machine (Techne LTD, Cambridge, UK) for 10 min. Samples were subsequently
loaded onto the gel using 20 µL per well. A range of 15 to 20 µg of total protein was
applied per lane to avoid saturation of the bands.
The gel was stained with 50 mL of Coomassie Blue staining solution containing 0.1%
(w/v) Coomassie Blue R-250, 40% (v/v) methanol and 10% (v/v) acetic acid and it was
microwaved for 1 minute. After washing the Coomassie Blue solution, the gel was de-
stained overnight with a solution 10% acetic acid and 40% v/v methanol. All gels were
visualized and quantified (where appropriate) on a Gel–Doc–it bioimaging system with
Labworks 4.5 software (Bioimaging systems, Cambridge).
2.9.6. HPLC methods
Separation and quantification of PKD, ERY and HPA was performed on a Dionex HPLC
system (Camberley, UK) with a Bio-Rad Aminex HPX-87H reverse phase column (300 x
7.8 mm, Bio-Rad Labs., Richmond, CA, USA), controlled by Chromeleon client 6.60
software . The system comprised a GP50 gradient pump, a FAMOS autosampler, an
LC30 chromatography column oven and an AD20 UV/Vis absorbance detector. The
HPLC method used has been described previously (Chen et al., 2008).
Separation and quantification of MBA, AP, APD and ABT was performed on an
integrated Dionex ultimate 3000 HPLC system (Camberley, UK) with an ACE 5 C18
reverse phase column (150mm×4.6 mm, 5 µm particle size; Advance Chromatography
Technologies, Aberdeen, UK) controlled by Chromeleon client 6.60 software. The HPLC

Chapter 2: Materials and Methods
92
method has been reported elsewhere (Kaulmann et al, 2007). To analyse ABT and APD,
the samples were derivatized by addition of an excess of 6-aminoquinolyl-N-
hydroxysuccinimidyl carbamate. The derivatizing reagent was synthesized in house as
described in Section 2.7.5, and the HPLC method used has been described previously
(Ingram et al, 2007).
The enantiomeric excess (ee) of the ketodiols was determined by derivatization via
dibenzoylation for satisfactory peak resolution by chiral HPLC. This was performed on a
Varian Prostar instrument equipped with a Chiracel AD chiral column (Daicel; Chiral
Technologies Europe, France, 25 cm × 0.46 cm) and a mobile phase of n-hexane/2-
propanol solvent mixture (90:10 v/v) was used. The method has been described in more
detail elsewhere (Cázares et al., 2010). The ee of ABT and APD was determined by first
derivatizing the amino alcohol to the respective benzoate form. The assay was performed
against the four diastereomer samples of the benzoate synthesized as described elsewhere
(Smith et al., 2010) using chiral HPLC: Chiracel-OD column (Daicel); mobile phase,
isopropanol/hexane (5:95); flow rate, 0.8 mL/min, detection, UV 210 nm.
Figure 2.2 shows examples of HPLC profiles for the chiral separation and ee
determination of (3S)-1,3-dihydroxypentan-2-one (S-PKD) and (3R)-1,3-
dihydroxypentan-2-one (R-PKD), as well as the HPLC profiles for the detection and
quantification (non chiral) of APD , HPA, ERY, PKD, AP and MBA. The standard
graphs for all of the above methods can be found in Appendix III.
2.9.7. LC−ECI−MS analysis
Liquid chromatography-electrospray ionisation-mass spectrometry (LC−ESI –MS) was
performed on an Agilent 1100 Series System with a Finnigan LTQ mass spectrometer.
Operating conditions of the ESI interface in positive ion mode: capillary temperature
300◦C, capillary voltage 9V, spray voltage 4.5 kV, sheath gas 80, auxiliary gas 30, and
sweep gas 0 arbitrary units. Results are shown in Appendix XII.

Chapter 2: Materials and Methods
93
Figure 2.2. HPLC profiles from different reaction mixtures obtained as described in Section 2.8.1
for (a) the chiral separation and ee determination of (3S)-1,3-dihydroxypentan-2-one (S-PKD) and
(3R)-1,3-dihydroxypentan-2-one (R-PKD), and for the detection and quantification (non chiral) of (b)
APD, (c) HPA and ERY, (d) HPA and PKD, (e) AP and (f) MBA. HPLC conditions and sample
preparation as described in Section 2.9.6.

† The results presented in this chapter have been published as: Rios-Solis L., M. Halim, A. Cázares, P. Morris, J. M. Ward, H. C. Hailes, P. A. Dalby, F. Baganz, and G. J. Lye. 2011. A toolbox approach for the rapid evaluation of multi-step enzymatic syntheses comprising a “mix and match” E. coli expression system with microscale experimentation. Biocat and Biotrans. 29:192-203.
3. EVALUATION OF DE NOVO TK-
TAM PATHWAYS IN A WHOLE
CELL BIOCATALYST†
3.1. INTRODUCTION
As described in Section 1.2.3.1, it is now possible to design de novo non-native pathways
in heterologous hosts, to carry out specific non-natural bioconversions producing chiral
compounds difficult to obtain by existing biosynthetic pathways or chemical synthesis
(Burkart, 2003; Roessner and Scott, 2003; Prather and Martin, 2008; Dalby et al., 2009).
The de novo design of synthetic pathways has recently been demonstrated for the
sequential two-step reaction of carbon-carbon bond formation using a transketolase (TK)
enzyme, followed by a transaminase (TAm) as described in Section 1.5.4 for the
synthesis of ABT (Scheme 3.1) (Ingram et al., 2007).
Scheme 3.1. Reaction scheme of the de-novo TK-TAm pathway for the synthesis of chiral amino
alcohol (2S,3R)-2-amino-1,3,4-butanetriol (ABT), from achiral substrates glycolaldehyde (GA) and
hydroxypyruvate (HPA).
O O -
O O H
O O H
H
O H O H
O O H
O H O H
N H 2 O H
CO 2
TK TAm
R' N H 2
R R' O
R
GA ERY L - ( 2S , 3R )-ABT
HPA
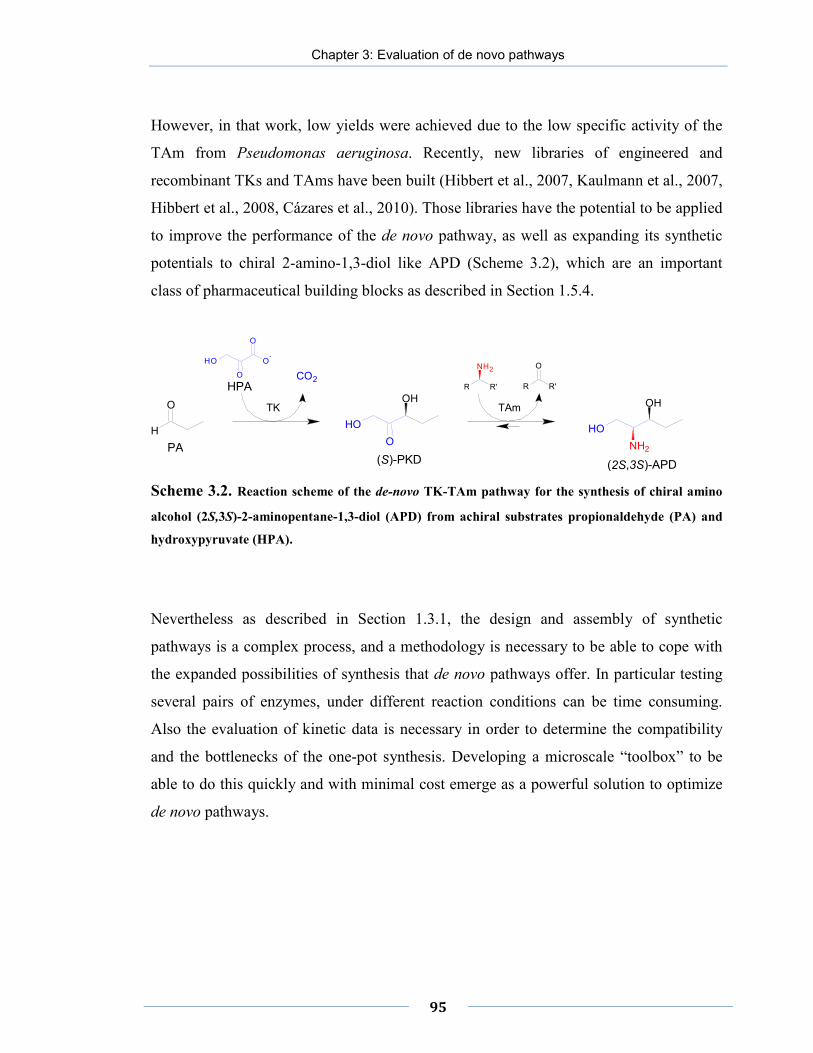
Chapter 3: Evaluation of de novo pathways
95
However, in that work, low yields were achieved due to the low specific activity of the
TAm from Pseudomonas aeruginosa. Recently, new libraries of engineered and
recombinant TKs and TAms have been built (Hibbert et al., 2007, Kaulmann et al., 2007,
Hibbert et al., 2008, Cázares et al., 2010). Those libraries have the potential to be applied
to improve the performance of the de novo pathway, as well as expanding its synthetic
potentials to chiral 2-amino-1,3-diol like APD (Scheme 3.2), which are an important
class of pharmaceutical building blocks as described in Section 1.5.4.
Scheme 3.2. Reaction scheme of the de-novo TK-TAm pathway for the synthesis of chiral amino
alcohol (2S,3S)-2-aminopentane-1,3-diol (APD) from achiral substrates propionaldehyde (PA) and
hydroxypyruvate (HPA).
Nevertheless as described in Section 1.3.1, the design and assembly of synthetic
pathways is a complex process, and a methodology is necessary to be able to cope with
the expanded possibilities of synthesis that de novo pathways offer. In particular testing
several pairs of enzymes, under different reaction conditions can be time consuming.
Also the evaluation of kinetic data is necessary in order to determine the compatibility
and the bottlenecks of the one-pot synthesis. Developing a microscale “toolbox” to be
able to do this quickly and with minimal cost emerge as a powerful solution to optimize
de novo pathways.
O O -
O O H
O
H
O H
O O H
O H
N H 2 O H
CO 2
TK TAm R'
N H 2 R R'
O R
PA ( S )-PKD ( 2S , 3S )-APD
HPA

Chapter 3: Evaluation of de novo pathways
96
3.2. AIM AND OBJETIVES
The aim of this chapter is to establish a microscale “toolbox” for the rapid evaluation of
different variants of TK and TAm for the one-pot synthesis of a range of amino-alcohols.
The approach will involve the construction of de novo engineered pathways that are
based on a double transformed E. coli expression system, which combined with the
microscale high-throughput platform and the gathering of kinetic data, could enable
systematic evaluation of different pairs of enzymes with different substrates under a
range of reaction conditions. The key objectives of this chapter are thus:
• Construction of various de novo engineered TK-TAm pathways based on a
double transformed E. coli expression system and previously constructed TK and TAm
libraries.
• Evaluation of cell growth kinetics and protein expression profiles in shake flasks
for cells containing different de novo TK-TAm pathways.
• Determination of appropriate reaction conditions for various multi-step syntheses,
evaluating the compromises to made from each enzyme-substrate combination.
• Determination of the best TK candidate for the synthesis of PKD and ERY and
the best TAm candidate for the synthesis of APD and ABT.
• Demonstration of the microscale toolbox approach by achieving the one-pot
syntheses of ABT and APD using the most appropriate forms of TK-TAm
expressing biocatalysts.

Chapter 3: Evaluation of de novo pathways
97
3.3. RESUTLS
3.3.1. Biocatalyst production (TK-TAm)
In order to separately regulate expression of the TK and TAm enzymes in E. coli, a dual
plasmid system was selected to facilitate the “mix and match” approach first proposed by
Hussain & Ward (2003). This was based on two plasmids with different origins of
replication and antibiotic resistance genes that would enable the rapid evaluation of
different variants of TK and TAm (Section 2.3.1 and 2.3.3).
The verification that the double transformations were successful was performed by
running DNA agarose and SDS PAGE gels as described in Section 2.2.2 and 2.9.5. To
establish the metabolic burden of the two plasmids on the host cells, five different whole
cell biocatalysts were initially generated and evaluated in shake flask fermentations.
Growth kinetics were obtained with cultures of E. coli BL21-Gold (DE3) containing
either no plasmid, the single TK or TAm gene expressing plasmids, or both the TK and
TAm plasmids, in each case either induced or non induced. The results are shown in
Figure 3.1.

Chapter 3: Evaluation of de novo pathways
98
Figure 3.1. Shake flask fermentation kinetics for E. coli BL21-Gold (DE3) grown in LB-glycerol
medium at 37 oC with (▼) untransformed cells, and cells transformed with (Δ) pQR412 (TK), (●)
pQR801 (CV2025 TAm), (ο) double transformed uninduced strain with pQR801 and pQR412, (□)
double transformed strain induced with 0.2 mM IPTG after 6 hours of cell growth. Fermentations
performed as described in Section 2.4. Error bars represent one standard deviation about the mean
(n=3).
Chapter 3: Evaluation of de novo pathways
99
Single transformed strains with plasmid pQR412 (TK) or pQR801 (TAm) reached
biomass concentrations of 2.1 and 1.8 gDCW l-1 respectively. These were 12.5% and 25%
less than for the non transformed strain respectively. The double transformed and
induced strain obtained a final biomass concentration of 1.2 gDCW l-1, representing nearly
a 50% decrease compared with the non transformed strain. This decrease in growth,
however, was compensated by the increase in enzyme synthesis which was expected due
to the metabolic burden caused by the maintenance and expression of two plasmids.
In terms of enzyme expression levels, TK and TAm (induced with IPTG) in the single
transformed cells were found to represent 20% and 40% w/w of the total protein
respectively. For the double transformed strain, the TK concentration diminished
compared to the single TK plasmid strain, and after inducing at a biomass concentration
of 1 gDCW l-1 for 4 hours, the final enzyme expression of TK and TAm represented 8%
and 36% w/w of the total protein. No difference in growth or enzyme expression was
found by using engineered TKs D469T and D469E in the double transformed catalyst.
Figure 3.2 shows the SDS-PAGE gel from cell extracts expressing individually TK and
TAm and also for the double transformed biocatalyst.

Chapter 3: Evaluation of de novo pathways
100
Figure 3.2. SDS-PAGE gels showing expression of TK and TAm in cellular extracts of E. coli
BL21(DE3)-Gold cells. Lane 1 is protein marker, lane 2 is cellular extracts with single plasmid
pQR412 (TK), lane 3 is the cellular extracts with single plasmid pQR801, lane 4 and 5 are cellular
extracts of double transformed cells with plasmid pQR412 (TK) and pQR801 (TAm). Biocatalysts
produced as described in Figure 3.1 and Section 2.4. Molecular weight of TK is 73 kDa (Section
1.5.2.1) and molecular weight of TAm is 51 kDa (Section 1.5.3.1.)

Chapter 3: Evaluation of de novo pathways
101
Because of the significantly lower activity of the TAm compared to the TK (Chen et al.,
2006; Ingram et al., 2007), this method of induced expression of TK and TAm was
considered acceptable and was used to prepare all the biocatalysts for the later two-step
bioconversions performed in Section 3.7.
3.3.2. Considerations for one-pot TK-TAm synthesis
The use of multi-step enzymatic syntheses necessarily requires some compromises to be
made regarding the optimum reaction conditions for each enzyme. This is particularly
acute with isolated enzymes but can be alleviated, to some extent, by the use of whole
cell biocatalysts. In order to rapidly collect the necessary data that will enable informed
compromises to be made, all the following experiments have been performed using the
microscale tools described in Section 2.8.1. This allowed an efficient and accelerated
selection of the global reaction conditions that would be use in the one-pot syntheses
(Section 3.7).
Optimum conditions reported for the in vitro TK-catalyzed synthesis of ERY was pH 7.0
using TRIS buffer at 25 oC (Hibbert et al., 2007; Ingram et al., 2007). Here, for PKD
synthesis using whole cells with E. coli TK D469E, the optimum pH was found to be in
the range pH 6.5-7 as shown in Figure 3.3. This value was similar to the optimum pH of
7.0 reported the E. coli TK D469T for the synthesis of PKD (Chen et al., 2008).
For the CV2025 TAm the optimum temperature reported for the synthesis of amino
alcohols was 37oC (Kaulmann et al., 2007; Smith et al., 2010). The optimum pH for the
whole cell TAm synthesis of ABT was found in this work to be pH 7.5 (Figure 3.4). This
pH was in agreement with the pH of 7.5 found using the CV2025 TAm for the synthesis
of APD (Smith et al., 2010).
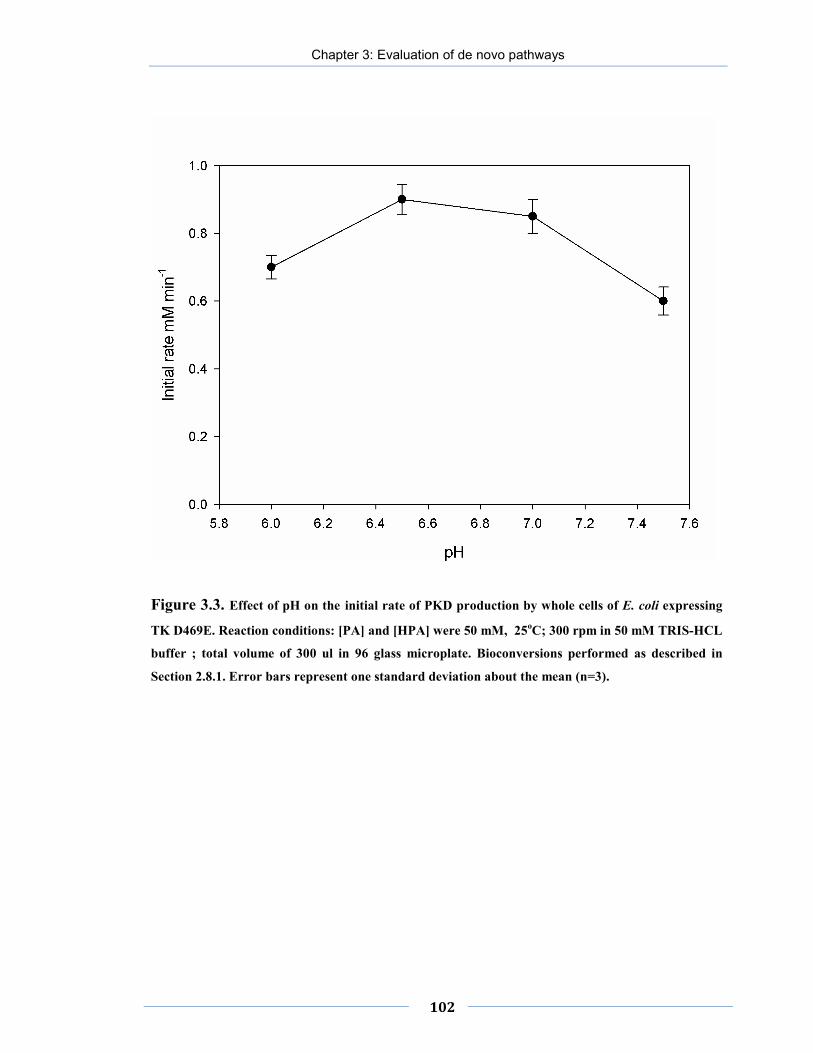
Chapter 3: Evaluation of de novo pathways
102
Figure 3.3. Effect of pH on the initial rate of PKD production by whole cells of E. coli expressing
TK D469E. Reaction conditions: [PA] and [HPA] were 50 mM, 25oC; 300 rpm in 50 mM TRIS-HCL
buffer ; total volume of 300 ul in 96 glass microplate. Bioconversions performed as described in
Section 2.8.1. Error bars represent one standard deviation about the mean (n=3).
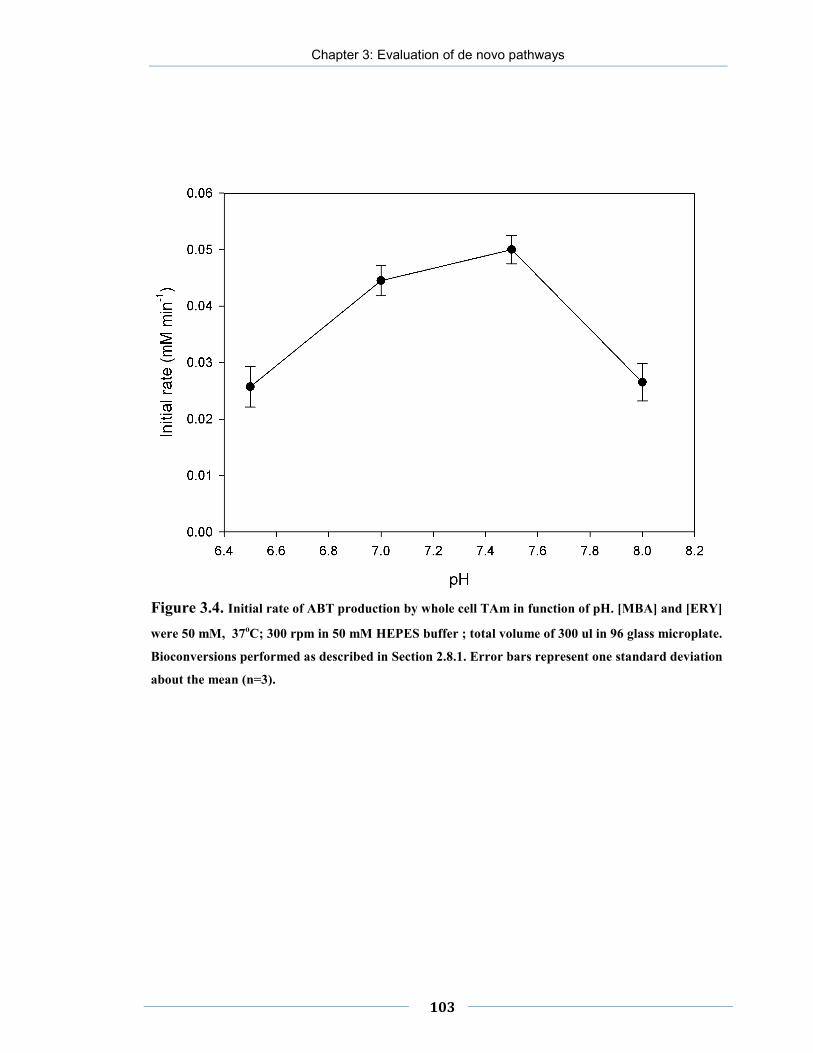
Chapter 3: Evaluation of de novo pathways
103
Figure 3.4. Initial rate of ABT production by whole cell TAm in function of pH. [MBA] and [ERY]
were 50 mM, 37oC; 300 rpm in 50 mM HEPES buffer ; total volume of 300 ul in 96 glass microplate.
Bioconversions performed as described in Section 2.8.1. Error bars represent one standard deviation
about the mean (n=3).

Chapter 3: Evaluation of de novo pathways
104
Given the different optimum conditions for TK and TAm, a number of compromises on
selected reaction conditions needed to be made. In order to evaluate these compromises,
the synthesis of 10 mM ABT using MBA as amino donor was used as a reference
reaction (Scheme 3.1). TK bioconversions in the presence of the working concentration
of the TAm cofactor PLP demonstrated that this did not have any effect on the TK
reaction. The same finding was obtained for the effect of TPP and Mg2+ on the TAm
bioconversion (data not shown). Reactions of TK carried at a pH of 7.5 showed a
decrease of TK activity of 33% as shown in Figure 3.3, nevertheless this pH was selected
for subsequent studies considering the generally higher activity of TK compared to TAm
(Figures 3.3 and 3.4).
In terms of reaction temperature, a control reaction using a lysate of untransformed E.
coli BL21-Gold (DE3) showed that at 37 oC up to 50% of the HPA substrate was
consumed by non-specific side reactions after 2 hours (Figure 3.5). In contrast at 30 oC,
less than 5% of HPA was consumed over the same time.
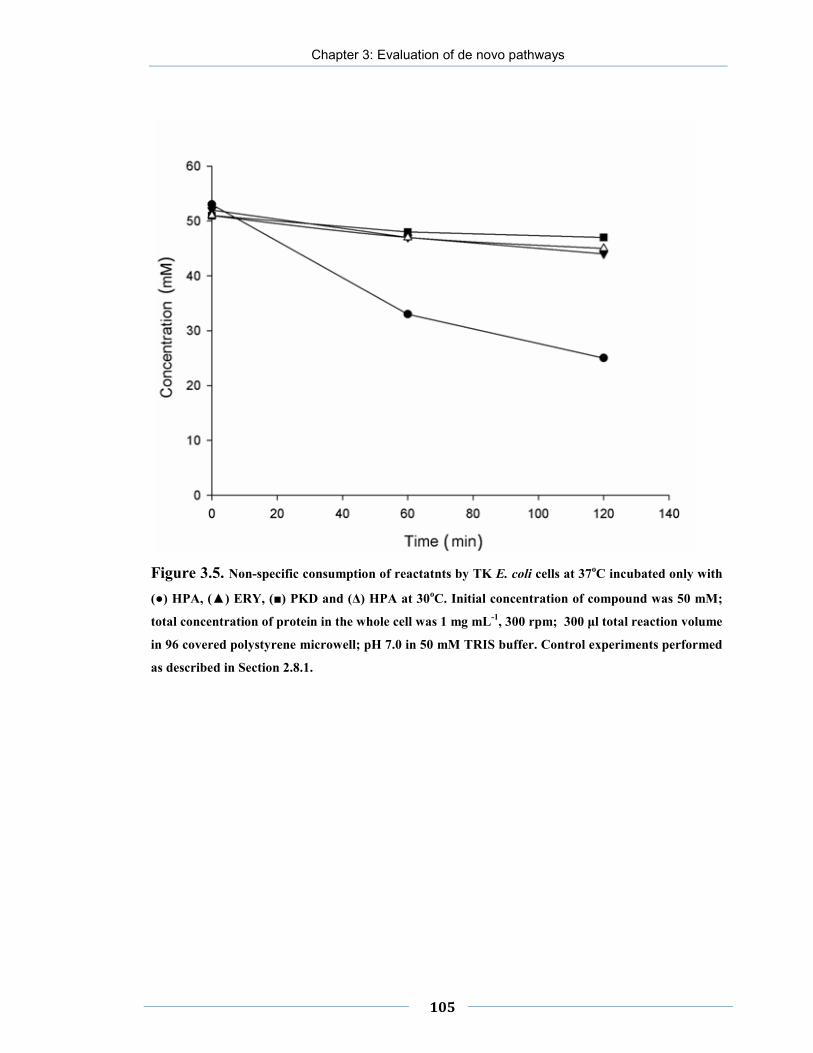
Chapter 3: Evaluation of de novo pathways
105
Figure 3.5. Non-specific consumption of reactatnts by TK E. coli cells at 37oC incubated only with
(●) HPA, (▲) ERY, (■) PKD and (Δ) HPA at 30oC. Initial concentration of compound was 50 mM;
total concentration of protein in the whole cell was 1 mg mL-1, 300 rpm; 300 μl total reaction volume
in 96 covered polystyrene microwell; pH 7.0 in 50 mM TRIS buffer. Control experiments performed
as described in Section 2.8.1.

Chapter 3: Evaluation of de novo pathways
106
Consequently the TK-TAm reactions were performed at 30 oC to avoid non-specific
HPA metabolism. With regards to buffer selection, control experiments using TRIS and
phosphate buffer inhibited the CV2025 TAm compared to HEPES buffer (Figure 3.6).
It has been reported that HEPES buffer catalyzes biomimetic reactions between HPA and
aldehydes at 37 oC (Smith et al., 2006), nevertheless at 30 oC, control experiments
showed that less than 5% of HPA was lost by the biomimetic activity of 50 mM HEPES
after two hours (data not shown). Based on all these considerations, the reaction
conditions selected for the in vitro evaluation of the different TK-TAm variants were 30 oC and pH 7.5 in 50 mM HEPES buffer.

Chapter 3: Evaluation of de novo pathways
107
Figure 3.6. Effect of buffer composition on initial rate of ABT production by TAm in whole cell
form. [MBA] and [ERY] were 50 mM, TAm was 0.3 mg mL-1, 37oC; 300 rpm in 50 mM of each
buffer ; total volume of 300 ul in 96 glass microplate. Bioconversions performed as described in
Section 2.8.1. Error bars represent one standard deviation about the mean (n=3).

Chapter 3: Evaluation of de novo pathways
108
3.3.3. Bioconversion with TK
Both the TK and TAm bioconversions were initially studied individually under
conditions suitable for later two-step reactions (Section 3.4). Information on specific
activities, ee and final yields gathered from those experiments would then enable to
successfully “mix and match” the best pair of enzymes to synthesize specific amino
alcohols.
Initial TK kinetics experiments showed that the activities and final yields obtained with
E. coli TK lysates and whole cells were similar (Appendix IV), therefore data reported
here for TK bioconversions were performed only with lysates containing the different
TK variants. From TK mutant libraries developed previously (Hibbert et al., 2008; Smith
et al., 2008, Cázares et al.,2010), the TK variants D469E, D469T and the wild type TK
were selected as candidates due to their catalytic potential for the synthesis of ERY
and/or PKD. Using HPA, the TK reactions were irreversible due to the release of CO2 as
a side product (Mitra & Woodley, 1996), and yields of more than 90% mol/mol were
obtained using concentrations up to 300 mM of HPA and the aldehyde GA or PA (data
not shown). In contrast, TAm reaction yields were severely hampered in concentrations
higher than 10 mM using MBA as amino donor (Appendix VI), hence initial TK
bioconversions studies were performed at this lower concentration.
Figure 3.7 shows the kinetics of ketodiol production for different combinations of TKs
and aldehyde acceptors. The quantified activities, yields and measured ee values are
summarized in Table 3.1.

Chapter 3: Evaluation of de novo pathways
109
Figure 3.7. Bioconversion kinetics showing ketodiol synthesis using different TK lysates and
aldehyde acceptors: (●) ERY with wild type TK, (▼) ERY with D469T TK, (■) ERY with D469E
TK, (Δ) PKD with D469T TK, (□) PKD with D469E TK, (ο) PKD with wild type TK. Reaction
conditions: 10 mM [HPA] and 10 Mm [GA] or [HPA], 2.4 mM TTP, 9 mM Mg2+, 0.3 mg mL-1 TK,
pH 7.5 in 50 mM TRIS, 30 oC. Bioconversions performed as described in Section 2.8.1. Error bars
represent one standard deviation about the mean (n=3).

Chapter 3: Evaluation of de novo pathways
110
Table 3.1. Measured specific activities, product yields and ee for the TK lysate catalyzed
bioconversions shown in Figure 3.7. The specific activities were determined as described in Section
2.8.1.
TK variant Aldehyde
Initial specific activitya,c
(µmol min-1 mg-1) ee
(%)
Final conversionb
(%mol/mol) Wild type GA 6.62 ± 0.13 >95 100 Wild type PA < 0.1 ndd < 1
D469T GA 5.13 ± 0.43 85 95
D469T PA 1.98 ± 0.27 64 98 D469E GA 4.96 ± 0.39 nd 100
D469E PA 1.49 ± 0.26 >90 90
aThe initial specific activity is based on the measured mass of TK in each bioconversion. bFinal conversion was determined at t=70 min. c The error of the specific activity represents one standard deviation about the mean (n=3). nd = not determined
The wild type TK was selected for ERY synthesis because it presented the highest
activity and ee of 6.6 µmol min-1 mg-1 and >95% respectively. Gyamerah & Willetts
(1997) obtained an activity of 13.2 µmol min-1 mg-1 for the same HPA and GA reaction
using wild type E. coli TK. This was in agreement with the work described here
considering the differences in concentration of substrates used.
For the synthesis of PKD, the highest activity was 1.98 µmol min-1 mg-1 using the TK
mutant D469T, while no activity after 70 min of reaction was detected using the wild

Chapter 3: Evaluation of de novo pathways
111
type enzyme. The ee of PKD obtained with TK D469E was >90%, compared to a 64%
ee of D469T. Due to the importance of the ee in the synthesis of optically pure amino
alcohols, the TK mutant D469E was selected even though it had a 25% lower activity
than D469T. The D469E mutation is in the pyrimidine binding domain of TK, and is
assumed to enable activity towards PA because it replaces the original interaction of Asp
with the C-2 hydroxyl group of GA, by creating a specific interaction between the Glu
and the methyl group of the new substrate (Hibbert et al., 2008; Cázares et al., 2010).
3.3.4. Bioconversions with TAm
Single step TAm bioconversions focused on the CV2025 TAm as it had already been
shown to be the best candidate for amino alcohol synthesis among several other
transaminases cloned in previous work (Kaulmann et al., 2007). The comparison of in
vitro and in vivo catalytic activity of CV2025 TAm had not previously been reported, so
it was investigated here where a whole cell TAm biocatalyst was compared with a lysate
for the synthesis of a number of ketodiols.
Figure 3.8 shows product formation kinetics using either MBA or IPA as amino donors
and PKD as amino acceptor. Due to the volatility of IPA, an excess concentration of 100
mM IPA was initially used instead of 10 mM MBA to compensate for any loss due to
evaporation. The results of activities and final yields of both amino alcohols are
summarized in Table 3.2.

Chapter 3: Evaluation of de novo pathways
112
Figure 3.8. Bioconversion kinetics showing APD synthesis using CV2015 TAm in either lysate or
whole cell form with different amino donors: (●) whole cell with MBA, (▲) whole cell with IPA, (○)
lysate with MBA, (Δ) lysate with IPA. Reaction conditions : 10 mM [MBA] or 100 mM [IPA], 10 mM
[PKD], 0.2 mM PLP, 0.3 mg mL-1 TAm, pH 7.5 in 50 mM HEPES, 30 oC. Bioconversions performed
as described in Section 2.8.1. Error bars represent one standard deviation about the mean (n=3).

Chapter 3: Evaluation of de novo pathways
113
Table 3.2. Measured specific activities and product yields for the TAm catalyzed conversion of PKD and
ERY. The specific activities were determined as describe in Section 2.8.1.
Biocatalyst form
Amino donor
Amino acceptor
Initial specific activitya,c (µmol
min-1 mg-1)
Final conversionb (%mol/mol)
Whole cell MBA PKD 0.074 ± 0.006
95
Lysate MBA PKD 0.034 ± 0.003 83
Whole cell IPA PKD 0.029 ± 0.0035 96 Lysate IPA PKD 0.015 ± 0.003 75
Whole cell MBA ERY 0.096±0.005 92 Lysate MBA ERY 0.045±0.003 86
Whole cell IPA ERY 0.035±0.05 91 Lysate IPA ERY 0.026±0.04 71
aThe specific activity was based on the measured mass of TAm present in each bioconversion. For
whole cell experiments, it was calculated based on 50% of the dry cell weight of the cells being
protein (Watson, 1972), and SDS-PAGE analysis that showed that 40% of the protein was TAm. bYield was determined at t=30 hours. c The error of the specific activity represents one standard deviation about the mean (n=3).
The CV2025 TAm showed a 4 fold increase in yield and a 40 fold improvement in
specific activity (Figure 3.8 and Table 3.2) compared to initial work with a β-alanine-
pyruvate transaminase from Pseudomonas aeruginosa (Ingram et al., 2007).
The final yield of ABT of 92 and 86 % mol/mol using whole cell and lysates respectively
improved the previously reported values of 14-22% mol/mol (Kaulmann et al., 2007).

Chapter 3: Evaluation of de novo pathways
114
The quantitative conversion of the reaction observed in Figure 3.8 and Table 3.2 was in
agreement with the equilibrium constants obtained for a similar transamination of
pyruvate with MBA using the ω-transaminase from Bacillus thuringiensis JS64, showing
that the forward reaction was thermodynamically more favourable than the reverse
reaction (Shin & Kim, 1998).
Smith et al., (2010) obtained a 93% mol/mol yield for the synthesis of APD with the
CV2025 TAm using an excess of PKD (molar ratio of 1.5 PKD/IPA). In this work, the
use of whole cells enabled to reach an almost complete conversion of the substrates with
a final yield of 96 % mol/mol without having to use an excess of the chiral ketodiol.
Nevertheless, working with higher concentrations severely inhibited the bioconversion as
shown in Figure 3.9, which illustrates the kinetics of TAm production of APD using
initial equimolar concentration of substrates of 50 mM PKD with IPA or MBA as amino
donors.
After 40 hours, the final yields were 52 and 23 % using IPA and MBA respectively,
underlying the strong inhibition caused by MBA. This inhibitory effect of MBA has also
been reported in the literature with transaminases from Klebsiella pneumonia and Vibrio
fluvialis (Shin and Kim, 1997; Yun et al., 2004). In this case the use of in situ product
removal by ion exchange resins or coupled reactions could be a possible solution as has
been shown by others (Truppo et al., 2010).
Analyzing the results of Table 3.2 and Figure 3.8, similar yields were obtained using
ERY or PKD as substrates, but the specific activities using ERY were between 17% and
42% higher than those of PKD.
.
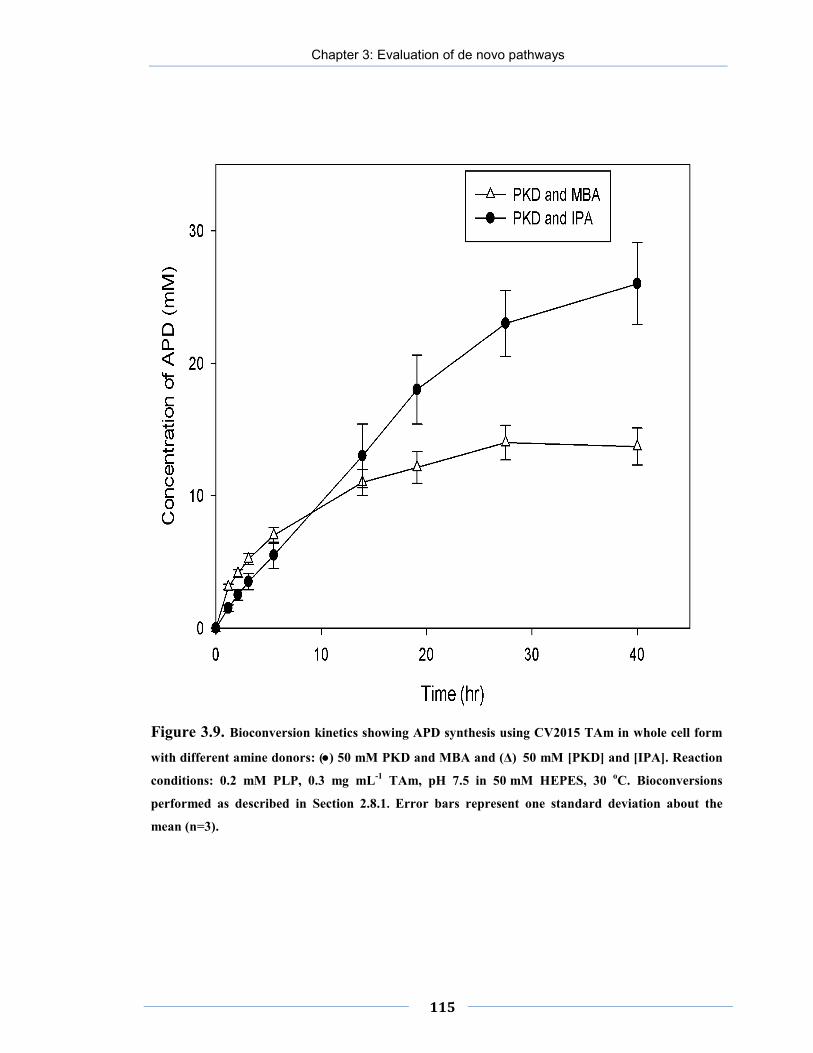
Chapter 3: Evaluation of de novo pathways
115
Figure 3.9. Bioconversion kinetics showing APD synthesis using CV2015 TAm in whole cell form
with different amine donors: (●) 50 mM PKD and MBA and (Δ) 50 mM [PKD] and [IPA]. Reaction
conditions: 0.2 mM PLP, 0.3 mg mL-1 TAm, pH 7.5 in 50 mM HEPES, 30 oC. Bioconversions
performed as described in Section 2.8.1. Error bars represent one standard deviation about the
mean (n=3).

Chapter 3: Evaluation of de novo pathways
116
For synthesis of both amino alcohol products, the whole cell biocatalysts performed
better than the lysates demonstrating the beneficial effect of using TAm in vivo for these
bioconversions. This phenomenon has also been reported in the literature, where higher
yields using whole cell TAm biocatalysts have been attributed to better stability of the
enzyme inside the cell (Shin & Kim 1997), to metabolism consumption of inhibitory
compounds (Shin & Kim, 1999), or to the effect of the cell membrane in partitioning
inhibitory components between the inside and outside of the cell (Yun et al., 2004).
In this work, the inhibitory product acetophenone (AP) was not further metabolized by
the whole cells and MBA and AP where found to be more inhibitory than IPA and
acetone (Figure 3.9). In contrast, when using TAm lysates lower yields were obtained
using IPA (75 % and 71 % mol/mol for APD and ABT respectively) compared to MBA
(83 % and 86 % mol/mol respectively). Addition of more enzyme and PLP after the
initial reaction had stopped partially restored the biocatalytic activity, suggesting that the
improved yield using whole cells could be attributed to an increase in stability of the
enzyme.
Based on the results in Table 3.2, the whole cell TAm biocatalyst was selected for further
study because of its superior performance compared to the lysate. IPA appears preferable
as amine donor because of its advantages in terms of economy, downstream processing
and reduced inhibition compared to MBA. However, both amine donors were evaluated
for one-pot synthesis reactions in Section 3.7.
3.3.5. One-pot synthesis of amino alcohols
In order to achieve the one-pot synthesis of amino alcohols, two whole cell biocatalysts
were constructed both with plasmid pQR801 expressing the CV2025 TAm, and with
either pQR412 expressing the TK mutant D469E or the wild type variant for APD and
ABT syntheses respectively.

Chapter 3: Evaluation of de novo pathways
117
The first one-pot synthesis of APD using MBA as amino donor gave a poor yield (15 %
mol/mol) of amino alcohol after 20 hours but another product was detected by HPLC
analysis after derivatizing the samples (Section 2.9.6). This compound was identified as
serine, which was possibly produced by the transamination of HPA. To overcome this
problem, MBA was subsequently added in fed batch mode after the TK reaction was
complete. A typical reaction kinetic profile for this mode of operation is shown in Figure
3.10.
The volume added of the solution of MBA was equal to the volume of the reaction
mixture; hence the original concentration of the reactants was diluted 2-fold after MBA
addition. The first step comprising the TK reaction reached completion after 4 hours with
a specific activity of 2.68 µmol min-1 mg-1. The second step TAm reaction had a specific
activity of 0.067 µmol min-1 mg-1 and reached a maximum APD yield of 90 % mol/mol
after 21 hours of reaction with MBA. This measured activity was in agreement with the
one found for the single TAm reaction (Table 3.2).

Chapter 3: Evaluation of de novo pathways
118
Figure 3.10. Typical bioconversion kinetics for the sequential whole cell TK-TAm catalytic
synthesis of APD with addition of amine donor (MBA) after 4 hours : (▼) PKD, (●) HPA, ( Δ) APD,
(◊) MBA and (ο) AP. Reaction conditions (TK step): 20 mM [HPA] and [PA], 0.4 mM PLP, 2.4 mM
TTP, 9 mM Mg2+, 0.095 mg mL-1 TK, 0.43 mg mL-1 TAm, pH 7.5 in 50 mM HEPES, 30 oC. TAm
step was initiated by adding MBA solution to reach a concentration of 10 mM which resulted in a 2
fold dilution of reactants. Bioconversions performed as described in Section 2.8.1.

Chapter 3: Evaluation of de novo pathways
119
When using IPA as amine donor at the compromise temperature of 30 oC (Section 3.4),
the TAm did not show any noticeable activity towards HPA, GA or PA over 5 hours.
This was not the case at 37 oC, where activity towards TK substrates was detected in that
period of time (data not shown). This suggested it was possible to perform the
bioconversion of APD using IPA in a true one-pot synthesis at 30 oC as shown in Figure
3.11, were the TK reaction was completed after 5 hours, leading to a 90 % mol/mol yield
of APD after 25 hours.
The specific activities of TK and TAm in the one-pot synthesis were 1.46 and 0.022
µmol min-1 mg-1 respectively, which were also in agreement with the corresponding TK
and TAm specific activities for the single bioconversions (Table 3.1 and 3.2). Similar
results were obtained for the one-pot synthesis of ABT using IPA as amine donor,
reaching a final yield of 87 % mol/mol after 25 hours as shown in Figure 3.12.
The TK reaction for the ABT synthesis was completed in 1.5 hours instead of the 5 hours
required for the APD synthesis. This was in agreement with the higher activity of the
wild type TK enzyme towards ERY synthesis in comparison to the activity of the D469E
variant towards PKD synthesis (Table 3.1).
The 87% mol/mol yield for ABT synthesis represented an improvement of 4-fold in yield
in a quarter of the reaction time compared to previous work (Ingram et al, 2007). The 90
% mol/mol yield for APD represented a 7-fold improvement in a third of the reaction
time compared to the previously reported two separated steps synthesis (Smith et al.,
2010).

Chapter 3: Evaluation of de novo pathways
120
Figure 3.11. Typical bioconversion kinetics for the one-pot, whole cell TK-TAm catalytic synthesis
of APD using IPA as amine donor: (▼) PKD, (● ) HPA, and (Δ) APD. Reaction conditions: 10 mM
[HPA] and [PA], 100 mM [IPA], 0.2 mM PLP, 2.4 mM TTP, 9 mM Mg2+, 0.095 mg mL-1 TK , 0.42
mg mL-1 TAm, pH 7.5 in 50 mM HEPES, 30 oC. Bioconversions performed as described in Section
2.8.1.

Chapter 3: Evaluation of de novo pathways
121
Figure 3.12. Typical bioconversion kinetics for the one-pot, whole cell TK-TAm catalytic synthesis
of ABT using IPA as amine donor: (▼) ABT, (●) HPA, and ( ο) ERY. Reaction conditions: 10 mM
[HPA] and [GA], 100 mM [IPA], 0.2 mM PLP, 2.4 mM TTP, 9 mM Mg2+, 0.095 mg mL-1 TK , 0.42
mg mL-1 TAm, pH 7.5 in 50 mM HEPES, 30 oC. Bioconversions performed as described in Section
2.8.1.

Chapter 3: Evaluation of de novo pathways
122
3.4. SUMMARY
The work presented in this Chapter has shown that it is possible to rapidly evaluate and
“mix and match” pairs of TK and TAm enzymes, in order to facilitate the design of the
one-pot synthesis of various optically pure amino alcohols. The use of microscale
experimentation (as described in Section 2.8.1) has enabled rapid collection of the
reaction kinetic data, which was required to optimise overall reaction conditions (Figures
3.3 to 3.6), as well as selecting the best enzyme candidates (Figure 3.7 and 3.8).
Together these two technologies comprise the experimental “toolbox” for the rapid
evaluation of multi-step enzymatic synthesis of amino alcohols, that it was the aim of
this Chapter to establish.
TK-TAm biocatalysts were successfully constructed (Figure 3.1), achieving a final
enzyme expression of TK and TAm of 8% and 36% w/w of the total protein (Figure 3.2).
The best reaction conditions were determined to be at 30oC using a pH of 7.5 (Figure 3.3
to 3.6). The engineered TK D469E and the wild type TK were found to be the best
candidates for the synthesis of APD and ABT respectively (Figure 3.7). Also, the
CV2025 TAm was discovered to display better catalytic activity when used in vivo rather
than in vitro (Figure 3.8). This lead to the design and construction of whole cell
biocatalysts to perform the one-pot synthesis of the single diastereoisomers APD (Figure
3.11) and ABT (Figure 3.12). IPA was identified as a preferable amine donor compared
to MBA for the one-pot syntheses, because side reactions with the initial TK substrates
(catalysed by TAm) were negligible and higher yields could be obtained at higher
concentrations (Figure 3.9). The TAm step was found as the bottleneck of the de novo
pathway, due to its one order of magnitude lower specific activities compared to TK
(Table 3.1 and 3.2), as well as been inhibited by higher concentrations of substrates
(Figure 3.9). Therefore Chapter 4 was focused in obtaining the corresponding kinetic
parameters in order to optimize the TAm bioconversion.

† The majority of the results presented in this chapter have been submitted for publication as: L.Rios-Solis, N. Bayir, M. Halim., J. Hao, F. Baganz., G.J. Lye. Kinetic modeling of a transaminase to produce optically pure amino alcohols. Biochem. Eng. J. Submitted.
4. KINETIC MODELLING OF
TRANSAMINASE SYNTHESIS OF
CHIRAL AMINO ALCOHOLS† 4.1 INTRODUCTION
The ω-TAm from C. violaceum 2025 was shown in Chapter 3 to be a promising
candidate to integrate the TK-TAm de novo pathway for the synthesis of chiral amino
alcohols. Nevertheless it was also identified as the bottleneck of the one-pot synthesis
presenting low specific activities and yields relative to the preceding TK
bioconversion (Table 3.2).
The determination of the full TAm kinetic model would allow simulation of the
conversion, enabling determination of the best reaction conditions, bioreactor design
and integration within multi-step enzymatic syntheses (Chen et al., 2006; Sin et al.,
2009; Santacoloma et al., 2011).
The determination of the required data for establishment of full kinetic models can be
time and resource consuming, especially when using the traditional linear methods
like the Lineweaver and Burk plot (Ranaldi 1999; Chen et al., 2009). This problem is
further emphasised for non-natural bioconversions used in the pharmaceutical
industry, that often present strong substrate and product inhibition (Yazbeck et al.,
2004), as commonly found with TAm bioconversions as described in Section 1.5.3.
Nonlinear regression methods can use programmable optimization algorithms to
determine the kinetic parameters, consequently been less time and resource
consuming (Blackmond, 2005).

Chapter 4: Kinetic Modelling of Transaminase
124
However, the determination of model parameters can suffer from global convergence
problems, in particular the estimation procedure can be strongly dependent on the
initial values of the parameters (Moros et al., 1996).
Hybrid methods combining traditional initial rates experiments to identify a solution
in the vicinity of the global minimum, with non linear regression methods to
determine the exact location of the solution emerge as an ideal solution to be
integrated in the microscale toolbox (Katare et al., 2004; Chen et al., 2008).
4.2 AIM AND OBJECTIVES
Based on the discussion in Section 4.1 the aim of this Chapter is to develop a
methodology to rapidly establish the TAm kinetic parameters in order to determine
the optimum reaction conditions. The methodology was based on combining non
linear numerical techniques (Katare et al., 2004; Morbiducci et al., 2005; Chou &
Voit, 2009; Chen et al., 2008) with microscale experimentation (Lye et al., 2003;
Micheletti & Lye, 2006). The approach will be exemplified for the TAm mediated
synthesis of ABT as indicated in Scheme 3.1. The key objectives of this Chapter are
thus:
• Extension of the non linear parameter estimation method first proposed by
Chen et al., (2008) for application to equilibrium-controlled enzymatic
reactions.
• Illustrate the new approach by determination of the apparent kinetic
parameters of the TAm mediated synthesis of ABT using whole cells, which
was found to be best biocatalyst form in Section 3.3.4.
• Validate the kinetic parameters obtained against additional experimental data.
• Identify main bottlenecks of the reaction.
• Identify the best reaction conditions for the synthesis of amino alcohols.

Chapter 4: Kinetic Modelling of Transaminase
125
4.3 RESULTS
4.3.1 Model driven methodology for TAm kinetic parameters identification
In previous works (Chen et al. 2008; Chen et al. 2009), a microscale model driven
methodology for determining the kinetic parameters of transketolase (TK)
bioconversions was developed and validated for the synthesis of several ketodiols.
The method consisted in obtaining preliminary values of kinetic parameters on a step-
by-step basis, reducing the number of estimated parameters to 3 or 4. These
preliminary values where then used as initial guesses for a final parameter estimation
step via nonlinear regression. Compared with the conventional linear plotting
methods, this approach demonstrated to significantly reduce the number of
experiments and materials required for kinetic parameter estimation, making it useful
to rapidly simulate and optimize large scale bioconversions (Smith et al. 2010).
The TAm reaction is reversible and usually present strong substrate and/or product
inhibition (Koszelewski et al., 2010), in addition the TAm model was only partially
elucidated as described in Section 1.5.3.4, therefore the methodology should be able
to test different kinetic models in order to determine the correct reaction mechanism.
However, the previous methodoliges were developed for TK bioconversions, which
were irreversible and their kinetic model included less parameters and was already
fully elucidated. Therefore several modifications had to be made to the original
methodology, in order to enable the rapid and accurate elucidation of the Tam
reaction model, as well as the determination of the kinetic parameters of a reversible
reaction which may include strong substrate and/or product inhibition.
The methodology developed incorporates 5 main Steps as described in Figure 4.1
which are as follows:
1) Determination of the region of linear proportionality between the enzyme
concentration and the initial rate.

Chapter 4: Kinetic Modelling of Transaminase
126
2) Gathering of initial rate data for both forward and reverse reaction, testing of
different kinetic models to elucidate the preliminary reaction pathway and
determining the preliminary Michaelis and rate constants.
3) Determination of the stability of the enzyme under actual bioconversion
conditions.
4) Determination of the preliminary values of equilibrium and inhibition
constants through non linear regression of experimental progress curves.
5) Reconciliation of the parameters through a new round of non linear regression
of the progress curves, using all the preliminary values of the kinetic
parameters as initial guess for the final regression, and verification of the
selected reaction pathway.

Chapter 4: Kinetic Modelling of Transaminase
127
Figure 4.1. Schematic representation of the systematic procedure for rapid apparent kinetic
parameter identification for an equilibrium controlled bioconversion such as the whole cell TAm
mediated synthesis of ABT from ERY and MBA (Scheme 3.1).

Chapter 4: Kinetic Modelling of Transaminase
128
In order to implement the procedure illustrated in Figure 4.1, a programme was
developed using Matlab software (MathWorks, Natick, MA, USA) in order to
automatically perform all the non linear regressions and statistical analyses. The
complete Matlab code can be found in Appendix V.
The synthesis of ABT using MBA as amino donor was selected initially to develop
the methodology in this chapter, because the analytical tools to follow the reaction
were simpler and more established than using IPA as amino donor (Section 2.9.6).
4.3.2 Proportionality between reaction rate and enzyme concentration
As described in Figure 4.1, the first Step to obtain the kinetic parameters was to
determine the region of linear proportionality between the TAm concentration in
whole cell form and the initial reaction rate. This was necessary to ensure that any
increase in enzyme concentration would contribute fully to the measured kinetics
(Chen et al., 2008). It is common that increasing the enzyme concentration in a
reaction will not correspond to a proportional increase in the initial rate of the
bioconversion; the reasons are usually mass transfer limitations or certain forms of
inhibition (Law et al., 2006). The substrate concentrations used were 10 mM MBA
and 50 mM ERY for each enzyme concentration and the linear relationship could be
maintained up to a TAm concentration of 0.8 mg mL-1 as can be seen in Figure 4.2.
This value was thus set as the upper limit for all subsequent experiments.
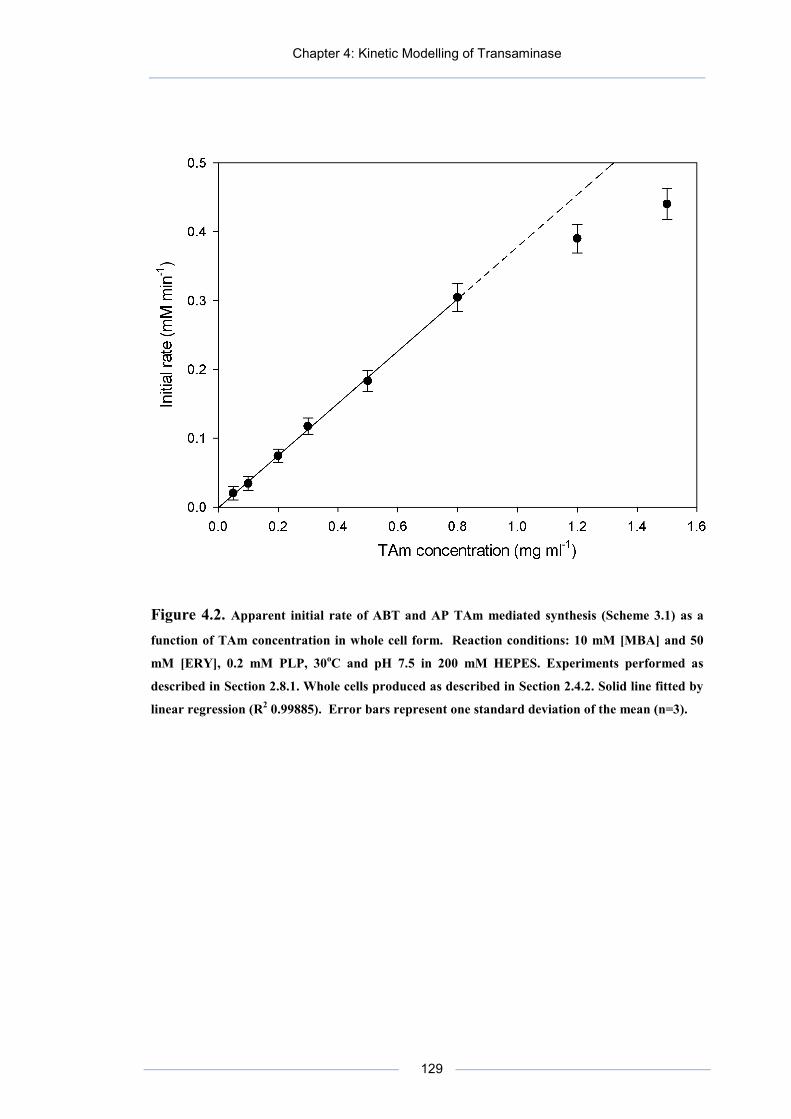
Chapter 4: Kinetic Modelling of Transaminase
129
Figure 4.2. Apparent initial rate of ABT and AP TAm mediated synthesis (Scheme 3.1) as a
function of TAm concentration in whole cell form. Reaction conditions: 10 mM [MBA] and 50
mM [ERY], 0.2 mM PLP, 30oC and pH 7.5 in 200 mM HEPES. Experiments performed as
described in Section 2.8.1. Whole cells produced as described in Section 2.4.2. Solid line fitted by
linear regression (R2 0.99885). Error bars represent one standard deviation of the mean (n=3).

Chapter 4: Kinetic Modelling of Transaminase
130
This upper limit result of 0.8 mg mL-1 was one order of magnitude lower when
compared to other types of enzymes like TK (Chen et al., 2009). The observation of a
lower limit of proportionality among transaminases has been reported before (Banks
et al. 1959). A possible explanation is that the enzyme can show self-inhibition where
an end amino group of one TAm molecule might bind the pyridoxal phosphate
associated with the active site of another enzyme molecule (Ellis & Davies, 1961). In
the case of whole cells mass transfer limitations across the cell wall might also be the
cause (Ni & Chen, 2004; Woodley, 2006).
4.3.3 Kinetic model of TAm and initial rate experiments
In the second Step of the methodology described in Figure 4.1, a set of initial rate data
varying the concentration of one substrate, while maintaining the other one fixed was
obtained for both forward and reverse reactions (Scheme 3.1).
Figure 4.3 shows a plot of the measured initial reaction rate for the forward reaction
as a function of varying concentrations of substrate ERY while maintaining the
concentration of MBA fixed at 10 mM. A second plot is shown in Figure 4.3 for the
variation of the concentration of MBA while maintaining ERY at 200 mM.
The same procedure was followed for the reverse reaction, where Figure 4.4 shows a
plot of the measured initial reaction rate as a function of varying the concentration of
substrate ABT, while maintaining the concentration of AP fixed at 35 mM. For AP
this is close to the maximum solubility of 42 mM at 25oC (Siegel, 2000). A second
plot in Figure 4.4 shows the initial rate of the reverse reaction as a function of the
variation of the concentration of AP while maintaining ABT concentration at 100
mM. The whole cell TAm concentration for all the experiments shown in Figures 4.3
and 4.4 was 0.2 mg mL−1.

Chapter 4: Kinetic Modelling of Transaminase
131
Figure 4.3. Apparent initial rate of the forward TAm reaction for ABT and AP synthesis
(Scheme 3.1) as a function of the substrate concentration: (●) [MBA] was varied while
maintaining [ERY] fixed at 200 mM, (Δ) [ERY] was varied while maintaining [MBA] fixed at 10
mM. In all experiments 0.2 mg mL-1 of TAm in whole cell form was used with 0.2 mM PLP, 30oC
and pH 7.5 in 200 mM HEPES. Experiments performed as described in Section 2.8.1. Whole cells
produced as described in Section 2.4.2.

Chapter 4: Kinetic Modelling of Transaminase
132
The reverse reaction was considerably slower compared to the forward reaction
(Figure 4.3 and 4.4). This created some experimental difficulties to obtain the initial
rate data using whole cells for the reverse reaction. The cause of those difficulties
were the necessity to measure very small concentrations of MBA or ERY (in the order
of 0.05 mM) which required very fine analytical detection tools with minimum noise.
In addition, MBA and ERY in such small concentrations were easily consumed by
side reactions of the whole cells.
To demonstrate that the products that were quantified were actually produced by the
TAm bioconversion and not by whole cell side reactions, a set of experiments to
obtain reverse initial reaction rates using pure TAm (see Section 2.6.2 for the
purification procedure) were also performed and the results are shown in an extra plot
in Figure 4.4.
Obtaining the reverse initial rates using pure enzyme eliminated the problems of
whole cells side reactions and analytical noise, making the experimental procedure
straight forward.
In Section 3.3.4 it was found that the TAm biocatalyst in vivo form was more stable
than ex vivo. This stability effect was negligible for initial rate data, where both plots
using TAm in pure and whole cell form showed a similar trend with the same order of
magnitude of initial rates (Figure 4.4). This indicated that the bioconversion was not
mass transfer limited using 0.2 mg mL-1 of TAm in whole cell form. Similar results
were found for the initial rates of Figure 4.3 comparing lysates and whole cells (data
not shown).
Because of the higher quality of data obtained with pure TAm and its similar initial
rate behaviour compared with the whole cell biocatalyst (Figure 4.4), it was decided
in this chapter to use the pure enzyme reverse kinetic data, in conjunction with the
whole cell forward kinetic data to obtain the preliminary parameters of the reaction.

Chapter 4: Kinetic Modelling of Transaminase
133
Figure 4.4. Apparent initial rate of the TAm reverse reaction for the synthesis of ABT and
MBA as function of the concentration of substrates: (Δ) varying[ ABT] while maintaining [AP]
fixed at 35 mM using pure enzyme and (▲) TAm in whole cell form , (○) varying [AP] while
maintaining [ABT] fixed at 100 mM using pure enzyme and (●) TAm in whole cell form. In all
experiments 0.2 mg mL-1 of TAm in whole cell or pure form were used with 0.2 mM PLP, 30oC
and pH 7.5 in 200 mM HEPES. Experiments performed as described in Section 2.8.1. Whole cells
produced as described in Section 2.4.2. Purification of the enzyme was performed as described in
Section 2.6.2.
Chapter 4: Kinetic Modelling of Transaminase
134
As was described with more details in Section 1.5.4.4, TAm requires the coenzyme
pyridoxal 5´-phosphate and catalyze enzymatic amino group transfer by a ping-pong
bi–bi mechanism (Bulos & Handler 1965; Kuramitsu et al., 1990). It has been
reported for TAm bioconversions that a substrate or product can bind an incorrect
enzyme form, creating dead end complexes that cannot react further, causing a
potentially strong form of inhibition (Bulos & Handler, 1965; Shin & Kim, 1998;
Shin & Kim, 2002).
For the CV2025 TAm synthesis of ABT, the presence of abortive complexes in the
reaction mechanism was not known, therefore different kinetic models were initially
fitted by non linear regression to the experimental initial rate data shown in Figures
4.3 and 4.4. This was necessary to explore the possibility of the formation of different
dead end complexes and identify the most suitable preliminary kinetic model. Among
all those models, the reaction mechanism which included substrate inhibition by the
formation of the complex E-PMP-MBA gave the best statistical fitting (statistical
results will be discussed the next paragraph). The resulting King-Altman figure for
the selected reaction pathway is represented in Figure 4.5, and the corresponding rate
model is derived in Equation 4.1 (Segel, 1975; Shin & Kim, 1998).

Chapter 4: Kinetic Modelling of Transaminase
135
Figure 4.5. Proposed King-Altman figure for the TAm mediated synthesis of ABT. Solid lines
arrows represent the basic model without the formation of abortive complexes. The dashed
arrows represent the substrate inhibition by the formation of dead end complex E-PMP-MBA.
Where v represents the reaction rate, kf and kr represents the catalytic rate constants for
the forward and reverse reaction respectively, KERY, KAP, KABT and KMBA are the
Michaelis constants of ERY, AP, ABT and MBA, KiABT and KiMBA are the inhibition
constants of ABT and MBA respectively, KiMBAc is the inhibition constant for the
MBA-PMP abortive complex, EiTAm represents the TAm concentration and Keq is the
equilibrium constant.

Chapter 4: Kinetic Modelling of Transaminase
136
In the absence of products for the forward reaction, Equation 4.1 can be simplified to
Equation 4.2:
The initial data from Figure 4.3 was fitted using non linear regression to Equation 2
obtaining an R2 of 0.98 and the sum of squares was of 0.24, which was one order of
magnitude below compared to the R2 of 0.87 and sum of squares of 14.2 for the
second best fitting model which did not include substrate inhibition by a dead end
complex (Equation 4.2 without including the last two terms).
The preliminary values of the constants kf, KMBA, KERY and KiMBAc were 97.2 mM
min-1, 0.5, 101.2 and 23.9 mM respectively.
A statistical F-test (Markowski and Markowski, 1990) was performed in order to
determine if the addition of the parameter KiMBAc gave a significantly better fit to the
data. The result of the F-test was equal to 282.4, which was considerably higher than
the critical value of 6.6 from the F distribution tables with false-rejection probability
of 0.05, showing that the addition of the parameter KiMBAc was statistically significant.
The plots of reverse initial rate as a function of substrate concentration in Figure 4.4
did not suggest the presence of strong inhibition that could be caused by a dead end
complex. This was corroborated by non linear fitting regression, where all the models
including the formation of dead end complexes in the reverse reaction failed to give a
statistically better fit than the model represented by Equation 4.3, which is a
simplification of Equation 4.1 without including products.
The initial rate data was fitted to equation 4.3 by non linear regression, and the
preliminary parameters of kr, KAP and KABT were found to be 13.1 min-1, 19.6 and
39.4 mM respectively. Both non linear regressions for the forward and reverse

Chapter 4: Kinetic Modelling of Transaminase
137
reaction had upper and lower bounds of 0.0001 and 2000 and both converged with
any arbitrary initial value.
4.3.4 Enzyme stability
An underlying assumption is that the TAm activity should be stable for the duration of
the progress curve experiments, which are needed to determine the rest of inhibition
and equilibrium constants (Figure 4.1). Good stability of TAm would also
demonstrate that the total enzyme concentration was constant during the complete
assay; therefore any decrease in the reaction rate could be attributed to inhibition or
equilibrium effects and not to irreversible enzyme deactivation.
To test the enzyme stability, the whole cell TAm was incubated with each substrate or
product over different incubation times, and the enzyme activity was determined at
intervals and plotted as a function of the incubation time in Figure 4.6 (forward
reaction activity data was used for substrate incubation tests, and reverse reaction
activity for product incubation tests).
No significant decrease in enzyme activity was detected for up to 35 hr of incubation
with ERY, ABT and AP. In contrast there was a 10% decrease in initial reaction rate
for the whole cell TAm while incubated with MBA. Because improving TAm
stability was out of the scope of this project, a maximum of 10% deactivation of
enzyme was set as the tolerance limit for the kinetic parameters identification.
Therefore the maximum reaction time allowed in all the progress curves was set to be
35 hr.
When incubating the enzyme with MBA, PLP had to be added again so that the
enzyme activity would be restored. This was not necessary when incubating the
enzyme with ERY, AP or ABT, and the reason could be attributed to a full conversion
of PLP to PMP through completion of the first half reaction due to the absence of
amino-acceptor, as has been shown previously using the CV2025 TAm (Schell et al.,
2009).

Chapter 4: Kinetic Modelling of Transaminase
138
Figure 4.6. Stability experiments using the whole cell TAm biocatalyst: apparent forward
initial reaction rates after different times of incubation with (●) 50 mM ERY or (○) 50 mM MBA,
and apparent reverse reaction initial rates after different incubation times with (▼) 100 mM
ABT or (Δ) 35 mM AP. In all experiments 0.2 mg mL-1 of TAm in whole cell form were used with
0.2 mM PLP, 30oC and pH 7.5 in 200 mM HEPES. Reaction conditions for forward reaction were
50 mM equimolar concentration of substrates, and for the reverse reaction 100 mM ABT or 35
mM AP were added to start the reaction. Experiments performed as described in Section 2.8.1.
Whole cells produced as described in Section 2.4.2.
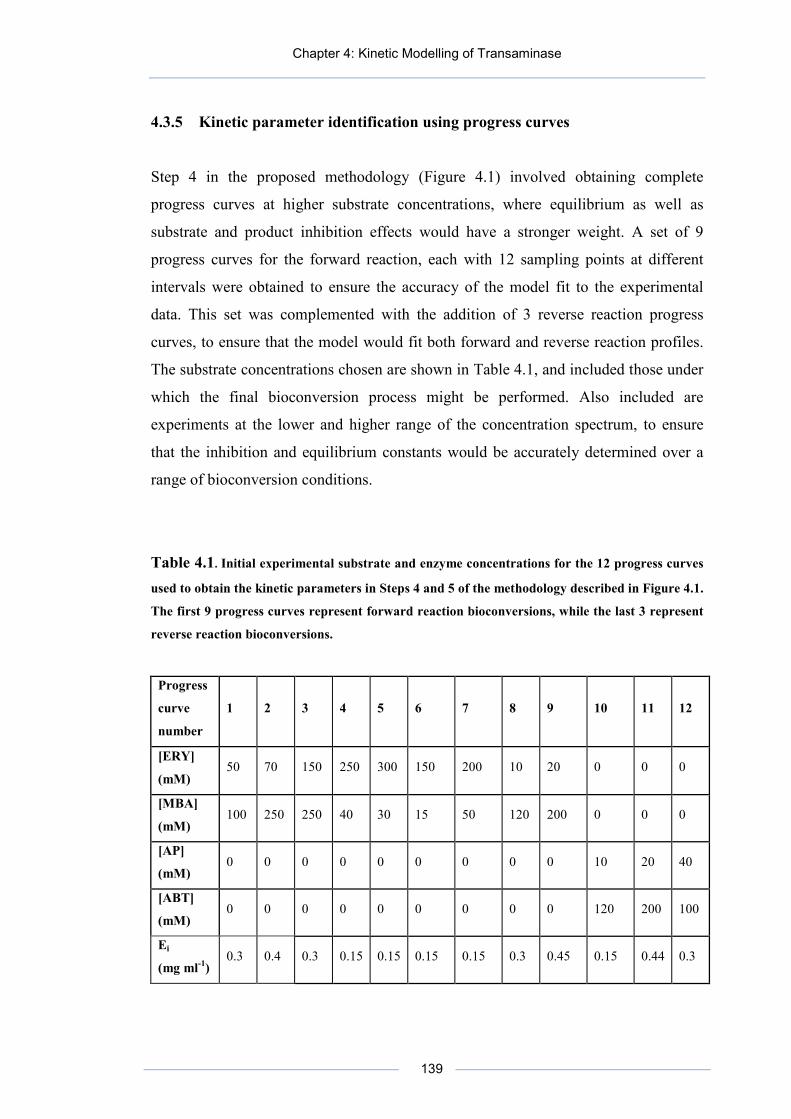
Chapter 4: Kinetic Modelling of Transaminase
139
4.3.5 Kinetic parameter identification using progress curves
Step 4 in the proposed methodology (Figure 4.1) involved obtaining complete
progress curves at higher substrate concentrations, where equilibrium as well as
substrate and product inhibition effects would have a stronger weight. A set of 9
progress curves for the forward reaction, each with 12 sampling points at different
intervals were obtained to ensure the accuracy of the model fit to the experimental
data. This set was complemented with the addition of 3 reverse reaction progress
curves, to ensure that the model would fit both forward and reverse reaction profiles.
The substrate concentrations chosen are shown in Table 4.1, and included those under
which the final bioconversion process might be performed. Also included are
experiments at the lower and higher range of the concentration spectrum, to ensure
that the inhibition and equilibrium constants would be accurately determined over a
range of bioconversion conditions.
Table 4.1. Initial experimental substrate and enzyme concentrations for the 12 progress curves
used to obtain the kinetic parameters in Steps 4 and 5 of the methodology described in Figure 4.1.
The first 9 progress curves represent forward reaction bioconversions, while the last 3 represent
reverse reaction bioconversions.
Progress
curve
number
1 2 3 4 5 6 7 8 9 10 11 12
[ERY]
(mM) 50 70 150 250 300 150 200 10 20 0 0 0
[MBA]
(mM) 100 250 250 40 30 15 50 120 200 0 0 0
[AP]
(mM) 0 0 0 0 0 0 0 0 0 10 20 40
[ABT]
(mM) 0 0 0 0 0 0 0 0 0 120 200 100
Ei
(mg ml-1) 0.3 0.4 0.3 0.15 0.15 0.15 0.15 0.3 0.45 0.15 0.44 0.3

Chapter 4: Kinetic Modelling of Transaminase
140
Initial non linear regressions highlighted the importance of the data points before 60
min of reaction. Those points were crucial involving low products concentration,
giving weight to the preliminary parameters Kf, Kr, and the Michaelis constants
previously obtained, allowing a better convergence of the optimization. Therefore
care was taken to include several points within that time range, in order for the
optimization to converge around the vicinity of the preliminary values determined in
Section 4.3.3.
The preliminary results of kf and kr, of 97.2 and 13.1 min-1, and of KMBA, KERY,
KiMBAc, KAP and KABT of 0.5, 101.2, 23.9, 19.6 and 39.4 mM respectively obtained in
Section 4.3.3 were used as fixed values in the full kinetic model (Equation 4.1). This
was done in order to be able to determine the rest of the kinetic constants by non
linear regression of the progress curves. The equilibrium constant was calculated
simultaneously in the iteration process using the Haldane equation 4.4:
The two remaining inhibition constants KiERY and KiAP were calculated using the
following Haldane equations:
The partial equilibrium constant K1 for the first half reaction, where MBA reacts with
E-PLP to produce AP and E-PMP (Figure 4.5) was calculated using Equation 4.7:
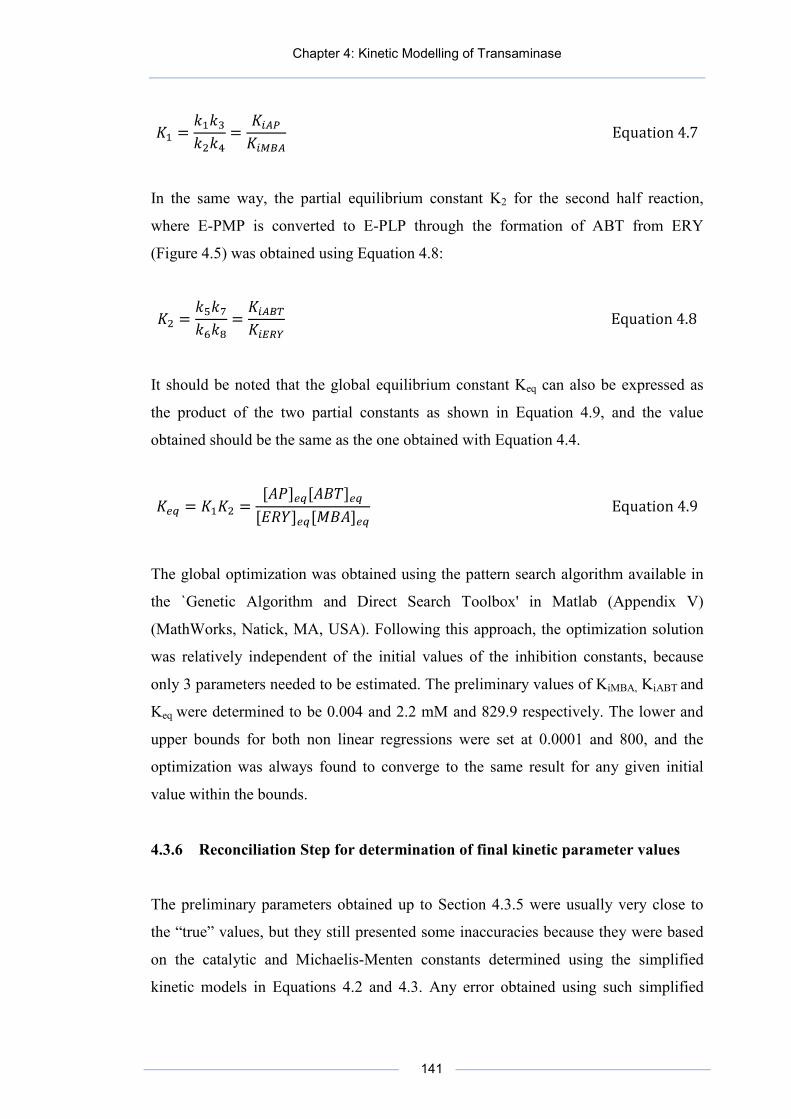
Chapter 4: Kinetic Modelling of Transaminase
141
In the same way, the partial equilibrium constant K2 for the second half reaction,
where E-PMP is converted to E-PLP through the formation of ABT from ERY
(Figure 4.5) was obtained using Equation 4.8:
It should be noted that the global equilibrium constant Keq can also be expressed as
the product of the two partial constants as shown in Equation 4.9, and the value
obtained should be the same as the one obtained with Equation 4.4.
The global optimization was obtained using the pattern search algorithm available in
the `Genetic Algorithm and Direct Search Toolbox' in Matlab (Appendix V)
(MathWorks, Natick, MA, USA). Following this approach, the optimization solution
was relatively independent of the initial values of the inhibition constants, because
only 3 parameters needed to be estimated. The preliminary values of KiMBA, KiABT and
Keq were determined to be 0.004 and 2.2 mM and 829.9 respectively. The lower and
upper bounds for both non linear regressions were set at 0.0001 and 800, and the
optimization was always found to converge to the same result for any given initial
value within the bounds.
4.3.6 Reconciliation Step for determination of final kinetic parameter values
The preliminary parameters obtained up to Section 4.3.5 were usually very close to
the “true” values, but they still presented some inaccuracies because they were based
on the catalytic and Michaelis-Menten constants determined using the simplified
kinetic models in Equations 4.2 and 4.3. Any error obtained using such simplified

Chapter 4: Kinetic Modelling of Transaminase
142
models in Section 4.3.3 would be propagated to the values of all the next parameters
determined in the Section 4.3.5. Therefore in Step 5 of the methodology described in
Figure 4.1, the kinetic constants were reconciled by using the corresponding full
kinetic model combined with non linear regression of the 12 progress curves, where
all the preliminary parameters were used as initial values for the optimization.
The lower and upper bounds were set as 0.1 and 2000 (expect for KMBA and KiMBA
where the lower bound was set to 0.01 and 0.0001 respectively), and because the
initial estimates were close to the final parameter values, the global optimization was
quickly achieved around the vicinity of the initial estimates. The preliminary and
“reconciled” kinetic values obtained this way are summarized in Table 4.2, where a
description in terms of rate constants of each parameter is also included.
The preliminary and final values were relatively similar and the major difference
(33%) was found for the inhibition constant KAPi. Such changes to the final values of
the kinetic parameters at this point was considered acceptable for a non linear
regression approach methodology (Moros et al., 1996; Blackmond 2005).

Chapter 4: Kinetic Modelling of Transaminase
143
Table 4.2. Initial and final “reconciled” values for the parameters obtained in Step 5 of Figure
4.1 using the full kinetic model represented by Equation 4.1.
Kinetic parameter Kinetic parameter in terms of rate constants
Initial value
Reconciled value
Catalytic rate constants (min -1)
Rate constant forward reaction: kf
97.2 95.1
Rate constant reverse reaction: kr
13.1 12
Michaelis-Menten constants (mM)
Michaelis constant for MBA : KMBA 0.49 0.51
Michaelis constant for ERY : KERY 101.2 95.5
Michaelis constant for AP : KAP 19.6 16.1
Michaelis constant for ABT : KABT 39.4 37
Inhibition constants (mM)
Inhibition constant for MBA: KiMBA 4.0×10⁻³ 4.0×10⁻³
Inhibition constant for ERY: KiERY 0.75 1.0
Inhibition constant for AP: KiAP 1.2 1.1
Inhibition constant for ABT: KiABT 2.2 3.1
Inhibition constant for MBA abortive complex: KiMBAc
23.9 24

Chapter 4: Kinetic Modelling of Transaminase
144
Equilibrium constants
Global equilibrium
constant 829.9 842.9
Equilibrium constant
for the first half
reaction : K1
301 275
Equilibrium constant
for the second half
reaction : K2
2.9 3.1
In order to perform a complete statistical analysis, the full methodology described in
Figure 4.1 was also performed using the kinetic model without including substrate
inhibition by the formation of dead end complexes (Equation 4.1 without including
the last two terms). The final non linear regression performed with this model in Step
5 to reconcile the parameters was not stable and failed to converge successfully.
Instead it reached the upper limit for KERY and showed relatively high discrepancies
between the initial and “reconciled” values, presenting a residual of 16.3 compared to
0.55 using the full model of Equation 4.1. A statistical F-test (Markowski and
Markowski, 1990) was performed in order to determine if the addition of the
parameter KiMBAc gave a significantly better fit to th progress curve data. The result of
the F-test was equal to 15.7, which was higher than the critical value of 3.9 from the F
distribution tables with false-rejection probability of 0.05, showing that the addition
of the parameter KiMBAc was also statistically significant to fit the progress curves.
These statistical results, in addition to those in Section 4.3.3, showed that the kinetic
model described by Equation 4.1 presented the best fitting for both initial rate data
and the complete progress curves. This finding strongly supports the formation of the
abortive complex E-PMP-MBA. Further experiments using LC-MS or other sensitive
analytical tools could demonstrate the existence of such complex but those studies
were out of the scope of this work as described in Section 1.4.

Chapter 4: Kinetic Modelling of Transaminase
145
4.3.7 Validation of the kinetic parameters
In order to validate the kinetic parameters obtained in Table 4.2, experimental and
predicted data of reactant concentrations as a function of time were compared. Very
good agreement was found for all the concentrations described in Table 4.1
(Appendix VI).
Figure 4.7 shows a set of experimental and model data comparisons, using progress
curves from Table 4.1 that were used to determine the kinetic parameters. Figure 4.7a
specifically compares experimental ABT data points from different progress curves
with the predicted model where excellent agreement was found. Figure 4.7b focuses
on the initial period until 60 min where, as described in Section 4.3.5, several key data
points were collected.
Figure 4.8 shows the experimental data points of MBA for the 3 reverse progress
curves described in Table 4.1, where also excellent agreement was observed between
the data and the model.
To further test the kinetic model, Figure 4.9 shows the comparison of model predicted
data with an extra set of experimental progress curve data, which was not included in
Table 4.1 to establish the kinetic parameters.

Chapter 4: Kinetic Modelling of Transaminase
146
Figure 4.7. Forward reaction experimental and predicted progress curves following (a) [ABT]
for the complete length of the bioconversions and (b) [ABT] for the first 50 min of reaction time.
The initial substrate concentrations for each progress curve was (●) 150 mM [ERY], 250 mM
[MBA] and 0.3 mg mL-1 [TAm], (▲) 50 mM [ERY], 100 mM [MBA] and 0.3 mg mL-1 [TAm] and
(■) 10 mM [ERY], 120 mM [MBA] and 0.3 mg mL-1 [TAm]. Dotted lines show model predictions
based on Equation 4.1 and final kinetic parameters in Table 4.2. For all the experiments 0.2 mM
PLP was used at 30oC and pH 7.5 in 200 mM HEPES buffer. Experiments were performed as
described in Section 2.8.1.

Chapter 4: Kinetic Modelling of Transaminase
147
Figure 4.8. Reverse reaction predicted and experimental progress curves following MBA with
initial substrate concentrations of (○) 10 mM [AP], 120 mM [ABT] and 0.15 mg m L-1 [TAm] (Δ)
20 mM [AP], 200 mM [ABT] and 0.44 mg mL-1 [TAm] and (□) 40 mM [AP], 100 mM [ABT] and
0.3 mg mL-1 [TAm]. For all the experiments 0.2 mM PLP was used at 30oC and pH 7.5 in 200
mM HEPES buffer. Dotted lines show model predictions based on Equation 4.1 and final kinetic
parameters in Table 4.2. Experiments were performed as described in Section 2.8.1.

Chapter 4: Kinetic Modelling of Transaminase
148
Figure 4.9. Verification of model predictions with an experimental data set not included in the
original experimental design. Progress curve following (●) MBA and (○) ABT . Initial [ERY]
concentration was 250 mM and MBA was [40] mM, 0.2 mg mL-1 of TAm in whole cell form, 0.2
mM PLP, 30oC and pH 7.5 in 200 mM HEPES. Dotted lines show model predictions based on
Equation 4.1 and final kinetic parameters in Table 4.2. Experiments were performed as
described in Section 2.8.1.
Chapter 4: Kinetic Modelling of Transaminase
149
Excellent agreement was found between the experimental values and the model
prediction for both the short and longer reaction time scale in Figure 4.7, as well as
for the reverse reactions shown in Figure 4.8. In addition, perfect agreement was also
found between the independent progress curve which was not used for determining
the kinetic parameters and the model predictions, verifying the appropriate
determination of the kinetic model (Equation 4.1) and its corresponding parameters
(Table 4.2).
4.4 DISCUSSION OF TAM KINETIC PARAMETER RESULTS
4.4.1 Analysis of Michaelis-Menten constants
The Michaelis constant of ERY was 200 times bigger than the one for MBA, while
the Michaelis constant of ABT was half compared to the one for AP. In contrast to
the reverse reaction, the kinetic parameters of the forward reaction did not follow the
general trend where the Michaelis constant of each amino donor were higher than the
corresponding amino acceptor (Henson & Cleland, 1964; Christen & Metzler, 1985;
Shin & Kim, 1998; Lain-guelbenzu et al., 1991; Lo et al., 2005; Martin et al., 2007).
The value of the Michaelis constant of KAP was determined to be two orders of
magnitude higher than KMBA. This result was unexpected due to the similar chemical
structures of both compounds containing an aromatic ring and would indicate that the
amino group of MBA plays an important role for its high affinity towards the CV2025
TAm. A similar low KMBA and higher KAP value was determined for the ω-TAm from
Vibrio fluvialis (Shin & Kim, 2002) which shares 38% sequence identity towards the
CV2025 TAm (Kaulmann et al., 2007). Interestingly, the opposite result was found
for the ω-TAm from Bacillus thuringiensis, where the Michaelis constant for MBA
and AP were two orders of magnitude higher and lower respectively than the ones
determined in this work for the CV2025 TAm (Section 1.5.3.2) (Shin & Kim, 1998).

Chapter 4: Kinetic Modelling of Transaminase
150
4.4.2 Analysis of equilibrium constants
The uses of transaminases to synthesize chiral amines have been generally hampered
by equilibrium constants near unity or constants which favours the ketone starting
material (Taylor et al., 1998; Stewart, 2001; Truppo et al., 2010). For the conversions
studied here however, the value of the partial equilibrium constants K1 and K2 for the
first and second half reactions were 275 and 3.1 as determined by Equations 4.7 and
4.8 respectively. The high value of K1 has also been suggested in literature for the
synthesis of pyridoxamine 5´-phopsate using CV2025 TAm (Schell et al., 2009). The
values of K1 and K2 lead to a global equilibrium constant of 842 following Equation
4.9, which strongly favoured the asymmetric synthesis of ABT.
In addition, the catalytic constant for the forward reaction was almost one order of
magnitude higher than the constant for the reverse reaction. Similar differences in
catalytic constants have been found for the ω-TAm from B. thuringiensis to produce
L-alanine from pyruvate and MBA (Shin & Kim, 1998), yet in general these results
are not common among other TAms where kf and kr do not differ greatly (Henson &
Cleland, 1964; Bulos & Handler, 1965; Christen & Metzler, 1985; Kuramitsu et al.,
1990; Hayashi et al., 1993; Taylor et al., 1998).
4.4.3 Bottlenecks of the bioconversion
4.4.3.1 Michaelis constant of ERY
A number of bottlenecks need to be solved to reach the full potential of the CV2025
TAm for the asymmetric synthesis of chiral amino alcohols. After evaluating the
kinetic constants in Table 4.2, and performing a sensitivity analysis for each
parameter (Appendix VII), it was found that one of the key obstacles to improve the
amino-alcohol productivity was the high value of KERY of 96 mM. For similar
reaction conditions, Michaelis constants for pyruvate were reported to be one order of
magnitude smaller than KERY using the ω-TAm from V. fluvialis and B. thuringiensis
(Shin & Kim, 1998; Shin, 2002). This result could be explained because the

Chapter 4: Kinetic Modelling of Transaminase
151
previously mentioned enzymes, including the CV2025 TAm, belong to the β-
Ala:pyruvate transaminases containing a two pocket binding catalytic site, which
appears to be evolved for the recognition of pyruvate through a carboxylate trap via a
salt bridge and a hydrogen bond (Section 1.5.3.4) (Liu et al., 2004; Cho et al., 2008).
Therefore those enzymes present less affinity towards α-ketoglutarate and even less
affinity towards ketones which do not contain carboxylic groups (Shin & Kim, 2002;
Kaulmann et al., 2007).
The high value of KERY prevented the enzyme from reaching its full catalytic potential
(maximum catalytic rate) at ERY concentrations below 200 mM (Figure 4.3). In
contrast, the determined value of KMBA in this work was of 0.5, which was between 1
to 2 orders of magnitude smaller compared to the reported KMBA constants for TAms
of V. fluvialis, B. thuringiensis and Arthrobacter citreus (Shin & Kim, 1998; Shin &
Kim, 2002; Martin et al., 2007).
KMBA was found to be more than 200 times smaller than KERY, (Table 4.2), and
therefore any increase of MBA above 2 mM did not predict to significantly increase
the reaction rate and would even cause inhibition and enzyme deactivation (Figures
4.3 and 4.5).
4.4.3.2 Second half reaction
The higher stability of the complex E-PLP-MBA compared to E-PMP-ERY was
evidenced by the value of the dissociation constant KiMBA of 4.0×10⁻³ mM, which was
3 orders of magnitude smaller compared to the value of KiERY of 1.0 mM. By
analyzing the expressions of the parameters as rate constants in Table 4.2, it can be
concluded that the higher values of KERY and KiERY compared to KMBA and KiMBA
make the second half reaction the limiting step of the overall bioconversion.
Mutagenesis improving this step would be very beneficial in improving the catalytic
rate of the TAm synthesis of ABT.

Chapter 4: Kinetic Modelling of Transaminase
152
4.4.3.3 Catalytic constant
The value of the kinetic parameter kf, which is a function of the forward catalytic
constant rates k3 and k7, was found to be 97.4 min-1, and as expected, had also a
strong influence in the productivity of ABT as determined by the sensitivity analysis
(Appendix VII).
This value of kf was of the same order of magnitude as that reported for a similar ω-
TAm using MBA and pyruvate as substrates (Shin & Kim, 1998; Shin & Kim, 2002),
but it was found to be several orders of magnitude lower compared with other classes
of TAms when used with natural substrates ex vivo (Kuramitsu et al., 1990; Markova
et al., 2005).
The simulations predicted that using a higher concentration of TAm would lead to
significant improvements in the productivity of the bioconversion. Nevertheless as it
has been shown in Figure 4.2, the region of linear proportionality between the initial
rate and the enzyme concentration faded away after values higher than 0.8 mg mL-1.
Therefore experimental progress curves using TAm concentrations above that limit
did not correlated well with the predicted results (data not shown).
The catalytic constant of TAm found in this work was 5 and 20 folds smaller than the
published catalytic constants for TK D469T and the wild type (Chen et al., 2008,
Chen et al., 2009). Those results should be taken in consideration when expression
both enzymes in the biocatalyst in order to match their kinetics.
4.4.3.4 Side reactions
Using TAm concentrations above 1 mg mL-1 also lead to significant side reactions
caused by the whole cells that consumed the substrates and products, affecting the
final balance and overall quality of the asymmetric synthesis. One solution to
overcome the side reactions is to use pure enzyme instead of whole cells, this has
been shown in literature where concentrations one order of magnitude higher of the
CV2025 TAm were used successfully without side reactions (Schell et al., 2009).

Chapter 4: Kinetic Modelling of Transaminase
153
Another solution to overcome side reactions is to employ non natural ketodiols more
stable than ERY like PKD (Scheme 3.2), which is a good target for bioconversion
with similar catalytic activity compared to ERY as shown in Chapter 3 (Table 3.2),
with the advantage of producing more stable amino alcohols (Smith et al., 2010).
4.4.3.5 Product inhibition
Product inhibition in the forward reaction was found to be not so severe compared to
other similar ω-TAm bioconversions (Shin & Kim, 1998; Shin & Kim, 2002). In
those works, some of the product inhibition constants were found to be one order of
magnitude smaller than the value of KiAP and KiABT of 1.1 and 3.1 mM obtained in
this work respectively (Table 4.2). A low product inhibition of AP and ABT was also
suggested in literature using a TAm from Pseudomonas aeruginosa for the
asymmetric synthesis of ABT (Ingram et al., 2007).
Non-linear fitting suggested that substrate inhibition proceeded through the formation
of the dead end complex E-PMP-MBA, which is a common form of inhibition for
enzymes that follow a ping pong kinetic mechanism (Segel, 1975). The dissociation
constant KiMBAd of the abortive complex was found to be 24 mM (Table 4.2), which is
similar to other values found in literature (Henson & Cleland, 1964; Lombardo et al.,
1989). Nevertheless it has been shown that this type of inhibition only becomes severe
with values of dissociation constants one order of magnitude smaller than the value of
KiMBAd (Shin & Kim 1998; Shin & Kim 2002). Although inclusion of the extra
parameter KiMBAd was justified by performing an F-Test as well as other statistical
analysis (see section 4.2 and 4.5), the sensitivity analysis showed that this inhibition
would only become a major bottleneck with values of KiMBAc below ~5 mM
(Appendix VII).
4.4.3.6 Reverse reaction
The reverse reaction catalytic constant kr and the Michaelis constants KABT and KAP
were determined to be 12 min-1, 16 and 37 mM respectively. The sensitivity analysis

Chapter 4: Kinetic Modelling of Transaminase
154
showed that those had a smaller impact in the modelling compared to the forward
reaction constants. This is explained because the value of kr was determined to be 8
times smaller compared to kf. In addition, the relatively high values of KABT and KAP,
and the high equilibrium constant makes the reverse reaction almost negligible, as it
can be seen in the low product yield of the reverse progress curves shown in Figure
4.8.
4.4.3.7 Toxicity of MBA towards TAm
Several simulations predicted that high reaction yields of more than 95% should be
obtained using high equimolar concentrations of substrates, with the condition that
longer reactions times were used. However, the experimental data started to diverge
gradually from the predicted model data after longer reaction times (data not shown),
probably due to irreversible enzyme inactivation by MBA. As it was shown in Figure
4.6, 10 % of the TAm was deactivated after being incubated for 35 hr with 50 mM
MBA. This deactivation percentage was considered negligible for the purposes of
determining the kinetic parameters using the methodology of Figure 4.1; but the
deactivation may become more significant if longer residence times and also higher
concentrations of MBA were used.
TAm inactivation by the amino donor has also been reported in literature (Yun et al.,
2004b), and in some cases whole cell TAm biocatalyst have been shown to maintain
the TAm more stable versus the inactivation of the amino donor (Yun et al., 2004a),
which is in agreement with the results found in Chapter 3. Further addition of PLP or
TAm (individually) when the reaction stopped did not restore the catalytic activity. In
contrast, addition of PLP and TAm (together) after the reaction stopped did restore
partially the activity (data not shown), suggesting both enzyme and PLP were
degraded after longer reaction times.
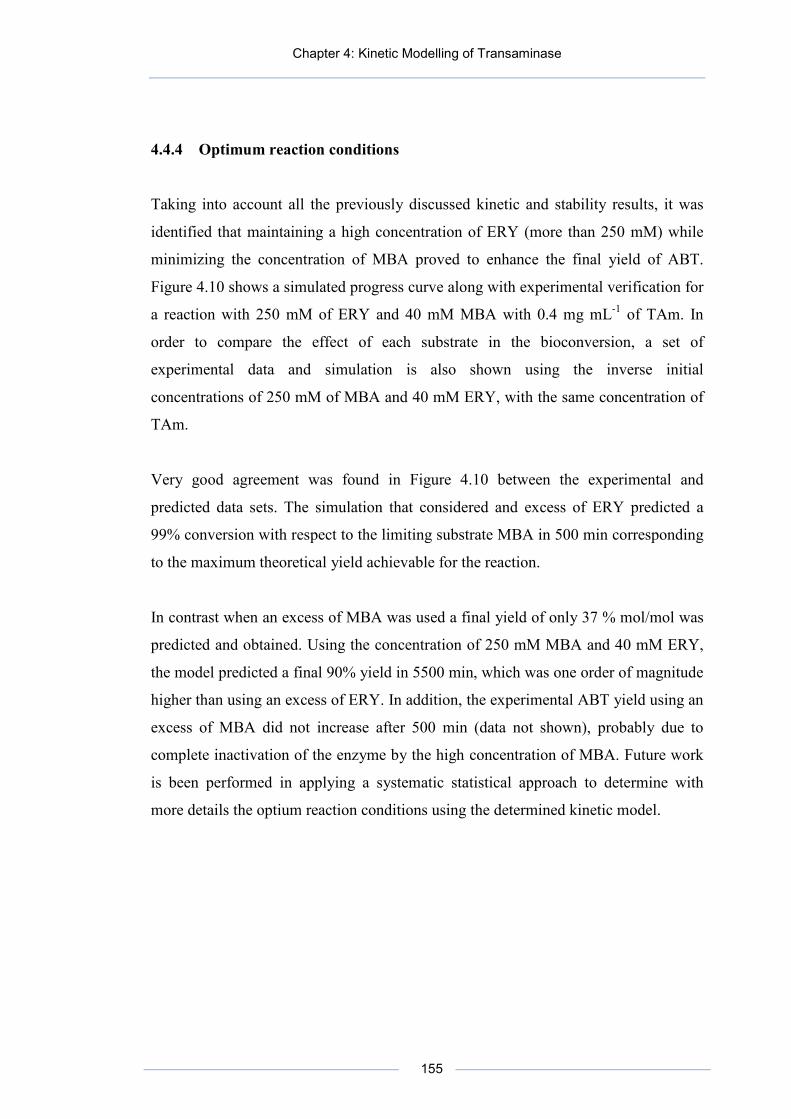
Chapter 4: Kinetic Modelling of Transaminase
155
4.4.4 Optimum reaction conditions
Taking into account all the previously discussed kinetic and stability results, it was
identified that maintaining a high concentration of ERY (more than 250 mM) while
minimizing the concentration of MBA proved to enhance the final yield of ABT.
Figure 4.10 shows a simulated progress curve along with experimental verification for
a reaction with 250 mM of ERY and 40 mM MBA with 0.4 mg mL-1 of TAm. In
order to compare the effect of each substrate in the bioconversion, a set of
experimental data and simulation is also shown using the inverse initial
concentrations of 250 mM of MBA and 40 mM ERY, with the same concentration of
TAm.
Very good agreement was found in Figure 4.10 between the experimental and
predicted data sets. The simulation that considered and excess of ERY predicted a
99% conversion with respect to the limiting substrate MBA in 500 min corresponding
to the maximum theoretical yield achievable for the reaction.
In contrast when an excess of MBA was used a final yield of only 37 % mol/mol was
predicted and obtained. Using the concentration of 250 mM MBA and 40 mM ERY,
the model predicted a final 90% yield in 5500 min, which was one order of magnitude
higher than using an excess of ERY. In addition, the experimental ABT yield using an
excess of MBA did not increase after 500 min (data not shown), probably due to
complete inactivation of the enzyme by the high concentration of MBA. Future work
is been performed in applying a systematic statistical approach to determine with
more details the optium reaction conditions using the determined kinetic model.
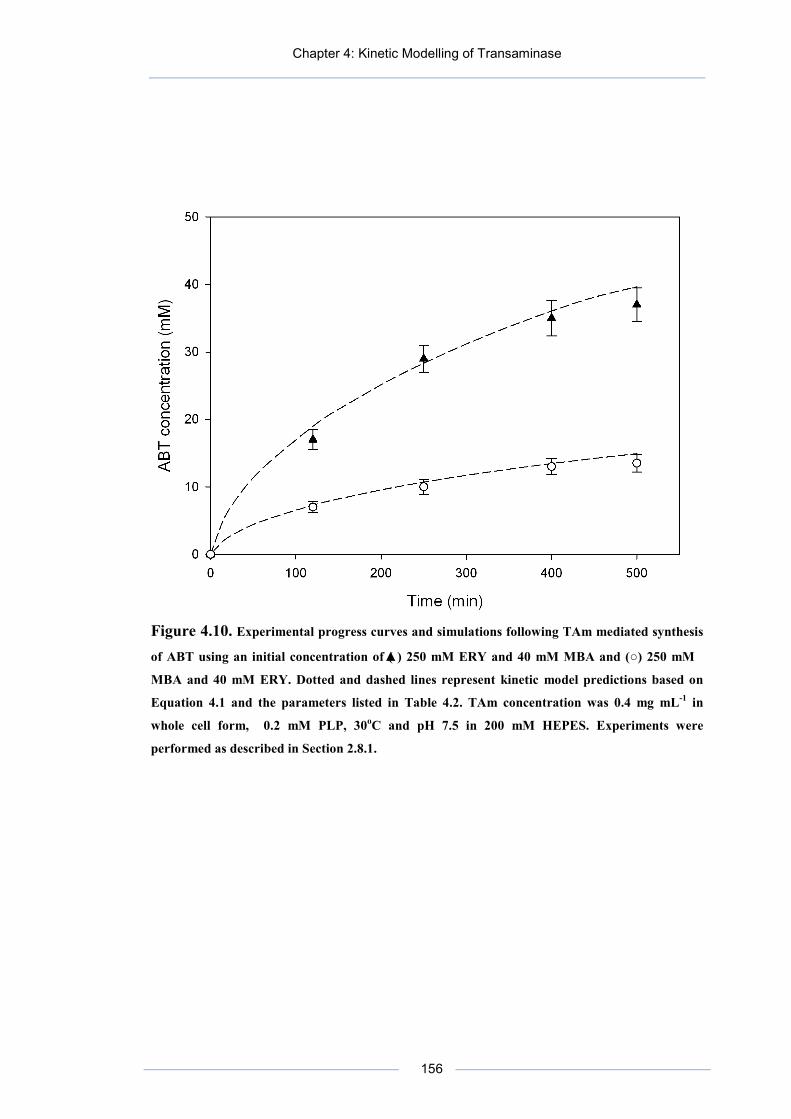
Chapter 4: Kinetic Modelling of Transaminase
156
Figure 4.10. Experimental progress curves and simulations following TAm mediated synthesis
of ABT using an initial concentration of (▲) 250 mM ERY and 40 mM MBA and (○) 250 mM
MBA and 40 mM ERY. Dotted and dashed lines represent kinetic model predictions based on
Equation 4.1 and the parameters listed in Table 4.2. TAm concentration was 0.4 mg mL-1 in
whole cell form, 0.2 mM PLP, 30oC and pH 7.5 in 200 mM HEPES. Experiments were
performed as described in Section 2.8.1.

Chapter 4: Kinetic Modelling of Transaminase
157
4.5 SUMMARY
A microscale standardized methodology was developed, in order to rapidly establish
the kinetic parameters of a reversible TAm bioconversion, where the kinetic model
was no fully elucidated, in order to optimize the reaction conditions (Figure 4.1).
The hybrid procedure gave strong weight to both the initial rate data to identify a
solution in the vicinity of the global minimum, and also to non linear regression
methods to determine the exact location of the solution.
The full reaction kinetic model with its corresponding parameters for the TAm
mediated synthesis of ABT using whole cells was established (Equation 4.1 and Table
4.2). The kinetic parameters were validated using 12 progress curves including
reverse reaction data (Figure 4.7 and 4.8), as well as using a independent experimental
data set not involved in the methodology to determine the parameters (Figure 4.9).
The TAm reaction was found to be very suitable for the asymmetric synthesis of
ABT, due to the high equilibrium constant of determined of 843 (Table 4.2).
The main bottlenecks of the reaction were found to be the high Michaelis constant of
ERY and the low catalytic constant of TAm (Figure 4.3), coupled with the high
toxicity of the enzyme towards MBA. Therefore using a low concentration of MBA
combined with a high concentration of ERY were considered to be the best reaction
conditions, achieving more than 90 % yield in less than 10 hr (Figure 4.10).
Chapter 5 was focused in scaling up the production of the biocatalyst, while rationally
controlling the level of expression of TAm and TK, in order to match their kinetic
characteristics as discussed in section 4.4.3.3.
† The majority of the results presented in this Chapter were submitted for publication as: Rios-Solis L., P. Morris, A. Odeleye, P. A. Dalby, F. Baganz and G. J. Lye. Scale-up and enzyme expression tuning of an E. coli whole cell biocatalyst with a de novo engineered pathway. Biotechnol. Bioeng. Submitted.
5. PRODUCTION OF THE DUAL TK-
TAM E. COLI BIOCATALYST AT
LABORATORY AND PILOT SCALE †
5.1. INTRODUCTION
As discussed in Section 4.4.3.3, the activity of the whole cell TAm was a factor of
approximately 20 to 5 times slower than TK for reactions converting both ERY and PKD
respectively. An ideal E. coli biocatalyst expressing dual TK-TAm activities would need
therefore high Tam expression while maintaining a TAm/TK ratio of 5- 20 in order for
the overall conversion rates of the two steps to be as similar as possible.
A whole cell E. coli biocatalyst with such characteristics was constructed and
successfully produced in shake flask fermentations (Section 3.3.3), achieving more than
90% mol/mol yield for the one pot synthesis of amino alcohols (Section 3.3.5).
In principle, multi-step enzymatic conversions in whole cell biocatalysts offer a unique
opportunity for synthesis of complex chiral molecules (Santacoloma et al., 2011).
However, this opportunity has rarely been exploited beyond research scale. This has been
attributed in part to difficulties in scaling-up biocatalyst production while maintaining the
appropriate enzymes expression levels and without lowering their operational
productivity (Meyer et al., 2007).
In general, the three main scales for fermentation process development are laboratory,
pilot plant and production scales. Typical volumetric scale-up ratios between each stage
are around 1:10, although lower ratios of about 1:5 have usually been applied

Chapter 5: Scale-up of the production of the biocatalyst
159
commercially to avoid unexpected performance on scale-up (Ju & Chase, 1992; Votruba
& Sobotka, 1992). Factors which could affect biocatalyst performance upon scale-up
include: mutation probability, plasmid stability and segregation, pellet formation, pH
control agents interference, foam formation, enzyme stability, temperature and aeration
gradients and sheer stress among many others (Young, 1979; Reisman, 1993; Humphrey,
1998). Therefore, for industrial application, identification of key issues related to pilot
plant scale performance is critical for efficient bioprocess development (Junker, 2004).
5.2. AIM AND OBJETIVES
The aim of this chapter is to scale-up the production of the dual TK-TAm E. coli
biocatalyst from laboratory to small pilot plant scale whilst maintaining overall
biocatalyst productivity. Suitable fermentation conditions will be identified and applied to
small pilot scale fermentations, trying if possible to increase enzyme concentration while
maintaining the desired TAm/TK ratio. The kinetic performance of the biocatalyst
produced at laboratory and pilot scales will be compared. The key objectives of this
chapter are thus:
• Scale-up of the whole cell E. coli biocatalyst production from shake flask (100 mL) to
laboratory (2 L) and small pilot scale (7.5 L) stirred tank fermentors.
• Evaluation of cell growth kinetics and protein expression profiles at different
temperatures and induction times.
• Determination of the suitable cell growth conditions to obtain high TAm concentration
while maintaining a suitable TAm/TK ratio.
• Comparison of bioconversion kinetic performance of the dual E. coli biocatalyst
produced at laboratory and pilot scale for the one pot synthesis of APD.

Chapter 5: Scale-up of the production of the biocatalyst
160
5.3. RESULTS
5.3.1. 2 L fermentation with different temperatures and induction times
The shake flask fermentations of E. coli cells double transformed with plasmids pQR801
and pQR412 were previously shown to reach a final biomass concentration of 1.2 gDCW L-
1 (Figure 3.1), with final TAm and TK concentrations of 0.2 and 0.05 g L-1 respectively.
In order to increase the total volume of the fermentation, and the overall amount of
biocatalyst produced, the fermentation was initially scaled up to a 2 L stirred tank
fermentor with a working volume of 1.4 L. The media was LB-glycerol as described in
Table 2.1, and the pH, impeller speed and air flow were set to be 7.0, 1200 rpm and 1.4 L
min-1 (1 vvm) respectively (Section 2.5.1). The biocatalyst used was the E. coli BL21-
Gold (DE3) cells expressing TK D469E and the CV2025 TAm due to its high activity
and ee shown for the synthesis of APD (Sections 3.3.3).
The co-expression level of several recombinant enzymes in a single E. coli host can be
affected by many fermentation factors, such as temperature, media, pH and the time of
induction among others (Tolia & Joshua-Tor, 2006). Therefore in this section, in addition
to performing a 14-fold scale-up of the fermentation volume, the effects of temperature
and time of induction (with 0.1 mM IPTG) were studied for the co-expression of the TK
and TAm. Stirred tank bioreactors are more appropriate than shake flasks for such
induction studies due to the improved environmental monitoring and control (Humphrey,
1998).
Figure 5.1 shows four growth profiles of the dual E. coli strain expressing the de novo TK
and TAm pathway. Experiments were performed using fermentation temperatures of
30oC and 37oC, with early and late exponential phase induction. Figure 5.2 shows the
logged data of DOT, pH, temperature and impeller speed for the fermentations performed
at 37oC. The temperature had the largest impact on cell growth rate and final biomass
concentration. The cells grown at 37oC presented a specific growth rate of 0.57 and 0.54
h-1, and reached a maximum biomass concentration of 6.6 and 6.8 gDCW L-1 for the early

Chapter 5: Scale-up of the production of the biocatalyst
161
and late induced fermentations respectively (Figure 5.1). The cells grown at 30oC had a
specific growth rate of 0.35 and 0.30 h-1, while reaching an 11 and 14% higher biomass
concentration than the fermentations at 37oC. The higher biomass obtained at 30oC could
be attributed to the better solubility of O2 at lower temperature, as well to less toxic waste
produced by the slower cell metabolism (Shiloach & Fass, 2005). In general the induction
time did not have a significant effect in the growth of the cells at both temperatures. This
suggests that the synthesis of the recombinant TAm was not a considerable metabolic
burden for cell growth (Figure 5.1). The DOT profiles shown in Figure 5.2 suggest that
upon early induction both cell growth and enzyme production continued whereas for late
induction cell growth largely ceased upon IPTG addition.
Figure 5.3 shows the corresponding profiles for production of TK and TAm for each of
the four fermentations described in Figure 5.1. Table 5.1 summarizes the derived growth
kinetics parameters and final enzyme concentrations measured in Figures 5.1 and 5.3.
Even though a higher biomass concentration was achieved with the 30oC fermentations,
the percentage of TAm expression was higher at 37oC, leading to similar final TAm
concentrations of 1.3 and 1.25 g L-1 for the fermentations at 37 and 30oC with early
induction respectively (Figure 5.3a and 5.3b). These TAm concentrations were 40 and 74
% higher than the corresponding fermentations with late induction, highlighting the
relevance of inducing in the early exponential phase to promote the TAm synthesis when
the carbon source was still abundant. The final TAm concentration of 0.8 g L-1 obtained
at 37oC with late induction contrasted with the concentration of 0.3 g L-1 at 30oC also
with late induction (Figure 5.3c and 5.3d). This could be explained due to the temperature
sensitive repressor used in plasmid pQR801 which was constructed using a PET vector
(Section 2.3.2); it is well known that this system displays leaky protein expression at
higher temperatures (Doublié, 2007).

Chapter 5: Scale-up of the production of the biocatalyst
162
Figure 5.1. Effect of temperature on batch growth profiles for 2 L fermentations of the double
transformed E. coli BL21-Gold (DE3) cells with plasmids pQR412 and pQR801 constructed as
described in Section 2.3.3 and 2.3.5. The temperature was set at 37 oC (▲) with TAm induction in the
early exponential phase after 3.5 hr of growth and (●) with induction in the late exponential phase
after 6hr, and at 30 oC (Δ) with induction in the early exponential phase after 5 hr and (○) induction
in the late exponential phase after 11.5 hr. Fermentation conditions were pH 7.0, 1200 rpm and air
flow of 1.4 L min-1 (Section 2.5.1).

Chapter 5: Scale-up of the production of the biocatalyst
163
Figure 5.2. Online measurements of pH (- -), temperature (•••) and DOT(−) for the fermentations
shown in Figure 5.1 performed at (a) 37oC with early induction after 3.5 hr of growth and at (b) 30oC
with late induction after 11.5 hr. Operating conditions as described in Figure 5.1.
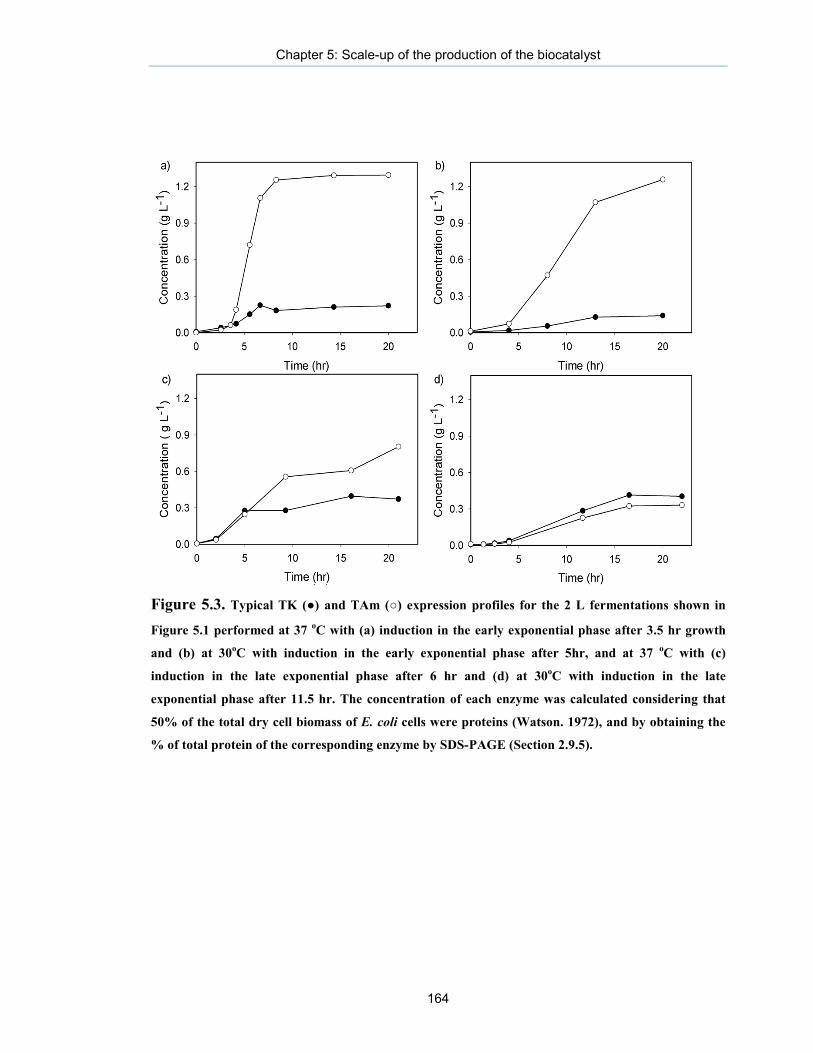
Chapter 5: Scale-up of the production of the biocatalyst
164
Figure 5.3. Typical TK (●) and TAm (○) expression profiles for the 2 L fermentations shown in
Figure 5.1 performed at 37 oC with (a) induction in the early exponential phase after 3.5 hr growth
and (b) at 30oC with induction in the early exponential phase after 5hr, and at 37 oC with (c)
induction in the late exponential phase after 6 hr and (d) at 30oC with induction in the late
exponential phase after 11.5 hr. The concentration of each enzyme was calculated considering that
50% of the total dry cell biomass of E. coli cells were proteins (Watson. 1972), and by obtaining the
% of total protein of the corresponding enzyme by SDS-PAGE (Section 2.9.5).

Chapter 5: Scale-up of the production of the biocatalyst
165
Table 5.1. Growth and enzyme expression results for the dual E. coli biocatalyst produced in shake flasks, 2 L and 7.5 L fermentations as
shown in Figures 3.1, 5.1 and 5.4 respectively. When available, the reported error represents one standard deviation of the mean (n=3).
aResults from shake flask fermentations performed in Section 3.3. b Induction time refers to addition of 0.1 mM IPTG for expression of TAm in the early or late exponential phase. c µ refers to the specific growth rate in h-1. dThe concentration of each enzyme was calculated considering that 50% of the total dry cell biomass of E. coli cells were proteins (Watson.
1972), and by obtaining the % of total protein of the corresponding enzyme by SDS-PAGE (Section 2.9.5).
Vessel
volume
(total)
Temperature
(oC)
Induction
timeb µc (h-1)
Biomass
(gDCW L-1)
TK
(%w/w)
TAm
(% w/w)
[TK]d
(g L-1)
[TAm]d
(g L-1)
TAm/TK
ratio
100 mLa 37 Early 0.55±0.05 1.5±0.1 8.0±0.9 36.0±3.8 0.06±0.005 0.27±0.04 4.5
2 L 37 Early 0.57 6.6 6.7 39.1 0.22 1.30 5.8
2 L 37 Late 0.54 6.8 8.9 23.5 0.37 0.80 2.6
2 L 30 Early 0.35 7.4 3.8 34.0 0.14 1.26 8.9
2 L 30 Late 0.3 7.9 10.2 8.4 0.40 0.33 0.82
7.5 L 37 Early 0.43±0.07 8. 5±0.5 7.2±1.0 39.0±3.0 0.31±0.05 1.7±0.1 5.5
7.5 L 30 Late 0.36±0.04 9.5±0.4 9.5±0.4 7.6±0.5 0.45±0.03 0.36±0.03 0.80

Chapter 5: Scale-up of the production of the biocatalyst
166
In Section 3.3.3, it was found that the TK expression in shake flasks of the single
transformed E. coli host with plasmid pQR412 represented 20% of total protein. This was
higher than the TK expression levels summarized in Table 5.1, especially when the TAm
expression was predominant (higher TAm/TK ratio). This implied that once induced, the
high expression rate of TAm by the T7 RNA polymerase (Section 2.3.3) retarded TK
expression which had a constitutive expression (Section 2.3.1). Following this reasoning,
the fermentation at 30oC with late induction, which did not leak TAm expression,
produced the highest TK concentration and lower TAm/TK ratio of 0.4 g L-1 and 0.8
respectively (Figure 5.3d and Table 5.1). This “expression switch” phenomenon has been
previously observed and applied to tune enzyme co-expression using PET vectors in E.
coli hosts (De Marco & De Marco, 2004).
As discussed in Section 4.3, a high TAm/TK ratio is desirable due to the slower
bioconversion rate of TAm compared to TK. The fermentation at 30oC with early
induction achieved the highest TAm/TK ratio of 8.9 compared to the value of 5.8
obtained with the corresponding fermentation at 37oC. However, the high ratio at 30oC
was achieved due to a 43% decrease in TK expression compared to the result at 37oC.
This was not desirable for the one pot synthesis of amino alcohols, where a higher
TAm/TK ratio is favourable at the expense of producing more TAm, but not at the
expense of reducing the TK synthesis. Overall, not only was the TK expression higher at
37oC with early induction, but also the TAm expression was higher, making the
biocatalyst produced at 37oC with early induction the most suitable for the multi-step
synthesis of amino alcohols.
5.3.2. Scale-up to a 7.5 L fermentor
In Section 5.3.1, it was concluded that the most suitable conditions to produce the dual
TK-TAm whole cell E. coli biocatalyst for the synthesis of amino alcohols were at 37oC
with early induction. This fermentation was therefore scaled-up to a 7.5 L fermentor with
a working volume of 5 L. In order to verify the “expression switch” phenomenon

Chapter 5: Scale-up of the production of the biocatalyst
167
observed in Figure 5.3, the fermentation at 30oC with late induction (maximum TK
concentration) was also scaled-up to the 7.5 L fermentor.
The fermentation conditions where the same as Section 5.3.1, expect that the DOT was
set to a minimum of 30% through a cascade control of the impeller speed (Section 2.5.2).
Figure 5.4 shows the growth profile for the two 7.5 L fermentations.
The fermentation at 37oC had a specific growth rate of 0.43 h-1 and a final biomass
concentration of 8.5 gDCW L-1, which was 22 % higher than the corresponding 2 L
fermentation (Table 5.1). The fermentation at 30oC presented a specific growth rate of
0.36 h-1 and a final biomass concentration of 9.5 gDCW L-1, which was 17 % higher than
the corresponding 2 L fermentation.
These results were in agreement with the ones found in Section 5.3.1, where the 2 L
fermentations at 30oC presented a lower specific growth rate but a higher final biomass
compared to the fermentations at 37oC. The higher biomass achieved in the 7.5 L
fermentor compared to the 2 L was attributed to better oxygen mass transfer in the larger
fermentor, due to the higher level of DOT maintained.
The protein expression concentration of TK and TAm were analyzed over different
interval times. Figure 5.5 shows the SDS-PAGE result for different interval samples of
the fermentation performed at 37oC with an early induction after 3 hr. A clear increase of
TAm and a decrease in TK expression can be observed in the corresponding protein
bands after the induction. The expression results have been plotted in Figure 5.6 for both
fermentations.
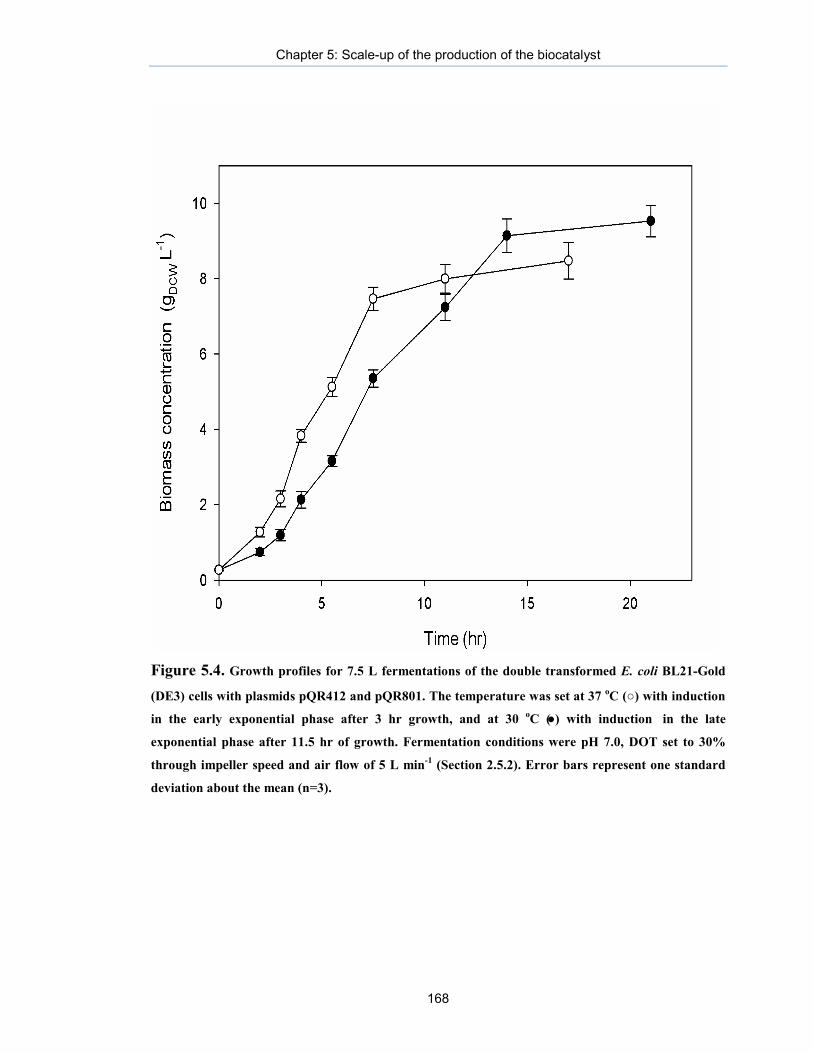
Chapter 5: Scale-up of the production of the biocatalyst
168
Figure 5.4. Growth profiles for 7.5 L fermentations of the double transformed E. coli BL21-Gold
(DE3) cells with plasmids pQR412 and pQR801. The temperature was set at 37 oC (○) with induction
in the early exponential phase after 3 hr growth, and at 30 oC (●) with induction in the late
exponential phase after 11.5 hr of growth. Fermentation conditions were pH 7.0, DOT set to 30%
through impeller speed and air flow of 5 L min-1 (Section 2.5.2). Error bars represent one standard
deviation about the mean (n=3).

Chapter 5: Scale-up of the production of the biocatalyst
169
Figure 5.5. SDS-PAGE gel of cellular extracts of the 7.5 L fermentation at 37 oC with induction in
the early exponential phase after 3 hr growth shown in Figure 5.4. Bands 1 and 10 are protein
markers. Bands 2 to 9 are cellular extracts at different interval times of the fermentation. TK and
TAm molecular weight are 72 kDa and 51 KDa respectively. SDS-PAGE gel was prepared as
described in Section 2.9.5.

Chapter 5: Scale-up of the production of the biocatalyst
170
Figure 5.6. TK (●) and TAm (○) expression profiles for the 7.5 L fermentations shown in Figure 5.4
performed at (a) 37 oC with induction in the early exponential phase after 3 hr growth and at (b) 30 oC with induction in the late exponential phase after 11.5 hr. The concentration of each enzyme was
calculated as described in Figure 5.3.

Chapter 5: Scale-up of the production of the biocatalyst
171
The kinetic growth results and final enzyme concentrations of the 7.5 L fermentations of
Figure 5.4 are summarized and compared with the 2 L (Section 5.3.1) and shake flask
fermentation results (Section 3.3.3) in Table 5.1 shown in Section 5.3.1. The level of
expression of TK and TAm were similar than those achieved in the shake flask and 2 L
fermentor, demonstrating the successful scale-up while maintaining the desired TK-TAm
expression profile.
The final concentrations of TK and TAm for the fermentation at 37oC with early
induction were 5 and 6 folds greater than the shake flask fermentations, and 29 and 24%
higher than the corresponding concentrations for the 2 L fermentation (Table 5.1). For the
fermentation at 30oC with late induction, the TK and TAm concentrations were 11 and
17% higher than those using the 2 L fermentor.
5.3.3. Comparison of single and dual enzyme expression levels
In the previous Sections the simultaneous expression of TK and TAm enzymes in the
duel E. coli strain was studied. In addition a series of fermentations were also performed
under similar conditions where the expression of TAm was evaluated. The results of
these fermentations are included in Appendix VIII.
In general it was found that conditions for the optimum independent TAm expression
were the same as in the dual enzyme expressing strain, obtaining a total protein
expression of up to 40%.
5.3.4. Kinetic comparison of the laboratory and pilot scale biocatalyst
As illustrated in Table 5.1, the production of the dual TK-TAm E. coli biocatalyst was
successfully scaled-up 50-fold from sake flask to a small pilot scale (7.5 L) stirred tank
fermentor. High levels of both TK and TAm expression were achieved while maintaining
a desired TAm/TK ratio greater than 5. Nevertheless it was important to verify the
bioconversion kinetics of the biocatalyst produced, as these could have been impacted on

Chapter 5: Scale-up of the production of the biocatalyst
172
by enzyme stability issues or whole cell integrity problems, which may have arisen
during the scale-up process (Junker, 2004). Gradients of temperature and oxygen, shear
stress by the impeller and higher mutations probability due to longer fermentations times
among other causes could have also affect the quality of the biocatalyst (Reisman, 1993;
Humphrey, 1998).
In order to compare the bioconversion kinetic performance of the dual TK-TAm E. coli
biocatalyst produced at different scales, two microscale one pot syntheses of APD were
performed using both biocatalysts as described in Section 2.8.1.
The initial concentration of substrates was 10 mM of PA and HPA, while the cofactors
concentrations were 2.4 mM of TTP, 9 mM Mg2+ and 0.2 mM of PLP in 200 mM HEPES
buffer.
As has been shown in Section 3.3.5, the TK substrate HPA can be aminated by the TAm
using MBA, producing serine as a side product and therefore consuming HPA and MBA
in an undesirable reaction. To overcome these lose of substrates, the amino donor MBA
was subsequently added in the multi-step synthesis after the TK reaction was completed.
A stock solution of 300 mM of the amino donor was prepared to be added to the TK-
TAm bioconversions. Therefore the volume added of the MBA solution represented only
3% of the original reaction volume, consequently the dilution of substrates and products
was considered negligible.
The biocatalyst produced in the laboratory and pilot scale fermentor had slightly different
expression of TK and TAm, which represented 8 and 37% of the total protein for TK and
TAm in the shake flask fermentation, compared to 7 and 39 % of for the 7.5 L fermentor
(Table 5.1). A fixed concentration of 0.4 mg mL-1 of TAm was used in both
bioconversions. Considering than 50% of the total dry cell biomass of E. coli cells were
proteins (Watson. 1972), then a final concentration of cell biomass of 2.2 and 2.1 gDCW L-
1 was used of the laboratory and pilot scale biocatalyst respectively. By fixing the TAm

Chapter 5: Scale-up of the production of the biocatalyst
173
concentration, the TK concentration varied slightly from the two bioconversions, with
values of 0.085 and 0.07 mg mL-1 for the smaller and larger scale biocatalysts.
Figure 5.7 shows the experimental progress curves for the TK reaction step of the one pot
synthesis of APD using both the shake flasks and 7.5 L fermentor biocatalysts. Excellent
agreement was found between the experimental data, where the conversion was only
marginally faster using the shake flask biocatalyst as expected due to its higher
concentration of TK. The TK initial activities were found to be 1.16 and 1.11 µmol min-1
mg-1 for the biocatalysts produced in the smaller and larger scale fermentations
respectively, showing that the TK activity was not affected during the scale-up process.
After 7 hours of reaction, final conversions of PKD of 97 and 96 % mol/mol were
achieved and no HPA was detected, therefore MBA was added to start the TAm
bioconversion.
Figure 5.8 shows the continuation of the progress curves shown in Figure 5.7 for the
TAm step in the one pot synthesis of APD, using the laboratory and pilot scale
biocatalysts. Again excellent agreement was observed between the TAm experimental
data, which presented a specific activity of 9.6×10⁻³ and 9.2×10⁻³ µmol min-1 mg-1, and a
final conversion of 93 and 92% mol/mol for the laboratory and pilot scale biocatalysts
respectively. Those results showed that the activity of TAm was also not affected during
the scale-up process.
Tables 5.2 summarize the kinetic results of both bioconversions. Similar activities and
final yields of the TK and TAm bioconversions were found for both biocatalysts. This
demonstrated that the enzyme stability and kinetic characteristics of the TK-TAm
biocatalysts were not affected during the scale-up process.
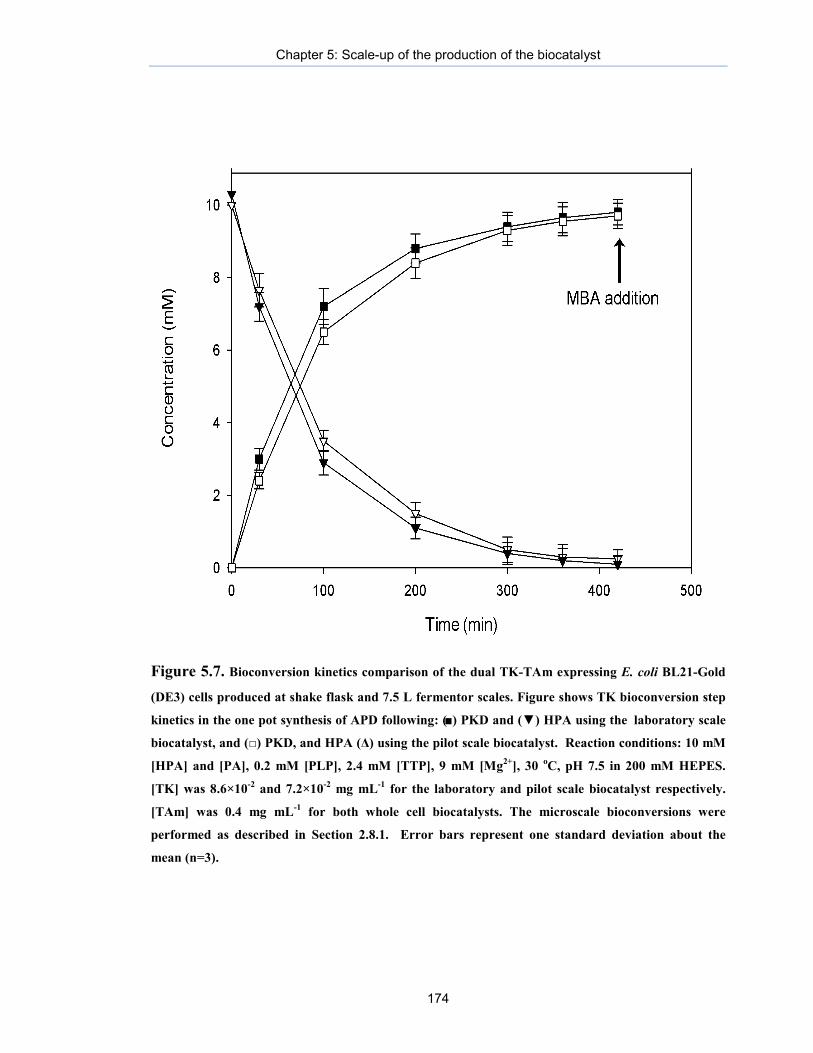
Chapter 5: Scale-up of the production of the biocatalyst
174
Figure 5.7. Bioconversion kinetics comparison of the dual TK-TAm expressing E. coli BL21-Gold
(DE3) cells produced at shake flask and 7.5 L fermentor scales. Figure shows TK bioconversion step
kinetics in the one pot synthesis of APD following: (■) PKD and (▼) HPA using the laboratory scale
biocatalyst, and (□) PKD, and HPA (Δ) using the pilot scale biocatalyst. Reaction conditions: 10 mM
[HPA] and [PA], 0.2 mM [PLP], 2.4 mM [TTP], 9 mM [Mg2+], 30 oC, pH 7.5 in 200 mM HEPES.
[TK] was 8.6×10⁻² and 7.2×10⁻² mg mL-1 for the laboratory and pilot scale biocatalyst respectively.
[TAm] was 0.4 mg mL-1 for both whole cell biocatalysts. The microscale bioconversions were
performed as described in Section 2.8.1. Error bars represent one standard deviation about the
mean (n=3).

Chapter 5: Scale-up of the production of the biocatalyst
175
Figure 5.8. Continuation of the one pot synthesis profiles shown in Figure 5.4 using a TK-TAm
shake flask and 7.5 L biocatalyst showing the TAm bioconversion step after addition of MBA
following: (●) APD and (▲) PKD using the laboratory scale biocatalyst, and (Δ) APD, and PKD (○)
using the pilot scale biocatalyst. Reaction conditions: 10 mM [HPA] and [PA], 0.2 mM [PLP], 2.4
mM [TTP], 9 mM [Mg2+], 30 oC, pH 7.5 in 200 mM HEPES,. [TK] was 8.6×10⁻² and 7.2×10⁻² mg mL-
1 for the laboratory and pilot scale biocatalyst respectively. [TAm] was 0.4 mg mL-1 for both whole
cell biocatalysts. The microscale bioconversions were performed as described in Section 2.8.1. Error
bars represent one standard deviation about the mean (n=3).
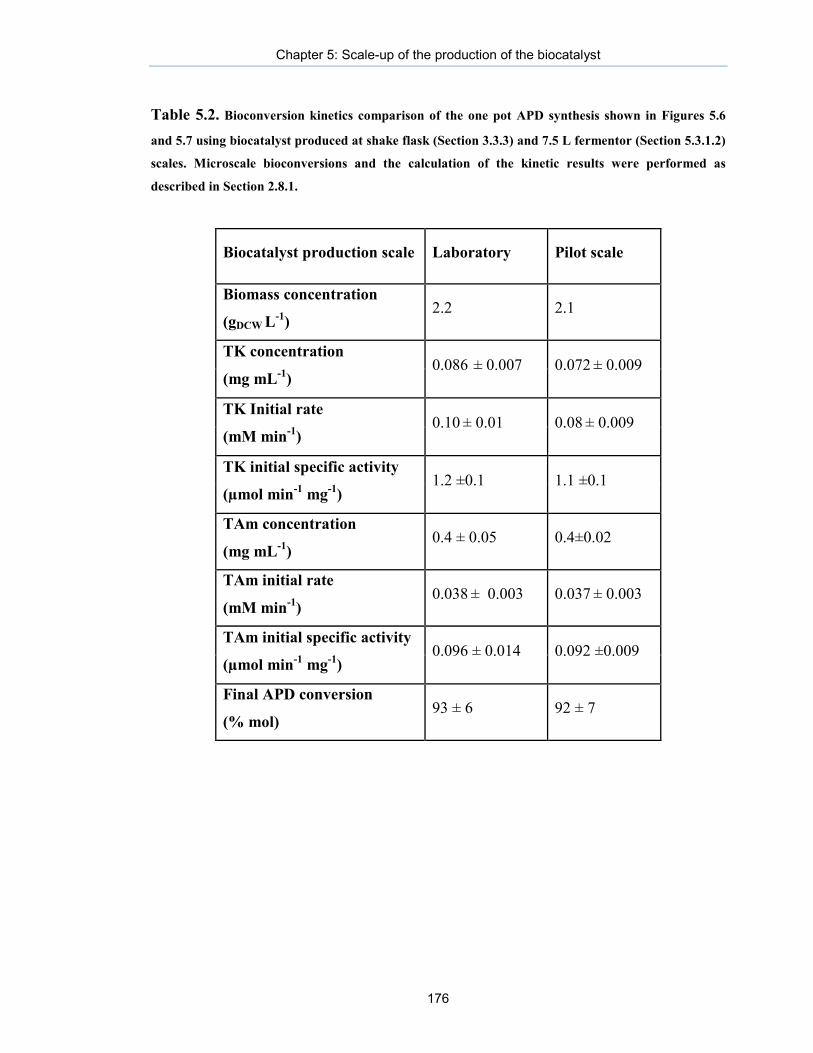
Chapter 5: Scale-up of the production of the biocatalyst
176
Table 5.2. Bioconversion kinetics comparison of the one pot APD synthesis shown in Figures 5.6
and 5.7 using biocatalyst produced at shake flask (Section 3.3.3) and 7.5 L fermentor (Section 5.3.1.2)
scales. Microscale bioconversions and the calculation of the kinetic results were performed as
described in Section 2.8.1.
Biocatalyst production scale Laboratory Pilot scale
Biomass concentration
(gDCW L-1) 2.2 2.1
TK concentration
(mg mL-1) 0.086 ± 0.007 0.072 ± 0.009
TK Initial rate
(mM min-1) 0.10 ± 0.01 0.08 ± 0.009
TK initial specific activity
(µmol min-1 mg-1) 1.2 ±0.1 1.1 ±0.1
TAm concentration
(mg mL-1) 0.4 ± 0.05 0.4±0.02
TAm initial rate
(mM min-1) 0.038 ± 0.003 0.037 ± 0.003
TAm initial specific activity
(µmol min-1 mg-1) 0.096 ± 0.014 0.092 ±0.009
Final APD conversion
(% mol) 93 ± 6 92 ± 7

Chapter 5: Scale-up of the production of the biocatalyst
177
5.4. SUMMARY
In summary, an overall scale-up of 50-fold for the production of the dual TK-TAm E. coli
biocatalyst was performed from shake flasks to a 2 L and then a 7.5 L stirred tank
fermentors. The growth kinetics and protein expression profiles at different temperatures
and induction times were also investigated (Figures 5.1 and 5.3). The best fermentation
conditions were determined to be 37oC with an early exponential phase induction, where
the TAm expression was highest (Figure 5.4 and 5.6a). Under those conditions, a 6 fold
increase in TK and TAm concentrations were obtained respectively in comparison with
the shake flask fermentations, while a suitable TAm/TK ratio of 5 was maintained (Table
5.1).
When used for the one pot synthesis of APD, the bioconversion kinetics of the pilot scale
biocatalyst were in excellent agreement with the biocatalyst initially produced at shake
flask scale (Figure 5.7 and 5.8). This clearly demonstrates that no lose in either TK or
TAm activity occurred during the scale-up process. In the following Chapter, the scale-up
of the TK-TAm one pot synthesis will be evaluated, as well as the complete kinetic
modelling of the de novo engineered pathway for preparative scale bioconversions.

† The majority of the results presented in this Chapter will be submitted for publication as: Rios-Solis L., P. Morris, A. Odeleye, P. A. Dalby, F. Baganz, and G. J. Lye. Scale-up and modelling of de novo pathway for the synthesis of chiral amino alcohols. In preparation.
6. SCALE-UP AND MODELLING OF
THE DE NOVO ONE-POT
SYNTHESIS OF AMINO ALCOHOLS†
6.1. INTRODUCTION
A defining feature of the microscale bioprocesses studies, like the ones performed in
Chapter 3 and 4, is to inform early stage bioprocess design and to aid predictions of
larger scales of operation (Lye et al., 2003; Micheletti & Lye, 2006). However, the
scale-up of in vivo de novo multi-enzymatic syntheses and the validation of the
corresponding microscale data have been poorly explored to date. In part because
such systems are difficulty to assemble and model accurately (Meyer et al., 2007).
Microscale, preparative and process scale bioreactors can present differences in fluid
dynamics, solvent evaporation, shear stress, mass and heat transfer phenomena, and
the methods used for pH control. These can cause significant and often unpredictable
discrepancies in the bioconversion behaviour at the different scales (Doig et al.,
2002; Micheletti et al., 2006; Nealon et al., 2006; Matosevic et al., 2008).
Therefore the detection of the main complications in the scale-up of the multi-step
synthesis is crucial for adequate bioprocess design and implementation (Pollard &
Woodley, 2007). Once the direct scale-up of the bioconversion can be guaranteed,
mathematical microscale models could be used to predict larger scale synthesis. Such

Chapter 6: Scale-up and Modeling of the One-pot Synthesis
179
models can then be applied in order to evaluate different bioconversion scenarios,
and to select the best operating conditions and reactor configurations (Sin et al.,
2009; Santacoloma et al., 2011).
6.2. AIM AND OBJECTIVES
The aim of this Chapter is to scale-up and model the one-pot synthesis of amino
alcohols using the de novo engineering whole cell E. coli biocatalyst. In order to do
so, the methodology developed in Chapter 4 will be used to establish microscale
kinetic models of the synthesis of PKD and APD using the TK D469E and the
CV2025 TAm. Subsequently, the microscale TK-TAm multi-step bioconversions of
amino alcohols ABT and APD will be scaled-up to preparative synthesis. The models
developed using the microscale tools will be then validated for the larger scale
syntheses. Finally, using the model predictions, the best bioconversion operating
strategies and reactor configuration will be determined and applied. The key
objectives of this chapter are thus:
• Determination of the kinetic models for the TK D469E and CV2025 TAm
mediated synthesis of PKD and APD respectively.
• Scale-up of the one-pot syntheses of APD and ABT from micro to
preparative scale.
• Kinetic modelling of the TK-TAm one-pot syntheses and validation of the
kinetic parameters by comparing the experimental and predicted data at the
different scales.
• Identification of the best bioconversion conditions and reactor configurations
using the predictions of the mathematical models.
• Application of the best reaction conditions to optimize the preparative scale
one-pot syntheses of APD and ABT.
Chapter 6: Scale-up and Modeling of the One-pot Synthesis
180
6.3. RESULTS
6.3.1. Determination of kinetic parameters
In Chapter 3, using microscale experimentation, the E. coli wild type TK and the
CV2025 TAm were found to be the best candidates for the one-pot synthesis of ABT,
while the mutant TK D469E combined with the CV2025 TAm were selected for the
synthesis of APD (Figure 3.7 and 3.8). The kinetic parameters of the TK synthesis of
ERY, from GA and HPA, have been reported previously (Gyamerah & Willetts,
1997; Chen et al., 2009), while the full kinetic model of the TAm mediated synthesis
of ABT was established in Chapter 4 (Equation 4.1 and Table 4.2).
In contrast the kinetic parameters for the TK D469E catalyzed synthesis of PKD and
the subsequent CV2025 TAm mediated synthesis of APD were still unknown. Hence
these kinetic parameters were rapidly determined here following the systematic
procedure summarized in Figure 4.1. Sections 6.3.1.1 and 6.3.1.2 will focus on the
results obtained for the kinetic models, which will be applied in Section 6.3.2 to
model the full one-pot synthesis of APD. For more details about the complete set of
progress curves used to determine the parameters, and its modelling predictions, refer
to Appendix IX and X.
6.3.1.1. Kinetic model of the E. coli D469E TK mediated synthesis of PKD
The synthesis of PKD catalyzed by the TK D469E in whole cell form from HPA and
PA is an irreversible reaction due to the release of CO2 as a side product (Scheme
3.2). The bioconversion follows a previously elucidated ping-pong bi-bi mechanism
with competitive substrate inhibition, which requires thiamine pyrophosphate and
Mg2+ as cofactors as was described in Section 1.5.2.3 (Gyamerah & Willetts, 1997;
Chen et al., 2008). The full kinetic model can be written as follows in Equation 6.1:

Chapter 6: Scale-up and Modeling of the One-pot Synthesis
181
where kcat represents the catalytic rate constant, KPA and KHPA are the Michaelis
constants of PA and HPA, KiPA, KiHPA and KiPKD are the inhibition constants of PA,
HPA and PKD respectively, and EiTK is the TK enzyme concentration.
Following the methodology illustrated in Figure 4.1, the values of the kinetic
parameters were determined here and are summarized in Table 6.1. Figure 6.1 shows
the resulting Michaelis-Menten plots, as well as two progress curves used to validate
the kinetic parameters. (Refer to Appendix IX for the complete experimental
progress curves used to determine the kinetic parameters as well as their modelling
predictions).

Chapter 6: Scale-up and Modeling of the One-pot Synthesis
182
Figure 6.1. (a) Apparent initial rate of PKD formation using TK D469E as a function of [PA]
while maintaining [HPA] fixed at 30 mM, and (b) as a function of [HPA] while maintaining [PA]
fixed at 100 mM. For the experiments (a) and (b) [TK] concentration was 0.15 mg mL-1 in
whole cell form. Experiments (c) and (d) represent typical TK experimental progress curves and
model predictions using an initial concentration of (c) 10 mM [PA] and [HPA] and 0.1 mg mL-1
[TK] and (d) 100 mM [PA] and [HPA] and 0.4 mg mL-1 [TK] following (●) HPA and (▲) PKD.
Dotted lines show model predictions based on Equation 6.1 and final kinetic parameters in
Table 6.1. For all the experiments TK biocatalyst was used in whole cell form with 2.4 mM
[TPP] and 9 mM [Mg2+] at 30oC and pH 7.5 in 50 mM TRIS buffer using microscale
experimentation (Section 2.8.1).

Chapter 6: Scale-up and Modeling of the One-pot Synthesis
183
Table 6.1. Experimental values of the apparent kinetic parameters of Equation 6.1 for the
synthesis of PKD catalyzed by a whole cell E. coli biocatalysts containing the TK mutant D469E.
Parameters were obtained following the methodology summarized in Figure 4.1 using
microscale experimentation (Section 2.8.1).
Apparent kinetic parameter Value
Rate constant: kcat (min−1) 642.3
Michaelis constant for HPA: KHPA (mM) 5.3
Michaelis constant for PA: KPA (mM) 47.4
Inhibition constant for HPA: KiHPA (mM) 86.7
Inhibition constant for PA: KiPA (mM) 542.2
Inhibition constant for PKD: KiPKD (mM) 886.9
The catalytic constant in Table 6.1 was found to be similar to the previously
published value for the synthesis of PKD using E. coli TK mutant D469T in lysate
form (Chen et al., 2008). It is important to mention that the kinetic parameters of TK
D469E in this work were determined at 30oC, while the authors used a temperature
of 25oC. Therefore, it could be assumed that at the same temperature, the TK D469T
would have a higher catalytic rate constant. Interestingly, both Michaelis constants
found in this work are half the value than the ones published for TK D469T.
6.3.1.2. Kinetic model of the CV 20205 TAm mediated synthesis of APD
Following the systematic approach developed in Chapter 4, the kinetic model for the
TAm mediated synthesis of APD was elucidated and is represented by Equation 6.2.
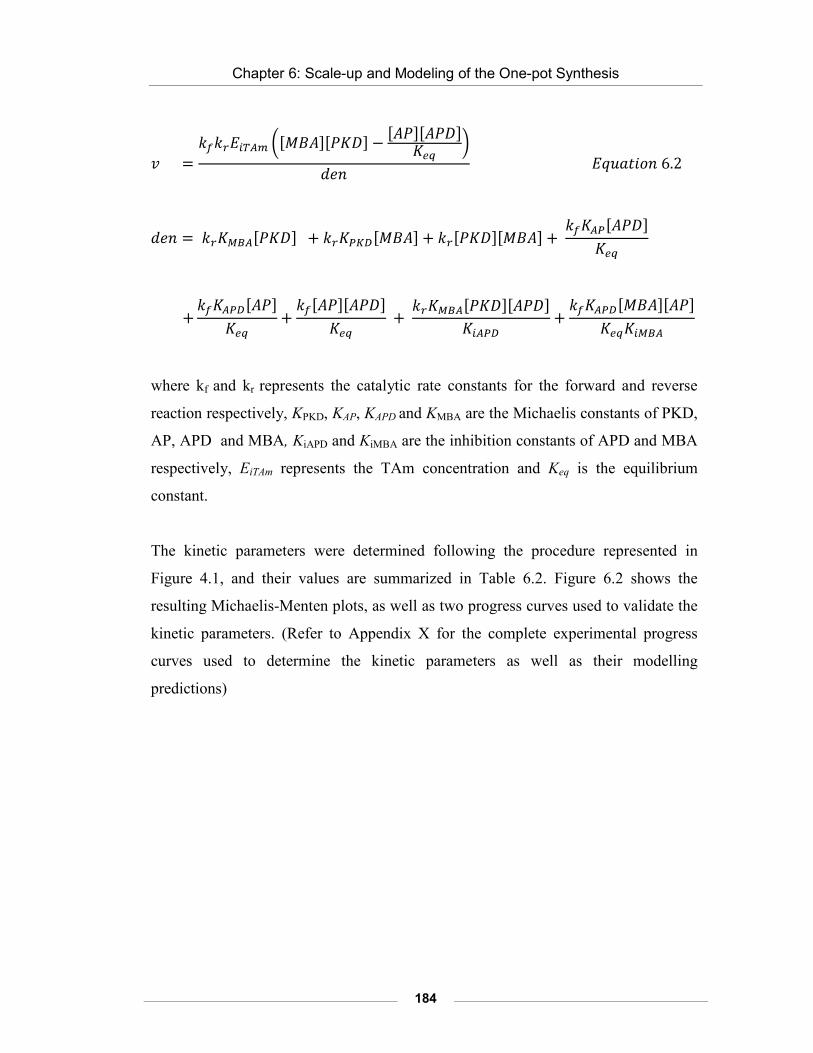
Chapter 6: Scale-up and Modeling of the One-pot Synthesis
184
where kf and kr represents the catalytic rate constants for the forward and reverse
reaction respectively, KPKD, KAP, KAPD and KMBA are the Michaelis constants of PKD,
AP, APD and MBA, KiAPD and KiMBA are the inhibition constants of APD and MBA
respectively, EiTAm represents the TAm concentration and Keq is the equilibrium
constant.
The kinetic parameters were determined following the procedure represented in
Figure 4.1, and their values are summarized in Table 6.2. Figure 6.2 shows the
resulting Michaelis-Menten plots, as well as two progress curves used to validate the
kinetic parameters. (Refer to Appendix X for the complete experimental progress
curves used to determine the kinetic parameters as well as their modelling
predictions)
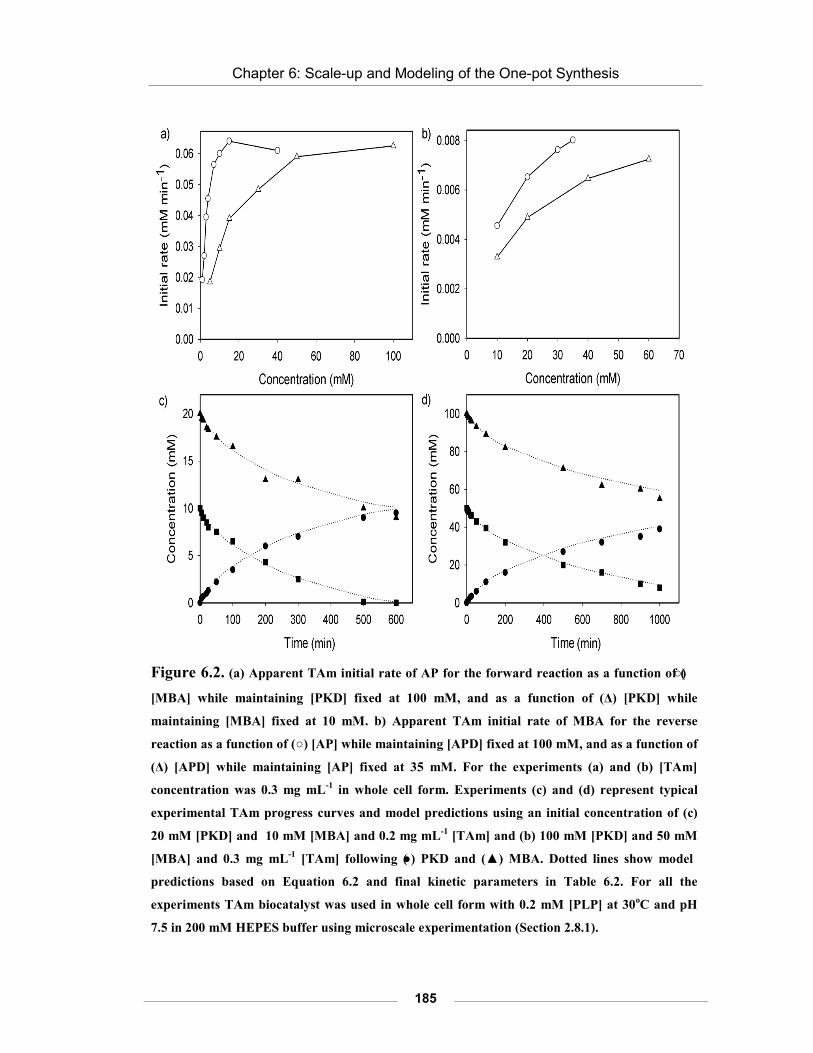
Chapter 6: Scale-up and Modeling of the One-pot Synthesis
185
Figure 6.2. (a) Apparent TAm initial rate of AP for the forward reaction as a function of (○)
[MBA] while maintaining [PKD] fixed at 100 mM, and as a function of (Δ) [PKD] while
maintaining [MBA] fixed at 10 mM. b) Apparent TAm initial rate of MBA for the reverse
reaction as a function of (○) [AP] while maintaining [APD] fixed at 100 mM, and as a function of
(Δ) [APD] while maintaining [AP] fixed at 35 mM. For the experiments (a) and (b) [TAm]
concentration was 0.3 mg mL-1 in whole cell form. Experiments (c) and (d) represent typical
experimental TAm progress curves and model predictions using an initial concentration of (c)
20 mM [PKD] and 10 mM [MBA] and 0.2 mg mL-1 [TAm] and (b) 100 mM [PKD] and 50 mM
[MBA] and 0.3 mg mL-1 [TAm] following (●) PKD and (▲) MBA. Dotted lines show model
predictions based on Equation 6.2 and final kinetic parameters in Table 6.2. For all the
experiments TAm biocatalyst was used in whole cell form with 0.2 mM [PLP] at 30oC and pH
7.5 in 200 mM HEPES buffer using microscale experimentation (Section 2.8.1).
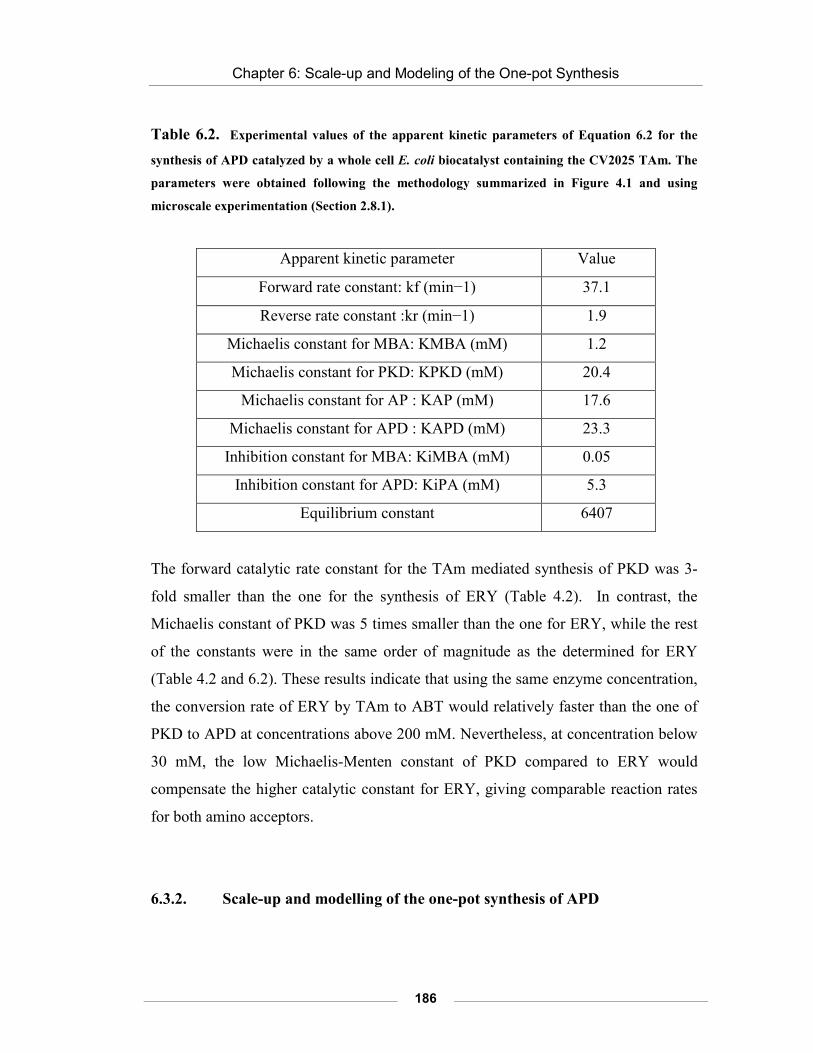
Chapter 6: Scale-up and Modeling of the One-pot Synthesis
186
Table 6.2. Experimental values of the apparent kinetic parameters of Equation 6.2 for the
synthesis of APD catalyzed by a whole cell E. coli biocatalyst containing the CV2025 TAm. The
parameters were obtained following the methodology summarized in Figure 4.1 and using
microscale experimentation (Section 2.8.1).
Apparent kinetic parameter Value
Forward rate constant: kf (min−1) 37.1
Reverse rate constant :kr (min−1) 1.9
Michaelis constant for MBA: KMBA (mM) 1.2
Michaelis constant for PKD: KPKD (mM) 20.4
Michaelis constant for AP : KAP (mM) 17.6
Michaelis constant for APD : KAPD (mM) 23.3
Inhibition constant for MBA: KiMBA (mM) 0.05
Inhibition constant for APD: KiPA (mM) 5.3
Equilibrium constant 6407
The forward catalytic rate constant for the TAm mediated synthesis of PKD was 3-
fold smaller than the one for the synthesis of ERY (Table 4.2). In contrast, the
Michaelis constant of PKD was 5 times smaller than the one for ERY, while the rest
of the constants were in the same order of magnitude as the determined for ERY
(Table 4.2 and 6.2). These results indicate that using the same enzyme concentration,
the conversion rate of ERY by TAm to ABT would relatively faster than the one of
PKD to APD at concentrations above 200 mM. Nevertheless, at concentration below
30 mM, the low Michaelis-Menten constant of PKD compared to ERY would
compensate the higher catalytic constant for ERY, giving comparable reaction rates
for both amino acceptors.
6.3.2. Scale-up and modelling of the one-pot synthesis of APD
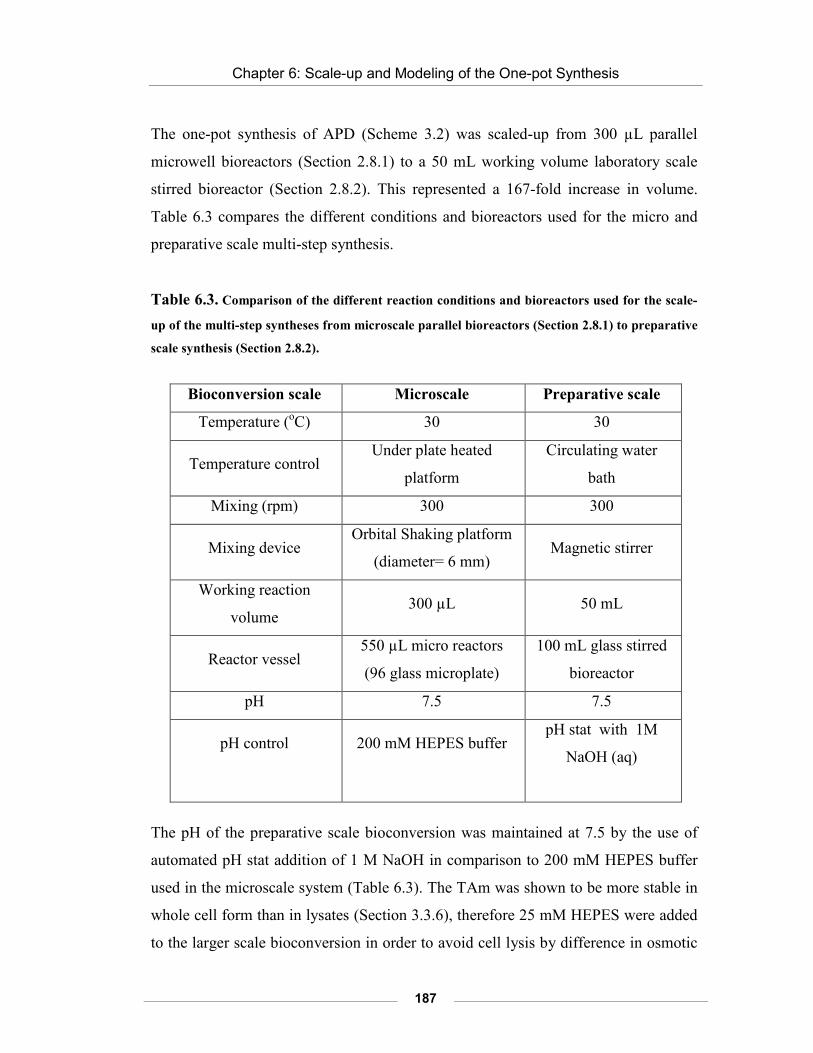
Chapter 6: Scale-up and Modeling of the One-pot Synthesis
187
The one-pot synthesis of APD (Scheme 3.2) was scaled-up from 300 µL parallel
microwell bioreactors (Section 2.8.1) to a 50 mL working volume laboratory scale
stirred bioreactor (Section 2.8.2). This represented a 167-fold increase in volume.
Table 6.3 compares the different conditions and bioreactors used for the micro and
preparative scale multi-step synthesis.
Table 6.3. Comparison of the different reaction conditions and bioreactors used for the scale-
up of the multi-step syntheses from microscale parallel bioreactors (Section 2.8.1) to preparative
scale synthesis (Section 2.8.2).
Bioconversion scale Microscale Preparative scale
Temperature (oC) 30 30
Temperature control Under plate heated
platform
Circulating water
bath
Mixing (rpm) 300 300
Mixing device Orbital Shaking platform
(diameter= 6 mm) Magnetic stirrer
Working reaction
volume 300 µL 50 mL
Reactor vessel 550 µL micro reactors
(96 glass microplate)
100 mL glass stirred
bioreactor
pH 7.5 7.5
pH control 200 mM HEPES buffer pH stat with 1M
NaOH (aq)
The pH of the preparative scale bioconversion was maintained at 7.5 by the use of
automated pH stat addition of 1 M NaOH in comparison to 200 mM HEPES buffer
used in the microscale system (Table 6.3). The TAm was shown to be more stable in
whole cell form than in lysates (Section 3.3.6), therefore 25 mM HEPES were added
to the larger scale bioconversion in order to avoid cell lysis by difference in osmotic

Chapter 6: Scale-up and Modeling of the One-pot Synthesis
188
pressure. The temperature was kept constant at 30oC using a circulating water bath in
contrast to an “under plate” heated platform used for the microscale experiments
(Section 2.8.1 and 2.8.2).
In the case of mixing, previous results reported an increase in transfer rates of
substrates for TK bioconversions in the µL scale compared to the mL scale, causing
differences up to 40% in the scale-up process (Matosevic et al., 2008). In order to
overcome this problem, the authors demonstrated that using a magnetic stirrer at 300
rpm reduced the discrepancies between the larger and small scale results. This
mixing system was then chosen for the lab bench vessel in comparison with the
orbital shaking platform used for the microscale experiments (Section 2.8.1 and
2.8.2).
For the one-pot synthesis of APD, the microscale bioconversion results obtained in
Section 5.3.3 using a shake flask biocatalyst, were used as a reference to compare the
scale-up process (Figure 5.6 and 5.7). For the preparative scale synthesis, the TK-
TAm biocatalyst produced at the small pilot plant scale using the 7.5 L fermentor
(Section 5.3.2) was applied to perform the bioconversion. The concentration of TAm
was also fixed at 0.4 mg mL-1; therefore the biomass and the TK concentration were
2.1 gDCW L-1 and 0.07 mg mL-1 (Table 5.2).
The initial concentration of substrates PA and HPA were 10 mM, and MBA was
added after 7 hours of starting the bioconversion, the same was for the microscale
synthesis described in Section 5.3.3.

Chapter 6: Scale-up and Modeling of the One-pot Synthesis
189
Figure 6.3. Scale-up and modelling of the whole cell E. coli TK-TAm sequential synthesis of
APD following: (□) HPA, (○) PKD and (Δ) APD using microscale experimentation (data was
obtained from Section 5.3.3), and (■) HPA, (●) PKD and (▲) APD for the preparative scale
synthesis (Section 2.8.2). Reaction conditions: 10 mM [HPA] and [PA], 0.2 mM [PLP], 2.4 mM
[TTP], 9 mM [Mg2+], 30 oC, pH 7.5 in 200 mM HEPES. 10 mM MBA was added after 420 min.
[TK] and [TAm] were 0.07 and 0.4 mg mL-1 respectively for both whole cell biocatalysts. The
modelling was performed combining Equations 6.1 and 6.2 with the corresponding kinetic
parameters from Table 6.1 and 6.2 and is shown as a solid line. Error bars represent one
standard deviation about the mean (n=3).

Chapter 6: Scale-up and Modeling of the One-pot Synthesis
190
Figure 6.3 shows the complete experimental progress curves of the micro and
preparative scale bioconversions. Combining equations 6.1 and 6.2, the complete
modelling of the one-pot synthesis was also achieved in Figure 6.3.
The microscale results scaled excellently as shown in Figure 6.3, resulting in very
similar kinetic profiles after a 166-fold scale-up. The experimental kinetic results
from the different scales and the kinetic model predictions are shown in Table 6.4.
Table 6.4. Experimental and predicted apparent kinetic results for the one-pot synthesis of APD
shown in Figure 6.3 using microscale experimentation (Section 3.8.1) and a preparative scale
bioreactor (Section 3.8.2). The predicted data was obtained using Equations 6.1 and 6.2 with the
kinetic parameters from Table 6.1 and 6.2. The calculation of the kinetic experimental results
was performed as described in Section 2.8.1.
Apparent kinetic parameter Model prediction
Microscale data
Preparative scale data
E. coli D469E TK initial specific activity 1.1 1.3 ± 0.2 1.2 ± 0.2
(µmol min-1 mg-1) CV2025 TAm initial specific
activity 0.12 0.1 ± 0.01 0.1 ± 0.02 (µmol min-1 mg-1) Final APD yield
(% mol/mol) 98 93 ±6 85 ± 6.5
The difference in TK and TAm specific activities of both scales were statistically not
significant (Table 6.4). This indicates that the biocatalyst did not lose activity in the
scale-up process, and also that the preparative scale synthesis did not suffer greater
mass transfer limitations compared to the microscale bioconversion.
Excellent agreement was found between the predicted specific activities and the
experimental data (Table 6.4), which shows that the mathematical models developed
in Section 6.3.1 using microscale data were still valid for preparative scale multi-step

Chapter 6: Scale-up and Modeling of the One-pot Synthesis
191
syntheses. After 1500 min of bioconversion, a small difference could be observed
between the predicted and experimental data, which was higher than the
experimental error, especially for the preparative scale synthesis. This discrepancy
could also be detected in the maximum final yield (% mol/mol) of the large scale
bioconversion which was 13 and 7% smaller than the predicted and microscale yield.
Because the predicted initial specific activities were in agreement with the
experimental results of both scales (Table 6.3), and the discrepancies only appeared
after 1500 min of reaction time, the difference in the final conversion was attributed
to a decrease in stability of TAm, probably caused by the toxicity of MBA as was
discussed in Section 4.4.3.7. Also the stirring of the 100 mL bioreactor may have
caused lysis of the cells, further reducing the stability of the TAm as was shown in
Section 3.3.6. In addition, although APD was a non natural substrate, consumption of
APD by the whole cells could also contribute to the difference in final yields, as it
has previously been previously shown for similar amino alcohols (Ingram et al.,
2007).
An individual TK synthesis of PKD had been successfully scaled-up in a previous
work (Smith et al., 2010) obtaining a maximum difference between predicted and
experimental data of 30%, which was 2-fold higher than the differences found in this
work (Figure 6.3). A previous work scaling up a TAm bioconversion from the µL to
mL scale reported a 30% difference in the final yield (% mol/mol), mainly due to pH
fluctuations in the small scale system (Truppo et al., 2009). The use of 200 mM
HEPES here enabled to maintain the pH of the microscale bioconversion constant,
improving the agreement of the results towards the larger scale synthesis.
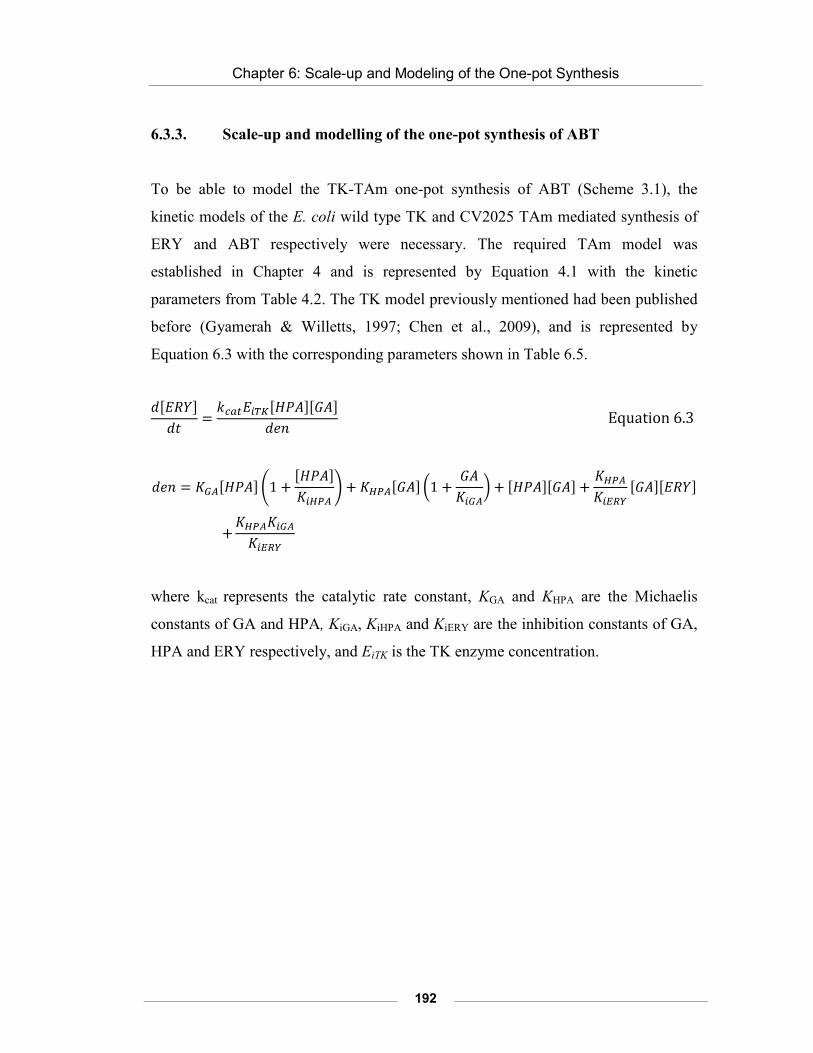
Chapter 6: Scale-up and Modeling of the One-pot Synthesis
192
6.3.3. Scale-up and modelling of the one-pot synthesis of ABT
To be able to model the TK-TAm one-pot synthesis of ABT (Scheme 3.1), the
kinetic models of the E. coli wild type TK and CV2025 TAm mediated synthesis of
ERY and ABT respectively were necessary. The required TAm model was
established in Chapter 4 and is represented by Equation 4.1 with the kinetic
parameters from Table 4.2. The TK model previously mentioned had been published
before (Gyamerah & Willetts, 1997; Chen et al., 2009), and is represented by
Equation 6.3 with the corresponding parameters shown in Table 6.5.
where kcat represents the catalytic rate constant, KGA and KHPA are the Michaelis
constants of GA and HPA, KiGA, KiHPA and KiERY are the inhibition constants of GA,
HPA and ERY respectively, and EiTK is the TK enzyme concentration.

Chapter 6: Scale-up and Modeling of the One-pot Synthesis
193
Table 6.5. Reported values by Chen et al., (2009) for the kinetic parameters of Equation 6.3 for
the synthesis of ERY catalyzed by E. coli wild type TK. The parameters reported by the authors
were obtained at 25oC and pH 7 using TK in lysate form.
Apparent kinetic parameter Value
Rate constant: kcat (min−1) 2442
Michaelis constant for HPA: KHPA (mM) 18
Michaelis constant for GA: KGA (mM) 16
Inhibition constant for HPA: KiHPA (mM) 40
Inhibition constant for GA: KiGA (mM) 570
Inhibition constant for ERY: KiERY (mM) 536
A 167-fold scale-up of the one-pot synthesis of ABT was performed, from 300 µL
parallel micro reactors (Section 2.8.1) to a 50 mL working volume laboratory stirred
bioreactor (Section 2.8.2) in a similar way as Section 6.3.2.
The microscale bioconversion was performed using a shake flask biocatalyst
(Section 2.4.2 and Figure 3.1), while for the preparative scale synthesis, a wild type
TK and TAm biocatalyst was produced using the 7.5 L fermentor (Section 5.3.2). For
both biocatalysts, the TK and TAm expression represented on average 39 and 6.5%
of the protein when analyzed by SDS PAGE (Section 2.9.5), which were in
agreement with the enzyme expression of the biocatalysts summarized in Table 5.1
with the TK D469E.
Due to the higher susceptibility of ERY and ABT to be consumed by whole cell side
reactions compared to PKD and APD (Ingram et al., 2007), 25% less biomass
concentration was used in the ABT bioconversion in comparison with the synthesis

Chapter 6: Scale-up and Modeling of the One-pot Synthesis
194
of APD performed in Section 6.3.2. Therefore the concentration of TK and TAm
were 0.06 and 0.3 mg mL-1 for both bioconversion scales.
The starting concentration of substrates GA and HPA was 30 mM. Equation 6.3
predicted that after 250 min, the TK bioconversion would reach completion. After
this time, MBA was added to a final concentration of 10 mM the same was as in
Section 6.3.2. An excess of ERY to MBA 3:1 was maintained in the bioconversion
due to the lower TAm Michaelis constant of ERY compared to MBA (Table 4.2).
This was done with the aim to speed up the one-pot synthesis and avoid enzyme
deactivation by MBA, as well as ABT and ERY degradation by the whole cells.
Figure 6.4 shows the complete experimental progress curve of the micro and
preparative scale bioconversions. Combining equations 6.3 and 4.1 with their
respective parameters (Table 6.4 and 4.2), the complete modelling of the one-pot
synthesis of ABT was also performed and shown in Figure 6.4.
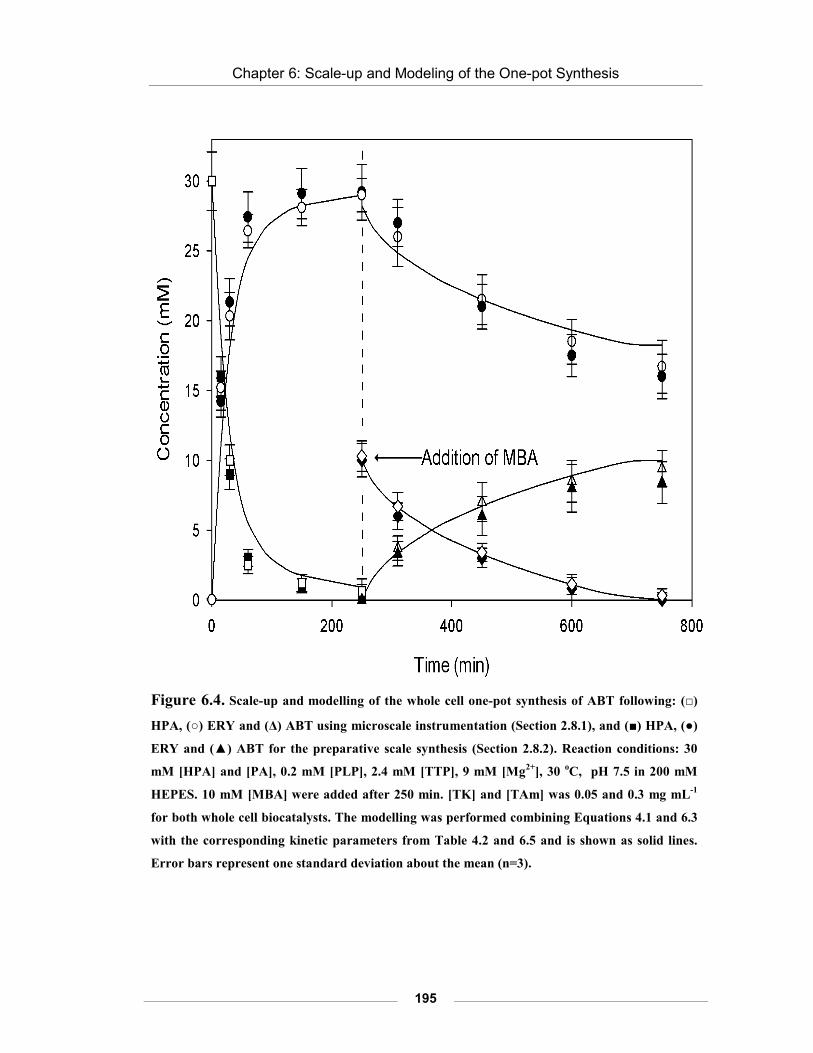
Chapter 6: Scale-up and Modeling of the One-pot Synthesis
195
Figure 6.4. Scale-up and modelling of the whole cell one-pot synthesis of ABT following: (□)
HPA, (○) ERY and (Δ) ABT using microscale instrumentation (Section 2.8.1), and (■) HPA, (●)
ERY and (▲) ABT for the preparative scale synthesis (Section 2.8.2). Reaction conditions: 30
mM [HPA] and [PA], 0.2 mM [PLP], 2.4 mM [TTP], 9 mM [Mg2+], 30 oC, pH 7.5 in 200 mM
HEPES. 10 mM [MBA] were added after 250 min. [TK] and [TAm] was 0.05 and 0.3 mg mL-1
for both whole cell biocatalysts. The modelling was performed combining Equations 4.1 and 6.3
with the corresponding kinetic parameters from Table 4.2 and 6.5 and is shown as solid lines.
Error bars represent one standard deviation about the mean (n=3).

Chapter 6: Scale-up and Modeling of the One-pot Synthesis
196
The results from the micro reactors scaled excellently as shown in Figure 6.4,
resulting in very similar progress curves between the two scales. The maximum
experimental difference for the synthesis of ABT between the two scales was found
to be 11%, which was not statistically significant. This demonstrates the microscale
experimentation was predictive of the preparative scale multi-step bioconversion of
ABT. The kinetic results from the different scales and the model are summarized in
Table 6.6.
Table 6.6. Experimental and predicted apparent kinetic results of the one-pot synthesis of ABT
shown in Figure 6.4 using microscale experimentation (2.8.1) and a preparative scale bioreactor
(Section 2.8.2). The predicted data was obtained using Equations 4.1 and 6.3 with the kinetic
parameters from Table 4.2 and 6.5 respectively. The calculation of the kinetic experimental
results was performed as described in Section 2.8.1.
Apparent kinetic parameter Predicted data Microscale Preparative
scale Wild type TK initial specific
activity 1.5 2.0 ± 0.17 1.9 ± 0.22 ( µmol min-1 mg-1)
CV2025 TAm initial specific activity 0.19 0.21 ± 0.02 0.18 ± 0.02
(µmol min-1 mg-1) Final ABT conversion
(% mol/mol) 99 94 ± 9 84 ± 11
A difference of 25% between the TK experimental and predicted specific activity
was found (Table 6.6). This was probably due because the TK kinetic model was
established at 25oC and pH 7.0 (Chen et al., 2009), instead of 30oC and pH 7.5 which
were used for the one-pot synthesis shown in Figure 6.4. The difference was
considered acceptable, and good agreement could be concluded between the
predicted and experimental data (Figure 6.4), validating the microscale mathematical
models for preparative scale multi-step syntheses.

Chapter 6: Scale-up and Modeling of the One-pot Synthesis
197
Similar to the one-pot synthesis of APD in Section 6.3.2, the ABT yield (% mol/mol)
of the preparative conversion was 10 and 15% smaller than the microscale and
predicted model respectively (Table 6.6). Also some consumption of ERY by the
whole cell was observed in both scales (Figure 6.4). Nevertheless, by using an excess
of 3:1 ERY:MBA, the reaction time to reach completion was reduced by 3 folds
compared to an equimolar concentration of 10 mM (Equation 6.3 and Table 6.5). The
reduction in time allowed less consumption of ABT and ERY by the whole cells, as
well as less inactivation of TAm by MBA. This shows how using the mathematical
models, it was possible to design the one-pot synthesis of ABT with 25% less
biocatalyst while reaching completion in 3-folds less time than the synthesis of APD
(Figure 6.3 and 6.4). This was done in order to minimize the consumption of ERY
and ABT by the whole cells.
6.3.4. Selection of the best reactor configuration
6.3.4.1. One-pot synthesis of ABT with fed-batch addition of MBA
After the kinetic models were validated for the preparative scale syntheses of the two
different amino alcohols (Section 6.3.2 and 6.3.3), the microscale results could be
used to select the best reactor configuration and operating conditions (Sin et al.,
2009).
As discussed in Sections 4.4.3.7, MBA was found to be inhibitory to TAm in
concentrations above 10 mM, in contrast ERY and PKD did not affect the enzyme
stability (Figure 4.6). This limited the yield of the TAm bioconversion in equimolar
concentrations above 10 mM as was shown in Figure 3.9. A solution to avoid MBA
toxicity was to use a continuous fed-batch addition of the amino-donor. The
Michaelis Menten constant of ERY was found to be 97 mM in comparison with the
one of MBA of 0.5 mM (Table 4.2). These values predicted that the production rate

Chapter 6: Scale-up and Modeling of the One-pot Synthesis
198
of ABT would not be severely affected by maintaining a MBA concentration below
10 mM in the reaction.
Therefore a one-pot synthesis of ABT was performed in preparative scale with fed-
batch addition of MBA. The initial volume of the bioconversion was 50 mL, and the
pH and temperature were controlled at 7.5 and 30oC the same way as in Section
6.3.1. The initial concentration of HPA and GA was 100 mM, and the concentration
of TK and TAm were 0.75 mg mL-1 and 0.14 mg mL-1 using a whole cell biocatalyst
produced in the 7.5 L fermentor (Section 5.3.2).
To model the one-pot synthesis with fed-batch addition of MBA, the TK Equation
6.3 was combined with the following differential equations to model the TAm step:
where Ri (mM min-1) is the kinetic reaction rate of each compound defined by
equation 4.2, FeedRate (L min-1) is the rate of MBA solution, MBAFeed (mM) is the
concentration of MBA in the feed and Vol (L) is the working reaction volume.
Equation 6.3 predicted that under the previously mentioned conditions, the TK
reaction would reach completion after 180 min, at this time MBA was fed
continuously using a 300 mM solution (Section 2.8.2).
Chapter 6: Scale-up and Modeling of the One-pot Synthesis
199
A varied flow rate of the MBA solution that would match the predicted rate of the
consumption of the amino donor by Equation 4.2 would have been desirable (Sayar
et al., 2009). Nevertheless, such a programmable pump was not available when this
work was performed.
Therefore several simulations were performed using equations 6.4, 6.5, 6.6 and 6.7 to
identify an appropriate constant flow rate, which would maximize the reaction rate
while maintaining a low concentration of MBA below 10 mM for the maximum
possible time. The selected flow rate was found to be 0.31 mL hr-1, which combined
with a calculated duration of the fed-batch operation of 53 hr, meant that a total of 5
mmol of MBA would be added to the reaction. This amount of MBA was equivalent
to the total number of mmol of ERY that were predicted to be produced by the TK
using a solution 100 mM of GA and HPA with an initial working volume of 50 mL.
Hence the initial concentration of substrates was 10 folds higher than the
concentration used in the previous one-pot synthesis represented in Figures 6.3 and
6.4.
Figure 6.5 shows the experimental progress curves and the predicted data for the
amount of each compound (mmol) for the one-pot synthesis of ABT. In order to
compare the performance of the different addition modes of MBA, another one-pot
synthesis using a single shot addition of 5 mmol of pure MBA (carefully added to
allow the system to adjust pH) after 180 min was also performed. The results of this
multi-step bioconversion are also shown in Figure 6.5, including its corresponding
modelling with Equations 4.1 and 6.3 and the parameters from Table 4.2 and 6.5.

Chapter 6: Scale-up and Modeling of the One-pot Synthesis
200
Figure 6.5. Typical progress curves and modelling of the TK-TAm sequential one-pot
synthesis of ABT with continuous fed-batch addition of MBA following the equivalent
concentration (reference volume of 50 ml) of: (■) HPA, (●) ERY and (▲) ABT, and with a single
shot addition of MBA following (Δ) ABT. The bioconversions were performed using preparative
scale experimentation described in Section 2.8.2. Initial reaction conditions : 50 mL working
volume, 100 mM [HPA] and [GA], 0.2 mM [PLP], 2.4 mM [TTP], 9 mM [Mg2+], 30 oC, pH 7.5,
25 mM HEPES. After 180 min, a solution of 300 mM [MBA] was added with a constant flow
rate of 0.31 mL hr-1 for the fed-batch addition or 5 mmol of pure MBA were added for the single
shot addition of the amino donor. [TK] and [TAm] were 0.14 and 0.75 mg ml-1 respectively using
a whole cell biocatalyst produced in the 7.5 L fermentor (Section 5.3.2). The modelling of the
fed-batch bioconversion was performed combining Equations 6.3, 6.4, 6.5, 6.6 6.7 and 4.1 with
the corresponding kinetic parameters from Tables 6.5 and 4.2 and is represented by a solid line.
The modelling of the TAm step with a single shot addition was performed combining Equations
4.2 and 6.3 with the kinetic parameters from Table 6.5 and 4.2 and is represented by a dashed
line.

Chapter 6: Scale-up and Modeling of the One-pot Synthesis
201
Reasonable agreement was again found between the experimental and predicted data
for the synthesis with fed-batch addition of MBA shown in Figure 6.5. After 2000
min, the consumption rate of MBA by TAm was overcome by the feed rate of MBA,
therefore accumulation of the amino donor above 10 mM started to occur (data not
shown). This probably caused deactivation of the enzyme and no further conversion
was obtained after 3200 min.
In the multi-step synthesis with a single shot addition of MBA, as Equation 6.3
predicted, the rate of ABT synthesis was initially faster than for the fed-batch
bioconversion, resulting in higher ABT yields for the first 1000 min of reaction.
Nevertheless, it appears TAm was totally inactivated after 1000 min by the higher
concentration of MBA in comparison with the fed-batch bioconversion, and no
further production of ABT was quantified after that time. The result was a final
conversion yield of 62 % mol/mol for the bioconversion with fed-batch addition,
which was 40% higher than the corresponding yield using the one shot addition of
MBA.
6.3.4.2. One-pot synthesis of APD with fed-batch addition of IPA
The selection of IPA as amino donor instead of MBA could attenuate the problems
of accumulation and toxicity of MBA in the previous fed-batch multi-step synthesis
(Section 6.3.4.1). IPA showed great potential in the microscale one-pot synthesis of
APD using low concentration of substrates (Figure 3.11). In addition, any excess of
IPA could potentially evaporate if the bioreactor was not sealed due to its high
volatility (Smith et al., 2010).
A one-pot synthesis of APD was performed with fed-batch addition of IPA in a 50
mL preparative scale bioreactor (Section 2.8.1). The reaction conditions were the
same as the multi-step bioconversion performed in Section 6.3.4.1, except that the
initial concentration of PA and HPA were 200 mM (20 folds higher than the

Chapter 6: Scale-up and Modeling of the One-pot Synthesis
202
concentrations used in the microscale synthesis shown in Figure 3.11 and 6.3). The
concentration of TK D469E and the CV2025 TAm were 0.75 and 0.14 mg mL-1
using a whole cell biocatalyst produced as described in Section 5.3.2. Using Equation
6.1 and the kinetic parameters from Table 6.1, it was predicted that the TK reaction
would reach completion after 10 hr. At that time, a solution of IPA 500 mM was fed
continuously to the bioreactor with a flow rate of 0.42 mL hr-1 during 48 hr, so that a
total amount of 10 mmol of IPA would be added to the vessel, which was equivalent
to the total amount of mmol of PKD that were predicted to be produced by the TK
reaction.
Figure 6.6 shows the experimental progress curves of the amount of each compound
(mmol), as well as the predicted data of the TK step of the preparative scale one-pot
synthesis of APD using fed-batch addition of IPA. Perfect agreement was found
between the TK experimental and predicted data by Equation 6.1, which validated
the TK model for concentrations as high as 200 mM in a preparative scale synthesis.
The TAm bioconversion did not seem to be inhibited by any accumulation of IPA
during the 3000 min that the amino donor was fed, suggesting that any excess of IPA
was successfully evaporated.
A total volume of IPA solution of 20 mL was added to the bioreactor, leading to a
final APD yield of 70% mol/mol. This yield was 3.5 folds higher than the yield
obtained under similar batch reaction conditions for a single TAm step bioconversion
(Appendix XI). This suggested that IPA could be causing strong inhibition or be
toxic to TAm in high concentrations.
Using the selected reaction conditions and reactor configuration, the one-pot
synthesis allowed a 6 fold greater yield (% mol/mol) using concentrations 1 order of
magnitude higher than a previous 2 step preparative scale batch synthesis of APD
(Smith et al., 2010).

Chapter 6: Scale-up and Modeling of the One-pot Synthesis
203
Figure 6.6. Typical progress curves and modelling of the TK-TAm sequential one-pot
synthesis of APD with continuous fed-batch addition of IPA following the equivalent
concentration (reference volume of 50 ml) of: (■) HPA, (●) PKD and (▲) APD. The
bioconversion was performed using preparative scale experimentation described in Section
2.8.2. Initial reaction conditions: 50 mL working volume, 200 mM [HPA] and [PA], 0.2 mM
[PLP], 2.4 mM [TTP], 9 mM [Mg2+], 30 oC, pH 7.5, 25 mM HEPES. After 600 min, a solution of
500 mM [IPA] was added with a constant flow rate of 0.42 mL hr-1. [TK] and [TAm] were 0.75
and 0.14 mg mL-1 respectively using a whole cell biocatalyst produced in the 7.5 L fermentor
(Section 5.3.2). The modelling of the TK step was performed using Equation 6.1 with the
corresponding kinetic parameters from Table 6.1 and was represented by a dashed line.

Chapter 6: Scale-up and Modeling of the One-pot Synthesis
204
6.4. SUMMARY
In summary, an overall scale-up of 167-fold for the one-pot syntheses of both APD
and ABT was performed. The results obtained showed excellent agreement between
those obtained at the micro and preparative scales (Figure 6.3 and 6.4).
In order to simulate the multi-step synthesis, the kinetic models for the TK D469E
and CV2025 TAm mediated synthesis of PKD and APD were established (Figure 6.1
and 6.2 and Equations 6.1 and 6.2) building on the methodology developed in
Chapter 4.
Generation of the relevant kinetic constants enabled modelling for the one-pot
bioconversion of both APD and ABT, showing that the methodology could be
applied to different bioconversion of substrates and products. In both cases there was
excellent agreement between the predicted and experimental data, validating the
microscale kinetic models to simulate preparative scale syntheses (Figure 6.3 and
6.4).
Finally, the best bioconversion conditions and reactor configurations have been
identified based on the mathematical models generated using microscale
experimental data. These led to identification of a reactor with fed-batch addition of
the amino donor to be the optimum operating strategy in each case. Under optimal
conditions, the one-pot syntheses allowed up to a 6-fold increase in product yield (%
mol/mol) (Figure 6.5 and 6.6), using concentrations 1 order of magnitude higher than
published preparative scale data (Smith et al., 2010).
The final chapter of this thesis will attempt to put this work in the wider context of
industrial bioconversion process design and identify areas where further work is
required or improvements can be made.

7. CONCLUSIONS AND FUTURE WORK
7.1. OVERALL CONCLUSIONS
In this study, the design and characterization of de novo engineered pathways in a whole
cell E. coli biocatalyst for multi-step enzymatic syntheses of chiral amino alcohols was
achieved. This was facilitated by developing a microscale high-throughput “toolbox”,
which enabled the efficient evaluation and “mix and match” of the best enzyme
candidates, as well as the simulation of the one-pot synthesis to speed-up process
development. The toolbox approach was demonstrated for the synthesis of amino
alcohols APD (Figure 3.11) and ABT (Figure 3.12), where the best enzyme pairs were
found to be the E. coli TK mutant D469E and wild type TK combined with the CV2025
TAm respectively using a whole cell biocatalyst.
For this approach to work best the need for early characterization of the kinetics of the
individual enzymes in the de novo engineered pathway is highlighted. This is necessary
in order to rapidly identify the overall bioconversion bottleneck (Figures 3.7 and 3.8).
This kinetic data is crucial for early establishment of optimum reaction conditions for the
one-pot synthesis which in general needs to favour the rate limiting step of the overall
bioconversion.
It was also found that special attention must be taken for the early detection of side
reactions that could occur between the different bioconversion steps. A sequential
feeding of substrates may be needed to avoid side reactions, as was demonstrated for the
case of the amino donor MBA in the one-pot synthesis of ABT (Figure 3.10). Expanding
the size of the TK and TAm libraries, by further engineering the enzymes to limit its
selectivity towards inappropriate substrates or intermediates, would increase the
productivities of the one-pot synthesis strategy.

Chapter 7: Conclusions and Future Work
206
In principle the microscale toolbox approach could be used to rapidly evaluate any set of
enzyme pairs and substrates, which could conceptually be integrated in a multi-step
synthesis. It enables the early generation of crucial bioprocess and kinetic data for the
effective design of complex bioconversion processes.
For the particular de novo engineered pathways studied here, of particular relevance was
the early identification and optimization of the critical step of the multi-enzymatic
synthesis, which was found to be that catalyzed by TAm (Section 3.3.4). To help
optimize this step, a methodology to rapidly establish the full kinetic model and its
parameters was developed and integrated in the microscale toolbox.
The creation of a standardized methodology allowed the establishment of the kinetic
parameters as a rapid routine procedure, easily applied to all the different enzymes of the
de novo pathway, requiring less time and resources. It also contributed to a higher
transparency of the kinetic parameters identification, facilitating the comparison of the
different models.
The key limiting TAm kinetic parameters were found to be the high Michaelis- Menten
constant and the low catalytic constant for ABT and APD synthesis respectively (Table
4.2 and 6.2). Also, the high toxicity of the amino donor towards the enzyme was found to
limit the final yields of the bioconversion (Section 4.2.4 and 4.3). While saving time and
resources through the use of simulations, the early discovery of those bottlenecks was
crucial to determine the best reaction conditions and reactor configurations (Section
6.3.4). This kinetic information will also be useful to inform protein engineering
strategies to further unlock the potential of the TAm bioconversion.
The modelling results were decisive in the rational design of the whole cell E. coli
biocatalyst; informing the desired level of expression of each enzyme to match the
sequential reaction kinetics. The effect of temperature and induction time was found to
be crucial for the relative level of expression of both enzymes. This allowed the scale-up
of the production of the E. coli biocatalyst to pilot scale obtaining maximum
concentrations of TK and TAm, while maintaining a desired TAm/TK ratio of 5 (Figure

Chapter 7: Conclusions and Future Work
207
5.4 and 5.6a). The capacity to control the relative expression of each enzyme will be
critical to harvest the full synthetic potential of de novo pathways at industrial scale,
increasing productivities and allowing them to be flexible in order to adapt for new
substrates and products.
Excellent agreement was found between the kinetic performance of the biocatalysts
produced at laboratory and small pilot scale (Figure 5.7 and 5.8), confirming that the
integrity of the cells and the stability of the enzymes were maintained during the scale-up
process. Further scale-up studies to identify the key issues related with the biocatalyst
production will be essential for the efficient bioprocess development to manufacturing
scale.
Finally the microscale one-pot syntheses of amino alcohols were modelled and scaled-up
167-fold to a preparative scale. Again, excellent agreement was found between the
experimental data at both scales and the predicted data for the one-pot synthesis of ABT
(Figure 6.3) and APD (Figure 6.4). Appropriate mixing in the preparative scale
synthesis, combined with constant pH and solvent evaporation control in the microscale
bioreactors were found to be critical to guarantee successful process scale-up (Section
6.3.2). The main deviations of the experimental data and the model were attributed to
TAm instability in the presence of the amino donor (Section 4.3.3.7 and Figure 6.5). In
order to predict accurately longer multi-step bioconversions with high concentration of
amino donor, the toxic effect of the substrate towards TAm should be taken into account
in the mathematical models.
Overall the best reaction conditions and reactor configurations were determined using the
microscale models, which resulted in using an excess of the amino acceptor ERY due to
its low Michaelis constant (Section 6.3.3), as well as applying a controlled fed batch
addition of the amino donor to avoid its toxicity toward the enzyme (Section 6.3.4).
Under these optimized conditions, the one-pot syntheses allowed up to a 6-fold increase
in yield (% mol/mol) (Figure 6.5 and 6.6), using concentrations 1 order of magnitude
higher than previously published preparative scale data (Smith et al., 2010).
Chapter 7: Conclusions and Future Work
208
We estimate that by applying this microscale systematic approach to design and
characterize de novo engineered pathways, the industry could make savings of 100 to
1000 times in resources and duration required compared to traditional laboratory scale
non systematic methods.
In order to further optimize a multi-step synthesis, the modelling should be combined
with an economical analysis. This would allow establishing priorities, and help deciding
between increasing the reaction rate at the expense of using an excess of one substrate as
was done in this work (Figure 6.4).
The interest of industry towards biocatalysis has been growing not only in the
pharmaceutical sector, but also in the production of chemicals and bulk products. The
majority of the biocatalytic industrial scale processes nowadays are performed with
single enzyme bioconversions due to its simplicity and high productivities. However, it
is expected that the biocatalysis of the future will integrate new complexities and
configurations such as in vivo de novo multi-step enzymatic systems. The methodologies
described in this thesis go some way toward helping better characterize and speed up the
development of such systems which are generally considered to be difficult to assemble,
characterize, and to operate productively at scale.
7.2. FUTURE WORK
The work in this thesis has demonstrated the applicability of microscale tools to design,
characterize and optimize in vivo multi-step enzymatic syntheses. Future work is
required to expand the microscale tools towards downstream and upstream processes.
Also further studies need to be done to enable better integration of these microscale
approaches with advances in protein engineering, data driven modelling, high-throughput
analytical technique and synthetic biology among others. A detailed list of future work
recommendations is shown below:

Chapter 7: Conclusions and Future Work
209
• Future studies are required in the integration of the results of the microscale
kinetics models, with the expansion of the TK and TAm libraries by protein engineering.
This would result in the development of enzymes variants, with superior catalytic
characteristics and improved selectivity, avoiding side reactions between the different
bioconversion steps.
• Taking advantage of the expansion of the TK and TAm library, further studies
with new substrates, especially with aromatic TK products, which have been shown to be
good substrates for ω-TAm, should be performed to produce a new set of high value
amino alcohols (Hailes et al., 2009).
• Future studies to expand the microscale toolbox towards the fermentation and
biocatalyst manipulation prior to bioconversion, as well as the analytical analysis and
downstream processing of the chiral compounds are necessary. In addition modelling of
those new operation units would enable the complete simulation of the bioprocess,
making the microscale toolbox a very powerful agent for the efficient process
development.
• Future automation studies of the microscale toolbox, including the previously
mentioned expanded areas, would allow taking advantage of the full potential of the
high-throughput nature of the tools.
• In order to take the full advantage of the determined kinetic parameters in
Chapter 4, future work is required to apply a systematic statistical methodology to
determine the optimum reaction conditions through simulations of the kinetic model .
• As was discussed in Section 4.3.7 and 6.3.4.1, the toxicity of the amino donor, as
well as consumption of the substrates and products by whole cell side reactions were
found to affect the quality of the modelling. Therefore new studies should be performed
to include those effects in the mathematical equations to increase the accuracy of the
predictions to a broader range of conditions.

Chapter 7: Conclusions and Future Work
210
• IPA showed a great potential as an amino donor for the synthesis of amino
alcohols (Figure 3.11, 3.12 and 6.6). Further studies to establish its kinetic parameters
are necessary. This would allow having more information to optimize the one-pot
synthesis of amino alcohols, like designing gradient fed-batch additions of IPA, which
would match the consumption of the amino donor by the enzyme as described in Section
6.3.3.
• As discussed in Section 4.4.3.6 the kinetic methodology to obtain the kinetic
parameters could be further simplified, eliminating the experimentally difficult step of
gathering reverse reaction data, which was shown to have a low impact in the modelling.
Genetic algorithms could be a robust tool to assist the establishment of the data driven
models.
• The level of TK and TAm expression could be controlled by manipulating the
fermentation temperature and induction time of the TAm (Figure 5.3). In order to have a
more accurate control of the co-expression, the TK could also be induced instead of
being constitutively expressed (Section 2.3.1). Therefore future studies using different
compatible methods of induction between the different enzymes are required.
• The final biomass concentration of whole cells containing the de novo pathway in
this work was 8.5 gDCW L-1 (Figure 5.4). Further studies need to be performed in order to
increase the final biomass concentration using fed-batch fermentation methods and
various feeding strategies.
• The key parameters affecting the scale up of the multi-step bioconversion to
preparative scale were established in Section 6.3.2 and 6.3.3. Future studies are
necessary to identify the crucial parameters that may affect the performance of the one-
pot syntheses at larger pilot plant scale.

Chapter 7: Conclusions and Future Work
211
• As was found in Section 3.3.6, the whole cell biocatalyst was selected because it
improved the stability of TAm. Further studies should be performed in immobilization
techniques, which can also improve the stability of the enzyme, while adding the benefit
of allowing the enzyme to be recycled and used in a continuous flow bioprocess.
• Studies including economical and environmental factors and constraints should
be included in the modelling of the process. This would allow the determination of real
optimum conditions that would be required in the manufacturing scale.

8. REFERENCES
Barrett T. A., A. Wu, H. Zhang, M. S. Levy, and G. J. Lye. 2010. Microwell engineering characterization for mammalian cell culture process development. Biotechnology and Bioengineering. 105:260-75.
Bernard A., and M. Payton. 2001. Fermentation and growth of Escherichia coli for optimal protein production. Current Protocols in Protein Science. Ed. Coligan J.E. New York USA.
Bhaskar G. 2004. A short stereoselective synthesis of (−) -chloramphenicol and (+)-thiamphenicol. Tetrahedron: Asymmetry. 15:1279-1283.
Boruwa J., J. C. Borah, S. Gogoi, and N. C. Barua. 2005. A short asymmetric total synthesis of chloramphenicol using a selectively protected 1,2-diol. Tetrahedron Letters. 46:1743-1746.
Bradford M. M. 1976. A rapid and sensitive method for the quantitation of microgram quantities of protein utilizing the principle of protein-dye binding. Analytical Biochemistry. 72:248-54.
Brazeau B. J., S. J. Gort, H. J. Jessen, A. J. Andrew, and H. H. Liao. 2006. Enzymatic activation of lysine 2,3-aminomutase from Porphyromonas gingivalis. Applied and Environmental Microbiology. 72:6402-4.
Breuer M., K. Ditrich, T. Habicher, B. Hauer, M. Kesseler, R. Stürmer, and T. Zelinski. 2004. Industrial methods for the production of optically active intermediates. Angewandte Chemie International Edition. 43:788-824.
Bruggink A., R. Schoevaart, and T. Kieboom. 2003. Concepts of nature in organic synthesis: cascade catalysis and multistep conversions in concert. Organic Process Research & Development. 7:622–640.
Brunhuber N. M., and J. S. Blanchard. 1994. The biochemistry and enzymology of amino acid dehydrogenases. Critical Reviews in Biochemistry and Molecular Biology. 29:415-467.
Bulos B., and P. Handler. 1965. Kinetics of beef heart glutamic-alanine transaminase. Journal of Biological Chemistry. 240:3283.

References
213
Burkart M. D. 2003. Metabolic engineering-a genetic toolbox for small molecule organic synthesis. Organic & Biomolecular Chemistry. 1:1-4.
Caligiuri A., P. D’Arrigo, T. Gefflaut, G. Molla, L. Pollegioni, E. Rosini, C. Rossi, and S. Servi. 2006. Multistep enzyme catalysed deracemisation of 2-naphthyl alanine. Biocatalysis and Biotransformation. 24:409-413.
Carter O. A., R. J. Peters, and R. Croteau. 2003. Monoterpene biosynthesis pathway construction in Escherichia coli. Phytochemistry. 64:425-433.
Chang T. M. S. 1988. Artificial Cells as Bioreactive Biomaterials. Journal of Biomaterials Applications. 3:116-125.
Chen B.H., M. Micheletti, F. Baganz, J.M. Woodley, and G.J. Lye. 2009. An efficient approach to bioconversion kinetic model generation based on automated microscale experimentation integrated with model driven experimental design. Chemical Engineering Science. 64:403-409.
Chen B. H., A. Sayar, U. Kaulmann, P. A. Dalby, J. M. Ward, and J. M. Woodley. 2006. Reaction modelling and simulation to assess the integrated use of transketolase and ω-transaminase for the synthesis of an aminotriol. Biocatalysis and Biotransformation. 24:449-457.
Chen B. H., E. G. Hibbert, P. A. Dalby, and J. M. Woodley. 2008. A new approach to bioconversion reaction kinetic parameter identification. American Institure of Chemical Engineers Journal. 54:2155–2163.
Chenault H. K., E. S. Simon, and G. M. Withesides. 1998. Cofactor regeneration for enzyme-catalysed synthesis. Biotechnology Genetic Engineering Reviews. 6:221:270.
Chi Y., S. T. Scroggins, and J. M. J. Fre. 2008. One-Pot Multi-Component Asymmetric Cascade Reactions Catalyzed by Soluble Star Polymers with Highly Branched Non-Interpenetrating Catalytic Cores. Journal of the American Chemical Society. 10:6322-6323.
Chotani G., T. Dodge, A Hsu, M. Kumar, R. LaDuca, D. Trimbur, W. Weyler, and K. Sanford. 2000. The commercial production of chemicals using pathway engineering. Biochimica et Biophysica Acta. 1543:434-455.
Chou I. C., and E. O. Voit. 2009. Recent developments in parameter estimation and structure identification of biochemical and genomic systems. Mathematical Biosciences. 219:57-83.

References
214
Cázares A., J. L. Galman, L. G. Crago, M. E. B. Smith, J. Strafford, L. Ríos-Solís, G. J. Lye, P. A. Dalby, and H. C. Hailes. 2010. Non-alpha-hydroxylated aldehydes with evolved transketolase enzymes. Organic & Biomolecular Chemistry. 8:1301-9.
Dalby P. A., F. Baganz, G. J. Lye, and J. M. Ward. 2009. Protein and pathway engineering in biocatalysis. Chimica Oggi. 27:18-21.
Doig S. D., S. C. R. Pickering, G. J. Lye, and J. M. Woodley. 2002. The use of microscale processing technologies for quantification of biocatalytic Baeyer-Villiger oxidation kinetics. Biotechnology and bBoengineering. 80:42-9.
Dowd J., and D.S. Riggs. 1965. A comparison of estimates of Michaelis-Menten kinetic constans from various linear methods. Journal of Biological Chemistry. 240:863-869
Eisenthal B. R., and Crosnish-Bowden A. 1974. Direct Linear plot-new graphical procedure for estimating enzyme kinetics-parameters. Biochemical Journal 139:715-720.
Ellis R. J., and D. D. Davies. 1961. Glutamic-oxaloacetic transaminase of cauliflower. 1. Purification and specificity. The Biochemical Journal. 78:615-23.
Fernandes P. 2010. Miniaturization in biocatalysis. International Journal of Molecular Sciences. 11:858-79.
Ferrer M., F. Martínez-Abarca, and P. N. Golyshin. 2005. Mining genomes and “metagenomes” for novel catalysts. Current Opinion in Biotechnology. 16:588-93.
Findrik Z. 2009. Overview on Reactions with Multi-enzyme Systems. Chemical and Biochemical Enginering Quarterly. 23:545-553.
Fotheringham I. G., N. Grinter, D. P. Pantaleone, R. F. Senkpeil, and P. P. Taylor. 1999. Engineering of a novel biochemical pathway for the biosynthesis of L-2-aminobutyric acid in Escherichia coli K12. Bioorganic and Medicinal Chemistry. 7:2209-13.
Fuhrmann U., E. Bause, G. Legler, and H. Ploegh. 1984. Novel mannosidase inhibitor blocking conversion of high mannose to complex oligosaccharides. Nature. 307:755-758.
Gernaey K. V., A. E. Lantz, P. Tufvesson, J. M. Woodley, and G. Sin. 2010. Application of mechanistic models to fermentation and biocatalysis for next-generation processes. Trends in Biotechnology. 28:346-54.
Guérard C., V. Alphand, A. Archelas, C. Demuynck, L. Hecquet, R. Furstoss, and J. Bolte. 1999. Transketolase-Mediated Synthesis of 4-Deoxy-D-fructose 6-Phosphate by Epoxide Hydrolase-Catalysed Resolution of 1,1-Diethoxy-3,4-epoxybutane. European Journal of Organic Chemistry. 3:3399:3402
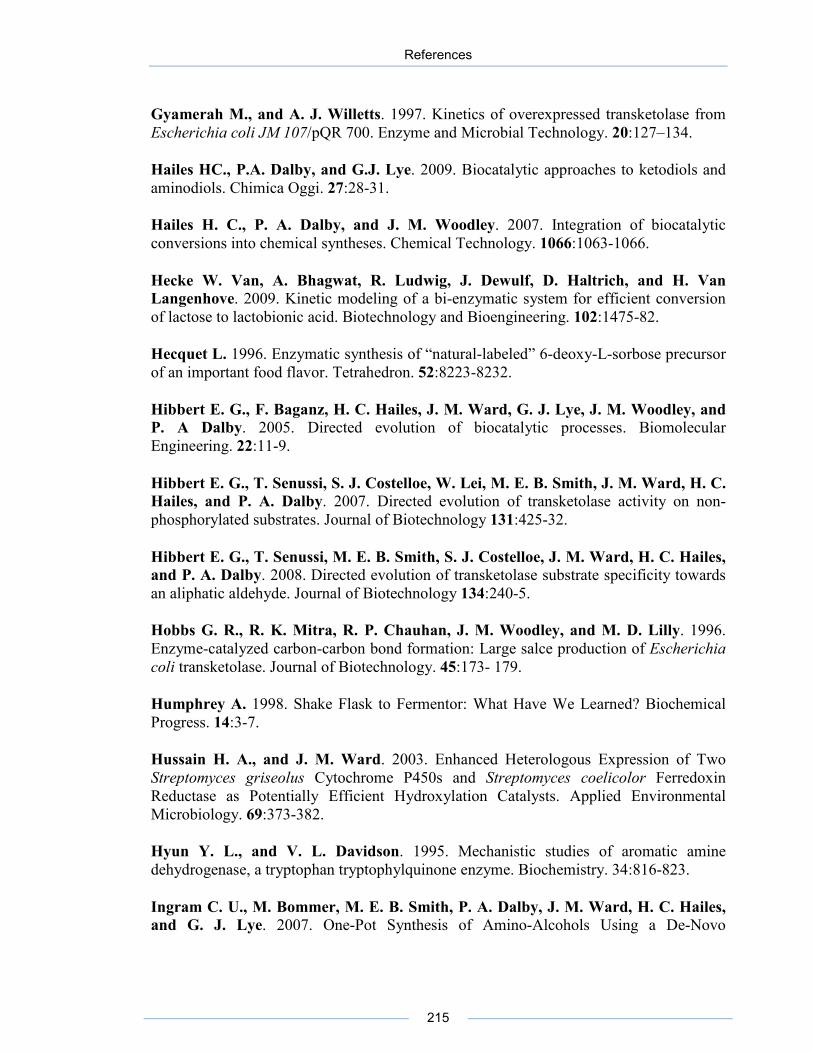
References
215
Gyamerah M., and A. J. Willetts. 1997. Kinetics of overexpressed transketolase from Escherichia coli JM 107/pQR 700. Enzyme and Microbial Technology. 20:127–134.
Hailes HC., P.A. Dalby, and G.J. Lye. 2009. Biocatalytic approaches to ketodiols and aminodiols. Chimica Oggi. 27:28-31.
Hailes H. C., P. A. Dalby, and J. M. Woodley. 2007. Integration of biocatalytic conversions into chemical syntheses. Chemical Technology. 1066:1063-1066.
Hecke W. Van, A. Bhagwat, R. Ludwig, J. Dewulf, D. Haltrich, and H. Van Langenhove. 2009. Kinetic modeling of a bi-enzymatic system for efficient conversion of lactose to lactobionic acid. Biotechnology and Bioengineering. 102:1475-82.
Hecquet L. 1996. Enzymatic synthesis of “natural-labeled” 6-deoxy-L-sorbose precursor of an important food flavor. Tetrahedron. 52:8223-8232.
Hibbert E. G., F. Baganz, H. C. Hailes, J. M. Ward, G. J. Lye, J. M. Woodley, and P. A Dalby. 2005. Directed evolution of biocatalytic processes. Biomolecular Engineering. 22:11-9.
Hibbert E. G., T. Senussi, S. J. Costelloe, W. Lei, M. E. B. Smith, J. M. Ward, H. C. Hailes, and P. A. Dalby. 2007. Directed evolution of transketolase activity on non-phosphorylated substrates. Journal of Biotechnology 131:425-32.
Hibbert E. G., T. Senussi, M. E. B. Smith, S. J. Costelloe, J. M. Ward, H. C. Hailes, and P. A. Dalby. 2008. Directed evolution of transketolase substrate specificity towards an aliphatic aldehyde. Journal of Biotechnology 134:240-5.
Hobbs G. R., R. K. Mitra, R. P. Chauhan, J. M. Woodley, and M. D. Lilly. 1996. Enzyme-catalyzed carbon-carbon bond formation: Large salce production of Escherichia coli transketolase. Journal of Biotechnology. 45:173- 179.
Humphrey A. 1998. Shake Flask to Fermentor: What Have We Learned? Biochemical Progress. 14:3-7.
Hussain H. A., and J. M. Ward. 2003. Enhanced Heterologous Expression of Two Streptomyces griseolus Cytochrome P450s and Streptomyces coelicolor Ferredoxin Reductase as Potentially Efficient Hydroxylation Catalysts. Applied Environmental Microbiology. 69:373-382.
Hyun Y. L., and V. L. Davidson. 1995. Mechanistic studies of aromatic amine dehydrogenase, a tryptophan tryptophylquinone enzyme. Biochemistry. 34:816-823.
Ingram C. U., M. Bommer, M. E. B. Smith, P. A. Dalby, J. M. Ward, H. C. Hailes, and G. J. Lye. 2007. One-Pot Synthesis of Amino-Alcohols Using a De-Novo

References
216
Transketolase and β-Alanine: Pyruvate Transaminase Pathway in Escherichia coli. Biotechnology and Bioengineering. 96:559-569.
Islam R. S., D. Tisi, M. S. Levy, and G. J. Lye. 2008. Scale-up of Escherichia coli growth and recombinant protein expression conditions from microwell to laboratory and pilot scale based on matched kLa. Biotechnology and Bioengineering. 99:1128-39.
Iwasaki A, Y. Yamada, N. Kizaki, Y. Ikenaka, and J. Hasegawa. 2006. Microbial synthesis of chiral amines by (R)-specific transamination with Arthrobacter sp. KNK168. Applied Microbiology and Biotechnology. 69:499-505.
Jiménez-González C., and J. M. Woodley. 2010. Bioprocesses: Modeling needs for process evaluation and sustainability assessment. Computers & Chemical Engineering. 34:1009-1017.
John A. J. 1995. Pyridoxal phosphate-dependent enzymes. Biochemical Biophysical Acta. 1248:81-96.
John G. T., and E. Heinzle. 2001. Quantitative Screening Method for Hydrolases in Microplates Using pH Indicators: Determination of Kinetic Parameters by Dynamic pH Monitoring. Biotechnology and Bioengineering. 7:621-627
Ju L., and G. G. Chase. 1992. Bioprocess Engineering Improved scale-up strategies of bioreactors. Bioprocess Engineering 8:49-53.
Junker B. H. 2004. Scale-up methodologies for Escherichia coli and yeast fermentation processes. Journal of Bioscience and Bioengineering. 97:347-64.
Kajiwara Y., P. J. Santander, C. A. Roessner, L. M. Pérez, and A. I. Scott. 2006. Genetically engineered synthesis and structural characterization of cobalt-precorrin 5A and -5B, two new intermediates on the anaerobic pathway to vitamin B12: definition of the roles of the CbiF and CbiG enzymes. Journal of the American Chemical Society. 128:9971-8.
Kalaitzakis D., and I. Smonou. 2010. A two-step, one-pot enzymatic synthesis of 2-substituted 1,3-diols. The journal of Organic Chemistry. 75:8658-61.
Kaldor S. W., V. J. Kalish, J. F. Davies, B. V. Shetty, J. E. Fritz, K. Appelt, J. a Burgess, K. M. Campanale, N. Y. Chirgadze, D. K. Clawson, B. a Dressman, S. D. Hatch, D. a Khalil, M. B. Kosa, P. P. Lubbehusen, M. a Muesing, a K. Patick, S. H. Reich, K. S. Su, and J. H. Tatlock. 1997. Viracept (nelfinavir mesylate, AG1343): a potent, orally bioavailable inhibitor of HIV-1 protease. Journal of Medicinal Chemistry. 40:3979-85.
References
217
Katare S., A Bhan, J. Caruthers, W. Delgass, and V. Venkatasubramanian. 2004. A hybrid genetic algorithm for efficient parameter estimation of large kinetic models. Computers and Chemical Engineering. 28:2569-2581.
Kaulmann U., K. Smithies, M.E.B. Smith, H.C. Hailes, and J.M. Ward. 2007. Substrate spectrum of ω-transaminase from Chromobacterium violaceum DSM30191 and its potential for biocatalysis. Enzyme and Microbial Technology. 41:628-637.
Koszelewski D., D. Clay, D. Rozzell, and W. Kroutil. 2009. Deracemisation of α-Chiral Primary Amines by a One-Pot, Two-Step Cascade Reaction Catalysed by ω-Transaminases. European Journal of Organic Chemistry. 2009:2289-2292.
Koszelewski D., M. Garitzer, D. Clay, B. Seisser, and W. Kroutil. 2010. Synthesis of Optically Active Amines Employing Recombinant ω-Transaminases in E. coli Cells. ChemCatChem. 2:73-77.
Koszelewski D., K. Tauber, K. Faber, and W. Kroutil. 2010. omega-Transaminases for the synthesis of non-racemic alpha-chiral primary amines. Trends in Biotechnology. 28:324-332.
Kwon S., and S. Ko. 2002. Synthesis of statine employing a general syn-amino alcohol building block. Tetrahedron Letters. 43:639-641.
König S., a Schellenberger, H. Neef, and G. Schneider. 1994. Specificity of coenzyme binding in thiamin diphosphate-dependent enzymes. Crystal structures of yeast transketolase in complex with analogs of thiamin diphosphate. The Journal of Biological Chemistry. 269:10879-82.
Lineweaver H., and D. Burk. 1934. The Determination of enzyme dissociation constants. Journal of American Chemistry Society. 56:658:666.
Law H. E. M., D. J. Lewis, I. McRobbie, and J. M. Woodley. 2008. Model visualization for evaluation of biocatalytic processes. Food and Bioproducts Processing. 86:96-103.
Lee K. H., J. H. Park, T. Y. Kim, H. U. Kim, and S. Y. Lee. 2007. Systems metabolic engineering of Escherichia coli for L-threonine production. Molecular Systems Biology. 3:149.
Lee S. Y. 1996. High cell-density culture of Escherichia coli. Trends in Biotechnology. 14:98-105.
Lee S. K., H. Chou, T. S. Ham, T. S. Lee, and J. D. Keasling. 2008. Metabolic engineering of microorganisms for biofuels production: from bugs to synthetic biology to fuels. Current Opinion in Biotechnology. 19:556-63.

References
218
Li C., L. G. Cao, Y. L. Wang, and E. F. Baril. 1993. Further purification and characterization of a multienzyme complex for DNA synthesis in human cells. Journal of Cellular Biochemistry. 53:405-19.
Li R., and C. A. Townsend. 2006. Rational strain improvement for enhanced clavulanic acid production by genetic engineering of the glycolytic pathway in Streptomyces clavuligerus. Metabolic Engineering. 8:240-52.
Lombardo M. E., L. S. Araujo, A. A. Juknat, and A. M. Batlle. 1989. Glutamate:4,5-dioxovaleric acid transaminase from Euglena gracilis. Kinetic studies. European Journal of Biochemistry. 182:657-60.
Lye G. J., P. Ayazi-shamlou, F. Baganz, P. A. Dalby, and J. M. Woodley. 2003. Accelerated design of bioconversion processes using automated microscale processing techniques. Trends in Biotechnology. 21:29-37.
Lye G. J., P. A. Dalby, and J. M. Woodley. 2002. Better Biocatalytic Processes Faster: New Tools for the Implementation of Biocatalysis in Organic Synthesis. Organic Process Research & Development. 6:434-440.
Macauley-Patrick S., M. L. Fazenda, B. McNeil, and L. M. Harvey. 2005. Heterologous protein production using the Pichia pastoris expression system. Yeast. 22:249-70.
Marco A. D, and V. D. Marco. 2004. Bacteria co-transformed with recombinant proteins and chaperones cloned in independent plasmids are suitable for expression tuning. Journal of Biotechnology. 109:45-52.
Markowski C. A, E. P. Markowski. 1990. Conditions for the Effectiveness of a Preliminary Test of Variance". The American Statistician 44: 322–326.
Marques M. P. C., S. Magalhães, J. M. S. Cabral, and P. Fernandes. 2009. Characterization of 24-well microtiter plate reactors for a complex multistep bioconversion: from sitosterol to androstenedione. Journal of Biotechnology. 141:174-80.
Martin C. H., D. R. Nielsen, K. V. Solomon, and K. L. J. Prather. (2009. Synthetic metabolism: engineering biology at the protein and pathway scales. Chemistry & Biology. 16:277-86.
Martinez-Torres R. J., J. Aucamp, R. George, and P. Dalby. 2007. Structural stability of E. coli transketolase to urea denaturation. Enzyme and Microbial Technology. 41:653-662.

References
219
Matosevic S., M. Micheletti, J. M. Woodley, G. J. Lye, and F. Baganz. 2008. Quantification of kinetics for enzyme-catalysed reactions: implications for diffusional limitations at the 10 ml scale. Biotechnology Letters. 30:995-1000.
Matosevic S. 2009. Design and characterisation of a prototype immobilised enzyme microreactor for the quantification of multi- step enzyme kinetics. PhD Thesis. University College London.
Matosevic S., N. Szita, and F. Baganz. 2011. Fundamentals and applications of immobilized microfluidic enzymatic reactors. Journal of Chemical Technology and Biotechnology. 86:325-334.
McArthur G. H., and S. S. Fong. 2010. Toward engineering synthetic microbial metabolism. Journal of biomedicine & biotechnology. Corporation 2010:459760.
Mehta P. K., and P. Christen. 1994. Homology of 1-aminocyclopropane-1-carboxylate synthase, 8-amino-7-oxononanoate synthase, 2-amino-6-caprolactam racemase, 2,2-dialkylglycine decarboxylase, glutamate-1-semialdehyde 2,1-aminomutase and isopenicillin-N-epimerase with aminotransferases. Biochemical and Biophysical Research Communications. 198:138-143
Mehta P. K., T. I. Hale, and P. Christen. 1993. Aminotransferases: demonstration of homology and division into evolutionary subgroups. European Journal of Biochemistry. 214:549-61.
Meyer A., R. Pellaux, and S. Panke. 2007. Bioengineering novel in vitro metabolic pathways using synthetic biology. Current Opinion in Microbiology. 10:246-53.
Micheletti M., T. Barrett, S.D. Doig, F. Baganz, M.S. Levy, J.M. Woodley, and G.J. Lye. 2006. Fluid mixing in shaken bioreactors: Implications for scale-up predictions from microlitre-scale microbial and mammalian cell cultures. Chemical Engineering Science. 61:2939-2949.
Micheletti M., and G. J. Lye. 2006. Microscale bioprocess optimisation. Current Opinion in Biotechnology. 17:611-8.
Mitra R. K., and J. M. Woodley. 1996. A useful assay for transketolase in asymmetric syntheses. Biotechnology Techniques. 10:167-172.
Monache G. D., and G. Zappia. 1999. A stereocontrolled synthesis of (-)- detoxinine from L -ascorbic acid. Tetrahedron: Asymmetry 10:2961-2973.
Morbiducci U., A. Tura, and M. Grigioni. 2005. Genetic algorithms for parameter estimation in mathematical modeling of glucose metabolism. Computers in Biology and Medicine. 35:862-74.

References
220
Moros R., H. Kalies, H. Rex, and S. Schaffarczyk. 1996. A genetic algorithm for generating initial parameter estimations for kinetic models of catalytic processes. Computers & Chemical Engineering. 20:1257–1270.
Morris K. G., M. E. B. Smith, D. Turner Malcolm, J. Nicholas, and others. 1996. Transketolase from Escherichia coli: A practical procedure for using the biocatalyst for asymmetric carbon-carbon bond synthesis. Tetrahedron: Asymmetry. 7:2185–2188.
Muller Y. A., Y. Lindqvist, W. Furey, G. E. Schulz, F. Jordan, and G. Schneider. 1993. A thiamin diphosphate binding fold revealed by comparison of the crystal structures of transketolase, pyruvate oxidase and pyruvate decarboxylase. Structure. 1:95-103.
Murzin D. 2008. Sustainable chemical technology through catalytic multistep reactions. Chemical Engineering Research and Design. 86:1002-1010.
Nealon A. J., R. D. O. Okennedy, N. J. Titchener-Hooker, and G.J. Lye. 2006. Quantification and prediction of jet macro-mixing times in static microwell plates. Chemical Engineering Science. 61:4860-4870.
Niu W., M. N. Molefe, and J. W. Frost. 2003. Microbial Synthesis of the Energetic Material Precursor 1 , 2 , 4-Butanetriol. Biochemistry. 125:12998-12999.
Payne M. S., K. L. Petrillo, J. E. Gavagan, R. DiCosimo, L. W. Wagner, and D. L. Anton. 1997. Engineering Pichia pastoris for biocatalysis: co-production of two active enzymes. Gene. 194:179-82.
Pfeifer B. A. 2001. Biosynthesis of Polyketides in Heterologous Hosts. Microbiology and Molecular Biology Reviews. 65:106-118.
Pohl M., G. A Sprenger, and M. Müller. 2004. A new perspective on thiamine catalysis. Current Opinion in Biotechnology. 15:335-42.
Pollard D. J., and J. M. Woodley. 2007. Biocatalysis for pharmaceutical intermediates: the future is now. Trends in Biotechnology. 25:66-73.
Prather K. L. J., and C. H. Martin. 2008. De novo biosynthetic pathways: rational design of microbial chemical factories. Current Opinion in Biotechnology. 19:468-74.
Pósfai G., G. Plunkett, T. Fehér, D. Frisch, G. M. Keil, K. Umenhoffer, V. Kolisnychenko, B. Stahl, S. S. Sharma, M. de Arruda, V. Burland, S. W. Harcum, and F. R. Blattner. 2006. Emergent properties of reduced-genome Escherichia coli. Science. 312:1044-6.

References
221
Ranaldi F. 1999. What students must know about the determination of enzyme kinetic parameters. Biochemical Education. 27:87-91.
Reisman H. B. 1993. Problems in scale-up of biotechnology production processes. Critical Reviews in Biotechnology. 13:195-253.
Roessner C. A, and A I. Scott. 1996a. Achieving natural product synthesis and diversity via catalytic networking ex vivo. Chemistry & Biology 3:325-30.
Roessner C. A, and A I. Scott. 1996b. Genetically engineered synthesis of natural products: from alkaloids to corrins. Annual Review of Microbiology 50:467-90.
Roessner C. A., J. Spencer, N. Stolowich, J. Wang, G. Nayar, P. Santander, C. Pichon, C. Min, M. Holderman, and A. I. Scott. 1994. Genetically engineered synthesis of precorrin-6x and the complete corrinoid, hydrogenobyrinic acid, an advanced precursor of vitamin B12. Chemistry & Biology. 1:119.
Rokem J. S., A. E. Lantz, and J. Nielsen. 2007. Systems biology of antibiotic production by microorganisms. Natural Product Reports. 24:1262-87.
Rozwadoska M. D. 1993. An efficient synthesis of S-(+)-amphetamine. Tetrahedron: Asymmetry.4:1619-1624.
Rozzell J. D. 1999. Commercial scale biocatalysis: myths and realities. Bioorganic and Medicinal Chemistry. 7:2253-61.
Römisch W., W. Eisenreich, G. Richter, and A. Bacher. 2002. Rapid one-pot synthesis of riboflavin isotopomers. The Journal of Organic Chemistry. 67:8890-4.
Santacoloma P., G. Sin, K. Gernaey, and J. M. Woodley. 2011. Multienzyme-catalyzed processes: Next-generation biocatalysis. Organic Process. 203-212.
Sayar N. A, B. H. Chen, G. J. Lye, and J. M. Woodley. 2009. Process modelling and simulation of a transketolase mediated reaction: Analysis of alternative modes of operation. Biochemical Engineering Journal. 47:10-18.
Sayer C., M. N. Isupov, and J. A Littlechild. 2007. Crystallization and preliminary X-ray diffraction analysis of omega-amino acid:pyruvate transaminase from Chromobacterium violaceum. Acta crystallographica. Section F, Structural Biology and Crystallization Communications. 63:117-9.
Schenk G., R. G. Duggleby, and P. F. Nixon. 1998. Properties and functions of the thiamin diphosphate dependent enzyme transketolase. The International Journal of Biochemistry and Cell Biology. 30:1297-318.

References
222
Schilling C. H., S. Schuster, B. O. Palsson, and R. Heinrich. 1999. Metabolic pathway analysis: basic concepts and scientific applications in the post-genomic era. Biotechnology Progress. 15:296-303.
Schmid A, J. S. Dordick, B. Hauer, a Kiener, M. Wubbolts, and B. Witholt. 2001. Industrial biocatalysis today and tomorrow. Nature. 409:258-68.
Schoevaart R., F. V. Rantwijk, and R. A. Sheldon. 2000. A Four-Step Enzymatic Cascade for the One-Pot Synthesis of Non-natural Carbohydrates from Glycerol. Journal of Organic Chemistry. 65:6940-6943.
Schomburg I., A. Chang, C. Ebeling, M. Gremse, C. Heldt, G. Huhn, and D. Schomburg. 2004. BRENDA, the enzyme database: updates and major new developments. Nucleic Acids Research. 32:D431-3.
Schultheisz H. L., B. R. Szymczyna, L. G. Scott, and J. R. Williamson. 2008. Pathway engineered enzymatic de novo purine nucleotide synthesis. ACS Chemical Biology. 3:499-511.
Scott A. I. 1994. Towards a total, genetically engineered synthesis of vitamin b12. Synlett. 26:871-874.
Sheldon R. A. 2008. Enzyme-Catalysed Cascade Reactions, in Ed. Garcia-Junceda E. (Ed). Multi-step Enzyme Catalysis: Biotransformations and Chemoenzymatic Synthesis. Wiley-VCH Verlag GmbH and Co. KGaA , Weinheim, Germany. pp 109-135
Sheldon R. A. 2007. Enzyme Immobilization: The Quest for Optimum Performance. Advanced Synthesis and Catalysis. 349:1289-1307.
Shiloach J., and R. Fass. 2005. Growing E. coli to high cell density--a historical perspective on method development. Biotechnology Advances. 23:345-57.
Shin J. S., and B. G. Kim. 2001. Comparison of the omega-transaminases from different microorganisms and application to production of chiral amines. Bioscience, Biotechnology and Biochemistry. 65:1782-1788.
Shin J. S., and B. G. Kim. 1997. Kinetic resolution of alpha-methylbenzylamine with omicron-transaminase screened from soil microorganisms: application of a biphasic system to overcome product inhibition. Biotechnology and Bioengineering. 55:348-58.
Shin J. S., B. G. Kim, A Liese, and C. Wandrey. 2001. Kinetic resolution of chiral amines with omega-transaminase using an enzyme-membrane reactor. Biotechnology and Bioengineering. 73:179-87.

References
223
Shin J. S., H. Yun, J.-W. Jang, I. Park, and B.-G. Kim. 2003. Purification, characterization, and molecular cloning of a novel amine:pyruvate transaminase from Vibrio fluvialis JS17. Applied Microbiology and Biotechnology. 61:463-71.
Shin J.-S., and B.-G. Kim. 2002. Exploring the active site of amine:pyruvate aminotransferase on the basis of the substrate structure-reactivity relationship: how the enzyme controls substrate specificity and stereoselectivity. The Journal of Organic Chemistry. 67:2848-2853.
Shin J.-S., and B.-G. Kim. 1998. Kinetic Modeling of ω-Transamination for Enzymatic Kinetic Resolution of a-Methylbenzylamine. Biotechnology and Bioengineering. 60:534-540.
Shin J. S., and B. G. Kim. 1999. Asymmetric Synthesis of Chiral Amines With ω-Transaminase. Biotechnology and Bioengineering. 65:206-211.
Shin J. S., and B. G. Kim. (1999). Modeling of the kinetic resolution of α-methylbenzylamine with ω-transaminase in a two-liquid-phase system. Enzyme and Microbial Technology. 25:426 - 432.
Sin G., J. M. Woodley, and K. V. Gernaey. 2009. Application of modeling and simulation tools for the evaluation of biocatalytic processes: a future perspective. Biotechnology Progress. 25:1529-38.
Smal J., and P. De Meyts. 1989. Sphingosine, an inhibitor of protein kinase C, suppresses the insulin-like effects of growth hormone in rat adipocytes. Proceedings of the National Academy of Sciences of the United States of America. 86:4705-9.
Smith M. A., P. J. King, and B. Grimm. 1998. Transient-state kinetic analysis of Synechococcus glutamate 1-semialdehyde aminotransferase. Biochemistry. 37:319-29.
Smith M. E. B., B. H. Chen, E. G. Hibbert, U. Kaulmann, K. Smithies, J. L. Galman, F. Baganz, P. A. Dalby, H. C. Hailes, G. J. Lye, J. M. Ward, J. M. Woodley, and M. Micheletti. 2010. A Multidisciplinary Approach Toward the Rapid and Preparative-Scale Biocatalytic Synthesis of Chiral Amino Alcohols: A Concise Transketolase-/ω-Transaminase-Mediated Synthesis of (2 S ,3 S )-2-Aminopentane-1,3-diol. Organic Process Research & Development. 14:99-107.
Smith M. E. B., E. G. Hibbert, A. B. Jones, P. A. Dalby, and H. C. Hailes. 2008. Enhancing and Reversing the Stereoselectivity of Escherichia coli Transketolase via Single-Point Mutations. Advanced Synthesis & Catalysis. 350:2631-2638.

References
224
Sprenger G. A, U. Schörken, G. Sprenger, and H. Sahm. 1995. Transketolase A of Escherichia coli K12. Purification and properties of the enzyme from recombinant strains. European Journal of Biochemistry. 230:525-32.
Sprenger G. A. 2007. From scratch to value: engineering Escherichia coli wild type cells to the production of L-phenylalanine and other fine chemicals derived from chorismate. Applied Microbiology and Biotechnology. 75:739-49.
Sprenger G. a, and M. Pohl. 1999. Synthetic potential of thiamin diphosphate-dependent enzymes. Journal of Molecular Catalysis B: Enzymatic 6:145-159.
Stewart J. D. 2001. Dehydrogenases and transaminases in asymmetric synthesis. CurrentOopinion in Chemical Biology. 5:120-9.
Stitt M., C. Muller, M. Petra, Y. Gibon, P. Carillo, R. Morcuenda. W.R. Scheible, and K. Anee. 2001. Steps towards an integrated view of nitrogen metabolism. Journal of Experimental Botany. 370-959-970.
Straathof A. J. J., S. Panke, and A. Schmid. 2002. The production of fine chemicals by biotransformations. Current Opinion in Biotechnology. 13:548-56.
Taylor P. P., D. P. Pantaleone, R. F. Senkpeil, and I. G. Fotheringham. 1998. Novel biosynthetic approaches to the production of unnatural amino acids using transaminases. Trends in Biotechnology. 16:412-8.
Thiry M., and D. Cingolani. 2002. Optimizing scale-up fermentation processes. Trends in Biotechnology. 20:103-5.
Tolia N. H., and L. Joshua-Tor. 2006. Strategies for protein coexpression in Escherichia coli. Nature Methods. 3:55-64.
Truppo M. D., J. D. Rozzell, J. C. Moore, and N. J. Turner. 2009. Rapid screening and scale-up of transaminase catalysed reactions. Organic & Biomolecular Chemistry. 7:395-8.
Truppo M. D., J. D. Rozzell, and N. J. Turner. 2010. Efficient Production of Enantiomerically Pure Chiral Amines at Concentrations of 50 g/L Using Transaminases. Organic Process Research and Development. 14:234-237.
Tufvesson P., W. Fu, J. S. Jensen, and J. M. Woodley. 2010. Process considerations for the scale-up and implementation of biocatalysis. Food and Bioproducts Processing. 88:3-11.

References
225
Tufvesson P., J. Lima-Ramos, J. S. Jensen, N. Al-Haque, W. Neto, and J. M. Woodley. 2011. Process considerations for the asymmetric synthesis of chiral amines using transaminases. Biotechnology and Bioengineering. 108:1479-1493.
Turner N. J. 2000. Applications of transketolases in organic synthesis. Current Opinion in Biotechnology. 11:527-531.
Tyo K. E., H. S. Alper, and G. N. Stephanopoulos. 2007. Expanding the metabolic engineering toolbox: more options to engineer cells. Trends in Biotechnology. 25:132-7.
Votruba J., and M. Sobotka. 1992. Physiological similarity and bioreactor scale-up. Folia Microbiologica. 37:331-345.
Watson J. D. 1972. Molecular Biology of the Gene, 2nd ed. Saunders, Philadelphia, PA USA..
Werpy T., and Petersen G. 2004. Top Value Added Chemicals from Biomass Volume I: Results of Screening for Potential Candidates from Sugars and Synthesis. Oak Ridge, TN:US. Department of Energy.
Whitesides G., and C. Wong. 1985. Enzymes as Catalysts in Synthetic Organic Chemistry. Chemie International Edition in English. 24:617-638
Wikner C., U. Nilsson, L. Meshalkina, C. Udekwu, Y. Lindqvist, and G. Schneider. 1997. Identification of catalytically important residues in yeast transketolase. Biochemistry. 36:15643-9.
Wilkinson B., and B. O. Bachmann. 2006. Biocatalysis in pharmaceutical preparation and alteration. Current Opinion in Chemical Biology. 10:169-76.
Wong C. H., S. L. Hagnie, and G. M. Whitesides. 1982. Enzyme-Catalyzed Synthesis of N-Acetyllactosamine with in Situ Regeneration of Uridine 5’-Diphosphate Glucose and Uridine 5'-Diphosphate Galactose. Chemical Communications. 47:5416-5418.
Woodley J. M. 2006. Choice of biocatalyst form for scalable processes. Biochemical Society Transactions. 34:301-3.
Woodley J. M. 2008. New opportunities for biocatalysis: making pharmaceutical processes greener. Trends in Biotechnology. 26:321-7.
Wu C. H., R. Apweiler, A. Bairoch, D. A. Natale, W. C. Barker, B. Boeckmann, S. Ferro, E. Gasteiger, H. Huang, R. Lopez, M. Magrane, M. J. Martin, R. Mazumder, C. O’Donovan, N. Redaschi, and B. Suzek. 2006. The Universal Protein Resource (UniProt): an expanding universe of protein information. Nucleic Acids Research. 34:187-191.
References
226
Yazbeck D. R., C. A Martinez, S. Hu, and J. Tao. 2004. Challenges in the development of an efficient enzymatic process in the pharmaceutical industry. Tetrahedron: Asymmetry. 15:2757-2763.
Young T. B. 1979. Fermentation scale-up: industrial experience with a total environmental approach. Biochemical Engineering. 326:165-180..
Yun H., B.-K. Cho, and B.G. Kim. 2004. Kinetic resolution of (R,S)-sec-butylamine using omega-transaminase from Vibrio fluvialis JS17 under reduced pressure. Biotechnology and Bioengineering. 87:772-8.
Yun H., and B.-G. Kim. 2008. Asymmetric Synthesis of (S)-α-Methylbenzylamine by Recombinant Escherichia coli Co-Expressing Omega-Transaminase and Acetolactate Synthase. Bioscience, Biotechnology, and Biochemistry 72:3030-3033.
Yun H., S. Lim, B.-kwan Cho, and B.G. Kim. 2004. ω-Amino Acid: Pyruvate Transaminase from Alcaligenes denitrificans Y2k-2: a New Catalyst for Kinetic Resolution of β-Amino Acids and Amines. Applied and Environmental Microbiology 70:2529-2534.
Zhang H., S. R. Lamping, S. C. R. Pickering, G. J. Lye, and P. A. Shamlou. 2008. Engineering characterization of a single well from 24-well and 96-well microtitre plates. Biochemical Engineering. 40:138:149
Zhang K., M. R. Sawaya, D. S. Eisenberg, and J. C. Liao. 2008. Expanding metabolism for biosynthesis of nonnatural alcohols. Proceedings of the Academy of Science of United States of America. 105:20658-20658.
Zimmermann F. T., A. Schneider, U. Schörken, and A. Sprenger. 1999. Efficient multi-enzymatic synthesis of D -xylulose 5-phosphate. Science. 6:4-7.

227
APPENDIX I
CALIBRATION PLOT OF BIOMASS IN FUNCTION OF OD600
Figure A.I. 1. Calibration graph of biomass in gDCW L-1 as a function of OD600 (Section 2.9.2).
y = 0.402x - 0.042R² = 0.996
0
1
2
3
4
5
6
7
8
9
10
0 5 10 15 20 25
Biom
ass
conc
entr
atio
n (g
dcw
L-1)
OD600

228
APPENDIX II
BRADFORD ASSAY: CALIBRATION PLOT OF BSA CONCENTRATION IN
FUNCTION OF OD595
Figure A.II. 1. Standard graph for Bradford assay of BSA concentration as a function of
OD595 (Section 2.9.3).
y = 3.392x - 0.039R² = 0.979
0
0.5
1
1.5
2
2.5
0 0.1 0.2 0.3 0.4 0.5 0.6 0.7
Conc
enta
tion
mg
ml-1
OD595

APPENDIX III
HPLC STANDARD CALIBRATIONS
Figure A.III. 1. Calibration graph of ERY and HPA concentration as a function of HPLC
area (Section 2.9.6).
y = 9.29E-06x + 7.13E-02R² = 1.00E+00
y = 4.77E-06x + 9.57E-03R² = 9.99E-01
0
2
4
6
8
10
12
14
16
18
0 1000000 2000000 3000000 4000000
Con
cent
ratio
n / m
M
HPLC area
HPA
ERY

Appendix III
230
Figure A.III. 2. Calibration graph of derivatized ABT concentration as a function of HPLC area (Section 2.96).
y = 0.004x - 0.003R² = 0.970
0
0.01
0.02
0.03
0.04
0.05
0.06
0.07
0.08
0.09
0.1
0 5 10 15 20 25
Con
cent
ratio
n / m
M
Area HPLC
APPENDIX IV
TK KINETIC COMPARISON IN WHOLE CELL AND LYSATE FORM
Figure A.IV. 1. ERY production by TK wild type lysate and whole cell at 25oC. Reaction has
been performed at 25oC with 0.1 mg ml-1 of TK in lysate and whole cell form. [HPA] and [GA]
were 50 mM in 50 mM TRIS buffer pH 7. Results show the mean of 2 duplicates.
0
2
4
6
8
10
12
14
16
18
20
0.00 10.00 20.00 30.00 40.00 50.00 60.00 70.00
Conc
entr
atio
n (m
M)
Time (min)
Lysate
Whole cell

Appendix IV
232
Figure A.IV. 2. Progress curves of the synthesis of ERY at 25oC with TK in lysate and whole
cell form. [GA] and [HPA] were 50 mM. Enzyme concentration was 0.1 mg/ml , pH 7.0 with 50
mM TRIS
0
5
10
15
20
25
30
35
0 20 40 60 80 100 120 140
Conc
entr
atio
n (m
M)
TIme (min)
Whole cells 1
Lysate 2
Lysates 1
Whole cell 2

APPENDIX V
MATLAB PROGRAM FOR KINETIC PARAMETER ESTIMATION
function ParaEst close all clear all format bank; % Intial setup NumDataSet = 15; % Number of progress curves NumSample(1:NumDataSet) = [12 12 12 12 12 12 12 12 12 12 12 12 12 12 12]; %NumSample(1:NumDataSet) = [6 6 6 8 8 8 8 11 11 11 11 11 11 11 11 11 11 11]; % Number of sampling points for each progress curve Data_Filename1 = 'InhibitionCurve'; % Data file for Inhibition data Data_Filename2 = 'P3'; % Data file for progress curves Result_File = 'Result'; % Result file % Call the programmes in the software Result_Filename = strcat(Result_File,'.xls'); [Theta0, Theta] = PE3(NumDataSet,NumSample,Data_Filename1,Data_Filename2,Result_Filename)

Appendix V
234
'Kf(1/min), KERY(mM), KMBA(mM), Kr(mM), KAP(mM), KEAT(mM), KdeMBA(mM), KiMBA(mM), KiAP(mM)' StringTitle = {'Kf(1/min)','KERY(mM)','KMBA(mM)','Kr(mM)','KAP(mM)','KEAT(mM)','KdeMBA(mM)','KiMBA(mM)','KiAP(mM)'; ... Theta(1) Theta(2) Theta(3) Theta(4) Theta(5) Theta(6),Theta(7),Theta(8), Theta(9)}; String1 = {'Initial'}; String2 = {'Final'}; xlswrite(Result_Filename, StringTitle,'Parameters','D4'); xlswrite(Result_Filename, String1,'Parameters','C5'); xlswrite(Result_Filename, String2,'Parameters','C6'); xlswrite(Result_Filename, Theta0,'Parameters','D5'); xlswrite(Result_Filename, Theta, 'Parameters','D6');
function Theta = PE1(Data_Filename) % Finding preliminary Kcat ka Kb in TK kinetics with initial rate data % Intial setup % Parameter Estimation Theta0 = [1 1 1]; % Initial values for Kcat, Ka and Kb LB = [0.01 0.001 0.001]; % Lower bound UB = [80000 50000 50000]; % upper bound % Read experimental data Data = xlsread(Data_Filename); CHPA = Data(:,1); %IN our Cases HPA is ERY CGA = Data(:,2); %IN our Cases GA is MBA Rate = Data(:,3); Ei = Data(1,4); [NumSample,n11] = size(CHPA); % options group for different optimisers

Appendix V
235
foptions = optimset('MaxIter',200000,'TolFun',1e-9); [Theta,Func]= ... fmincon(@(x) ObjFunc(x,CHPA,CGA,Rate,Ei,NumSample), ... Theta0,[],[],[],[],LB,UB,[],foptions) % ======== Objective Function ======== function Func = ObjFunc(C,CHPA,CGA,RateE,Ei,NumSample) % Objective function called by the main % DON'T change it A = 0.0; for I = 1:NumSample y = [CHPA(I) CGA(I)]; RateC(I)= Kinetics(y,C,Ei); A = A + (RateC(I)-RateE(I))^2; end % for I Func = A; % ======== Kinetics Model ======== function R = Kinetics(y,Para,Ei) % Simplified (no inhibition terms) kinetic model Kcat = Para(1); % Rate constant [1/min] Ka = Para(2); % Michaelis constant of ERY [mM] Kb = Para(3); % Michaelis constant of MBA [mM] % y(1) -- ERY concentration % y(2) -- MBA concentration Vmax = Kcat*Ei; V = Kb*y(1)+Ka*y(2)+y(1)*y(2); R = Vmax*y(1)*y(2)/V;
function [Theta,tspa] = PE2(NumDataSet,NumSample,NumPara,RatePara,Data_Filename) format short eng

Appendix V
236
counter =1 % Read experimental data Data = xlsread(Data_Filename); for I = 1:NumDataSet for J = 1:NumSample(I) Ei(I,J) = Data(counter,5); Time(I,J) = Data(counter,1); CHPA(I,J) = Data(counter,2); CGA(I,J) = Data(counter,3); CERY(I,J) = Data(counter,4); CEAT (I,J)= Data(counter,6); counter = counter+1; end end Lstep = 1; for I = 1:NumDataSet tspa(I) = Time(I,NumSample(I)); end % Initial values for parameters Theta0(1:2) = [0.1 0.1] LB(1:2) = [0.00001 0.0001]; UB(1:2) = [800 800] ; % Finding optimum parameters options = optimset('Display','iter','MaxFunEvals',1000000,'MaxIter', 1000,'tolx',10E-19,'tolfun', 10E-19,'TolCon',10E-19); [Theta,Func]= ... fmincon(@(x) ObjFunc(x,Time,CHPA,CGA,CERY,Ei,CEAT,tspa,NumDataSet,NumSample,RatePara), ... Theta0,[],[],[],[],LB,UB,[],options) % ================== Objective Function ================== function Func = ObjFunc(C,Time,CHPA,CGA,CERY,Ei,CEAT,tspa,NumDataSet,NumSample,RatePara) % Objective function called by the main % DON'T change it format short eng Lstep = 1;
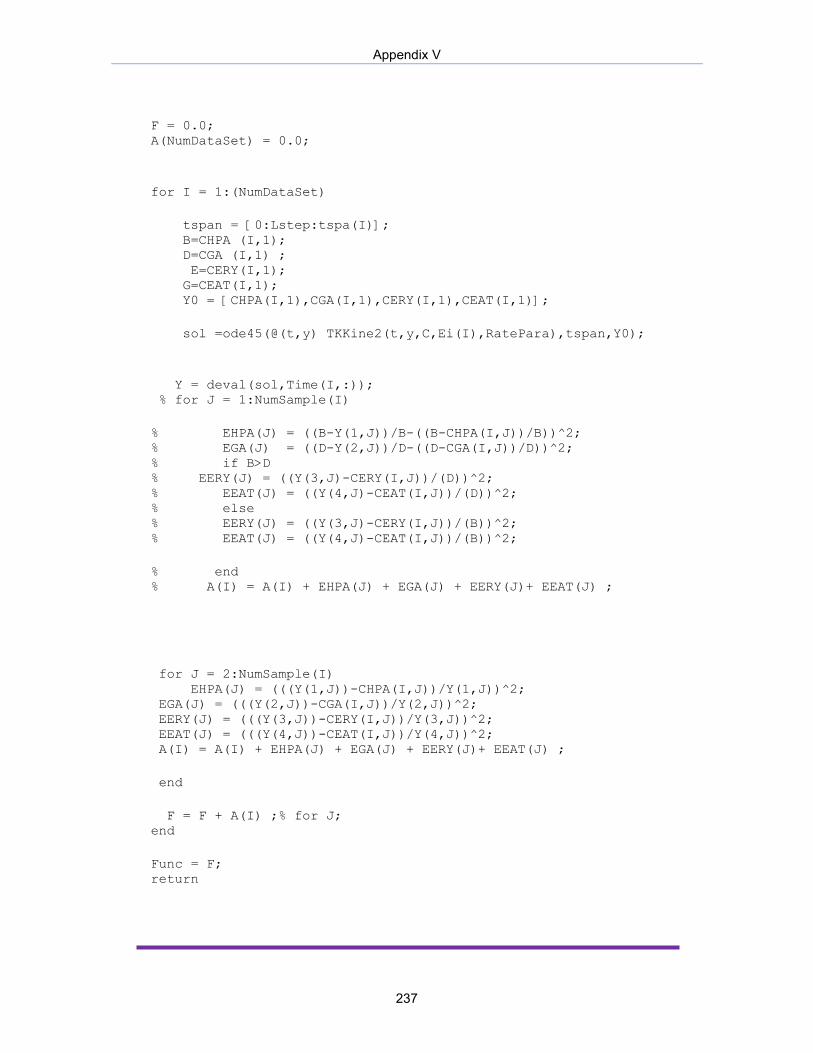
Appendix V
237
F = 0.0; A(NumDataSet) = 0.0; for I = 1:(NumDataSet) tspan = [0:Lstep:tspa(I)]; B=CHPA (I,1); D=CGA (I,1) ; E=CERY(I,1); G=CEAT(I,1); Y0 = [CHPA(I,1),CGA(I,1),CERY(I,1),CEAT(I,1)]; sol =ode45(@(t,y) TKKine2(t,y,C,Ei(I),RatePara),tspan,Y0); Y = deval(sol,Time(I,:)); % for J = 1:NumSample(I) % EHPA(J) = ((B-Y(1,J))/B-((B-CHPA(I,J))/B))^2; % EGA(J) = ((D-Y(2,J))/D-((D-CGA(I,J))/D))^2; % if B>D % EERY(J) = ((Y(3,J)-CERY(I,J))/(D))^2; % EEAT(J) = ((Y(4,J)-CEAT(I,J))/(D))^2; % else % EERY(J) = ((Y(3,J)-CERY(I,J))/(B))^2; % EEAT(J) = ((Y(4,J)-CEAT(I,J))/(B))^2; % end % A(I) = A(I) + EHPA(J) + EGA(J) + EERY(J)+ EEAT(J) ; for J = 2:NumSample(I) EHPA(J) = (((Y(1,J))-CHPA(I,J))/Y(1,J))^2; EGA(J) = (((Y(2,J))-CGA(I,J))/Y(2,J))^2; EERY(J) = (((Y(3,J))-CERY(I,J))/Y(3,J))^2; EEAT(J) = (((Y(4,J))-CEAT(I,J))/Y(4,J))^2; A(I) = A(I) + EHPA(J) + EGA(J) + EERY(J)+ EEAT(J) ; end F = F + A(I) ;% for J; end Func = F; return

Appendix V
238
% ======== Kinetics Model ======== function dy = TKKine2(t,y,RC,Ei,RatePara) % PingPong Bi-Bi mechanism for reaction: kf = RatePara(1); % Rate constant [1/min] KmA = RatePara(2); % Michaelis constant of ERY [mM] KmB = RatePara(3); % Michaelis constant of MBA [mM] kr=RatePara(4); KmP=RatePara(5); KmQ = RatePara(6); KiBs = RatePara (7); KiB = RC(1); KiQ= RC(2); %KiQ = (kf/kr)*(kf/kr)*KmQ*KmP*KiB*KiA/(KmB*KmA*KiP); [M,N]=size(y); RealZero = 1.0e-18; for I = 1:M if (y(I) <= RealZero) y(I) = RealZero; end end dy = zeros(M,1); KEQ = (kf/kr)*(kf/kr)*KmP*KmQ/(KmA*KmB); d3=(kf*Ei*kr*Ei*(y(1)*y(2)-(y(3)*y(4))/(KEQ)))/(kr*Ei*KmB*y(1)+kr*Ei*KmA*y(2)+kr*Ei*y(1)*y(2)+kf*Ei*KmP*y(4)/(KEQ)+kf*Ei*KmQ*y(3)/(KEQ)+... kf*Ei*y(3)*y(4)/(KEQ)+kr*Ei*KmB*y(1)*y(4)/KiQ +kf*Ei*KmQ*y(2)*y(3)/(KEQ*KiB)... +kr*Ei*KmA*y(2)*y(2)/(KiBs*KEQ)+kf*Ei*KmP*y(2)*y(4)/(KiBs)); %last line contains the extra terms for the model with substrate inhibition dy(1) =- d3; dy(2) = -d3; dy(3) = d3; dy(4) = d3; return

Appendix V
239
function [Theta0, Theta] = PE3(NumDataSet,NumSample, ... Data_Filename1,Data_Filename2,Result_Filename) format short eng % Intial setup NumPara2 = 2; % Number of parameter to be estimated (for Ki) NumPara3 = 9; % Number of parameter to be estimated (for complete model) NumComponent = 4; % Number of Reaction component, here is HPA, GA, ERY %n=0 %for P = 0.1:0.5:10 %n=n+1 Theta1 = PE1(Data_Filename1); RatePara = Theta1; [Theta2,tspa] = PE2(NumDataSet,NumSample,NumPara2,RatePara,Data_Filename2) Theta0 = double(([Theta1 Theta2])) KEQ= Theta0(1)/Theta0(4)*Theta0(1)/Theta0(4)*Theta0(5)*Theta0(6)/(Theta0(2)*Theta0(3)) KiERY= Theta0(1)*Theta0(5)*Theta0(9)/(KEQ*Theta0(4)*Theta0(3)) KiAP=KEQ*Theta0(4)*Theta0(2)*Theta0(8)/(Theta0(1)*Theta0(6)) K1=Theta0(8)/KiAP K2=Theta0(9)/KiERY Lstep = 1 % Read experimental data Data = xlsread(Data_Filename2); counter =1; for I = 1:NumDataSet for J = 1:NumSample(I) Time(I,J) = Data(counter,1); CHPA(I,J) = Data(counter,2); CGA(I,J) = Data(counter,3); CERY(I,J) = Data(counter,4); Ei(I) = Data(counter,5); CEAT(I,J) = Data(counter,6); counter =counter+1; end end for I = 1:NumDataSet Conc(I,1,:) = CHPA(I,:);

Appendix V
240
Conc(I,2,:) = CGA(I,:); Conc(I,3,:) = CERY(I,:); Conc(I,4,:) = CEAT(I,:); % Finding optimum parameters % psoptions = psoptimset('Display','iter','MaxFunEvals',2000000,'MaxIter',2000000,'TolFun',1e-12); % [Theta,Func]= ... % patternsearch(@(x) ObjFunc(x,Ei,Time,Conc,NumDataSet,... % NumComponent,NumSample,tspa),Theta0,[],[],[],[],LB,UB,[],psoptions); end % Initial values for parameters LB(1:NumPara3) = [0.1 0.1 0.01 0.1 0.1 0.1 0.1 0.00001 0.001 ]; UB(1:NumPara3) = [8000 8000 8000 8000 8000 8000 8000 80000 800 ] ; options = optimset('Display','iter','MaxFunEvals',10000,'MaxIter',400,'tolx',10E-12,'tolfun', 10E-12,'TolCon',10E-12); %'UseParallel','always','algorithm', 'interior-point')%'AlwaysHonorConstraints','bounds','DerivativeCheck','on','FunValCheck','on'); % ,'MaxIter', 10); [Theta,Func]= ... fmincon(@(x) ObjFunc(x,Ei,Time,CHPA,CGA,CERY,CEAT,NumDataSet, ... NumComponent,NumSample,tspa),Theta0,[],[],[],[],LB,UB,[],options) KEQ= Theta(1)/Theta(4)*Theta(1)/Theta(4)*Theta(5)*Theta(6)/(Theta(2)*Theta(3)) KiERY= Theta(1)*Theta(5)*Theta(9)/(KEQ*Theta(4)*Theta(3)) KiAP=KEQ*Theta(4)*Theta(2)*Theta(8)/(Theta(1)*Theta(6)) %Parameter(1:20) =1 %result(1:20)=1 %Parameter(n) = (P) %result (n)=(Func) %end %Sensitivity_File = 'Sensitivity'; % Result file %Sensitivity_Filename = strcat(Sensitivity_File,'.xls');
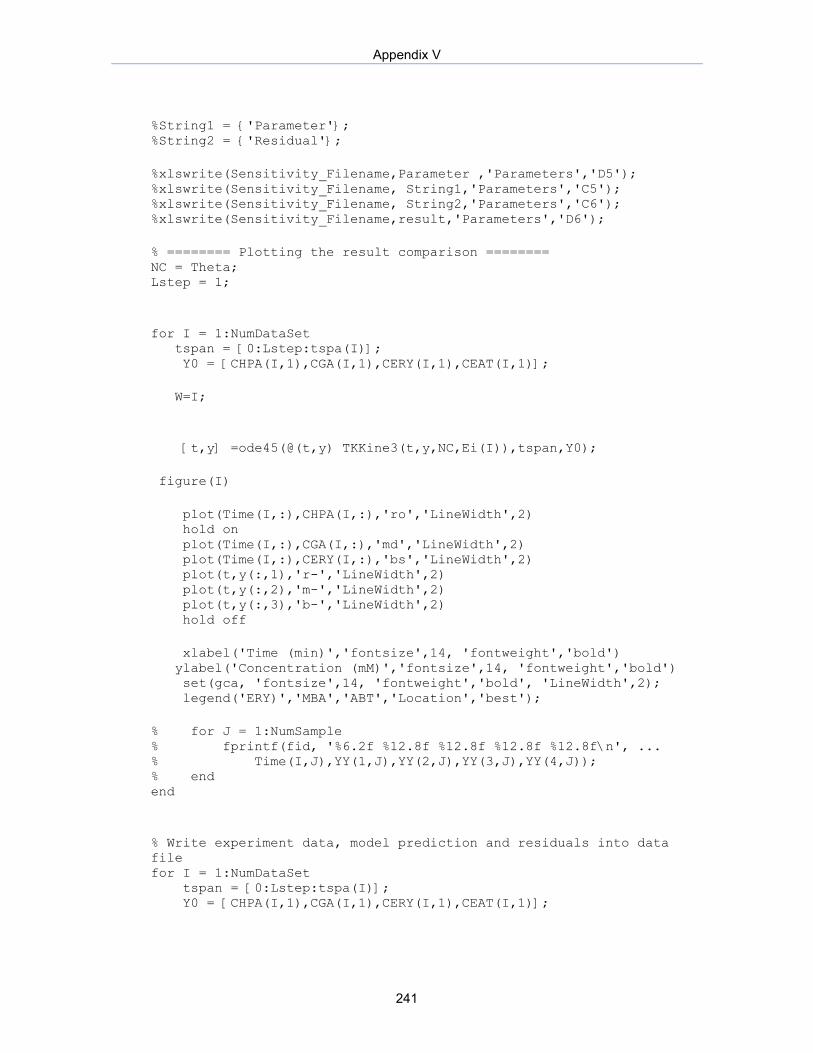
Appendix V
241
%String1 = {'Parameter'}; %String2 = {'Residual'}; %xlswrite(Sensitivity_Filename,Parameter ,'Parameters','D5'); %xlswrite(Sensitivity_Filename, String1,'Parameters','C5'); %xlswrite(Sensitivity_Filename, String2,'Parameters','C6'); %xlswrite(Sensitivity_Filename,result,'Parameters','D6'); % ======== Plotting the result comparison ======== NC = Theta; Lstep = 1; for I = 1:NumDataSet tspan = [0:Lstep:tspa(I)]; Y0 = [CHPA(I,1),CGA(I,1),CERY(I,1),CEAT(I,1)]; W=I; [t,y] =ode45(@(t,y) TKKine3(t,y,NC,Ei(I)),tspan,Y0); figure(I) plot(Time(I,:),CHPA(I,:),'ro','LineWidth',2) hold on plot(Time(I,:),CGA(I,:),'md','LineWidth',2) plot(Time(I,:),CERY(I,:),'bs','LineWidth',2) plot(t,y(:,1),'r-','LineWidth',2) plot(t,y(:,2),'m-','LineWidth',2) plot(t,y(:,3),'b-','LineWidth',2) hold off xlabel('Time (min)','fontsize',14, 'fontweight','bold') ylabel('Concentration (mM)','fontsize',14, 'fontweight','bold') set(gca, 'fontsize',14, 'fontweight','bold', 'LineWidth',2); legend('ERY)','MBA','ABT','Location','best'); % for J = 1:NumSample % fprintf(fid, '%6.2f %12.8f %12.8f %12.8f %12.8f\n', ... % Time(I,J),YY(1,J),YY(2,J),YY(3,J),YY(4,J)); % end end % Write experiment data, model prediction and residuals into data file for I = 1:NumDataSet tspan = [0:Lstep:tspa(I)]; Y0 = [CHPA(I,1),CGA(I,1),CERY(I,1),CEAT(I,1)];
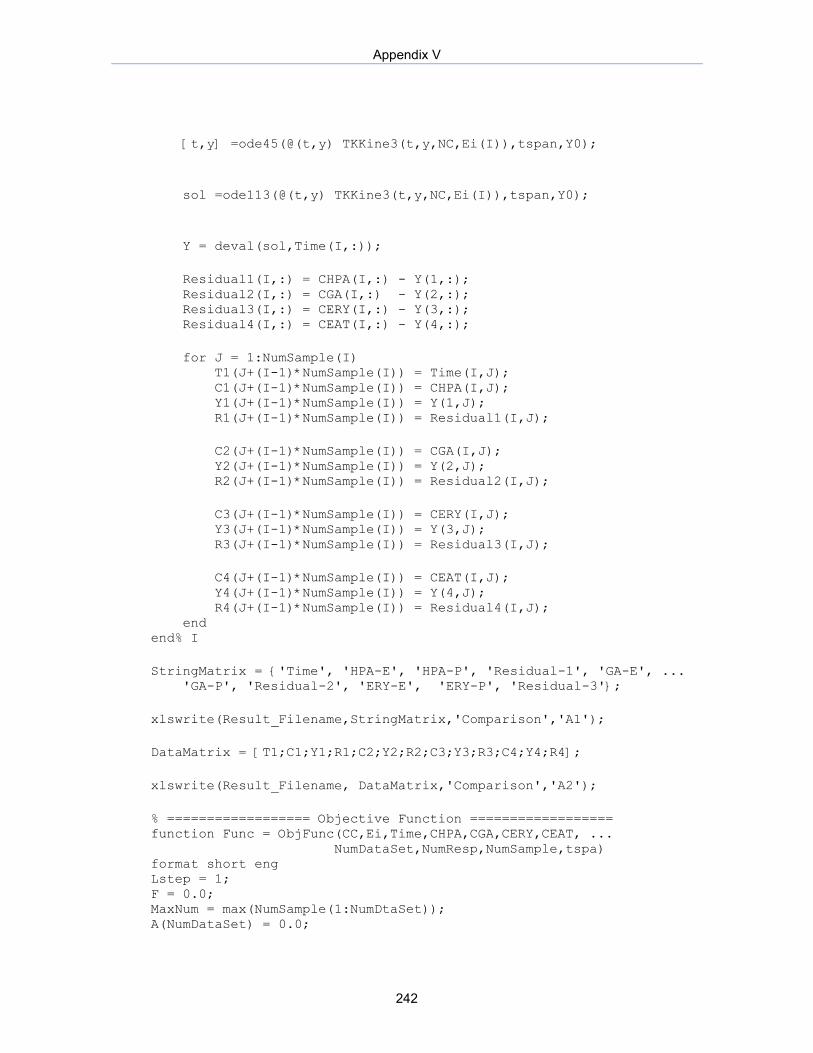
Appendix V
242
[t,y] =ode45(@(t,y) TKKine3(t,y,NC,Ei(I)),tspan,Y0); sol =ode113(@(t,y) TKKine3(t,y,NC,Ei(I)),tspan,Y0); Y = deval(sol,Time(I,:)); Residual1(I,:) = CHPA(I,:) - Y(1,:); Residual2(I,:) = CGA(I,:) - Y(2,:); Residual3(I,:) = CERY(I,:) - Y(3,:); Residual4(I,:) = CEAT(I,:) - Y(4,:); for J = 1:NumSample(I) T1(J+(I-1)*NumSample(I)) = Time(I,J); C1(J+(I-1)*NumSample(I)) = CHPA(I,J); Y1(J+(I-1)*NumSample(I)) = Y(1,J); R1(J+(I-1)*NumSample(I)) = Residual1(I,J); C2(J+(I-1)*NumSample(I)) = CGA(I,J); Y2(J+(I-1)*NumSample(I)) = Y(2,J); R2(J+(I-1)*NumSample(I)) = Residual2(I,J); C3(J+(I-1)*NumSample(I)) = CERY(I,J); Y3(J+(I-1)*NumSample(I)) = Y(3,J); R3(J+(I-1)*NumSample(I)) = Residual3(I,J); C4(J+(I-1)*NumSample(I)) = CEAT(I,J); Y4(J+(I-1)*NumSample(I)) = Y(4,J); R4(J+(I-1)*NumSample(I)) = Residual4(I,J); end end% I StringMatrix = {'Time', 'HPA-E', 'HPA-P', 'Residual-1', 'GA-E', ... 'GA-P', 'Residual-2', 'ERY-E', 'ERY-P', 'Residual-3'}; xlswrite(Result_Filename,StringMatrix,'Comparison','A1'); DataMatrix = [T1;C1;Y1;R1;C2;Y2;R2;C3;Y3;R3;C4;Y4;R4]; xlswrite(Result_Filename, DataMatrix,'Comparison','A2'); % ================== Objective Function ================== function Func = ObjFunc(CC,Ei,Time,CHPA,CGA,CERY,CEAT, ... NumDataSet,NumResp,NumSample,tspa) format short eng Lstep = 1; F = 0.0; MaxNum = max(NumSample(1:NumDtaSet)); A(NumDataSet) = 0.0;
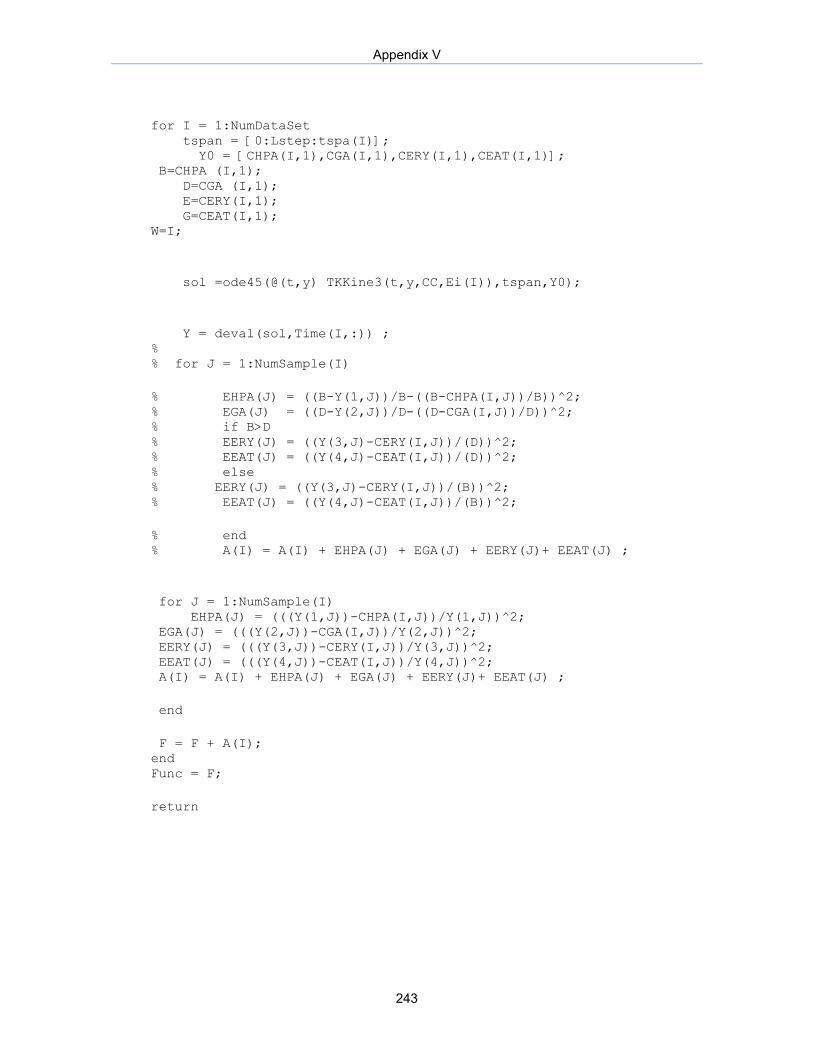
Appendix V
243
for I = 1:NumDataSet tspan = [0:Lstep:tspa(I)]; Y0 = [CHPA(I,1),CGA(I,1),CERY(I,1),CEAT(I,1)]; B=CHPA (I,1); D=CGA (I,1); E=CERY(I,1); G=CEAT(I,1); W=I; sol =ode45(@(t,y) TKKine3(t,y,CC,Ei(I)),tspan,Y0); Y = deval(sol,Time(I,:)) ; % % for J = 1:NumSample(I) % EHPA(J) = ((B-Y(1,J))/B-((B-CHPA(I,J))/B))^2; % EGA(J) = ((D-Y(2,J))/D-((D-CGA(I,J))/D))^2; % if B>D % EERY(J) = ((Y(3,J)-CERY(I,J))/(D))^2; % EEAT(J) = ((Y(4,J)-CEAT(I,J))/(D))^2; % else % EERY(J) = ((Y(3,J)-CERY(I,J))/(B))^2; % EEAT(J) = ((Y(4,J)-CEAT(I,J))/(B))^2; % end % A(I) = A(I) + EHPA(J) + EGA(J) + EERY(J)+ EEAT(J) ; for J = 1:NumSample(I) EHPA(J) = (((Y(1,J))-CHPA(I,J))/Y(1,J))^2; EGA(J) = (((Y(2,J))-CGA(I,J))/Y(2,J))^2; EERY(J) = (((Y(3,J))-CERY(I,J))/Y(3,J))^2; EEAT(J) = (((Y(4,J))-CEAT(I,J))/Y(4,J))^2; A(I) = A(I) + EHPA(J) + EGA(J) + EERY(J)+ EEAT(J) ; end F = F + A(I); end Func = F; return

Appendix V
244
% ======== Kinetics Model ======== function dy = TKKine3(t,y,RC,Ei) % PingPong Bi-Bi mechanism for reaction: % PingPong Bi-Bi mechanism for reaction: kf = RC(1); % Rate constant [1/min] KmA = RC(2); % Michaelis constant of HAP [mM] KmB = RC(3); % Michaelis constant of GA [mM] kr=RC(4); KmP = RC(5); KmQ = RC(6); KiBs= RC(7); KiB =RC(8); KiQ = RC(9); [M,N]=size(y); RealZero = 1.0e-18; for I = 1:M if (y(I) <= RealZero) y(I) = RealZero; end end dy = zeros(M,1); KEQ = (kf/kr)*(kf/kr)*KmP*KmQ/(KmA*KmB); d3=(kf*Ei*kr*Ei*(y(1)*y(2)-(y(3)*y(4))/(KEQ)))/(kr*Ei*KmB*y(1)+kr*Ei*KmA*y(2)+kr*Ei*y(1)*y(2)+kf*Ei*KmP*y(4)/(KEQ)+kf*Ei*KmQ*y(3)/(KEQ)+... kf*Ei*y(3)*y(4)/(KEQ)+kr*Ei*KmB*y(1)*y(4)/KiQ +kf*Ei*KmQ*y(2)*y(3)/(KEQ*KiB)... +kr*Ei*KmA*y(2)*y(2)/(KiBs*KEQ)+kf*Ei*KmP*y(2)*y(4)/(KiBs)); %last line contains the extra terms for the model with substrate inhibition dy(1) =- d3; dy(2) = -d3; dy(3) = d3; dy(4) = d3; return
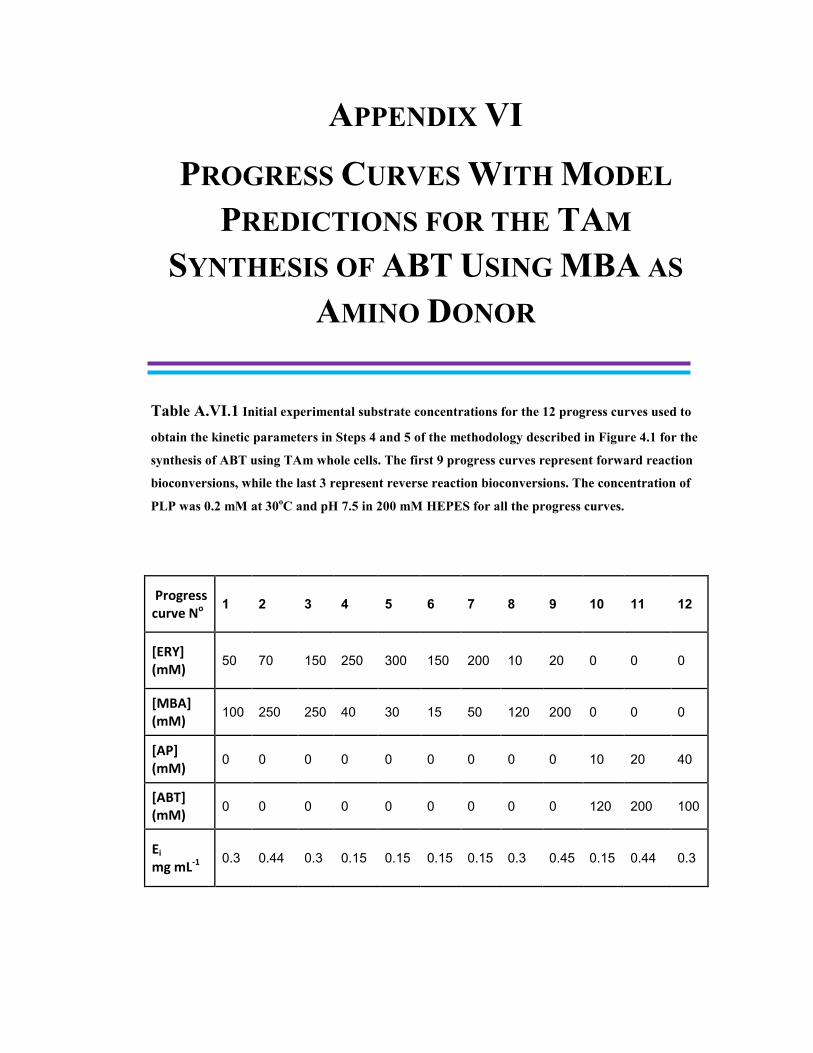
APPENDIX VI
PROGRESS CURVES WITH MODEL PREDICTIONS FOR THE TAM
SYNTHESIS OF ABT USING MBA AS AMINO DONOR
Table A.VI.1 Initial experimental substrate concentrations for the 12 progress curves used to
obtain the kinetic parameters in Steps 4 and 5 of the methodology described in Figure 4.1 for the
synthesis of ABT using TAm whole cells. The first 9 progress curves represent forward reaction
bioconversions, while the last 3 represent reverse reaction bioconversions. The concentration of
PLP was 0.2 mM at 30oC and pH 7.5 in 200 mM HEPES for all the progress curves.
Progress curve No 1 2 3 4 5 6 7 8 9 10 11 12
[ERY] (mM)
50 70 150 250 300 150 200 10 20 0 0 0
[MBA] (mM)
100 250 250 40 30 15 50 120 200 0 0 0
[AP] (mM)
0 0 0 0 0 0 0 0 0 10 20 40
[ABT] (mM)
0 0 0 0 0 0 0 0 0 120 200 100
Ei mg mL-1
0.3 0.44 0.3 0.15 0.15 0.15 0.15 0.3 0.45 0.15 0.44 0.3

Appendix VI
246
Figure A.VI. 1. Progress curves of whole cell TAm mediated synthesis of ABT from substrates
ERY and MBA. The number of each graph relates with the initial concentrations of substrates
and enzyme described in Table A.VI.1. Modelling was performed with Equation 4.1 and the
parameters from Table 4.2 and is shown in solid lines.

Appendix VI
247
Figure A.VI. 2. Progress curves of whole cell TAm mediated synthesis of ABT from
substrates MBA and ERY (continuation from Figure A.VI.1). The number of each graph relates
with the initial concentrations of substrates and enzyme described in Table A.X.1. Modelling was
performed with Equation 4.1 and the parameters from Table 4.2 and is shown in solid lines.

APPENDIX VII
SENSITIVITY ANALYSIS OF THE KINETIC PARAMETERS OF THE TAM
MEDIATED SYNTHESIS OF ABT
Figure A.VII.1. Effect of the parameter value of (a) kf, (b) kr, (c) KERY and (d) KMBA in the
simulated yield of ABT (% mol/mol) considering a 24 hr reaction using 100 mM equimolar of
[MBA] and [ERY] and 0.3 mg ml-1 of TAM. Equation 4.1 was used with the parameters from
Table 4.2, and the parameters were varied increasing and decreasing 10-fold their values. The
sensitivity results are discussed in Section 4.4.3.
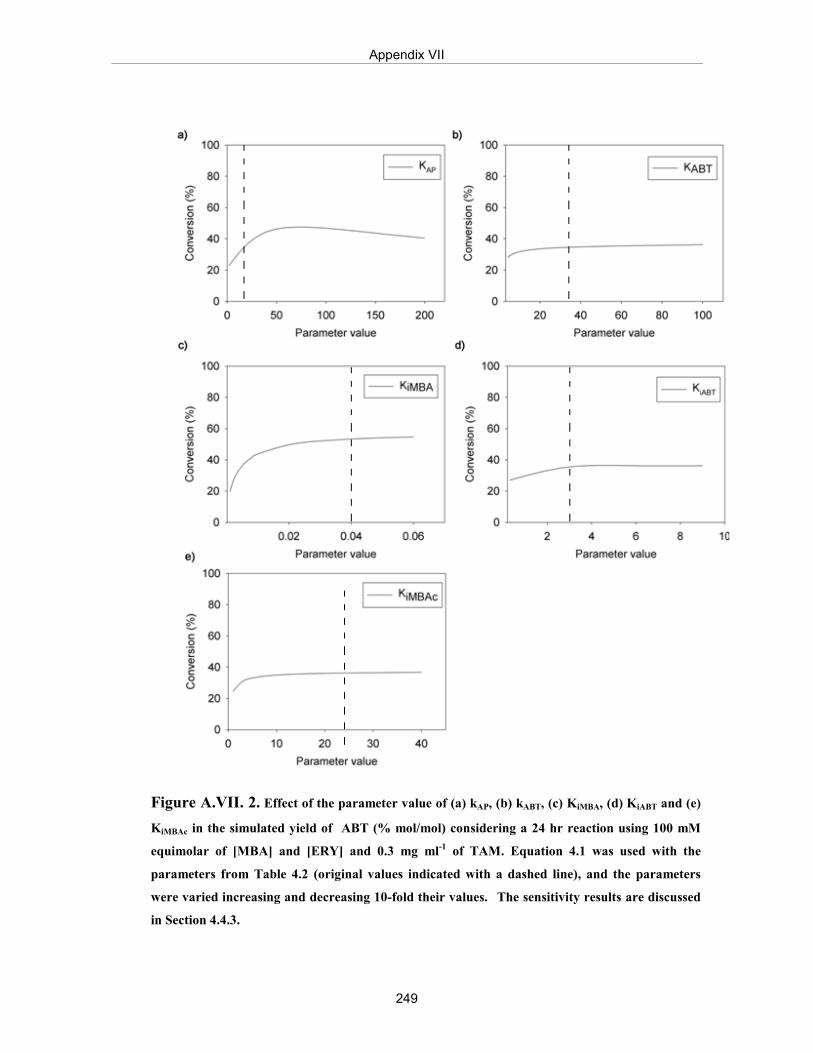
Appendix VII
249
Figure A.VII. 2. Effect of the parameter value of (a) kAP, (b) kABT, (c) KiMBA, (d) KiABT and (e)
KiMBAc in the simulated yield of ABT (% mol/mol) considering a 24 hr reaction using 100 mM
equimolar of [MBA] and [ERY] and 0.3 mg ml-1 of TAM. Equation 4.1 was used with the
parameters from Table 4.2 (original values indicated with a dashed line), and the parameters
were varied increasing and decreasing 10-fold their values. The sensitivity results are discussed
in Section 4.4.3.

Appendix VIII
250
APPENDIX VIII
PILOT PLANT FERMENTATION OF E. COLI CELLS OVEREXPRESSING TAM
VIII. TRANSAMINASE PILOT SCALE FERMENTATIONS
VIII.I Fermentation with one single pulse addition of glycerol
The shake flask fermentation of E. coli single induced with plasmid pQR801 to
express TAm shown in Figure 3.1 reached a final biomass of 1.8 gDCW L-1 and
a final TAm concentration of 0.36 g L-1. In order to increase the total volume
of the reaction and the final yield of TAm, the fermentation was scaled up to a
7.5L New Brunswick fermentor (BioFlo 110, New Brunswick, Hertfordshire,
UK) with a working volume of 5L. (For more details about the characteristics
of the fermentor see Section 2.5.2 of the Materials and Methods). The
temperature and pH were the same as for the shake flask fermentations of
Figure 3.1, which were 37oC, pH 7.0 and the DOT was set to be maintained to
a minimum of 80% through a cascade control of the impeller speed. The
selected media was LB-glycerol which initially only contained 3g L-1 of
glycerol. One single shot addition of pre-sterilized 25 grams of glycerol was
made to the fermentor after 5.0 hours. Figure VIII.1 shows the cell growth
curve of the fermentation while figure VIII.2 shows the profiles of DOT, rpm
of the impeller, pH and temperature.

Appendix VIII
251
Figure VIII.1. Growth profile of E. coli cells overexpressing TAm for the fermentation
with single shot addition of glycerol as described in Section VIII.1.
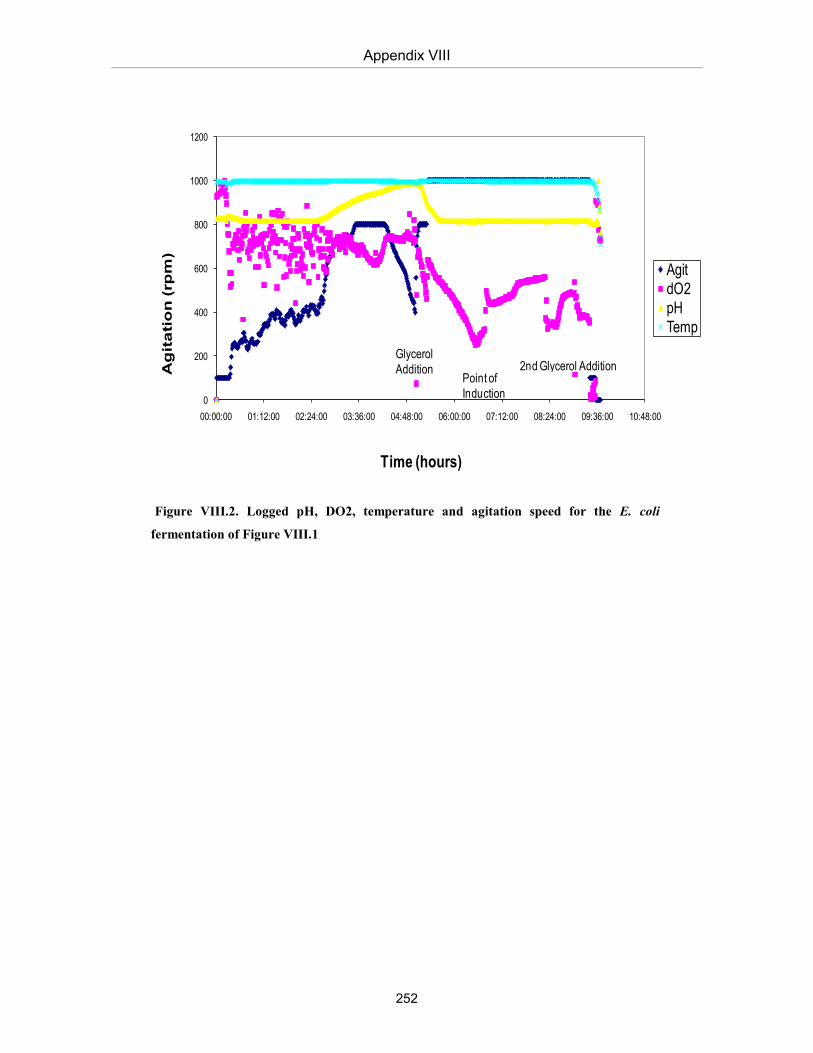
Appendix VIII
252
Figure VIII.2. Logged pH, DO2, temperature and agitation speed for the E. coli
fermentation of Figure VIII.1
0
200
400
600
800
1000
1200
00:00:00 01:12:00 02:24:00 03:36:00 04:48:00 06:00:00 07:12:00 08:24:00 09:36:00 10:48:00
Ag
ita
tio
n (
rpm
)
Time (hours)
AgitdO2pHTemp
Glycerol Addition
Point of Induction
2nd Glycerol Addition

Appendix VIII
253
The fermentation presented a first exponential phase with a specific growth
rate of 0.36 hr-1 which ended after 4 hours of fermentation when the cells
reached the first stationary phase, which correlated with a sharp decrease in the
speed impeller after 4 hours (Figure VIII.2), due to decrease in metabolic
activity of the cells. Therefore after 5 hours, 25 g of glycerol were added,
which correlated with an immediate increase in the impeller speed and a steady
decrease in DOT, leading to second exponential growth phase with a specific
growth rate of 0.24 hr-1 which ended after 9 hours of fermentation when the
cell reached the second stationary phase with a final biomass 6.4 gDCW L-1.
Figure VIII.3 shows the SDS PAGE gels for cellular extracts taken at different
time intervals.
Figure VIII.3. SDS PAGE gel of the cellular extracts at different intervals of time of the
fermentation shown in Figure VIII.1

Appendix VIII
254
The cells were induced after 6.5 hours, which correlated with a sharp increase
in enzyme synthesis as can be seen in Figure VIII.3 The final TAm expression
represented 40% of the total protein, which was similar to the level of
expression obtained in shake flasks, however due to the higher biomass
concentration achieved in the 7.5L fermentor, the final TAm concentration was
found to be 1.3 g L-1, which represented a 3.5 improvement compared to the
shake flask fermentations of Chapter 3.
VIII.II. Fermentation with continuous fed batch feeding of glycerol
In order to increase the biomass and enzyme yield obtained in the fermentation
described in Appendix Section VIII.I, a continuous fed-batch fermentation of
TAm was performed in a 2L fermenter (Adaptive Biosystems, London,
England) as described in Sections 2.5.1 and 2.5.3. The temperature and pH
were controlled at 37oC and pH 7.0, the media was LB with 5 g L-1 of glycerol,
and the speed impeller was fixed at 1100 rpm. Figure VIII.4 shows the growth
curve over time while Figure VIII.5 illustrates the DOT, pH, temperature and
impeller speed profiles of the fermentation.
After 8 hrs of growth, when the carbon source was depleted which correlated
with the DOT reaching 100%, glycerol was added in a continuous fed batch
mode with increasing rates as described by Equation 2.1 in Section 2.5.3,
maintaining a specific growth rate of 0.3. The fermentation reached a final
biomass of 24 g L-1 after 43 hrs, and figure VII.6 shows the SDS PAGE gels
for cellular extracts taken at different time intervals.
Induction was performed after 15 hr, where a sharp increase in enzyme
synthesis could be observed in Figures 5.7 and 5.8 reaching a final TAm yield
of 4.8 g L-1, which represented a 4X and 13X improvement compared to the
fermentation with a single shot addition of glycerol and the shake flask
fermentation respectively of Chapter 3.

Appendix VIII
255
Figure VII.4. Growth curve as a function of time for the fed batch fermentation of E.
coli cells with plasmid pQR801 as described in Section 2.8.3.
0.00
5.00
10.00
15.00
20.00
25.00
30.00
0.00 5.00 10.00 15.00 20.00 25.00 30.00 35.00 40.00 45.00
DCW
[g/l
]
time [h]
Protein production, pump blockedflow increased to 0.5ml/min

Appendix VIII
256
Figure VII.5. Logged pH, temperature, DOT and RPM for the fed batch fermentation
of Figure VII.4
Figure VIII.6. SDS PAGE gel for different interval samples of the fermentation shown
in Figure VIII.5. (Note that time increases from right to left).
0
10
20
30
40
50
60
70
80
90
100
0 500 1000 1500 2000 2500
Dim
entio
nles
s U
nits
t (min)
1.5L FERMENTOGRAM
Oxygen Tension (%)
pH
Impeller Speed (RPS)
Feed started
Increase RPM & VVM Increase
RPM & VVM
Feed pump failure

APPENDIX IX
PROGRESS CURVES WITH MODEL PREDICTIONS FOR THE TK D469E
SYNTHESIS OF PKD
Table A.IX.1. Initial experimental substrate and enzyme concentrations for the 9 progress
curves used to obtain the kinetic parameters in Steps 4 and 5 of the methodology described in
Figure 4.1 for the synthesis of PKD using TK D469E whole cells. The concentration of TPP and
Mg2+ was 2.4 and 9 mM respectively at 30oC in 50 mM TRIS buffer pH 7.5.
No Progress curve 1 2 3 4 5 6 7 8 9
[HPA] (mM) 100 130 150 230 100 150 200 300 300
[GA] (mM) 130 170 200 300 50 110 140 200 270
Ei mg ml-1 0.3 0.3 0.3 0.4 0.5 0.5 0.6 0.6 0.6

Appendix IX
258
Figure A.IX.1. Progress curves of whole cell TK D469E mediated synthesis of PKD from
substrates PA and HPA. The number of each graph relates with the initial concentrations of
substrates and enzyme described in Table A.IX.1. Modelling was performed with Equation 6.1
and the parameters from Table 6.1 and is shown in solid lines.

Appendix IX
259
Figure A.IX. 2. Progress curves of whole cell TK D469E mediated synthesis of PKD from substrates
PA and HPA (continuation from Figure A.IX.1). The number of each graph relates with the initial
concentrations of substrates and enzyme described in Table A.IX.1. Modelling was performed with
Equation 6.1 and the parameters from Table 6.1 and is shown in solid lines.

APPENDIX X
PROGRESS CURVES WITH MODEL PREDICTIONS FOR THE TAM
SYNTHESIS OF APD
Table A.X. 1. Initial experimental substrate and enzyme concentrations for the 9 progress
curves used to obtain the kinetic parameters in Steps 4 and 5 of the methodology described in
Figure 4.1 for the synthesis of APD using CV2025 TAm whole cells. The concentration of PLP
was 0.2 mM at 30oC and pH 7.5 in 200 mM HEPES for all the progress curves.
No progress curve
1 2 3 4 5 6 7 8 9
[PKD] (mM) 50 70 100 250 300 150 200 300 10
[MBA] (mM) 100 250 250 40 30 15 50 200 120
Ei mg ml-1
0.3 0.4 0.3 0.15 0.15 0.15 0.15 0.6 0.3

Appendix X
261
Figure A.X.1. Progress curves of whole cell TK mediated synthesis of APD from substrates
PKD and MBA. The number of each graph relates with the initial concentrations of substrates
and enzyme described in Table A.X.1. Modelling was performed with Equation 6.2 and the
parameters from Table 6.2 and is shown in solid lines.
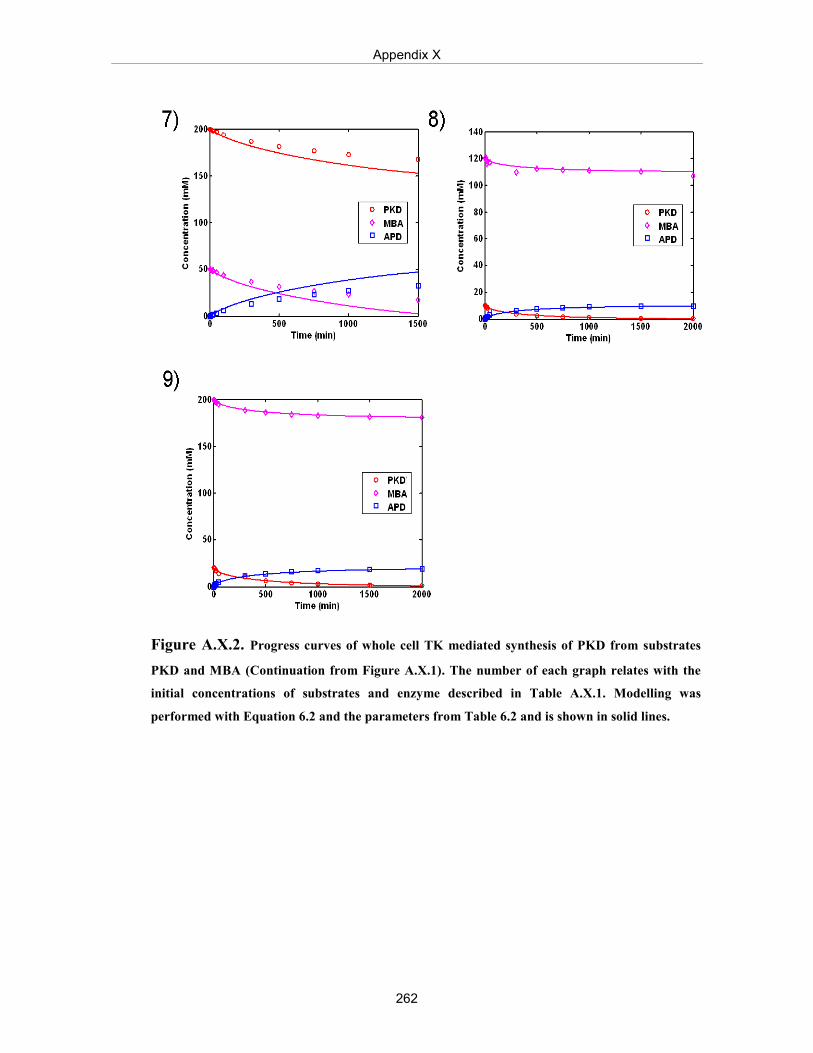
Appendix X
262
Figure A.X.2. Progress curves of whole cell TK mediated synthesis of PKD from substrates
PKD and MBA (Continuation from Figure A.X.1). The number of each graph relates with the
initial concentrations of substrates and enzyme described in Table A.X.1. Modelling was
performed with Equation 6.2 and the parameters from Table 6.2 and is shown in solid lines.

APPENDIX XI
PROGRESS CURVES OF THE TAM MEDIATED SYNTHESIS OF ABT AND APD USING IPA AS AMINO DONOR
A.XI. 1. TAm mediated synthesis of ABT with IPA as amino donor. ERY and IPA were 100
mM, 0.3 mg ml-1 of TAm in whole cell form, pH 7.5 in 200 mM HEPES buffer at 30oC.
Bioconversions performed as described in Section 2.8.1.
0
20
40
60
80
100
120
0 10 20 30 40 50
Conc
entr
atio
n (m
M)
Time (hr)
ERY
ABT

Appendix XI
264
A.XI. 2. TAm mediated synthesis of APD with IPA as amino donor. PKD and IPA were 200
mM, 0.3 mg ml-1 of TAm in whole cell form, pH 7.5 in 200 mM HEPES buffer at 30oC.
Bioconversion performed as described in Section 2.8.1.
0
50
100
150
200
250
0 10 20 30 40 50
Conc
entr
atio
n (m
M)
Time (hr)
PKD
APD

Appendix XII
265
APPENDIX XII
LC−ECI−MS CHROMATOGRAMS
LC-ECI-MS analysis was carried out on reaction mixture with ABT produced from a
single TAm bioconversion using MBA and ERY as subtrates (Figure A.XI.1), and
from dual TK-TAm reaction (Scheme 3.1). Results were compared with previous
ABT MS-MS standards (Matosevic, 2009).
Appendix A.XII. 1. LC-ECI-MS analysis for reaction mixture with ABT produced from
individual TAm bioconversion using ERY and MBA as substrates (Section 2.9.7).

Appendix XII
266
Appendix A.XII. 2. LC-ECI-MS analysis for reaction mixture with ABT produced from
dual-TK-TAm multi-step bioconversion (Scheme 3.1) (Section 2.9.7).