leprosy elimination monitoring in india 2004apps.searo.who.int/pds_docs/b0232.pdf · students of...
TRANSCRIPT

Leprosy
Elimination Monitoring
in India
2004
in collaboration with
ILEP
International Federation of Anti-Leprosy Associations

ii
Table of Contents
Page No.
Foreword …………………………………………………………….. iii
Preface ……………………………………………………………... iv
Acknowledgement …………………………………………………. v
Abbreviations ………………………………………………………. vi
Glossary of common terms ……………………………………….. vii
Executive summary ………………………………………………… viii
Introduction …………………………………………………………. 1
Specific objectives …………………………………………………. 3
Methodology ………………………………………………………… 3
Description of the sample …………………………………………. 7
Results ………………………………………………………………. 8
I. Elimination indicators …………………………………… 8
II. Integration indicators ……………………………………. 18
III. SIS implementation ……………………………………… 26
IV. Quality of MDT services ………………………………… 33
V. Awareness about leprosy ………………………………. 40
VI. Comparisons between LEM 2002 2003 & 2004 ……... 41
VII. Validation of leprosy diagnosis ………………………… 46
Conclusions …………………………………………………..………. 53
Recommendations ………………………………………………..…. 59
Annexures
- 1 List of Monitors …………………………………..…… 61
- 2 List of Validators.…………..………………..….….…. 63

iii

iv
PREFACE The Government of India launched the leprosy control programme in 1955. Based on the
recommendations of the high powered committee under the chairmanship of
Dr. M.S. Swaminathan, the Government of India launched the National Leprosy Eradication Programme
(NLEP) in 1983 with the objective of achieving elimination of leprosy and introducing Multi Drug Therapy
(MDT) in the programme. With these efforts, the national level Prevalence rate for leprosy has declined from
57.6/10,000 in 1983 to 2.4/10,000 in March 2004. The Modified Leprosy Elimination Campaigns (MLECs)
have helped in detection of hidden cases and in creating awareness among public and health personnel. During
the period 2001-2004, with support from the World Bank, it is envisaged to consolidate the achievements of
leprosy elimination, decentralize decision-making, integrate the programme with general health services and to
develop a simplified surveillance system to monitor the progress towards elimination.
The present LEM exercise was undertaken by NIHFW with support from WHO, GOI and ILEP,
with the objective to assist the decision makers and programme managers to assess the progress towards leprosy
elimination. It is hoped that the outcome will be useful for programme managers and appropriate actions will
be taken for improvement of the programme.
Dr. N. K. Sethi
Director NIHFW
v
Acknowledgement
The LEM survey was funded by WHO and supported by GOI and ILEP. The technical support
provided by Dr. D. Daumerie, Dr. V Pannikar, Dr. D Lobo, Dr. S. Manoncourt from WHO and other LEM
Core Group members Dr. G.P.S. Dhillon (Deputy Director General, Leprosy), Dr. Inder Parkash (Deputy
Assistant Director General, Leprosy), Dr. S.B. Taranekar, (Assistant Director General), Dr. B.N.Barkakaty
(National Consultant), Dr.P.Krishnamurthy (Secretary, Damien Foundation), Dr. G. Rajan Babu (Head
Evaluation, The Leprosy Mission), Dr. M.A. Arif (Country Representative, Netherlands Leprosy Relief),
Dr. K.S. Baghotia (SLO, Delhi), Dr. S.B.Arora (Professor,IGNOU), is duly acknowledged. Dr. M. Mangalani
and Dr. Sunil Hamiltan from NLR, India also provided valuable support. All the monitors and validators (list in annexure) who made their services available for the LEM
survey deserve a special mention. With their help and support it was possible to collect the necessary data for
the LEM within the specified period. The facilities and support provided by the state governments, district
authorities, WHO coordinators, members of ILEP agencies and Regional Leprosy Training Institutes is highly
appreciated.
The contribution of Dr. Sandeep Sachdeva (Epidemiologist, LEM Project) and the valuable support
from other staff members of Department of Education and Training is duly acknowledged. The data entry and
typing work was done by Mr. Shiv Kumar and Mrs.Varsha Mudgal and the LEM software was upgraded by
Mr. Vikas Kulhan, I.T. Officer. Mrs. Nanda Paithankar from WHO, provided valuable support for analysis
of Validation Data. The cover design was made by Shri Ashok Chaudhary. The contribution of Post graduate
students of NIHFW Dr. Sanjeev Davey, Dr. L. Swasthicharan, Dr. Ritu Beri, Dr. Veenu Goel, Dr. Shivani,
Dr. Mithila, Dr. Ajay Handa, Dr. Chaman Prakash and Dr. J.B. Babbar is highly appreciated. The
administrative support from DD(A), Dean’s office, Accounts Section, Stores Section, WMO Section,
Reprography and Hostel of NIHFW is also appreciated.
Dr. A.K. Sood Nodal Officer, LEM
NIHFW

vi
Abbreviations
A-MDT Accompanied MDT BCPs Blister Calendar Packs (MDT drugs) CHC Community Health Center CMO Chief Medical Officer DLO District Leprosy Officer IEC Information Education Communication ILEP International Federation of Anti Leprosy Association GHS General Health Services GOI Government of India LCA Left Control Area LEM Leprosy Elimination Monitoring LF04 PHC/Block PHC Monthly Report LF05 District/State Monthly Report MB Multi Bacillary MBA Multi Bacillary (Adult) MBC Multi Bacillary (Child) MDT Multi Drug Therapy MLEC Modified Leprosy Elimination Campaign MO Medical Officer MOHFW Ministry of Health and Family Welfare MPR Monthly Progress Report NCDR New Case Detection Rate NGO Non Government Organisation NIHFW National Institute of Health & Family Welfare NLEP National Leprosy Eradication Programme PBA Pauci Bacillary (Adult) PBC Pauci Bacillary (Child) P/D ratio Prevalence/Detection ratio PHC Primary Health Center PR Prevalence Rate RFT Released from Treatment SC Schedule Caste SIS Simplified Information System SLO State Leprosy Officer ST Schedule Tribe WHO World Health Organization

vii
Glossary of common terms
Leprosy case A leprosy case is person who has a skin patch (es) with definite loss of sensation and/or involvement of one/more nerve (s) and who has not completed a full course of treatment with Multi Drug Therapy.
Leprosy Defaulter A person who has not collected MDT drugs consecutively for at least 12 months and his name should be removed from calculation of prevalence.
Cure A person who has completed a full course of fixed duration MDT (6 doses [pulses] for PB and 12 doses[pulses] for MB)
Released from Treatment
A cured person is released from treatment (RFT).
Multi-bacillary Case A patient with 6 or more skin lesions, with definite loss of sensation and/or 2 or more nerve involvement
Pauci-bacillary Case A patient with up to 5 skin lesions, with definite loss of sensation and/or 1 nerve involvement
MB Cohort for present survey
MB cases started MDT during 1st May 2001 to 30th April 2002 (Reference period)
PB Cohort for present survey
PB cases started MDT during 1st January. to 31st December 2002 (Reference period).
Disability grade-II Visible deformity or damage of hand and foot; or person who cannot count fingers at a distance of 6 feet, lagopthalmos, iridocyclitis, and corneal opacity
Prevalence rate Number of reported cases of leprosy per 10,000 populations at a given point of time (31st March).
Prevalence rate after applying standard definitions
Prevalence rate as calculated after applying the standard definitions of a leprosy case, a defaulter and a cured case of leprosy.
MDT Blister Pack for MB
Contain Rifampicin, Dapsone and Clofazimine
MDT Blister Pack for PB
Contain Rifampicin and Dapsone
Unacceptable blister Pack
MDT pack which is torn, discolored, damaged or expired.
Accompanied MDT
Giving more than one month of MDT pack(s) to patient in advance anticipating his/her inability to come the following month(s), due to various reasons (stigma, employment, distance, relocation, etc.)

viii
EXECUTIVE SUMMARY, LEM 2004, INDIA
The present LEM survey, which is a follow-up of LEM 2002 and 2003, was carried out in a
standardized way across the country from 17th May to 14h June, 2004 and the validation of
leprosy diagnosis was done from 15thJune to 3rd July, 2004 (from 1-15th Sept., 2004 in
Jharkhand and Orissa) with the aim to assist the decision makers and programme managers to
assess the progress towards leprosy elimination. The WHO document “Leprosy Elimination
Monitoring Guidelines for Monitors 2000” was used as a reference. It was adapted to meet the
Indian context. The LEM survey was undertaken in the 13 high endemic states. In each state,
the districts were divided into two strata according to the prevalence rate of leprosy (= & <
3.5/10,000). A sample of 20% of the total districts in each stratum per state was considered to
be representative of the state. A total of 77 districts were covered.
In 2004, the LEM monitors covered 518 health facilities, of which 418 were in rural areas. They
interviewed 4481 patients and 10800 community members. The monitors reviewed 37460
patient’s records (MB & PB) and examined large number of MDT blister packs at the State,
District and Health Facility stores. Finally, the validation teams have seen 1081 newly detected
leprosy cases, out of the 1510 listed by the NLEP, during the reference period.
The main findings of the LEM -2004 survey were as follows:
1. Elimination indicators
• Prevalence and detection rates found in the LEM survey were close to those reported by the
annual reports with a few exceptions. However the reported prevalence and detection rates
were inflated in most of the states included in the LEM. It was due to operational factors:
wrong diagnosis, re-registration of cases, and gaps in regular cleaning/updating the leprosy
registers.
• All the states reported a prevalence/detection ratio of less than one, except Delhi and West
Bengal, highlighting recycling of cases in these two states.
• The trends of disability grade-2 have been steadily declining in all the states over the past
years. The overall proportion of disability Grade-2 among new cases covered by the LEM
was 1.4%. It was lower than 2% in all States, except Delhi (3.7%) and West Bengal (3.5%).
• Overall, the proportion of MB among new cases was 38.3%, ranging from 19.2% in Andhra
Pradesh to 56.8% in Madhya Pradesh.
• Regarding the proportion of females among new cases, the LEM findings showed an

ix
average of 35%, with wide differences among the 13 states (from 17.5% in Delhi to 45% in
Andhra Pradesh). No epidemiological reason can explain these variations. Level of
awareness among female and involvement of female health workers, varying from state to
state, might be a factor; but this would need to be further investigated.
• The New Case Detection Rates (NCDR) among Scheduled Caste and Scheduled Tribe
compared with NCDR among non ST and non SC population, was higher in many states,
with possibility of a higher risk among SC and ST or special detection activities targeted
among these groups.
2. Status of Integration of MDT services with general health services
• The diagnosis of leprosy was being made and treatment initiated at 80% of the health
facilities visited, which provided these services on all working days in 89.6% of health
facilities.
• The median distance to collect MDT was 2.0 km and median travel cost was Rs. 10.
• Accompanied MDT was provided as an option for patients who needed more than one
month of treatment in 59.9% of health facilities, with wide variations from 27.2% in
Maharashtra to 100% in Delhi.
• In 98% of health facilities, the leprosy treatment register was maintained. In 96% the drug
register was maintained by the pharmacist at the health facility itself.
• The status of MDT stock, in patient-months, in various health facilities was 2.8 for MBA, 4.6
for MBC, 3.4 for PBA and 4.0 for PBC, but wide variations were observed. On further
analysis, only 16.7% of health facilities had 3 months of MDT stock of all categories of blister
packs, in relation to the number of registered cases.
• MDT drugs are available but adequate distribution of MDT blister packs in relation to the
caseload at health facilities was a major issue.
• Overall, the integration process had continued to make progress, in all states. However,
further strengthening is required in Andhra Pradesh, Madhya Pradesh and West Bengal.
3. Quality of MDT Services
• As per the records maintained at health facilities visited by the monitors nearly all the newly
detected leprosy cases were put on MDT.
• The overall cure rate after assessment of cohort analysis of the leprosy cases was 83.9% for
MB and 93.4% for PB cases. The MB and PB cure rate was below 80% in Delhi, Karnataka
and West Bengal.

x
• The overall defaulter rate was 6.5% for MB and 3.7% for PB cases. The MB defaulter rate
was high in West Bengal (29.9%), Delhi (27.8%) and Uttaranchal (10.9%).
• It was observed that nearly 1.3% of MB cases and 1.6% of PB cases continued treatment
even after completing fixed duration MDT
• The proportion of health facilities with discrepancy of new leprosy cases between treatment
register and annual report (12 monthly progress reports from April 2003 to March 2004) was
47.8% whereas 24.3% and 23.5% of health facilities mentioned over reporting and under
reporting respectively.
• At the state stores, the proportion of damaged MB-Adult blister packs was found high (20%)
in Chhattisgarh. The proportion of expired MDT drugs was found unacceptably high in
Madhya Pradesh (38% MB-Adult, 37.5% PB-Adult), Jharkhand (14.6% PB-Child), and
Chhattisgarh (10% MB-Adult).
• At the district stores, the proportion of MDT packs not damaged and not expired was 98%
for MBA, 99% for MBC 98% for PBA and 98% for PBC. High proportion of damaged and/or
expired drugs was reported from Tamil Nadu, Orissa, Chhattisgarh, Jharkhand, Madhya
Pradesh and Uttaranchal.
• At health facilities level, proportions of MDT packs of good quality were 98.6% for MBA,
96.4% for MBC, 99.5% for PBA and 97.8% for PBC. High proportion of damaged/expired
drugs was found in Chhattisgarh, Maharashtra, Tamil Nadu, Uttaranchal and West Bengal.
4. Status of Implementation of the Simplified Information System (SIS)
• In 47.1% of health facilities SIS guidelines were available, 94.6% had SIS patient cards, and
94.9% had SIS treatment registers, 84.2% SIS MDT drug registers and in 98% SIS MDT
monthly report formats were available.
• The proportion of health facilities where the last monthly report was sent on new SIS format
was 96.6%.
• Only 33.8% of health facilities were found with at least three NLEP indicators calculated.
• Nearly 80.6% health facilities had mentioned complete data including drug stock and its
expiry date in the latest available MPR.
• 85% of health facilities had sent their MPR (LF04) of April 2004 to district HQ on time.
• Of the visited districts, nearly 98.6% had sent their MPR (LF05) of April 2004 to state HQ on
time.
• Compilation of health facility/block reports at the district headquarters was incomplete, due
to delay in sending block reports on time to the district.

xi
• The objective of using data for monitoring and decision making of the SIS is not yet fully
operational at district and health facility level.
5. Leprosy Awareness in Community
• It was observed that 63% of the community members interviewed could tell at least one
sign/symptoms of leprosy.
• Nearly 59% of the community members knew that leprosy is curable and 61% knew that
treatment is available free of charge.
• But only 12% of the community members could tell the correct cause of leprosy as
germ/microbiological agent. Rest of them mentioned the cause as immorality, hereditary or
curse of God.
6. Validation of Leprosy Diagnosis
• Out of the 879 newly detected leprosy cases examined by the validators, the proportion of
cases which were wrongly diagnosed was 9.4% (11.1% for PB, and 8.0% for MB cases).
• Out of the 1081 cases seen by the validators, the proportion of re-registered cases was
18.7% (8.8% for PB, and 25.5% for MB cases).
• The proportion of wrong grouping was 12.8% (6.6% for PB cases, and 17.8% for MB cases).
• Nearly 5.2% of the leprosy cases were non-existent (fake cases).
Recommendations:
State and District authorities have done a commendable job towards Elimination of Leprosy
from the country. They need to sustain and strengthen their ongoing Leprosy activities. Based
on the findings of the LEM 2004, the following recommendations have been formulated:
1. Motivate and sensitize health team and decision makers regarding National Commitment
towards Elimination of leprosy from India by 2005.
2. State and District authorities should prepare an Action Plan i.e. what steps to be taken &
activities to be carried out in a definite period towards the goal of leprosy elimination
within the available resource and constraints.
3. Improve the quality of the leprosy diagnosis and grouping at health facility level, by
strictly applying standard procedures for testing the skin sensory deficit and nerve
thickening.
4. In order to avoid re-registration of old cases, proper history of patients should be taken
regarding potential MDT treatment in the past (old case). Ensure that old leprosy
xii
patients when present to health facilities are given MDT as per requirement (only when
needed) but they should not be included and reported as ‘new’ leprosy cases detected.
5. In order to reduce the defaulter rate, adequate counselling of the patients regarding
importance of completion of treatment should be undertaken at the time of diagnosis of
disease, initiation of treatment and follow up visits.
6. Ensure the completion of treatment for all patients under MDT, especially in large urban
areas. Patients likely to be irregular should be provided with the option of Accompanied-
MDT.
7. Enhance the case detection among female, especially in the states where the female
detection ratio is low.
8. Update leprosy records and registers every month according to the standard definitions,
of leprosy case, cured and defaulter.
9. Improve the MDT stock management at health facility and district levels by supply based
on case load under treatment for all categories to prevent drug damage/expiry. Maintain
buffer stocks for drugs near 3 months.
10. Re-deploy excess of MDT to other blocks/districts, based on the patient-months indicator
and destroy expired MDT drugs.
11. Leprosy Training (especially of the freshly recruited staff) should be given emphasis.
Expertise of erstwhile NLEP vertical staff and DTST members should be used in giving
on-the-job training to staff regarding diagnosis, MDT stock management and
maintenance of records and reports.
12. All the personnel (Teaching Hospital, Urban health facilities and skin specialist) involved
in leprosy control activities should follow the Government of India Guidelines on fixed
duration MDT treatment (12 doses (pulses) for MB and 6 doses (pulses) for PB cases.
13. All the managers should regularly monitor the leprosy programme through essential SIS
indicators and provide constructive feedback for improvement.
14. Health workers should play a more active role in not only spreading correct knowledge
related to leprosy but also bringing about positive change in attitude and behaviour of
community members.
15. Ensure the completeness, timeliness and accuracy of reporting.

1
LEPROSY ELIMINATION MONITORING IN INDIA, 2004 INTRODUCTION
Multi-drug therapy (MDT) is recognised as a major technological improvement in leprosy control. Its impact on disease prevalence has led to the concept at eliminating leprosy as a public health problem with the assumption that below a given level of prevalence, disease transmission will be partially or totally interrupted.
At the global level, the leprosy elimination programme is a success story. During the last 15-20 years, the global leprosy caseload has decreased from more than 10 million to about 0.5 million by December 2003. In 1985, there were 122 countries with a national prevalence > 1 case per 10 000 population. By 2003, 113 of these countries had attained the leprosy elimination goal, leaving only 9 countries to achieve this objective.
The South-East Asia Region, with a leprosy prevalence of 1.9/10 000 as on March 2004, remains the only WHO region in the world that has yet to achieve the elimination goal. However, the SEA Region has made noteworthy progress. Over 90% of the approximately 13.8 million leprosy cases detected and cured globally, are from the South-East Asia Region, and more than 10 million of them from India. At the regional level, the prevalence of leprosy has declined by 92% over an 18-year period from 1985, when multi-drug therapy was introduced in phases, in all countries of the Region.
Seven of the eleven countries of the SEA Region had attained the elimination goal by the original target date of December 2000, and have maintained it. Myanmar achieved the goal as of January 2003. Three remaining countries – India, Nepal and Timor Leste – are making concerted efforts to reach the elimination goal by December 2005.

2
In spite of the above achievements, it is a matter of concern that the Region accounted for 68.5% of the globally registered and 81% of the new cases detected in 2003. Within the Region, India accounted for 88% of the prevalence and 91% of the new case detection in 2003.
The Government of India launched the leprosy control activities in 1955. In 1983, a new strategy based on MDT was introduced, and the programme was renamed as National Leprosy Eradication Programme (NLEP). The first World Bank supported project was introduced in 1993 with an aim to strengthen infrastructure and facilities for leprosy control. The national prevalence of leprosy declined from 57.6/10,000 in 1983 to 2.4/10,000 in March 2004.
The States of Andhra Pradesh, Bihar, Chhattisgarh, Jharkhand, Karnataka, Madhya
Pradesh, Maharashtra, Orissa, Tamil Nadu, Uttar Pradesh, and West Bengal contribute 91% of the patient load in the country.
The second phase of the World Bank supported project during 2001-2004, was envisaged to: 1) consolidate the achievements of leprosy elimination, 2) decentralise the decision making to States/Districts, 3) integrate the programme with general health services and, 4) develop an adequate surveillance system to monitor progress and initiate timely corrective actions. Is elimination of leprosy feasible?
Leprosy is one of the few infectious diseases which meets the strict criteria for elimination: 1) There is only one source of infection, infected human beings, 2) Practical and simple diagnostic tools are available - leprosy can be diagnosed on clinical signs alone, 3) The availability of an effective intervention to interrupt its transmission - Multi-drug therapy (MDT drugs for which no resistance has been reported), 4) Under natural conditions, incident cases (new cases in which the disease has recently developed) make up only a small fraction of the prevalence pool. Below a certain level of prevalence, any resurgence of the disease is very unlikely, 5) unlike tuberculosis, the leprosy situation does not appear to be adversely affected by HIV infection. What does eliminating leprosy by 2005 as a public health problem mean?
Elimination means reduction of case transmission to a predetermined very low level i.e. prevalence rate of less than 1 case per 10,000 population by end of the 2005. However new cases will continue to occur in small numbers beyond 2005 as a result of the disease making appearance in individuals who acquired their infection several years earlier due to the long incubation period of the disease. But due to the increasing coverage of MDT to previously uncovered areas together with improving community awareness, the number of new cases is expected to fall steadily. Key elements of the final push strategy
The key elements of the final push strategy are: 1) Integrate leprosy services in the general health services to improve access to treatment, 2) Capacity building to enable general health care staff to diagnose and treat leprosy, 3) Improve logistics to ensure adequate stocks of MDT at health centers, 4) Change societal perception of leprosy and motivate people to seek timely treatment, 5) Ensure high cure rates through flexible and patient friendly drug delivery systems, 6) Simplify monitoring to keep track of progress towards elimination.
3
In order to get a clear picture of the leprosy situation in the country, a Leprosy Elimination Monitoring (LEM) exercise, supported by WHO, was planned for the second phase of the project, as an additional tool for assessing progress.
The present LEM exercise, which is a follow-up of LEM 2002 and 2003, was carried out
in a standardized way across the country from 17th May to 14th June, 2004 and the validation exercise was done from 17th June to 3rd July 2004 (in Jharkhand and Orissa it was carried out from 1-15th September, 2004), with the aim to assist the decision-makers and programme managers to assess the progress towards leprosy elimination.
This report presents the methodology used and the global findings of the 13 priority
states. Separate reports for each state covered by the LEM will also be available.
SPECIFIC OBJECTIVES
I. To assess NLEP activities on specified elimination indicators in various states of the country.
II. To assess the progress of integration of leprosy control activities with the general health
care system, on specified key indicators.
III. To assess the quality of MDT services provided at field level.
IV. To assess the implementation of the Simplified Information System (SIS).
V. To determine community awareness about leprosy on specified key indicators.
VI. To assess the validity of the diagnosis, among newly detected cases.
VII. To identify potential issues of programme implementation and make practical recommendations for further improvement.
METHODOLOGY
The WHO document “Leprosy Elimination Monitoring Guidelines for Monitors 2000” was used as a reference. It has been adapted to meet the Indian context. In general, the LEM 2004 used the same methodology of the LEM 2003. However, a few modifications were made:
• the cut-off point for selection of districts (high or low endemic) in the states was at a prevalence rate of 3.5 per 10,000 instead of 5 per 10,000 that was used in 2003 due to overall decline in the prevalence of leprosy;
• some new indicators were added, related to: (1) completeness and timeliness of the monthly progress report, and (2) discrepancy of MDT stock mentioned in the drug register and district stores.
Sampling of districts for LEM
The LEM survey was undertaken in the 13 identified states. Districts of each state were divided into two strata according to the prevalence rate of leprosy (= & < 3.5/10,000). A sample, proportional to the size of the population and the number of leprosy patients, of 20% of the total districts in each stratum per state was considered to be representative of the state.

4
A total of 77 districts were selected. The final selection of districts was as follows:
Selected Districts State
PR = 3.5 PR < 3.5
Total selected Districts
Andhra Pradesh - Chittoor, Guntur, Kurnool,
Rangareddy 4
Bihar Araria, Darbhanga, Kishanganj,
Patna
Jahanabad, Katihar, Nalanda,
Saran 8
Chhattisgarh Bilaspur, Kawardha Bastar
Kanker 4
Delhi Central, South East 3
Jharkhand Bokaro, Dhanbad, Paschim Singhbhoom, Ranchi Garhwa, Hazaribagh 6
Karnataka Koppal Bagalkot, Bangalore (R), Chamarajnagar, Hassan, Mysore 6
Madhya Pradesh Shahdol Balaghat, Datia, Jabalpur,
Narsingpur, Sehore 6
Maharashtra Bhandara, Gondia,
Nanded Budane, Latur, Sangli 6
Orissa Angul, Ganjam Balasore, Cuttack, Kendrapara, Mayurbhanj 6
Tamil Nadu --
Cuddalore, Kanchipuram, Podukkottai, Theni, Trichunapalli, Virudhnagar
6
Uttar Pradesh Bareilly, Chittrakoot, Gorakhpur, Kanpur (Dehat), Khushinagar, Shajanpur
Muzaffarnagar, Sant Ravidas Nagar, Agra, Ambedkar Nagar, Banda, Etawah, Ghazipur, Lucknow
14
Uttaranchal Haridwar Dehradun, Pauri, Udhamsingh Nagar, 4
West Bengal Bankura, Kolkotta 24-Parganas (N), Hooghly 4
Total 28 49 77
In each district, at least three health facilities in rural areas and one in urban area were
randomly selected. For LEM purposes, the definition of a health facility, in rural areas, was the primary health centre (PHC). In urban areas, health facilities were hospitals and dispensaries. In high prevalence districts (= 3.5/10,000), a sample of at least 3 PHCs was visited. However, in low prevalence districts, the number of health facilities visited was at least 5 PHCs, to reach or get close to the required sample size. The selection of rural health facilities was done at district level by using sample proportional to population and number of leprosy cases. In the urban areas, all health facilities were listed at the district headquarter, and one health facility was selected by simple random sampling.

5
Sampling of districts for validation of diagnosis:
For validation of diagnosis, 12 states (excluding Uttaranchal) were selected. In each of the 12 states, a list of districts with number of new cases detected during 2003-04 was prepared in the descending order for number of cases. This was to ensure the probability of selecting the districts that would yield enough number of cases for the study. From among the top five districts detecting reasonably large number of cases, one was selected by simple random method. The selected districts are: Chittor (Andhra Pradesh.), Gaya (Bihar), Durg (Chhattisgarh), North West (Delhi), Chaibasa (Jharkhand), Bangalore Urban (Karnataka), Shahdol (Madhya Pradesh), Jalgaon (Maharashtra), Mayurbhanj (Orissa), Thiruvannamalai (Tamil Nadu), Allahabad (Uttar Pradesh), Murshidabad (West Bengal). The validation study was carried out separately in two states (Jharkhand and Orissa) from 1st -15th September 2004, due to the late MLEC-V implementation in these two states. Sample size for LEM survey In order to give an estimate of the required information needed per district, sample for LEM data collection was as follows:
• Reviewing at least 200 patient records for indicators on prevalence and case finding
activities (If number less, then review all the available case records for the year); • Reviewing at least 200 patients records taken out of treatment registers and/or individual
records for accessibility of MDT and case holding; • Interviewing at least 50 patients under treatment, for delay in diagnosis and accessibility to
MDT; • Interviewing at least 100 heads of household/other adult members of the household per
health facility in rural and urban areas/slums; • For validation of diagnosis, all newly detected PB cases in the past 1 month and all newly
detected MB cases in the past 2 months were re-examined by the validators, in one randomly sampled district per high endemic state.
Data collection
All the necessary information was collected from existing patient records, leprosy
registers, reporting forms and stock bin cards in selected health facilities, as well as annual data as reported by the selected districts and states. In addition, interviews of a sample of patients, as well as a sample of community members were conducted for the computation of several indicators. Clinical examination of new cases detected in the district was done for validation of diagnosis. Data was collected related to following indicators: • Case finding activities: all new patients diagnosed as leprosy during the past 12 months
from the time of the monitor’s visit. • Prevalence: all patients under MDT treatment as on 31st March 2004. • Case holding: data from a cohort of registered patients: cohort of MB patients defined
as patients having started MB MDT during the period from 1st May 2001 to 30th April, 2002; and cohort of PB patients having started PB MDT from 1st January 2002 to 31st December 2002.
• Awareness in leprosy: interviews of head of households/adult members of household in the village/urban slum/households.
6
• Validation of diagnosis: Standardised clinical examination of new leprosy cases diagnosed in various health facilities in the selected districts.
In addition, reported prevalence and detection data during the past 12 months was collected from the Annual Reports at the selected health facilities as well as 2003-04 annual progress reports from selected districts and states. Specific indicators Standardised key indicators were identified to assess the above-mentioned objectives and are categorised as follows:
a) Elimination indicators: assess the validity of information on prevalence, and detection;
b) Integration of MDT services: assess the availability and accessibility of MDT services, and the implementation of the Simplified Information System (SIS);
c) Quality of MDT services: assess the case-holding, quality of blister-packs and reporting system;
d) Awareness of leprosy: assess community’s awareness of leprosy symptoms, treatment and cause;
e) Validity of diagnosis: assess the quality of diagnosis, wrong diagnosis, wrong grouping (PB as MB, or MB as PB), Re-Registration of PB or MB cases, Non Existent (fake) cases.
Data collection and compilation forms
Appropriate tools were developed, tested and used for data collection from various levels and for interviews of leprosy cases and community members.
A total of 38 monitor teams were involved in the field data collection. Each monitoring
team comprised of two monitors (one from NIHFW and the other from WHO/ILEP) and covered two districts (3 in Delhi) and the corresponding number of selected PHCs.
The monitors were given three days orientation training at NIHFW before they went to
the states for data collection. In addition to a training module, a field guide for monitors was also distributed during the training sessions.
The validation of diagnosis of leprosy was done by 12 different teams, each comprising of two validators, independently during the period 17th June to 3rd July 2004. Due to late MLEC-V implementation in Jharkhand and Orissa, the validation study was carried out separately in these two states from 1st -15th September, 2004. A 2-day standardization workshop was held for the validators, at NIHFW New Delhi, prior to the field work.

7
Description of the sample, LEM 2004 According to the methodology presented above, the LEM 2004 covered the following:
Parameter Andh
ra P
rade
sh
Biha
r
Chat
tisga
rh
Delh
i
Jhar
khan
d
Karn
atak
a
Mad
hya
Prad
esh
Mah
aras
htra
Oris
sa
Tam
il Na
du
Utta
r Pra
desh
Utta
ranc
hal
Wes
t Ben
gal
Tota
l
No. of Rural health facilities visited
23 30 20 4 26 58 34 48 28 45 61 26 15 418
No. of Urban health facilities visited
3 8 3 19 2 10 11 3 6 8 12 4 11 100
No. of patients interviewed 223 549 191 151 350 340 367 491 399 321 756 204 139 4481
No. of community members interviewed
775 950 363 324 633 1020 849 1230 783 827 1831 667 548 10800
Total MB records reviewed
223 3241 835 442 2069 1307 969 952 1205 505 3847 403 875 16873
Total PB records reviewed
769 4250 1104 462 2444 820 965 1777 1626 1090 3950 547 783 20587
No. of MDT blister packs examined at Districts
8279 7551 2618 1900 3627 3805 1461 9048 3249 1735 13758 2081 3013 62125
No. of MDT blister packs examined at Health Facilities
1391 10622 3440 5261 6206 2146 2477 6058 6148 6312 15214 3076 3725 72076
No. of leprosy cases seen by both validators
54
158
121
47
109
59
46
152
95
44
130
NA
66
1081
The LEM 2004 covered 518 health facilities of which 418 were in rural areas. Large numbers of patients (4481) and community members (10800) were interviewed for quality of MDT services and awareness of leprosy respectively. A large number of records were reviewed to assess case holding indicators as well quality of recording. A huge number of MDT blister packs were also examined by the monitors to assess the quality of MDT stock management at the state, district and health facility stores.

8
Results The LEM 2004 findings in various states are presented in the following tables and
graphs: I. Elimination Indicators
Table - 1.1
Prevalence Rate & New Case Detection Rate in various states as per LEM 2004
Indi
cato
r
Andh
ra
Prad
esh
Biha
r
Chat
tisga
rh
Delh
i
Jhar
khan
d
Karn
atak
a
Mad
hya
Prad
esh
Mah
aras
htra
Oris
sa
Tam
il Na
du
Utta
r Pra
desh
Utta
ranc
hal
Wes
t Ben
gal
Tota
l
Prevalence Rate 1.7 5.2 4.6 4.0 4.6 1.3 2.0 3.0 3.0 1.4 3.5 2.0 2.9 3.1
NCDR 4.1 7.9 5.9 3.2 7.1 2.1 2.6 4.3 5.1 2.4 4.7 3.3 2.4 4.5
P/D ratio 0.4 0.7 0.8 1.3 0.7 0.6 0.8 0.7 0.6 0.6 0.7 0.6 1.2 0.7
Source: Annual Reports of the districts as provided to monitors
Based on the annual reports of all the districts covered by the LEM 2004, the overall PR among the 13 priority states was 3.1 per 10,000. Only one state (Bihar) had a PR over 5 per 10,000).
The Prevalence/Detection ratio was above one in Delhi and West Bengal, highlighting recycling of cases and the need for cleaning of registers.
Based on the annual State reports provided to the Central Leprosy Division, Government
of India, the National Prevalence Rate (PR) was 2.4 per 10,000, as on 31st March 2004. The states of Andhra Pradesh, Karnataka, Madhya Pradesh, Tamil Nadu and Uttaranchal had PR less than the national average and the rest of the LEM states had PR more than the national average.
The population of the 13 states included in the 2004 LEM represented 76.2% of the national population, but 94% of the registered cases and 94.5% of the new cases detected in 2003-2004 in the country. Three states – Uttar Pradesh, Maharashtra and Bihar – which all together represent 34% of the total population, contributed to 51% of the prevalence and the detection.

9
Overall, there is a relatively good correlation, of PR results from state annual reports and PR results from reports of districts covered by the LEM 2004, as shown in the following graphs: LEM 2004 findings Annual States report
As per LEM 2004 sample, the NCDR per 10,000 was lowest in Karnataka (2.1) and
highest in Bihar (7.9). It was also high in Jharkhand (7.1%), Chhattisgarh (5.9%) and Orissa (5.1%). NCDR of less than 5 was found in Uttar Pradesh (4.7%), Maharashtra (4.3%), Andhra Pradesh (4.1%), Uttaranchal (3.3%), Delhi (3.2%), Madhya Pradesh (2.6%), West Bengal (2.4%), Tamil Nadu (2.4%), and Karnataka (2.1%). LEM 2004 findings Annual States reports
For Detection also, there was a relatively good correlation of results from LEM survey and annual State reports.

10
Table – 1.2
Case Finding Activities in various Districts covered by the LEM
a) Grade-2 Disability, Median delay in diagnosis and Re-registration of MB cases:
Indicator
Andh
ra
Prad
esh
Biha
r
Chat
tisga
rh
Delh
i
Jhar
khan
d
Karn
atak
a
Mad
hya
Prad
esh
Mah
aras
htra
Oris
sa
Tam
il Na
du
Utta
r Pra
desh
Utta
ranc
hal
Wes
t Ben
gal
Tota
l
% new cases with grade 2 disability
1.2 0.7 1.8 3.7 1.4 0.8 1.6 0.4 1.7 1.6 1.3 1.0 3.5 1.4
Median delay in diagnosis (months)
6.0 11.0 6.0 12.0 9.0 12.0 12.0 3.0 8.0 6.0 7.0 10.0 6.0 7.0
Proportion of re-registration of MB cases
31.8
20.6
12.0
42.9
9.5
18.6
3.0
22.5
41.7
78.9
30.2
NA
34.5
25.5
Source: Annual reports of districts (2003-2004) as provided to survey teams, interview of leprosy cases and observation of validators Proportion of disability grade-2 among new cases
In general, disability is related to delay in diagnosis and/or re-registration of old cases. The proportion of disability among new cases ranged from 0.4% in Maharashtra to 3.7% in Delhi.
The states of Delhi and West Bengal continued to have the highest proportion of grade-II disability among new cases in 2003-04. But these two states also had the highest proportion of re-registration of MB cases, which probably was the main contributing factor (the high proportion of re-registered MB cases of Tamil Nadu [78.9%] has to be taken cautiously due to a small sample).
Based on the response of the leprosy cases under treatment, the median delay in diagnosis was 7 months; the range being from 3 months (Maharashtra) to 12 months (Delhi, Karnataka and Madhya Pradesh).
Proportion of Grade-2 disability among new cases, India, LEM 2004
0.4
0.7
0.8
1
1.2
1.3
1.4
1.6
1.6
1.7
1.8
3.5
3.7
Maharashtra
Bihar
Karnataka
Uttaranchal
Andhra Pradesh
Uttar Pradesh
Jharkhand
Madhya Pradesh
Tamil Nadu
Orissa
Chattisgarh
West Bengal
Delhi
11
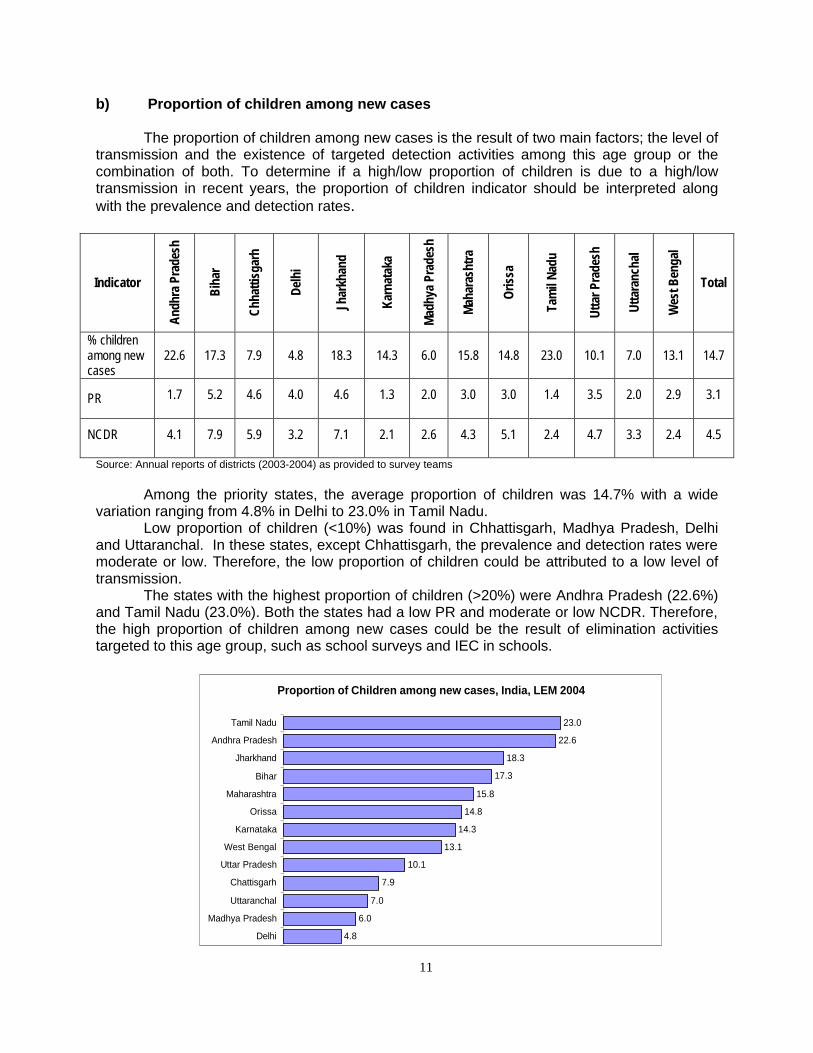
b) Proportion of children among new cases
The proportion of children among new cases is the result of two main factors; the level of transmission and the existence of targeted detection activities among this age group or the combination of both. To determine if a high/low proportion of children is due to a high/low transmission in recent years, the proportion of children indicator should be interpreted along with the prevalence and detection rates.
Indicator
Andh
ra P
rade
sh
Biha
r
Chha
ttisg
arh
Delh
i
Jhar
khan
d
Karn
atak
a
Mad
hya
Prad
esh
Mah
aras
htra
Oris
sa
Tam
il Na
du
Utta
r Pra
desh
Utta
ranc
hal
Wes
t Ben
gal
Total
% children among new cases
22.6
17.3
7.9
4.8
18.3
14.3
6.0
15.8
14.8
23.0
10.1
7.0
13.1
14.7
PR 1.7 5.2 4.6 4.0 4.6 1.3 2.0 3.0 3.0 1.4 3.5 2.0 2.9 3.1
NCDR
4.1 7.9 5.9 3.2 7.1 2.1 2.6 4.3 5.1 2.4 4.7 3.3 2.4 4.5
Source: Annual reports of districts (2003-2004) as provided to survey teams
Among the priority states, the average proportion of children was 14.7% with a wide variation ranging from 4.8% in Delhi to 23.0% in Tamil Nadu.
Low proportion of children (<10%) was found in Chhattisgarh, Madhya Pradesh, Delhi and Uttaranchal. In these states, except Chhattisgarh, the prevalence and detection rates were moderate or low. Therefore, the low proportion of children could be attributed to a low level of transmission.
The states with the highest proportion of children (>20%) were Andhra Pradesh (22.6%) and Tamil Nadu (23.0%). Both the states had a low PR and moderate or low NCDR. Therefore, the high proportion of children among new cases could be the result of elimination activities targeted to this age group, such as school surveys and IEC in schools.
Proportion of Children among new cases, India, LEM 2004
4.8
6.0
7.0
7.9
10.1
13.1
14.3
14.8
15.8
17.3
18.3
22.6
23.0
Delhi
Madhya Pradesh
Uttaranchal
Chattisgarh
Uttar Pradesh
West Bengal
Karnataka
Orissa
Maharashtra
Bihar
Jharkhand
Andhra Pradesh
Tamil Nadu

12
c) Proportion of MB cases among new cases
Indicator Andh
ra
Prad
esh
Biha
r
Chat
tisga
rh
Delh
i
Jhar
khan
d
Karn
atak
a
Mad
hya
Prad
esh
Mah
aras
htra
Oris
sa
Tam
il Na
du
Utta
r Pra
desh
Utta
ranc
hal
Wes
t Ben
gal
Total
% MB cases among new cases
19.2
34.1
46.1
55.4
44.1
40.5
56.8
31.3
39.0
30.1
42.6
33.1
47.8
38.3
Proportion of Re-registration of MB cases
31.8 20.6 12.0
42.9 9.5 18.6 3.0 22.5 41.7 78.9 30.2 NA 34.5 25.5
Source: Annual report of districts (2003-2004) as provided to survey teams, and observation of validators
Among the states, the proportion of MB cases ranged from 19.2% in Andhra Pradesh to 56.8% in Madhya Pradesh. The States of Chhattisgarh, Delhi, Jharkhand, Karnataka, Uttar Pradesh and West Bengal had high proportion of MB cases among new cases (more than 40%). The high proportion of MB cases in Delhi, Uttar Pradesh and West Bengal goes along the high proportion of re-registration of MB cases (> 30%) in those states. However, the high proportion of MB cases in Madhya Pradesh was not related to re-registration of MB cases, which was the lowest (3%).
Proportion of MB cases among new cases, India LEM 2004
19.2
30.1
31.3
33.1
34.1
39
40.5
42.6
44.1
46.1
47.8
55.4
56.8
Andhra Pradesh
Tamil Nadu
Maharashtra
Uttaranchal
Bihar
Orissa
Karnataka
Uttar Pradesh
Jharkhand
Chattisgarh
West Bengal
Delhi
Madhya Pradesh

13
d) Proportion of Female among new cases
Indicator An
dhra
Pr
ades
h
Biha
r
Chat
tisga
rh
Delh
i
Jhar
khan
d
Karn
atak
a
Mad
hya
Prad
esh
Mah
aras
htra
Oris
sa
Tam
il Na
du
Utta
r Pra
desh
Utta
ranc
hal
Wes
t Ben
gal
Tota
l
% female cases among new cases
45.0
39.0
32.9
17.5
34.4
38.3
31.9
39.2
31.6
26.9
31.0
39.6
34.8
35.1
Source: Annual report of districts (2003-2004) as provided to survey teams
The average proportion of female in these states was 35.1%. However, wide differences existed among the states, varying from 17.5% in Delhi to 45.0% in Andhra Pradesh.
There is no epidemiological reason for explaining those variations among states. These differences could be explained by various level of awareness among female in the various states included in the LEM. Ratio of female health workers involved in leprosy could also be a factor, if proven significantly different from state to state.
However, the low proportion of female in Delhi could be explained by the migration factor. More males come to Delhi looking for jobs, and among them more cases of leprosy belong to the poor migratory population.
Proportion of Female among new cases, India, LEM 2004
17.5
26.9
31.0
31.6
31.9
32.9
34.4
34.8
38.3
39.0
39.2
39.6
45.0
Delhi
Tamil Nadu
Uttar Pradesh
Orissa
Madhya Pradesh
Chattisgarh
Jharkhand
West Bengal
Karnataka
Bihar
Maharashtra
Uttaranchal
Andhra Pradesh

14
e) NCDR per 10,000 among Scheduled Caste and Scheduled Tribe Population
Indicator
Andh
ra P
rade
sh
Biha
r
Chat
tisga
rh
Delh
i
Jhar
khan
d
Karn
atak
a
Mad
hya
Prad
esh
Mah
aras
htra
Oris
sa
Tam
il Na
du
Utta
r Pra
desh
Utta
ranc
hal
Wes
t Ben
gal
Tota
l
NCDR among SC
5.1 12.6 8.3 NA 13.2 3.5 2.7 5.5 5.3 1.2 4.9 5.2 1.3 5.4
NCDR among ST
5.1 15.4 2.7 NA 13.9 5.9 2.7 5.1 6.2 NA 5.8 5.1 3.5 5.7
NCDR among others
3.9 7.2 7.5 NA 4.9 1.7 2.5 4.0 4.7 2.1 4.7 2.8 2.6 4.2
Source: Annual report of districts (2003-2004) as provided to survey teams and 2001 census data (GoI)
The objective of calculating NCDR among Scheduled Caste and Scheduled Tribe populations was to find out if these sub groups of the population were more at risk of leprosy and to assess their coverage by the NLEP activities. Scheduled Caste (SC)
The overall NCDR of 5.4/10,000 among SC was higher than the NCDR among non scheduled caste and non scheduled tribe population (others NCDR 4.2). NCDR among scheduled caste population was lowest in Tamil Nadu (1.2) and highest in Jharkhand (13.2).
In Jharkhand, Karnataka and Uttaranchal, the SC detection rate was about 2 times
higher then non-SC/ST (General) segment of the population. These findings will need to be further investigated.
The states with higher NCDR among SC population may be the result of more attention
provided to the SC population or a higher risk of getting disease among SC population or a combination of both factors.
The states with lower NCDR among SC population (Tamil Nadu and West Bengal) as compared to others (non-SC and non-ST) population, could be results of a lower coverage of the SC population with MDT services. Scheduled Tribe (ST)
The NCDR among scheduled tribe was 5.7 per 10,000 for all the states covered in LEM exercise. It was lowest in Chhattisgarh and Madhya Pradesh (2.7) and highest in Bihar (15.4).
In Bihar, Jharkhand and Karnataka ST detection rate was 2 time higher than non-SC/ST
(General) segment of the population
The states with high NCDR among ST population may be due to more attention being provided to ST population or a higher risk of getting disease among ST or a combination of both.
The States with lower NCDR among ST may be due to inadequate coverage of ST population with MDT services or due to scattered ST population or lower risk.

15
Detection rates among SC population and non-SC/ST population, India, LEM 2004
13.2
12.6
8.3
5.5
5.3
5.2
5.1
4.9
3.5
2.7
1.3
1.2
4.9
7.2
7.5
4.0
4.7
2.8
3.9
4.7
1.7
2.5
2.6
2.1
Jharkhand
Bihar
Chhattisgarh
Maharashtra
Orissa
Uttaranchal
Andhra Pradesh
Uttar Pradesh
Karnataka
Madhya Pradesh
West Bengal
Tamil Nadu
Delhi
SC non SC/ST
Not Available
Detection rates among ST population and non-SC/ST popualtion, India, LEM 2004
15.4
13.2
6.2
5.9
5.8
5.1
5.1
5.1
3.5
2.7
2.7
7.2
4.9
4.7
1.7
4.7
4
3.9
2.8
2.6
2.5
7.5
Bihar
Jharkhand
Orissa
Karnataka
Uttar Pradesh
Maharashtra
Andhra Pradesh
Uttaranchal
West Bengal
Madhya Pradesh
Chhattisgarh
Tamil Nadu
Delhi
ST non SC/ST
Not availableNot available

16
Table – 1.3
Comparison of Reported Prevalence and Prevalence Rate calculated after applying Standard Definitions
Indicator An
dhra
Pr
ades
h
Biha
r
Chat
tisga
rh
Delh
i
Jhar
khan
d
Karn
atak
a
Mad
hya
Prad
esh
Mah
aras
htra
Oris
sa
Tam
il Na
du
Utta
r Pra
desh
Utta
ranc
hal
Wes
t Ben
gal
Tota
l
Population covered by the LEM 17
2556
2
7923
449
2522
511
NA
5257
311
2755
467
5003
521
3745
138
3746
647
5082
632
1581
0325
2926
900
4232
750
6073
2213
Reported number of cases as on 31st March 2004 in these health facilities:
649 4094 1116 1511 3174 673 1012 1296 998 720 5244 675 1087 22249
Cases after applying the standard definitions
385 4033 1062 1428 3110 536 982 1239 982 655 5256 664 1034 21366
Reported prevalence in visited districts in March 2004:
3.8 5.2 4.4 NA 6.0 2.4 2.0 3.5 2.7 1.4 3.3 2.3 2.6 3.7
Prevalence after applying standard definitions:
2.2 5.1 4.2 NA 5.9 1.9 2.0 3.3 2.6 1.3 3.3 2.3 2.4 3.5
Source: Treatment registers and other records of health facilities visited by survey teams.
The reported prevalence rate was compared with prevalence rate calculated after applying standard definitions of a case, a defaulter and fixed duration of treatment, in the health facilities visited in various States included in the survey.
The data from treatment register and other records at health facilities visited by monitors
were analyzed. Overall, a PR difference of 0.2 (3.7 versus 3.5) was found, in the areas covered by the monitors during the LEM survey. This difference should be considered significant when applied to the entire country. The two rates were nearly equal for most of the states except in the state of Andhra Pradesh and Karnataka. In Andhra Pradesh, a PR difference of 1.6 was observed (3.8 versus 2.2), reflecting a very poor maintenance of registers, the same remark also applies to Karnataka, with a 0.5 difference (reported PR was 2.4 and 1.9 after applying standard definitions). The minor differences observed in the other states are probably due to recent instructions given to the states for cleaning and updating the leprosy registers and records.
These findings stress once again the importance of applying the standard definitions at field level and the necessity to clean/update the registers regularly, once a month at the time of making the Monthly Progress Report.

17
Conclusions on case finding activities
Prevalence and detection rates were affected by the reporting system and the quality of diagnosis. When a significant proportion of patients were wrongly diagnosed as leprosy cases, it influenced the prevalence and the detection. When a significant proportion of old cases were re-registered as new cases, it affected the new case detection rate (NCDR).
Standard procedures for clinical diagnosis, including the test of sensory loss and nerve thickening should be applied by all health workers involved in the diagnosis of leprosy. The standard definition of a new case (defined as a patient who has never received any leprosy treatment in the past, anywhere), should be strictly applied by all health workers, by asking the simple question “have you taken any MDT treatment in the past?” This will avoid re-registration and artificial inflation of detection rate.
The prevalence was also influenced by the quality of record keeping. As shown by the comparison of reported prevalence and prevalence after applying the standard definitions (new case, defaulter, released from treatment), the reported prevalence was significantly higher in some states (Andhra Pradesh, Karnataka). This finding emphasizes the necessity of cleaning/updating the registers on a monthly basis, at the time of making the monthly report.
The trends of disability grade-2 have been steadily declining in all the states over the past years. However, early diagnosis and treatment should bring down even more this parameter. Here also, re-registration of old cases artificially inflated this indicator.
The analysis of the proportion of children among new cases, along with the prevalence and detection rates, showed that the states of Bihar, Jharkhand and Orissa still have a relatively high level of transmission, compared to the other states
Regarding the proportion of females among new cases, the LEM findings showed wide differences among the 13 states (from 17.5 to 45.0%). No epidemiological reason can explain these variations. Level of awareness among female, varying from state to state, might be a factor; but this would need to be further investigated.
NCDR among SC and ST as compared with NCDR among non ST and non SC (General) population, was higher in many states, but mostly in Bihar and Jharkhand with possibility of a higher risk among SC and ST or special detection activities targeted among these groups. On the contrary, the NCDR among ST in Chhattisgarh was much lower than in the general population, which needs to be further investigated.

18
II. Integration of MDT services with General Health Services
Table – 2.1
Availability of MDT Services at Health Facilities visited in various States included in the LEM survey
Indicator
Andh
ra
Prad
esh
Biha
r
Chat
tisga
rh
Delh
i
Jhar
khan
d
Karn
atak
a
Mad
hya
Prad
esh
Mah
aras
htra
Oris
sa
Tam
il Na
du
Utta
r Pr
ades
h
Utta
ranc
hal
Wes
t Ben
gal
Tota
l
Proportion (%) of Health Facilities where/with: Diagnosis made and treatment initiated by GHS
26.9 97.4 56.5 73.9 100 86.8 72.5 74.8 88.2 79.2 96.3 63.6 96.3 80.1
Providing MDT services on all working days
80.8 89.5 100 91.3 96.4 95.6 80.0 97.1 91.2 52.8 97.5 100 81.5 89.6
Treatment register maintained
100 97.4 87.0 100 100 100 95.0 100 100 92.5 100 97.7 100 98.1
MDT drug register maintained
100 92.1 87.0 100 100 97.1 95.0 100 100 86.8 92.6 97.7 96.3 95.7
Source: Observations of monitors at Health Facilities visited by them.
a) Proportion of health facilities where the diagnosis was made and treatment initiated:
Overall, in 80% of health facilities, the diagnosis was being made and the MDT treatment initiated by general health staff/Medical Officer. Wide variations were observed from state to state. Regarding this important indicator of integration and a proxy indicator for coverage, three categories of states can be identified:
i. States where integration and coverage is good, with >85% of health facilities visited by the monitors providing leprosy diagnosis and initiating treatment. Those states are Bihar, Jharkhand, Karnataka, Orissa, Uttar Pradesh, and West Bengal.
ii. States where this indicator was from 60% to 84%, in which consolidation efforts should be
made to improve the proportion of health facilities providing these two services. These states are: Delhi, Madhya Pradesh, Maharashtra, Tamil Nadu, and Uttaranchal.
iii. States where below 60% of visited health facilities were providing diagnosis and treatment,
highlighting the urgent need of a stronger integration mechanism. These states were Andhra Pradesh and Chhattisgarh.

19
Proportion of Health Facilities where Diagnosis made and treatment initiated by GHS, India, LEM 2004
26.9
72.5
73.9
74.8
79.2
86.8
88.2
96.3
96.3
97.4
100
56.5
63.6
Andhra Pradesh
Chattisgarh
Uttaranchal
Madhya Pradesh
Delhi
Maharashtra
Tamil Nadu
Karnataka
Orissa
Uttar Pradesh
West Bengal
Bihar
Jharkhand
b) Proportion of health facilities providing MDT services on all working days: On the average, 89.6% of visited health facilities were observed to provide MDT services on all working days. This was lowest in Tamil Nadu (52.8%) and highest in Chhattisgarh and Uttaranchal (100%). This proportion was above 80.0% in all other health facilities in various states. The state results of this indicator were consistent with the previous indicator’s results.
Proportion of Health Facilities providing MDT services on all working days,India, LEM 2004
52.88080.881.5
89.591.291.3
95.696.497.197.5100100
Tamil Nadu
Madhya Pradesh
Andhra Pradesh
West Bengal
Bihar
Orissa
Delhi
Karnataka
Jharkhand
Maharashtra
Uttar Pradesh
Chattisgarh
Uttaranchal

20
c) Proportion of health facilities with treatment register maintained at health facilities
Overall, in 98.1% of health facilities visited, the leprosy treatment register was found maintained by general health care staff. In all the others, this activity was still undertaken by the vertical staff. Variations ranged from 87.0% in Chhattisgarh to 100% in Andhra Pradesh, Delhi, Jharkhand, Karnataka, Maharashtra, Orissa, Uttar Pradesh, and West Bengal.
d) Proportion of health facilities with drug register maintained:
Overall, in 95.7% of health facilities, the pharmacist general health care staff was maintaining the MDT drug register, varying from 87.0% in Chhattisgarh and Tamil Nadu to 100% in Andhra Pradesh, Delhi, Jharkhand, Maharashtra and Orissa.
The states of Chhattisgarh and Tamil Nadu should make some efforts in record keeping at the health facility level.

21
e) Proportion of health facilities providing Accompanied-MDT:
Indicator
An
dh
ra P
rad
esh
Bih
ar
Ch
atti
sgar
h
Del
hi
Jhar
khan
d
Kar
nat
aka
Mad
hya
Pra
des
h
Mah
aras
htr
a
Ori
ssa
Tam
il N
adu
Utt
ar P
rad
esh
Utt
aran
chal
Wes
t B
eng
al
To
tal
% of health facilities visited providing *accompanied MDT services
46.2 81.6 34.8 100 71.4 60.3 85.0 27.2 52.9 62.3 76.5 75.0 33.3 59.9
Source: Observations of monitors at Health Facilities visited by them. *Definition of Accompanied MDT used during the LEM 2004: – Advance MDT packs given to leprosy patients for more than one month.
On the average 59.9% of health facilities were providing A-MDT, as an option ranging
from 27.2% in Maharashtra to 100% in Delhi. Below 50% of health facilities providing A-MDT were found in Andhra Pradesh, Chhattisgarh and West Bengal.
Proportion of Health Facilities providing Accompanied-MDT, India, LEM 2004
27.2
33.334.8
46.252.9
60.3
62.371.4
75
76.581.6
85100
Maharashtra
West Bengal
Chattisgarh
Andhra Pradesh
Orissa
Karnataka
Tamil Nadu
Jharkhand
Uttaranchal
Uttar Pradesh
Bihar
Madhya Pradesh
Delhi
Accompanied-MDT should be provided systematically, as an option, to patients that have a high risk of being irregular, for various reasons such as probable migration in the near future, social stigma, and impossibility to attend the monthly appointment at the health facility (employment), etc.
Accompanied-MDT should be provided along with a careful counseling to the patient, in
order to ensure regular intake of MDT drugs, during the complete duration of the treatment.

22
Table – 2.2
Availability of MDT Blister Packs in Health Facilities Visited by Monitors in Various States Included in the Survey
Status of MDT Stock
Andh
ra
Prad
esh
Biha
r
Chat
tisga
rh
Delh
i
Jhar
khan
d
Karn
atak
a
Mad
hya
Prad
esh
Mah
aras
htra
Oris
sa
Tam
il Na
du
Utta
r Pra
desh
Utta
ranc
hal
Wes
t Ben
gal
Tota
l
Status of MDT stock in patient - months MBA 4.7 2.6 1.7 2.9 1.8 2.9 2.1 4.1 2.6 8.6 2.8 3.4 3.3 2.8 MBC 7.2 2.5 3.5 4.8 1.7 9.1 6.2 7.9 6.3 34.3 6.2 15.6 5.6 4.6 PBA 4.5 2.9 4.5 3.6 1.8 4.2 2.3 5.4 2.6 12.8 3.1 4.6 4.0 3.4 PBC 4.0 3.0 2.5 7.9 1.7 5.7 6.8 5.7 2.0 10.8 7.4 10.0 4.3 4.0 Proportion of health facilities with at least three months of MDT stock MBA 88.5 55.3 26.1 60.9 21.4 55.9 40.0 65.0 41.2 69.8 40.7 72.7 70.4 55.4 MBC 46.2 52.6 47.8 52.2 35.7 25.0 57.5 35.0 64.7 30.2 49.4 70.5 63.0 45.4 PBA 84.6 44.7 65.2 65.2 10.7 70.6 40.0 68.9 50.0 75.5 51.9 75.0 77.8 61.2 PBC 65.4 52.6 30.4 52.2 28.6 45.6 37.5 60.2 41.2 49.1 53.1 52.3 74.1 50.7 All categories 38.5 15.8 13.0 21.7 0.0 10.3 7.5 14.6 17.6 15.1 11.1 34.1 40.7 16.7
Source: Observations of survey teams in health facilities visited by them, based on position of cases and MDT stock on the day of visit (treatment register and drug stores)
The availability of MDT stock in-patient–months at various health facilities visited by survey team was calculated. In general, MB-Adult MDT stock availability was 2.8 patients–months and MB-Child 4.6 patient-months. The availability of MB-Adult stock was less than 3 patient-months in Chhattisgarh, Jharkhand, and Madhya Pradesh. The MB-Child stock was available for less than 3 patient-months in Jharkhand. The availability of PB-Adult stock was 3.4 patient-months and PB-Child 4.0 patient-months.
There was a significant excess of MB-Child and PB-Child blister packs, especially in
Andhra Pradesh, Delhi, Karnataka, Madhya Pradesh, Maharashtra, Orissa, Tamil Nadu, Uttar Pradesh and Uttaranchal.
The PB-Adult stock availability was less than 3 patient-months in Jharkhand, Madhya Pradesh, where as in Jharkhand and Orissa PB-Child availability was less than 3 patient-months.
The required 3-month buffer stock of MDT drugs were deficient in Jharkhand (MBA,
MBC, PBA and PBC) where it was needed the most, considering high transmission and leprosy problem in the state. On the contrary, the MDT stock was in large excess in Tamil Nadu, in all categories of blister packs, leading to expiry and wastage.
By looking at the overall and State figures, one could estimate that the MDT stock management was somewhat acceptable. But one should consider that these figures represented the average of MDT stock in patient-months of all the health facilities visited by the monitors. It is assumed that significant variations occurred from one health facility to another, highlighting that the MDT stock management of many health facilities was far from adequate, with shortage or excess. Many of the figures presented in table 2.2 are giving a false sense of security and should be interpreted carefully, by taking into account the average effect.
23
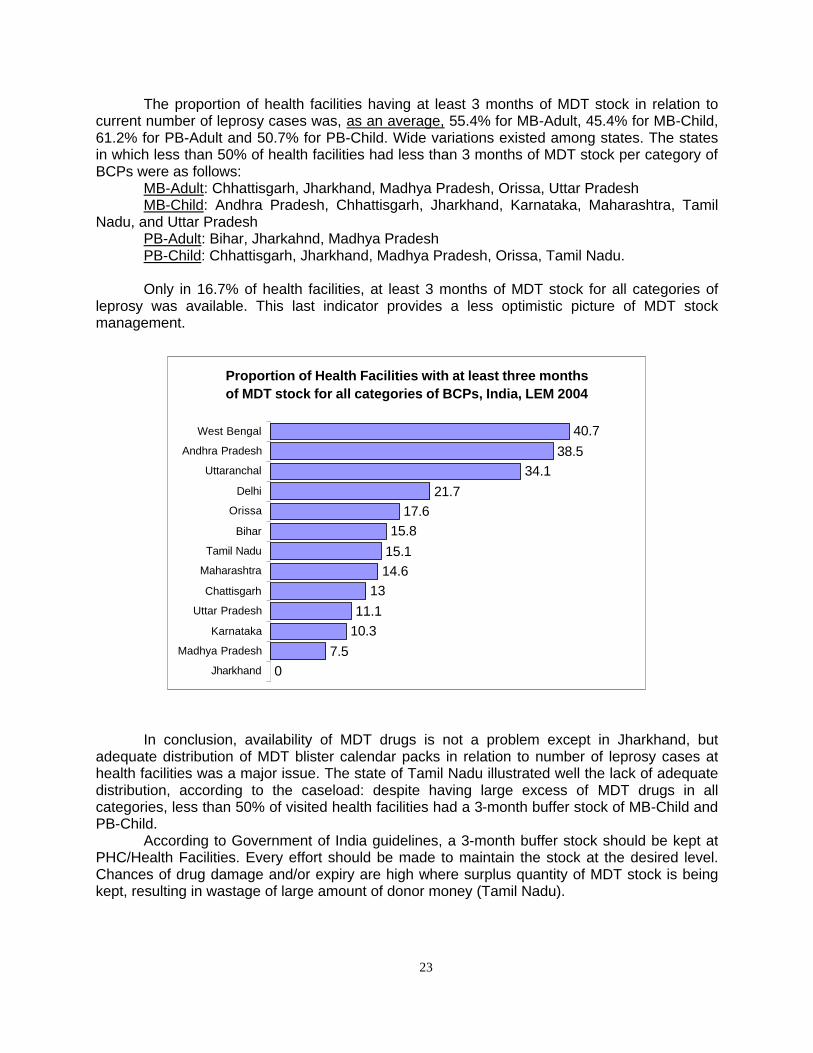
The proportion of health facilities having at least 3 months of MDT stock in relation to current number of leprosy cases was, as an average, 55.4% for MB-Adult, 45.4% for MB-Child, 61.2% for PB-Adult and 50.7% for PB-Child. Wide variations existed among states. The states in which less than 50% of health facilities had less than 3 months of MDT stock per category of BCPs were as follows:
MB-Adult: Chhattisgarh, Jharkhand, Madhya Pradesh, Orissa, Uttar Pradesh MB-Child: Andhra Pradesh, Chhattisgarh, Jharkhand, Karnataka, Maharashtra, Tamil
Nadu, and Uttar Pradesh PB-Adult: Bihar, Jharkahnd, Madhya Pradesh PB-Child: Chhattisgarh, Jharkhand, Madhya Pradesh, Orissa, Tamil Nadu. Only in 16.7% of health facilities, at least 3 months of MDT stock for all categories of
leprosy was available. This last indicator provides a less optimistic picture of MDT stock management.
Proportion of Health Facilities with at least three months of MDT stock for all categories of BCPs, India, LEM 2004
07.5
10.311.1
1314.615.115.8
17.621.7
34.138.5
40.7
Jharkhand
Madhya Pradesh
Karnataka
Uttar Pradesh
Chattisgarh
Maharashtra
Tamil Nadu
Bihar
Orissa
Delhi
Uttaranchal
Andhra Pradesh
West Bengal
In conclusion, availability of MDT drugs is not a problem except in Jharkhand, but adequate distribution of MDT blister calendar packs in relation to number of leprosy cases at health facilities was a major issue. The state of Tamil Nadu illustrated well the lack of adequate distribution, according to the caseload: despite having large excess of MDT drugs in all categories, less than 50% of visited health facilities had a 3-month buffer stock of MB-Child and PB-Child.
According to Government of India guidelines, a 3-month buffer stock should be kept at PHC/Health Facilities. Every effort should be made to maintain the stock at the desired level. Chances of drug damage and/or expiry are high where surplus quantity of MDT stock is being kept, resulting in wastage of large amount of donor money (Tamil Nadu).

24
Table – 2.3
Accessibility of MDT Services in Health Facilities Visited by Monitors as per the Interview of Patients in Various States included in the Survey
Indicator
Andh
ra P
rade
sh
Biha
r
Chat
tisga
rh
Delh
i
Jhar
khan
d
Karn
atak
a
Mad
hya
Prad
esh
Mah
aras
htra
Oris
sa
Tam
il Na
du
Utta
r Pra
desh
Utta
ranc
hal
Wes
t Ben
gal
Tota
l
Distance traveled by patients (one way in Kms) to collect MDT Median 5.0 1.5 2.0 8.0 2.0 1.3 1.0 2.0 1.5 2.0 3.0 3.0 1.5 2.0 Mean 5.3 2.3 5.0 10.9 3.6 2.5 3.0 2.9 1.9 3.2 3.8 4.2 3.6 3.6 Range 0-20 0-20 0-90 0-90 0-40 0-34 0-30 0-22 0-10 0-40 0-34 0-40 0-21 0-90 Estimated travel cost in Rupees (both ways) Median 8.0 10.0 20.0 14.0 10.0 6.0 10.0 10.0 5.0 5.0 8.0 10.0 10.0 10.0 Mean 10.9 11.3 20.1 18.6 11.0 8.3 14.7 12.1 7.0 6.6 9.5 11.6 11.5 11.5 Range 0-50 0-40 0-50 0-100 0-40 0-30 0-50 0-40 0-20 0-60 0-30 0-42 0-32 0-100 Source: Based on interview of patients by survey teams in various health facilities visited by them.
Distance travelled by patients to collect MDT
The patients taking treatment from health facilities were interviewed by monitors. The accessibility of MDT services from patients’ perspective was assessed by distance travelled by them and estimated travel cost to collect MDT from local health facilities. Overall among the 13 priority states, the median distance travelled by patients in order to collect MDT was 2.0 kms. It ranged from 0 km when the MDT was delivered at home to 90 kms in Chhattisgarh and Delhi.
In Madhya Pradesh the median distance travelled by patients was the least (1.0 km) and
the maximum median value of 8.0 kms was for Delhi.
Median distance (Km) travelled by patients to collect MDT, India, LEM 2004
1 1.3
1.5 1.5 1.5
2 2 2 2
3 3
5 8
Madhya Pradesh Karnataka
Bihar Orissa
West Bengal Chattisgarh
Jharkhand Maharashtra
Tamil Nadu Uttar Pradesh
Uttaranchal Andhra Pradesh
Delhi

25
Travel cost to collect MDT
Overall, the median travel cost (both ways) in Rupees was Rs.10.0, ranging from Rs. 0 to 100 (Delhi).
The median money spent in meeting the travel cost of the patient (both ways) was the
lowest in Orissa and Tamil Nadu (Rs. 5.0), and the highest in Delhi (Rs. 100). The highest value in Delhi may be related to highest median distance travelled and higher cost of travel in Delhi or cases coming from outside the state for treatment.
Median Cost (Rs.) spent by patients to collect MDT, India, LEM 2004
2014
101010101010
88
655
ChhattisgarhDelhiBihar
JharkhandMadhya Pradesh
MaharashtraUttaranchal
West BengalAndhra Pradesh
Uttar PradeshKarnataka
OrissaTamil Nadu
Conclusions on integration:
Most of the visited health facilities were providing MDT services. In 80.0% health facilities, the diagnosis was made and the treatment was initiated by health staff based at the general health system facilities, which provided these services on all working days in 89.0% of health facilities.
Accompanied-MDT was available as an option in 59.9% of visited facilities, which
showed that more education needs to be done on this matter. Although patient is given A-MDT but his name from the treatment register is not deleted till the total period of completion of treatment (PB or MB) as the case may be.
Health facility staff was maintaining the leprosy treatment register in 98.0% of health
facilities and drug register in 95.7% of the health facilities.
According to the integration indicators, the states which need to make most efforts to strengthen the integration process are, by decreasing order: Andhra Pradesh, Chhattisgarh, West Bengal and Madhya Pradesh.

26
III. Simplified Information System
Table- 3.1
Status of Implementation of the Simplified Information System (SIS) in various States Included in the LEM Survey
a) Availability of SIS documents
Indicator Andh
ra
Prad
esh
Biha
r
Chat
tisga
rh
Delh
i
Jhar
khan
d
Karn
atak
a
Mad
hya
Prad
esh
Mah
aras
htra
Oris
sa
Tam
in N
adu
Utta
r Pr
ades
h
Utta
ranc
hal
Wes
Ben
gal
Tota
l
Proportion (%) of Health Facilities with availability of SIS:
Guidelines 100 34.2 52.2 95.7 28.6 52.9 60.0 56.3 17.6 24.5 45.7 6.8 70.4 47.1
Patient card 100 78.9 95.7 100 96.4 94.1 92.5 100 97.1 83.0 100 95.5 88.9 94.6
Treatment register 100 100 95.7 100 96.4 94.1 92.5 100 97.1 86.8 97.5 84.1 85.2 94.9
MDT register 100 42.1 95.7 100 46.4 94.1 87.5 99.0 97.1 79.2 86.4 52.3 96.3 84.2
Monthly Report 100 100 100 100 100 100 92.5 100 91.2 94.3 98.8 95.5 100 98.0
Source: Observation of the monitor in the health facilities.
The NLEP Simplified Information System (SIS) started to be implemented in November 2002. But the pace of implementation varied widely from one state to another. Therefore, one of the objectives of the LEM 2004 were to assess the progress made towards availability of various documents at health facility level, as well as the use of some of them. SIS guidelines: On the average, 47.1% of the health facilities visited by monitors had SIS guidelines. The range was 6.8% in Uttaranchal to 100% in Andhra Pradesh. The states where SIS guidelines were available at less than 50.0% of health facilities were Bihar, Jharkhand, Orissa, Tamil Nadu and Uttar Pradesh. SIS patient cards: On the average, 94.6% of health facilities had new SIS patient cards. This proportion was good in most of the states except Bihar (78.9%), Tamil Nadu (83.0%) and West Bengal (88.9%). SIS treatment register: On the average, 94.9% of health facilities had SIS treatment register. This proportion was good in most of the state except Tamil Nadu (86.8%), Uttaranchal (84.1%) and West Bengal (85.2%).

27
Proportion of Health Facilities with SIS guidelines available,India, LEM 2004
6.8
17.6
24.5
28.6
34.2
45.7
52.2
52.9
56.3
60
70.4
95.7
100
Uttaranchal
Orissa
Tamin Nadu
Jharkhand
Bihar
Uttar Pradesh
Chattisgarh
Karnataka
Maharashtra
Madhya Pradesh
Wes Bengal
Delhi
Andhra Pradesh
Proportion of Health Facilities with Patient card & Treatment register available,India, LEM 2004
100
86.8
85.2
92.5
94.1
84.1
95.7
96.4
97.1
100
100
100
97.5
78.9
83
88.9
92.5
94.1
95.5
95.7
96.4
97.1
100
100
100
100
Bihar
Tamin Nadu
Wes Bengal
Madhya Pradesh
Karnataka
Uttaranchal
Chattisgarh
Jharkhand
Orissa
Andhra Pradesh
Delhi
Maharashtra
Uttar Pradesh
Patient card Treatment register

28
SIS MDT drug register: On the average, SIS MDT register was available in 84.2% of the health facilities. This proportion was poor in Bihar (42.1%), Jharkhand (46.4%) and Uttaranchal (52.3%). SIS Monthly report: On the average, the SIS monthly reporting formats were available in 98.0% of the health facilities. All most all health facilities had SIS monthly reporting formats.
Proportion of Health Facilities with SIS MDT register and Monthly report available,India, LEM 2004
100
100
95.5
94.3
98.8
92.5
100
100
100
91.2
100
100
100
42.1
46.4
52.3
79.2
86.4
87.5
94.1
95.7
96.3
97.1
99
100
100
Bihar
Jharkhand
Uttaranchal
Tamin Nadu
Uttar Pradesh
Madhya Pradesh
Karnataka
Chattisgarh
Wes Bengal
Orissa
Maharashtra
Andhra Pradesh
Delhi
SIS Monthly Report MDT register

29
Table 3.2
Status of Implementation of the Simplified Information System (SIS)
b) Use of SIS documents and data
In
dica
tor
Andh
ra
Prad
esh
Biha
r
Chha
ttisg
arh
Delh
i
Jhar
khan
d
Karn
atak
a
Mad
hya
Prad
esh
Mah
aras
htra
Oris
sa
Tam
in N
adu
Utta
r Pra
desh
Utta
ranc
hal
Wes
Ben
gal
Tota
l
Proportion (%) of Health Facilities with: Last Monthly Report sent on SIS format
100 97.4 100 100 100 97.1 90.0 96.1 100 94.3 98.8 93.2 92.6 96.6
At least three of the NLEP indicators were calculated
80.8 26.3 52.2 0.0 35.7 27.9 50.0 66.0 17.6 13.2 17.3 9.1 29.6 33.8
Source: Observation of the monitor in the health facilities.
Last monthly report sent on SIS format: On the average, 96.6% of the health facilities had sent their last monthly report on the SIS formats. By and large most of the health facilities in all the states were sending reports on SIS formats. NLEP indicators: On the average, only in 33.8% of health facilities, at least three NLEP monitoring indicators were being calculated. It ranged from 0% in Delhi to 80.8% in Andhra Pradesh. It was less than 50.0% in Bihar, Jharkhand, Karnataka, Orissa, Tamil Nadu, Uttar Pradesh, Uttaranchal and West Bengal. By definition indicators are variable which help us in determining the change i.e. they help us measuring the performance of activities and thus provides constructive inputs into monitoring of leprosy control activities. The health facilities were assessed specifically for calculating at least 3 NLEP indicators i.e. (prevalence rate, Patient-Month blister packs and any one of the other like Child %, deformity Grade-II %, MB %, female %, among newly detected cases, SC/ST rate, etc.).
Proportion of Health Facilities with at least 3 NLEP indicators calculated and last Monthly report sent on SIS format ,India, LEM 2004
100
93.2
94.3
98.8
100
97.4
97.1
92.6
100
90
100
96.1
100
0
9.1
13.2
17.3
17.6
26.3
27.9
29.6
35.7
50
52.2
66
80.8
Delhi
Uttaranchal
Tamin Nadu
Uttar Pradesh
Orissa
Bihar
Karnataka
Wes Bengal
Jharkhand
Madhya Pradesh
Chhattisgarh
Maharashtra
Andhra Pradesh
SISReport Send 3 Indicators Used

30
Table 3.3
Status of Implementation of the Simplified Information System (SIS) c) Completeness and Timeliness
Source: Observation of monitors at district HQ *In Uttar Pradesh: May’ 04 MPR instead of April’ 2004.
Completeness of Reports: Nearly 80.6% of the health facilities had mentioned the complete information/data on the latest available MPR including drug stock and its expiry dates. This proportion was low in Delhi (61.9%), Uttar Pradesh (64.4%), West Bengal (69.3%), Maharashtra (72.8%), Madhya Pradesh (77.6%), and Chhattisgarh (79.2%).
Completeness of Monthly progress reports, India, LEM- 2004
61.9
64.4
69.3
72.8
77.6
79.2
81.4
84.2
84.8
87.0
87.2
92.0
98.8
Delhi
Uttar Pradesh
West Bengal
Maharashtra
Madhya Pradesh
Chattisgarh
Tamil Nadu
Jharkhand
Andhra Pradesh
Orissa
Karnataka
Bihar
Uttaranchal
Indicator Andh
ra
Prad
esh
Biha
r Ch
attis
garh
Delh
i
Jhar
khan
d
Karn
atak
a
Mad
hya
Prad
esh
Mah
aras
htra
Oris
sa
Tam
il Na
du
Utta
r Pra
desh
Utta
ranc
hal
Wes
t Ben
gal
Tota
l
Proportion (%) of health facilities which mentioned complete data including drug stock & its expiry date in the latest available MPR in the district HQ
84.8 92.0 79.2 61.9 84.2 87.2 77.6 72.8 87.0 81.4 64.4 98.8 69.3 80.6
Proportion (%) of health facilities which had sent their MPR (LF04) of April’ 04 to District HQ by the day of visit of monitors
74.6 94.6 78.9 50.9 96.5 88.3 92.8 91.3 96.0 92.0 84.0* 88.6 65.5 85.1
Proportion (%) of visited districts that had sent the April MPR (LF05) to the State HQ by the day of visit of LEM monitors
100 100. 100 100 100 100 100 100 83.0 100 85.7* 100 75.0 98.6

31
Timeliness of Reports:
a) From health facility to district: Nearly 85.5% of the health facilities had sent April/May MPR to the district HQ by the day of visit of monitors. Practically, it should have been 100%. The range of timeliness of reports varied from 50.9% (Delhi) to 96.5% (Jharkhand). b) From district to state: Of the visited districts, 98.0% had sent their MPR (LF05) to state HQ by the day of visited of monitors. This proportion was low in Maharashtra (83.0%), Uttar Pradesh (85.7%) and West Bengal (75.0%).
The fact that the proportion of districts which sent the April monthly report to the state was
significantly higher that the proportion of health facilities which sent the April monthly report to the district indicates clearly that some district’s reports sent to the state (LF05) were incomplete, with missing reports from some health facilities/blocks.
The gap was especially important in Delhi, Andhra Pradesh and Chhattisgarh, as shown in
the graph below:
Timeliness of monthly progress reports, India, LEM-2004
50.9
65.5
74.6
78.9
84
88.3
88.6
91.3
92
92.8
94.6
96
96.5
100
75
100
100
85.7
100
100
100
100
100
100
83
100
Delhi
West Bengal
Andhra Pradesh
Chattisgarh
Uttar Pradesh
Karnataka
Uttaranchal
Maharashtra
Tamil Nadu
Madhya Pradesh
Bihar
Orissa
Jharkhand
Proportion(%) of visiteddistricts which had sent theApril MPR (LF05) to theState HQ by the day ofvisit of monitors
Proportion(%) of healthfacilities which had senttheir MPR (LF04)of April’04 to District HQ by theday of visit of monitors
The consequence of incomplete compilation of health facility reports (LF04) at district level is under-reporting, therefore artificially under-estimating the prevalence, the detection, and the MDT stock.

32
Conclusions on SIS implementation
In general, the status of implementation of SIS in various states had made some good progress from last year’s performance, irrespective of state variations. Progress was especially visible regarding the availability of SIS forms at health facility and district levels.
However, the availability of the SIS guidelines at health facility level was average in general, and need to be improved in States where it was found poor (Uttaranchal, Orissa, Tamil Nadu, and Jharkhand).
The objective of any information system is to use data for decision-making. The findings
showed that this objective was achieved in too few of the health facilities visited. Therefore the monitoring component of the SIS at block level was rarely utilised, making it difficult for leprosy managers to take corrective actions.
By and large, completeness of reports in-terms of mentioning of all relevant
information/data on the MPR was far from satisfactory level. Greater supervision is needed in this aspect. Also many health facilities were not submitting their MPR by the designated time (days) as per the laid down guidelines.
Efforts are still needed at health facility level to systematically include their MDT stock
with expiry dates, as well as to timely send the monthly report to the district, in order to allow a complete compilation of health facility/block reports at the district level.
The ultimate goal of the SIS is the use of data for monitoring and decision making, at
various levels. Now that the availability and use of SIS document/formats have significantly improved since the past year, efforts should be concentrated on the analysis and interpretation of data. On a quarterly basis, the use of graphs and maps should be promoted.
The SIS is one of the components of the NLEP that needs to be strengthened if a decent routine monitoring system is to be in place.
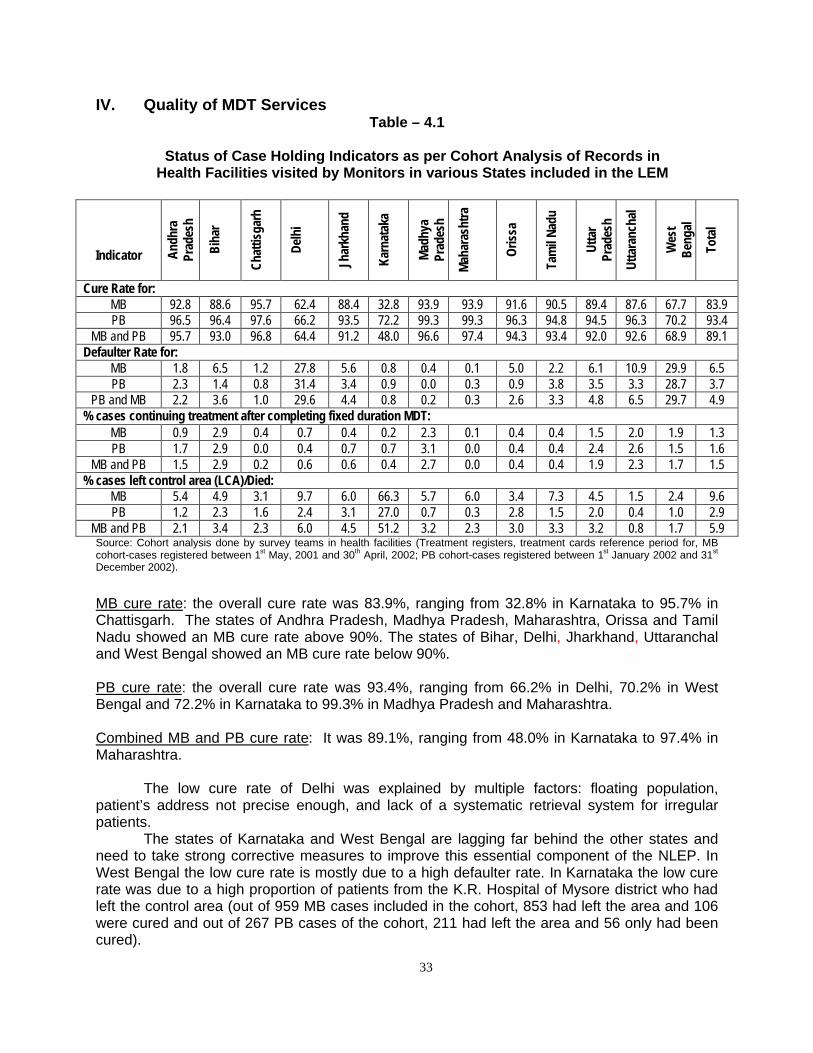
33
IV. Quality of MDT Services Table – 4.1
Status of Case Holding Indicators as per Cohort Analysis of Records in
Health Facilities visited by Monitors in various States included in the LEM
Indicator Andh
ra
Prad
esh
Biha
r
Chat
tisga
rh
Delh
i
Jhar
khan
d
Karn
atak
a
Mad
hya
Prad
esh
Mah
aras
htra
Oris
sa
Tam
il Na
du
Utta
r Pr
ades
h
Utta
ranc
hal
Wes
t Be
ngal
Tota
l
Cure Rate for: MB 92.8 88.6 95.7 62.4 88.4 32.8 93.9 93.9 91.6 90.5 89.4 87.6 67.7 83.9 PB 96.5 96.4 97.6 66.2 93.5 72.2 99.3 99.3 96.3 94.8 94.5 96.3 70.2 93.4
MB and PB 95.7 93.0 96.8 64.4 91.2 48.0 96.6 97.4 94.3 93.4 92.0 92.6 68.9 89.1 Defaulter Rate for:
MB 1.8 6.5 1.2 27.8 5.6 0.8 0.4 0.1 5.0 2.2 6.1 10.9 29.9 6.5 PB 2.3 1.4 0.8 31.4 3.4 0.9 0.0 0.3 0.9 3.8 3.5 3.3 28.7 3.7
PB and MB 2.2 3.6 1.0 29.6 4.4 0.8 0.2 0.3 2.6 3.3 4.8 6.5 29.7 4.9 % cases continuing treatment after completing fixed duration MDT:
MB 0.9 2.9 0.4 0.7 0.4 0.2 2.3 0.1 0.4 0.4 1.5 2.0 1.9 1.3 PB 1.7 2.9 0.0 0.4 0.7 0.7 3.1 0.0 0.4 0.4 2.4 2.6 1.5 1.6
MB and PB 1.5 2.9 0.2 0.6 0.6 0.4 2.7 0.0 0.4 0.4 1.9 2.3 1.7 1.5 % cases left control area (LCA)/Died:
MB 5.4 4.9 3.1 9.7 6.0 66.3 5.7 6.0 3.4 7.3 4.5 1.5 2.4 9.6 PB 1.2 2.3 1.6 2.4 3.1 27.0 0.7 0.3 2.8 1.5 2.0 0.4 1.0 2.9
MB and PB 2.1 3.4 2.3 6.0 4.5 51.2 3.2 2.3 3.0 3.3 3.2 0.8 1.7 5.9 Source: Cohort analysis done by survey teams in health facilities (Treatment registers, treatment cards reference period for, MB cohort-cases registered between 1st May, 2001 and 30th April, 2002; PB cohort-cases registered between 1st January 2002 and 31st December 2002).
MB cure rate: the overall cure rate was 83.9%, ranging from 32.8% in Karnataka to 95.7% in Chattisgarh. The states of Andhra Pradesh, Madhya Pradesh, Maharashtra, Orissa and Tamil Nadu showed an MB cure rate above 90%. The states of Bihar, Delhi, Jharkhand, Uttaranchal and West Bengal showed an MB cure rate below 90%. PB cure rate: the overall cure rate was 93.4%, ranging from 66.2% in Delhi, 70.2% in West Bengal and 72.2% in Karnataka to 99.3% in Madhya Pradesh and Maharashtra. Combined MB and PB cure rate: It was 89.1%, ranging from 48.0% in Karnataka to 97.4% in Maharashtra.
The low cure rate of Delhi was explained by multiple factors: floating population, patient’s address not precise enough, and lack of a systematic retrieval system for irregular patients.
The states of Karnataka and West Bengal are lagging far behind the other states and need to take strong corrective measures to improve this essential component of the NLEP. In West Bengal the low cure rate is mostly due to a high defaulter rate. In Karnataka the low cure rate was due to a high proportion of patients from the K.R. Hospital of Mysore district who had left the control area (out of 959 MB cases included in the cohort, 853 had left the area and 106 were cured and out of 267 PB cases of the cohort, 211 had left the area and 56 only had been cured).

34
Regarding cure rates, three categories of states could be identified: 1) MB cure rates > 90%: Andhra Pradesh, Chhattisgarh, Tamil Nadu, Madhya Pradesh,
Maharashtra and Orissa. PB cure rates > 90%: All the States, except Delhi, Karnataka and West Bengal.
2) MB cure rates between 89.9% and 80%: Bihar, Jharkhand, Uttaranchal and Uttar
Pradesh PB cure rate between 89.9% and 80.0%: Nil
3) MB cure rates < 80%: Delhi, Karnataka and West Bengal. PB cure rates < 80%: Delhi, Karnataka and West Bengal.
Defaulter rate: MB and PB combined; the overall defaulter rate was 4.9%, higher for MB (6.5%) and lower for PB (3.7%). The highest defaulter rates (= 10%) for MB was found in, West Bengal (29.9%), Delhi (27.8%) and Uttaranchal (10.9%). The highest defaulter rate for PB was found in Delhi (31.4%) followed by West Bengal (28.7%). Proportion of cases continuing treatment after fixed duration MDT: This proportion was 1.5% overall. For MB and PB combined, it was 2.9% in Bihar, 2.7% in Madhya Pradesh, and 2.3% in Uttaranchal. Proportion of patients that have left the area or died: Overall, it was 5.9%, higher for MB cases (9.6%) than for PB cases (2.9%). For MB cases, it was highest in Karnataka (66.3%) followed by Delhi (9.7%) and Tamil Nadu (7.3%). For PB cases, it was highest in Karnataka (27.0%). The reason was the state of Karnataka (mostly due to the Mysore district) had a so high proportion of cases in this category should be further investigated.
MB Cases Cure Rate(%), India, LEM 2004
32.8
62.4
67.7
87.6
88.4
88.6
89.4
90.5
91.6
92.8
93.9
93.9
95.7
Karnataka
Delhi
West Bengal
Uttaranchal
Jharkhand
Bihar
Uttar Pradesh
Tamil Nadu
Orissa
Andhra Pradesh
Madhya Pradesh
Maharashtra
Chattisgarh
PB Cases Cure Rate(%), India, LEM 2004
66.2
70.2
72.2
93.5
94.5
94.8
96.3
96.3
96.4
96.5
97.6
99.3
99.3
Delhi
West Bengal
Karnataka
Jharkhand
Uttar Pradesh
Tamil Nadu
Orissa
Uttaranchal
Bihar
Andhra Pradesh
Chattisgarh
Madhya Pradesh
Maharashtra

35
Table – 4.2
Status of Quality of MDT Services and Leprosy Records in Health Facilities visited by Monitors in various States included in the LEM
Indicator
Andh
ra P
rade
sh
Biha
r
Chat
tisga
rh
Delh
i
Jhar
khan
d
Karn
atak
a
Mad
hya
Prad
esh
Mah
aras
htra
Oris
sa
Tam
il Na
du
Utta
r Pra
desh
Utta
ranc
hal
Wes
t Ben
gal
Tota
l
Proportion (%) of health facilities with discrepancy of registered new leprosy cases between annual report (2003-04) & treatment register: No discrepancy 100 38.9 44.4 40.9 75.0 68.3 65.0 53.4 26.5 49.1 39.7 46.4 31.8 52.2 Total discrepancy 0 61.1 55.6 59.1 25.0 31.7 35.0 46.6 73.5 50.9 60.3 53.6 68.2 47.8 Under reporting 0 30.6 16.7 27.3 10.7 25.0 15.0 14.6 41.2 28.3 34.6 28.6 27.3 23.5 Over reporting 0 30.6 38.9 31.8 14.3 6.7 20.0 32.0 32.4 22.6 25.6 25.0 40.9 24.3
Source: Observations of survey teams in health facilities (treatment register, annual reports or 12 monthly progress reports from April 2003 to March 2004).
The leprosy records from treatment register were compared with annual reports 2003-04
(12 monthly progress reports from April 2003 to March 2004) for new leprosy cases detected. In nearly half of the health facilities such discrepancy was found. The states with the
highest discrepancy were Orissa (73.5%), West Bengal (68.2%), and Uttar Pradesh (60.3%).
In 23.5% of health facilities, there was under reporting and in 24.3% there was over reporting in the annual report.
The range for health facilities with under reporting was between 0% (Andhra Pradesh) to 41.2% in Orissa. The range for health facilities over reporting was 0% (Andhra Pradesh) to 40.9% in West Bengal. Only Andhra Pradesh had no discrepancy. The balance between under-reporting and over-reporting was found in a few states. However, under-reporting was significant in Karnataka and Orissa, and over-reporting was significant in Chhattisgarh, Madhya Pradesh, Maharashtra, and West Bengal.
The discrepancy is attributed to delay in updating registers at health facilities and errors in compilation of data (monthly reports are prepared but registers are not updated).
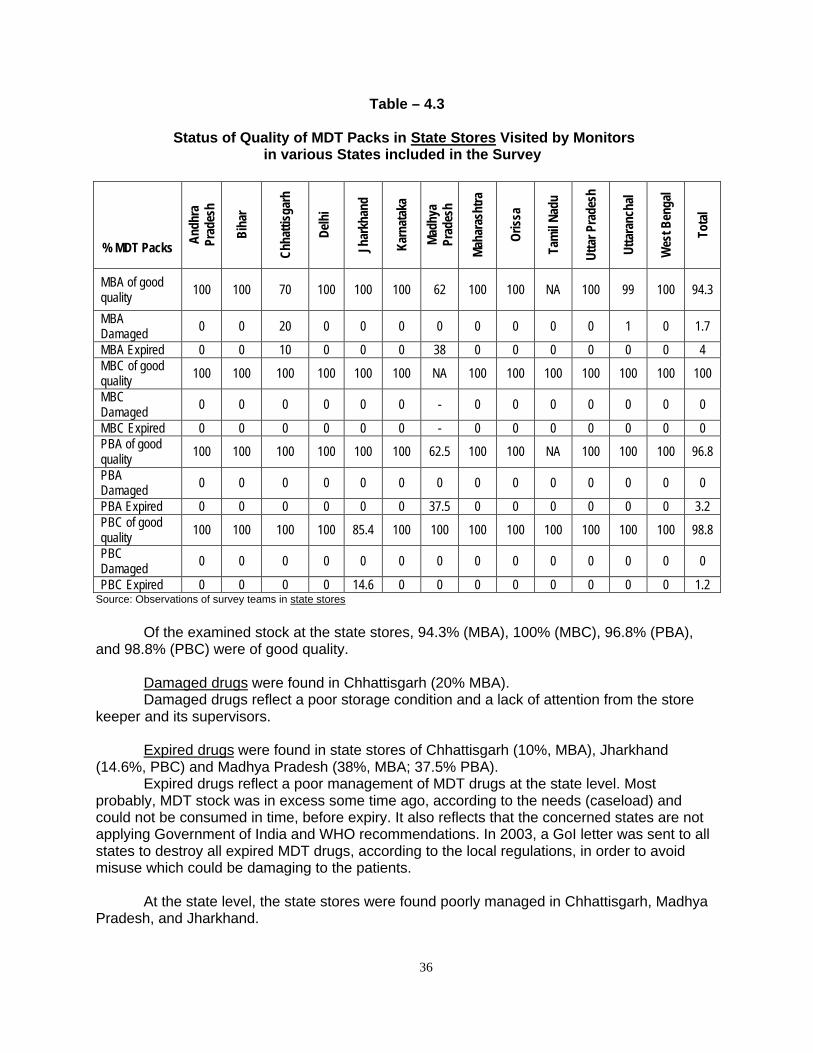
36
Table – 4.3
Status of Quality of MDT Packs in State Stores Visited by Monitors in various States included in the Survey
% MDT Packs
Andh
ra
Prad
esh
Biha
r
Chha
ttisg
arh
Delh
i
Jhar
khan
d
Karn
atak
a
Mad
hya
Prad
esh
Mah
aras
htra
Oris
sa
Tam
il Na
du
Utta
r Pra
desh
Utta
ranc
hal
Wes
t Ben
gal
Tota
l
MBA of good quality 100 100 70 100 100 100 62 100 100 NA 100 99 100 94.3
MBA Damaged 0 0 20 0 0 0 0 0 0 0 0 1 0 1.7
MBA Expired 0 0 10 0 0 0 38 0 0 0 0 0 0 4 MBC of good quality 100 100 100 100 100 100 NA 100 100 100 100 100 100 100
MBC Damaged 0 0 0 0 0 0 - 0 0 0 0 0 0 0
MBC Expired 0 0 0 0 0 0 - 0 0 0 0 0 0 0 PBA of good quality 100 100 100 100 100 100 62.5 100 100 NA 100 100 100 96.8
PBA Damaged 0 0 0 0 0 0 0 0 0 0 0 0 0 0
PBA Expired 0 0 0 0 0 0 37.5 0 0 0 0 0 0 3.2 PBC of good quality 100 100 100 100 85.4 100 100 100 100 100 100 100 100 98.8
PBC Damaged 0 0 0 0 0 0 0 0 0 0 0 0 0 0
PBC Expired 0 0 0 0 14.6 0 0 0 0 0 0 0 0 1.2 Source: Observations of survey teams in state stores
Of the examined stock at the state stores, 94.3% (MBA), 100% (MBC), 96.8% (PBA), and 98.8% (PBC) were of good quality. Damaged drugs were found in Chhattisgarh (20% MBA).
Damaged drugs reflect a poor storage condition and a lack of attention from the store keeper and its supervisors.
Expired drugs were found in state stores of Chhattisgarh (10%, MBA), Jharkhand (14.6%, PBC) and Madhya Pradesh (38%, MBA; 37.5% PBA).
Expired drugs reflect a poor management of MDT drugs at the state level. Most probably, MDT stock was in excess some time ago, according to the needs (caseload) and could not be consumed in time, before expiry. It also reflects that the concerned states are not applying Government of India and WHO recommendations. In 2003, a GoI letter was sent to all states to destroy all expired MDT drugs, according to the local regulations, in order to avoid misuse which could be damaging to the patients.
At the state level, the state stores were found poorly managed in Chhattisgarh, Madhya Pradesh, and Jharkhand.

37
Table – 4.4
Status of Quality of MDT Packs in District Stores Visited by Monitors in various States included in the Survey
% MDT Packs
Andh
ra
Prad
esh
Biha
r
Chat
tisga
rh
Delh
i
Jhar
khan
d
Karn
atak
a
Mad
hya
Prad
esh
Mah
aras
htra
Oris
sa
Tam
il Na
du
Utta
r Pra
desh
Utta
ranc
hal
Wes
t Ben
gal
Tota
l
MBA of good quality 100 99.7 89.4 100 92.6 100 98.1 100 74.1 99.8 100 99.0 100 98.2
MBA Damaged 0 0.3 10.6 0 7.4 0 1.9 0 0 0.2 0 0.6 0 0.9
MBA Expired 0 0 0 0 0 0 0 0 25.9 0 0 0.4 0 0.8 MBC of good quality 100 100 98.6 100 100 100 100 100 100 79.6 100 98.1 100 99.0
MBC Damaged 0 0 1.4 0 0 0 0 0 0 0 0 0.0 0 0
MBC Expired 0 0 0.0 0 0 0 0 0 0 20.4 0 1.9 0 1.0 PBA of good quality 100 99.6 99.9 100 100 100 87.5 100 66.3 100 100 99.4 100 97.8
PBA Damaged 0 0.4 0.1 0 0 0 0 0 0.6 0 0 0.0 0 0.1
PBA Expired 0 0 0 0 0 0 12.5 0 33.1 0 0 0.6 0 2.1 PBC of good quality 100 99.2 100 100 100 100 87.8 100 100 69.0 100 82.8 100 97.9
PBC Damaged 0 0.8 0 0 0 0 0 0 0 0 0 0 0 0.1
PBC Expired 0 0 0 0 0 0 12.2 0 0 31.0 0 17.2 0 1.9 Source: Observations of survey teams in district stores.
Overall, in the district stores the proportion of MDT packs not damaged and not expired was
98.2% for MBA, 99.0% for MBC, 97.8% for PBA and 97.9% for PBC at the district stores in the districts visited by survey teams.
Overall, the damaged packs were reported from Chhattisgarh (10.6% MBA) and Jharkhand
(7.4% MBA). The overall expired blister packs were mainly reported from Madhya Pradesh (12.5% PBA,
12.2% PBC), Orissa (25.9% MBA, 33.1% PBA), Tamil Nadu (20.4% MBC, 31.0% PBC) and Uttaranchal (17.2% PBC),
Proper storage, ensuring completeness of monthly progress reports in terms of mentioning of drug stock and its expiry dates, maintenance of updated drug register and use of FIFO (First In – First Out) principles will lead to better drug stock management.
The states concerned should take necessary action to dispose the expired/damaged stock of MDT.

38
Table – 4.5
Status of discrepancy between MDT Drug register and actual availability of MDT drugs in district stores of various states
Source: Observations of survey teams in district stores. The LEM Monitors screened the MDT drug stock register at the districts to list the drugs
(blister Pack) mentioned in each category (MBA, MBC, PBA and PBC). They then physically verified the drug stock actually present in the district stores to fiend to discrepancy, if any.
Overall, this discrepancy was found in 23.4% of the visited district stores with the range
of 0% to 50% in Madhya Pradesh and Andhra Pradesh and 66.7% in Delhi. No discrepancy was found in drug register and actual availability in district stores of Jharkhand, Karnataka, and Orissa.
Status of discrepancy between MDT Drug register and acutal availability of drugs in district stores of various states, India, LEM 2004
14.3
16.7
25.0
25.0
25.0
33.3
50.0
50.0
66.7
0
0
0
Jharkhand
Karnataka
Orissa
Uttar Pradesh
Tamil Nadu
Bihar
Chattisgarh
Uttaranchal
Maharashtra
Andhra Pradesh
Madhya Pradesh
Delhi
A strong effort in maintenance of MDT drug registers is required in the States of Delhi, Madhya Pradesh, Andhra Pradesh and Maharashtra.
Indicator Andh
ra P
rade
sh
Biha
r
Chat
tisga
rh
Delh
i
Jhar
khan
d
Karn
atak
a
Mad
hya
Prad
esh
Mah
aras
htra
Oris
sa
Tam
il Na
du
Utta
r Pra
desh
Utta
ranc
hal
Wes
t Ben
gal
Tota
l
Proportion (%) of visited districts with discrepancy between drug register and actual availability of drugs in store:
50.0 25.0 25.0 66.7 0 0 50.0 33.3 0 16.7 14.3 25.0 50.0 23.4

39
Table – 4.6
Status of Quality of MDT Packs in Health Facilities Stores Visited by Monitors in Various States Included in the Survey
% MDT Packs An
dhra
Pra
desh
Biha
r
Chat
tisga
rh
Delh
i
Jhar
khan
d
Karn
atak
a
Mad
hya
Prad
esh
Mah
aras
htra
Oris
sa
Tam
il Na
du
Utta
r Pra
desh
Utta
ranc
hal
Wes
t Ben
gal
Tota
l
MBA Of good quality 99.8 98.7 97.0 100 96.1 99.0 99.0 97.1 99.6 98.5 100 98.7 95.9 98.6
MBA Damaged 0.2 1.1 2.8 0 3.9 1.0 1.0 2.9 0.4 1.5 0 1.3 3.3 1.3
MBA Expired 0 0.1 0.3 0 0 0 0 0 0 0 0 0 0.8 0.1 MBC of good quality 100 99.6 99.3 100 100 100 100 92.5 99.1 69.4 98.9 97.4 95.5 96.4
MBC Damaged 0 0.4 0.7 0 0 0 0 7.5 0.9 0 0 2.6 4.5 1.0
MBC Expired 0 0 0 0 0 0 0 0 0 30.6 1.1 0 0 2.6 PBA of good quality 100 99.8 99.8 100 100 100 99.4 99.9 99.7 97.2 99.9 99.4 99.5 99.5
PBA Damaged 0 0.2 0.2 0 0 0 0 0.1 0.3 0.5 0.1 0.6 0.5 0.2
PBA Expired 0 0 0 0 0 0 0.6 0 0 2.3 0 0 0 0.3 PBC of good quality 99.5 99.9 92.4 93.2 100 100 98.1 99.8 100 88.6 99.9 93.1 94.7 97.8
PBC Damaged 0.5 0 0 6.8 0 0 0 0.2 0 0 0.1 0 5.3 0.4
PBC Expired 0 0.1 7.6 0 0 0 1.9 0 0 11.4 0 6.9 0 1.8 Source: Observations of survey teams in health facilities.
Overall, in the health facility stores the proportion of MDT packs not damaged and not
expired was 98.6% for MBA, 96.4% for MBC, 99.5% for PBA and 97.8% for PBC at the health facilities visited by monitors.
Overall, the damaged proportion of blister packs was low, expect in Delhi (6.8% PBC), Maharashtra (7.5% MBC) and West Bengal (4.5% MBC and 5.3% PBC).
The overall expired blister packs were mainly reported from Chhattisgarh (7.6% PBC),
Tamil Nadu (30.6% MBC, 11.4% PBC) and Uttaranchal (6.9% PBC).
It is the responsibility of the pharmacist at health facility level to maintain the drug register, ensure a proper storage, and distribute MDT drugs according to their respective expiration dates. Expired or damaged blister packs should be destroyed promptly.
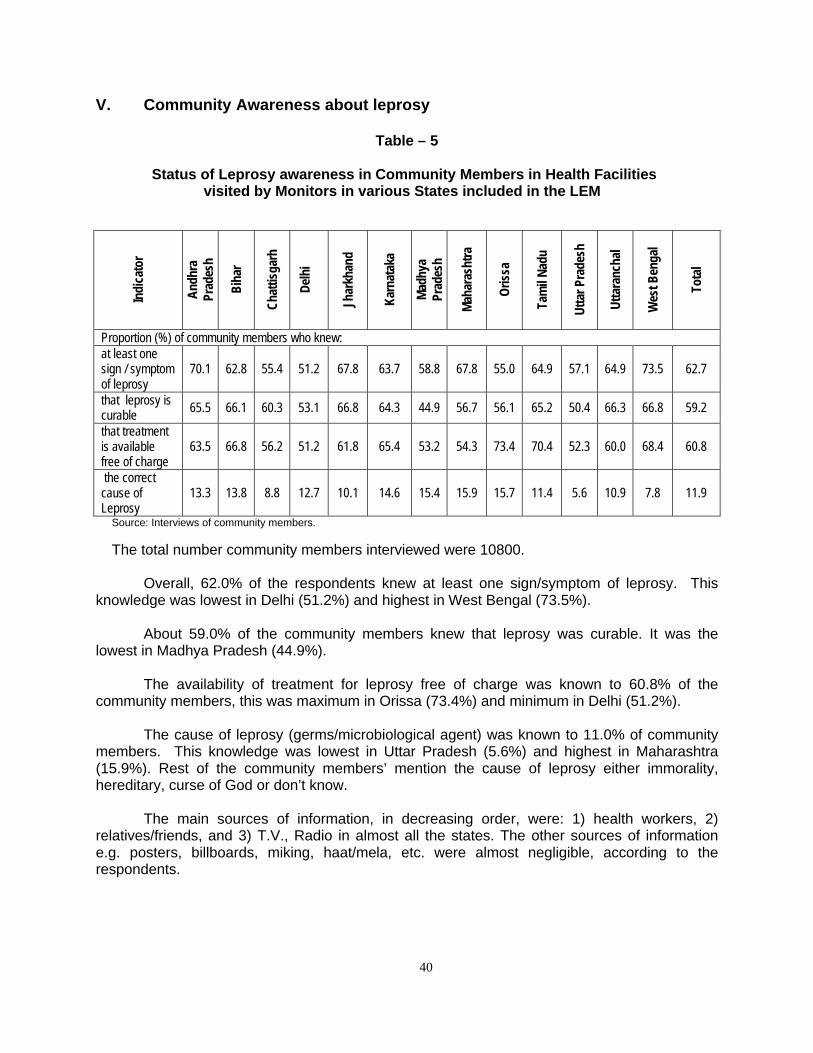
40
V. Community Awareness about leprosy
Table – 5
Status of Leprosy awareness in Community Members in Health Facilities visited by Monitors in various States included in the LEM
Indi
cato
r
Andh
ra
Prad
esh
Biha
r
Chat
tisga
rh
Delh
i
Jhar
khan
d
Karn
atak
a
Mad
hya
Prad
esh
Mah
aras
htra
Oris
sa
Tam
il Na
du
Utta
r Pra
desh
Utta
ranc
hal
Wes
t Ben
gal
Tota
l
Proportion (%) of community members who knew: at least one sign / symptom of leprosy
70.1 62.8 55.4 51.2 67.8 63.7 58.8 67.8 55.0 64.9 57.1 64.9 73.5 62.7
that leprosy is curable 65.5 66.1 60.3 53.1 66.8 64.3 44.9 56.7 56.1 65.2 50.4 66.3 66.8 59.2
that treatment is available free of charge
63.5 66.8 56.2 51.2 61.8 65.4 53.2 54.3 73.4 70.4 52.3 60.0 68.4 60.8
the correct cause of Leprosy
13.3 13.8 8.8 12.7 10.1 14.6 15.4 15.9 15.7 11.4 5.6 10.9 7.8 11.9
Source: Interviews of community members.
The total number community members interviewed were 10800.
Overall, 62.0% of the respondents knew at least one sign/symptom of leprosy. This knowledge was lowest in Delhi (51.2%) and highest in West Bengal (73.5%).
About 59.0% of the community members knew that leprosy was curable. It was the lowest in Madhya Pradesh (44.9%).
The availability of treatment for leprosy free of charge was known to 60.8% of the community members, this was maximum in Orissa (73.4%) and minimum in Delhi (51.2%).
The cause of leprosy (germs/microbiological agent) was known to 11.0% of community members. This knowledge was lowest in Uttar Pradesh (5.6%) and highest in Maharashtra (15.9%). Rest of the community members’ mention the cause of leprosy either immorality, hereditary, curse of God or don’t know.
The main sources of information, in decreasing order, were: 1) health workers, 2) relatives/friends, and 3) T.V., Radio in almost all the states. The other sources of information e.g. posters, billboards, miking, haat/mela, etc. were almost negligible, according to the respondents.

41
VI. Comparison of findings LEM 2002, 2003 and 2004, India
Gaining from last year experience, Monitors had greater conceptual clarity and field experience in LEM 2004. Some of the indicators selected for comparison of findings between LEM 2002, 2003 and 2004, indicate mixed picture of improvement and/or stagnation status of leprosy elimination activities. The difference in the findings could also be due to sampling effect. Hence managers at the field level needs to utilise these indicators constructively considering ground realities.
Table 6.1: Comparison of findings in Elimination indicators
LEM 2002 LEM 2003 LEM 2004 Indicator
(Total Sample figures) % children among new cases 17.5 13.8 14.7
% MB among new cases 33.6 36.9 38.3
% female among new cases 37.3 35.3 35.1
The child proportion, which had decreased in 2003, marginally increased in the LEM
2004. The trend of the MB proportion is slowly increasing. The female proportion remained low and stagnant over the past three years.
Elimination Indicators, India, LEM 2002-2003-2004
17.5
33.637.3
13.8
36.9 35.3
14.7
38.335.1
0
10
20
30
40
50
% children % MB % female
LEM 2002 LEM 2003 LEM 2004

42
Table 6. 2: Comparison of findings in selected Integration indicators
LEM 2002 LEM 2003 LEM 2004 Indicator
Proportion of Health Facilities with: (Total Sample figures) Diagnosis made & Treatment initiated 75.0 74.7 80.1 Treatment register maintained at the facility 35.0 92.2 98.1
MDT services on all working days 77.0 66.7 89.6 Accompanied MDT provided as option 38.0 57.1 59.9
During the last 3 years, integration has made progress, as shown in the above table. Currently, the diagnosis of leprosy is made and the treatment initiated in 80% of the health facilities, providing MDT services on all working days, in 90% of health facilities. The treatment register in maintained at almost all health facilities. The option of providing Accompanied MDT also made good progress, although only 60% of health facilities are providing this service.
Integration Indicators, India, LEM 2002, 2003, 2004
0
20
40
60
80
100
Diagnosis &Treatment initiated
Treatment registermaintained atHealth Facility
MDT services onall working days
A-MDT providedas option
LEM 2002 LEM 2003 LEM 2004

43
Table 6. 3: Comparison of findings in selected Quality of service indicators
LEM 2002 LEM 2003 LEM 2004 Indicator
(Total Sample figures) Median delay in diagnosis (months) 8.6 7.1 7.0 MB cure rate (%) 89.0 83.7 83.9 PB cure rate (%) 94.2 94.1 93.4 The median delay in diagnosis, which had declined in 2003, remained stable at 7 months in 2004. The MB cure rate was still below 85% in 2004. The PB cure rate remained stable, around 93-94% during the past three years.
Quality of MDT services, India, LEM 2002-2003-2004
0
20
40
60
80
100
Median delay indiagnosis (months)
MB cure rate PB cure rate
LEM 2002 LEM 2003 LEM 2004

44
Table 6. 4: Comparison of findings in selected Quality of service indicators
LEM 2002 LEM 2003 LEM 2004 Indicator
Proportion of Health Facilities with: (Total Sample figures) 3-month stock for all categories of BCPs 24.2 20.3 16.7 at least 3 NLEP indicators calculated NA 28.9 33.8 discrepancy between annual reports and treatment registers 36.2 49.4 47.8
The MDT sock management at health facility level has not made progress during the
past three years. The proportion of health facilities having a 3-month stock for all categories of blister packs, according to the number of patients under treatment, remained low. The trends showed a decline, below 20% in 2004.
The use of data, in calculating essential indicators, is slowly improving during the past two years. However, only one third of health facilities had calculated at least 3 essential NLEP indicators.
The quality of recording and reporting is still an issue with no sign of improvement over the years. In almost half of the facilities, discrepancy of data between annual reports and treatment registers were found.
Quality of MDT services, India, LEM 2002-2003-2004 Proportion of Health Facilities with:
0
20
40
60
3-month stock for allBCPs
at least 3 NLEP indicatorscalculated
discrepancy betweenannual reports &
treatment registers
LEM 2002 LEM 2003 LEM 2004
NA

45
Table 6. 5: Comparison of findings in selected Quality of service indicators
LEM 2002 LEM 2003 LEM 2004 Indicator
Proportion of District stores with expired MDT drugs:
(Total Sample figures)
MB-Adult Blister Packs 1.8. 4.4 0.8 MB-Child Blister Packs 5.0 19.2 1.0 PB-Adult Blister Packs 2.0 4.8 2.1 PB-Child Blister Packs 0.7 15.3 1.9
The proportion of district stores with expired MDT blister packs was very high in 2003, especially in the Child category. Major improvement was noticed during the LEM 2004, with only 1-2% of district stores having expired MDT drugs.
Quality of MDT services, India, LEM 2002-2003-2004 Proportion of Expired MDT drugs at District stores
0
5
10
15
20
MBA MBC PBA PBC
LEM 2002 LEM 2003 LEM 2004

46
VII. Validation of leprosy diagnosis
Table 7.1
Description of the Sample for Validation of diagnosis study
Indi
cato
r
Andh
ra
Prad
esh
Biha
r
Chat
tisga
rh
Delh
i
Jhar
khan
d
Karn
atak
a
Mad
hya
Prad
esh
Mah
aras
htra
Oris
sa
Tam
il Na
du
Utta
r Pr
ades
h
Wes
t Ben
gal
Tota
l
Cases listed by NLEP (1)
55
235
202
106
129
73
56
207
110
46
222
69
1510
Cases where attempt was made to contact them
55
229
202
106
128
73
56
181
108
46
208
69
1461
Cases seen by validators (2)
54 158 121 47 109 59 46 152 95 44 130 66 1081
Cases examined by validators (3)
45 134 111 30 100 51 44 133 64 24 96 47 879
Source: Validation teams
(1): All newly detected PB cases in the past 1 month and MB cases in the past 2 months, by the routine NLEP; (2): Cases seen by validators were cases physically present at the validation places; (3): Cases examined were all cases seen by validators except the Re-registered cases.
The overall proportion of cases where attempt was made to contact them was 97% of listed cases. It varied from 87% in Maharahtra to 100% in Andhra Pradesh, Chhattisgarh, Delhi, Karnataka, Madhya Pradesh, Tamil Nadu and West Bengal. No attempt was made to contact some cases when accessibility was very difficult (floods, etc.).
The overall proportion of cases seen by the validators was 71.6%% of listed cases. It
varied from 45% in Delhi, 58.6% in Uttar Pradesh, 60% in Chhattisgarh and to 98% in Andhra Pradesh. The cases that were not seen were represented by: 1) cases where no attempt to contact them was made, 2) cases traced by the validators but not available, and 3) cases traced but not existent (fake cases).
The overall proportion of cases examined by the validators was 60.2% of the total of
cases where attempt was made to contact them. It varied from 28.3% in Delhi and 46.2 in Uttar Pradesh to 81.8% in Andhra Pradesh.

47
Table – 7.2
Proportion of Wrong Diagnosis of leprosy cases
Indi
cato
r
Andh
ra
Prad
esh
Biha
r
Chat
tisga
rh
Delh
i
Jhar
khan
d
Karn
atak
a
Mad
hya
Prad
esh
Mah
aras
htra
Oris
sa
Tam
il Na
du
Utta
r Pr
ades
h
Wes
t Ben
gal
Tota
l
Proportion of wrong diagnosis of: Both PB & MB cases
15.4
4.6
3.7
10.0
6.7
4.2
19.0
12.4
17.2
4.5
11.7
11.9
9.4
PB cases
20.8
4.9
9.5
14.3
2.7
14.3
27.3
18.2
3.4
5.3
22.7
10.0
11.1
MB cases
6.7
4.0
0
6.3
9.4
0
16.1
4.3
28.6
0
8.3
12.5
8.0
Source: Clinical Examination and Observation of Validation teams Overall, the proportion of wrong diagnosis was 9.4%. The states reporting high proportion of wrong diagnosis were Madhya Pradesh (19.2%), Orissa (17.2%), Andhra Pradesh (15.4%), Maharashtra (12.4%), West Bengal (11.9%), and Uttar Pradesh (11.7%). As expected, the proportion of wrong diagnosis was higher for PB cases (11.1%) than for MB cases (8.0%). However, in Orissa more MB cases than PB cases were wrongly diagnosed, as well as West Bengal but the PB case sample was small (11). The wrong diagnosis of PB cases was especially high in Madhya Pradesh (27.3%), Uttar Pradesh (22.7%), Andhra Pradesh (20.8%), Delhi and Karnataka (both 14.3%). The wrong diagnosis of MB cases was high in Orissa (28.6%), Madhya Pradesh (16.1%) and West Bengal (12.5%).
Proportion of Wrong diagnosis (both PB & MB cases), India 2004
19.017.2
15.4
12.411.9
11.7
10.06.7
4.6
4.54.2
3.7
Madhya Pradesh
OrissaAndhra Pradesh
Maharashtra
West BengalUttar Pradesh
Delhi
JharkhandBihar
Tamil Nadu
KarnatakaChhattisgarh
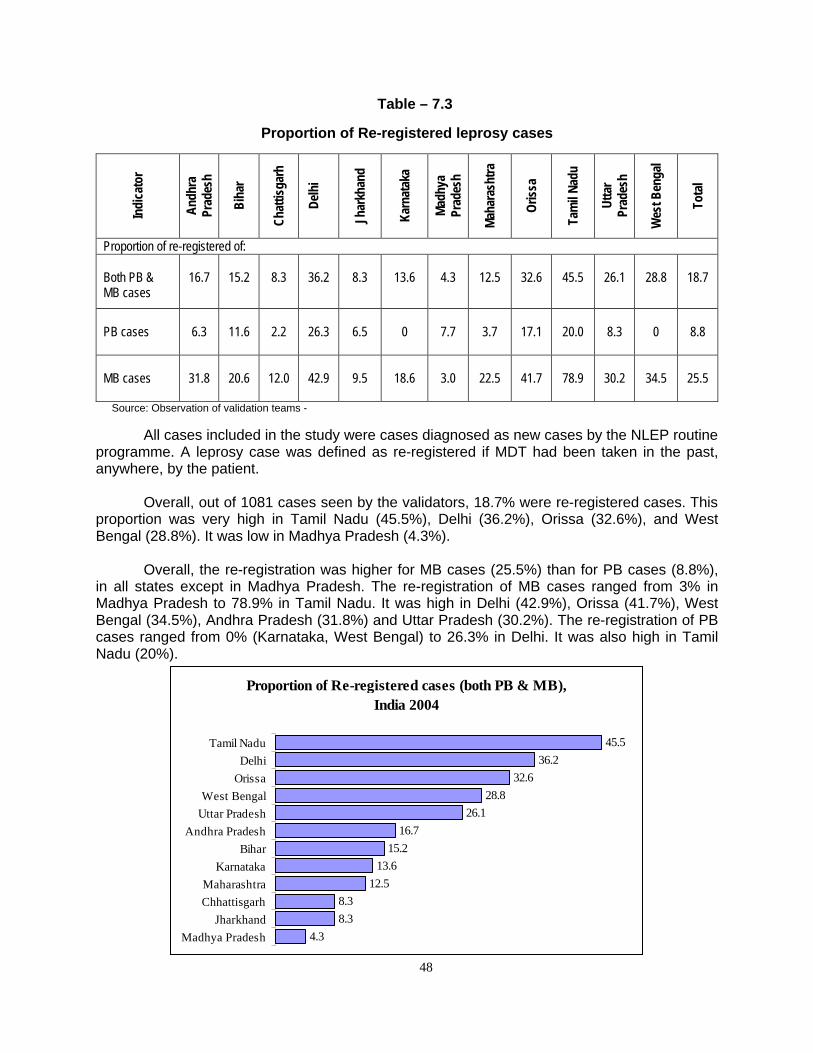
48
Table – 7.3
Proportion of Re-registered leprosy cases
Indi
cato
r
Andh
ra
Prad
esh
Biha
r
Chat
tisga
rh
Delh
i
Jhar
khan
d
Karn
atak
a
Mad
hya
Prad
esh
Mah
aras
htra
Oris
sa
Tam
il Na
du
Utta
r Pr
ades
h
Wes
t Ben
gal
Tota
l
Proportion of re-registered of: Both PB & MB cases
16.7
15.2
8.3
36.2
8.3
13.6
4.3
12.5
32.6
45.5
26.1
28.8
18.7
PB cases
6.3
11.6
2.2
26.3
6.5
0
7.7
3.7
17.1
20.0
8.3
0
8.8
MB cases
31.8
20.6
12.0
42.9
9.5
18.6
3.0
22.5
41.7
78.9
30.2
34.5
25.5
Source: Observation of validation teams - All cases included in the study were cases diagnosed as new cases by the NLEP routine programme. A leprosy case was defined as re-registered if MDT had been taken in the past, anywhere, by the patient. Overall, out of 1081 cases seen by the validators, 18.7% were re-registered cases. This proportion was very high in Tamil Nadu (45.5%), Delhi (36.2%), Orissa (32.6%), and West Bengal (28.8%). It was low in Madhya Pradesh (4.3%). Overall, the re-registration was higher for MB cases (25.5%) than for PB cases (8.8%), in all states except in Madhya Pradesh. The re-registration of MB cases ranged from 3% in Madhya Pradesh to 78.9% in Tamil Nadu. It was high in Delhi (42.9%), Orissa (41.7%), West Bengal (34.5%), Andhra Pradesh (31.8%) and Uttar Pradesh (30.2%). The re-registration of PB cases ranged from 0% (Karnataka, West Bengal) to 26.3% in Delhi. It was also high in Tamil Nadu (20%).
Proportion of Re-registered cases (both PB & MB), India 2004
45.536.2
32.628.8
26.116.7
15.213.6
12.58.38.3
4.3
Tamil NaduDelhi
OrissaWest Bengal
Uttar PradeshAndhra Pradesh
BiharKarnataka
MaharashtraChhattisgarh
JharkhandMadhya Pradesh
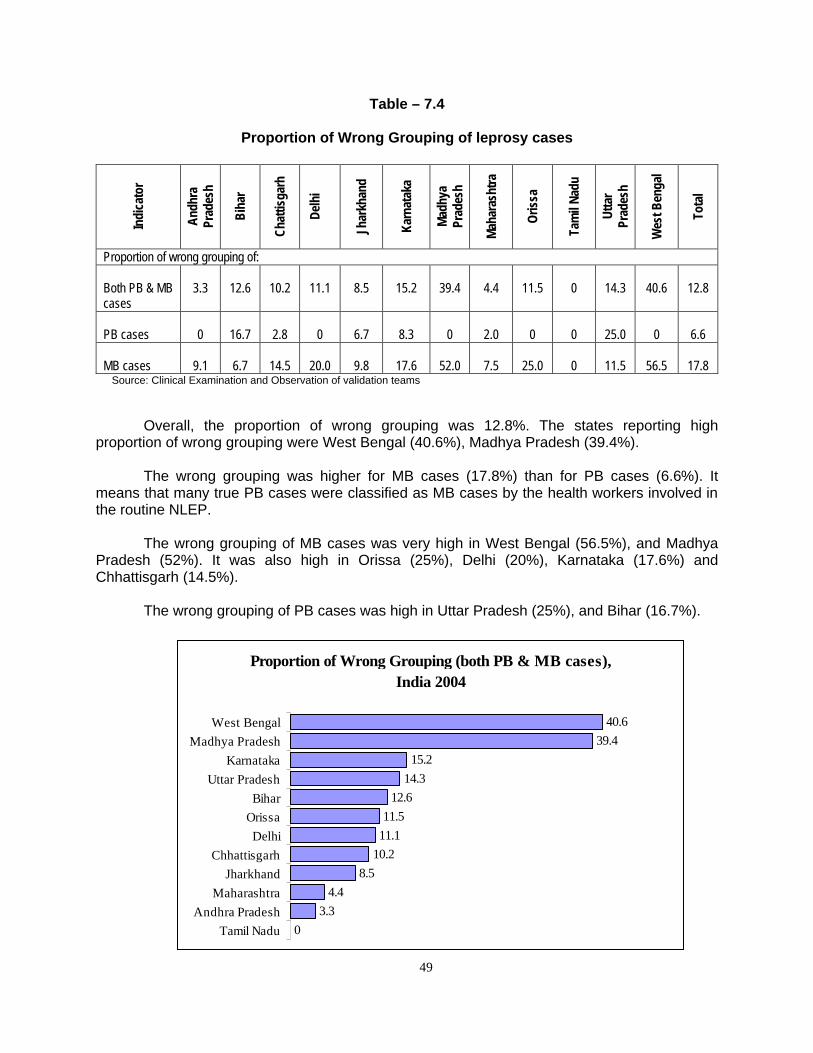
49
Table – 7.4
Proportion of Wrong Grouping of leprosy cases
Indi
cato
r
Andh
ra
Prad
esh
Biha
r
Chat
tisga
rh
Delh
i
Jhar
khan
d
Karn
atak
a
Mad
hya
Prad
esh
Mah
aras
htra
Oris
sa
Tam
il Na
du
Utta
r Pr
ades
h
Wes
t Ben
gal
Tota
l
Proportion of wrong grouping of: Both PB & MB cases
3.3
12.6
10.2
11.1
8.5
15.2
39.4
4.4
11.5
0
14.3
40.6
12.8
PB cases
0
16.7
2.8
0
6.7
8.3
0
2.0
0
0
25.0
0
6.6
MB cases
9.1
6.7
14.5
20.0
9.8
17.6
52.0
7.5
25.0
0
11.5
56.5
17.8
Source: Clinical Examination and Observation of validation teams
Overall, the proportion of wrong grouping was 12.8%. The states reporting high
proportion of wrong grouping were West Bengal (40.6%), Madhya Pradesh (39.4%). The wrong grouping was higher for MB cases (17.8%) than for PB cases (6.6%). It
means that many true PB cases were classified as MB cases by the health workers involved in the routine NLEP.
The wrong grouping of MB cases was very high in West Bengal (56.5%), and Madhya
Pradesh (52%). It was also high in Orissa (25%), Delhi (20%), Karnataka (17.6%) and Chhattisgarh (14.5%).
The wrong grouping of PB cases was high in Uttar Pradesh (25%), and Bihar (16.7%).
Proportion of Wrong Grouping (both PB & MB cases), India 2004
40.639.4
15.214.3
12.611.5
11.110.2
8.54.4
3.30
West BengalMadhya Pradesh
KarnatakaUttar Pradesh
BiharOrissaDelhi
ChhattisgarhJharkhand
MaharashtraAndhra Pradesh
Tamil Nadu
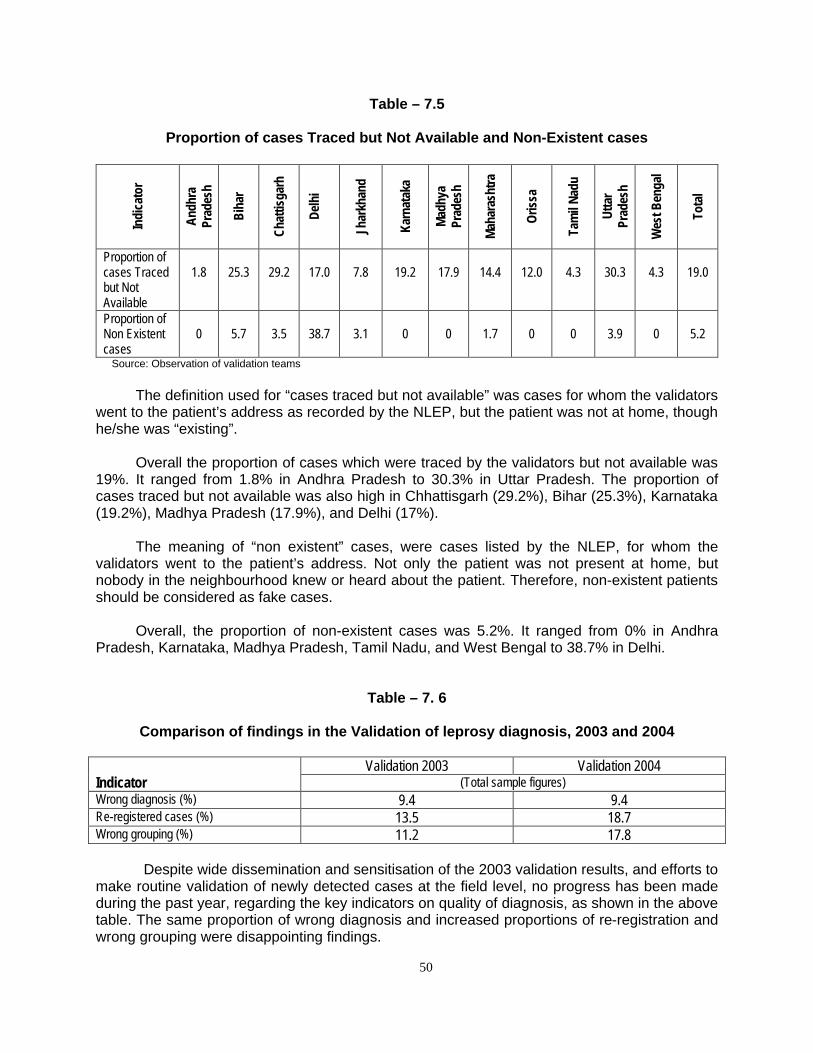
50
Table – 7.5
Proportion of cases Traced but Not Available and Non-Existent cases
Indi
cato
r
Andh
ra
Prad
esh
Biha
r
Chat
tisga
rh
Delh
i
Jhar
khan
d
Karn
atak
a
Mad
hya
Prad
esh
Mah
aras
htra
Oris
sa
Tam
il Na
du
Utta
r Pr
ades
h
Wes
t Ben
gal
Tota
l
Proportion of cases Traced but Not Available
1.8
25.3
29.2
17.0
7.8
19.2
17.9
14.4
12.0
4.3
30.3
4.3
19.0
Proportion of Non Existent cases
0
5.7
3.5
38.7
3.1
0
0
1.7
0
0
3.9
0
5.2
Source: Observation of validation teams
The definition used for “cases traced but not available” was cases for whom the validators went to the patient’s address as recorded by the NLEP, but the patient was not at home, though he/she was “existing”.
Overall the proportion of cases which were traced by the validators but not available was
19%. It ranged from 1.8% in Andhra Pradesh to 30.3% in Uttar Pradesh. The proportion of cases traced but not available was also high in Chhattisgarh (29.2%), Bihar (25.3%), Karnataka (19.2%), Madhya Pradesh (17.9%), and Delhi (17%).
The meaning of “non existent” cases, were cases listed by the NLEP, for whom the
validators went to the patient’s address. Not only the patient was not present at home, but nobody in the neighbourhood knew or heard about the patient. Therefore, non-existent patients should be considered as fake cases.
Overall, the proportion of non-existent cases was 5.2%. It ranged from 0% in Andhra
Pradesh, Karnataka, Madhya Pradesh, Tamil Nadu, and West Bengal to 38.7% in Delhi.
Table – 7. 6
Comparison of findings in the Validation of leprosy diagnosis, 2003 and 2004
Validation 2003 Validation 2004 Indicator (Total sample figures) Wrong diagnosis (%) 9.4 9.4 Re-registered cases (%) 13.5 18.7 Wrong grouping (%) 11.2 17.8
Despite wide dissemination and sensitisation of the 2003 validation results, and efforts to make routine validation of newly detected cases at the field level, no progress has been made during the past year, regarding the key indicators on quality of diagnosis, as shown in the above table. The same proportion of wrong diagnosis and increased proportions of re-registration and wrong grouping were disappointing findings.

51
Conclusions on the Validation of Leprosy Diagnosis The validation of the leprosy diagnosis study, on such a large scale with a rigorous standardised methodology and procedures, was conducted again in 2004, as a follow-up of the one carried out for the first time in 2003. It was conducted in one randomly selected district in each of the 12 priority states. It included a large sample of leprosy cases, recently diagnosed as new cases by the health staff involved in the NLEP. The validation teams have seen 1081 cases, out of which 879 were clinically examined. The remaining 202 cases were detected as re-registered, having taken MDT in the past, and therefore they were considered as “old” cases. Among the 879 cases clinically examined independently by teams of two validators, in which their diagnosis was similar (leprosy or not leprosy) in 93.5% of the time, 9.4% of the cases were non-leprosy cases. This proportion was considered high (>10%) in Madhya Pradesh (19.0%), Orissa (17.2%), Andhra Pradesh (15.4%), Maharashtra (12.4%), West Bengal (11.9%), and Uttar Pradesh (11.7%). It was low in Chhattisgarh (3.7%), Karnataka (4.2%), Tamil Nadu (4.5%), and Bihar (4.6%). As expected, the wrong diagnosis was higher for PB cases (12.9%) than for MB cases (5.8%).
Wrong diagnosis has individual consequence for the patients, having to take a long treatment for a disease which they don’t have. In addition, wrong diagnosis has public health consequences by artificially inflating the prevalence and the new case detection rates.
Among the 879 cases examined by the validation teams, 12.8% of the true leprosy
cases were wrongly classified as MB or PB by the health staff involved in the NLEP. The wrong grouping of patients was high (>10%) in West Bengal (40.6%), Madhya Pradesh (39.4%), Karnataka (15.2%), Uttar Pradesh (14.3%), Bihar (12.6%), Orissa (11.5%), and Delhi (11.1%). It was low in Tamil Nadu (0%), Andhra Pradesh (3.3%), and Maharashtra (4.4%).
The proportion of wrong grouping was higher for MB cases (17.8%) than for PB cases
(6.6%). Most of the wrong grouping by the health staff was by classifying MB cases, cases which were in fact PB cases. This proportion was very high in West Bengal (56.5%) and Madhya Pradesh (52.0%).
The wrong grouping of MB cases has individual consequence for the patients, having to
take 12 months of MDT instead of 6. It also has consequence on the prevalence rate by retaining patients under treatment for a longer period.
Among the 1081 cases seen by the validators, 202 (18.7%) had taken MDT treatment in
the past and therefore were considered as re-registered by the validation team. This finding highlights the fact that the health staff does not systematically ask the question “have you taken MDT previously, anywhere?” at the time of diagnosis. Therefore, the same patient can be registered twice or more at any time he/she goes to a new health facility to seek treatment. This phenomenon is probably important among patients who migrate from one district/state to another, as highlighted by the 36.2% of re-registered cases in Delhi.
The proportion of re-registered cases was higher for MB cases (25.5%) than for PB
cases (8.8%). The proportion of re-registered cases was very high in Tamil Nadu (45.5%), Delhi (36.2%), Orissa (32.6%), West Bengal (28.8%), and Uttar Pradesh (26.1%).
Overall, the agreement between validators was 93.5% on diagnosis, 92.3% on grouping,
92.0% for anaesthetic skin lesion, and 78.7% for nerve thickening.

52
Among the 879 cases examined, the validators disagreed on the diagnosis in 57 cases
(6.5%), one saying it is leprosy, the other saying it is not. As there is no way to determine who was right, these cases had been excluded from the analysis.
The proportion of cases traced by the validators but not available was 19.0%. The
proportion of non-existent (fake) cases was 5.2%. It was maximum (38.7%) in Delhi, and nil in Andhra Pradesh, Karnataka, Madhya Pradesh, Orissa, Tamil Nadu and West Bengal.
Among the total newly detected cases by the health staff during the reference period, the
proportion which was over-reported was around 30-35%. This figure is a real concern. When applied to the entire country, it represents a large number of cases, as well as MDT supply.
The 2004 findings are disappointing, compared to the 2003 results. Same results were
found in wrong diagnosis, and worsening of the re-registration despite efforts made during the last 12 months, in sensitising the health staff involved in the leprosy programme, and also trying to make the validation of diagnosis a routine activity.
Programme managers, at every level, are monitoring the NLEP with essential indicators
such as prevalence and detection rates, which both are significantly influenced by the quality of the leprosy diagnosis.
Sustained efforts should continue to improve the quality of the diagnosis of leprosy at the
field level. Health workers should follow strict and standardised procedures during the clinical examination, especially for the sensory testing and the history of the patient. Strict adherence to the standard case definitions is also a key to improve this important component of the NLEP.

53
CONCLUSIONS
A large-scale LEM survey was conducted in India, covering the 13 most endemic states. The LEM was carried out in an independent manner by the National Institute of Health and Family Welfare, with the technical support of the LEM core group. It is expected that the findings will help programme managers, at various levels, to tackle the gaps identified in the programme implementation. I. Elimination Indicators Prevalence and Detection
In 2003-2004, the reported prevalence and detection were inflated in most of states included in the LEM survey. It was mostly due to operational factors: wrong diagnosis, re-registration of cases and gaps in regular cleaning/updating the registers. In 2003-2004, the Central Leprosy Division, Government of India, took an important decision by stopping case detection targets to the states. Case finding activities
The trends of disability grade-2 among new cases have been steadily declining in all states over the past years. Overall, the median delay of diagnosis among the 13 states was 7.0 months. However, there is still room for improvement as early diagnosis and treatment could bring down even more the proportion of disability grade-2. Here also, the re-registration of old cases artificially inflated this indicator.
The proportion of female among new cases showed wide differences among the 13 states, ranging from 17.5% in Delhi to 45.0% in Andhra Pradesh, with an average of 35.1%. There is no epidemiological reason for explaining these variations. Various level of awareness among female from state to state might be a factor, but this finding needs to be further investigated.
The NCDR among SC and ST was compared to NCDR in non-SC and non-ST (General) population of the various States. In all the states, except for Tamil Nadu and West Bengal, the NCDR among SC was higher than the NCDR among non-SC and non-ST population. The NCDR among ST was higher than non SC and non ST population in all the states, except in Chhattisgarh. This could be the result of more targeted elimination activities or a higher risk of getting the disease among the SC/ST population. In Tamil Nadu and West Bengal the proportion of SC cases was lower as well as the proportion of ST in Chhattisgarh. This could be attributed to an inadequate leprosy services coverage or to a lower risk of getting the disease for the generally ST scattered population. In any case, these findings need to be further investigated to better tackle the elimination of leprosy among the SC and ST population.
II. Status of Integration with general health services
The integration of MDT services defined as diagnosing leprosy cases, providing MDT drugs, maintaining leprosy records and sending reports, was assessed by observations of Monitors at health facilities. The position of MDT stock in various health facilities and leprosy records were also studied.

54
Health facilities providing MDT services As per the observations of monitors at selected health facilities visited by them, in about
80% of health facilities MDT services were available by general health staff, and on all working days in 89.6% of health facilities visited. This showed that structural integration had made progress.
Availability of MDT blister packs The proportion of health facilities that had at least 3 months stock of each category of MDT blister packs was only 16.7% of all health facilities visited, ranging from 0% in Jharkhand to 40.7% in West Bengal. In Tamil Nadu, all the categories of drugs found were in excess. There was excess of MB-Child blister packs stock in Andhra Pradesh, Karnataka, Maharashtra, Madhya Pradesh, Orissa, Tamil Nadu, Uttaranchal and Uttar Pradesh. Excess was also found for PB-Child in Delhi, Madhya Pradesh, Tamil Nadu and Uttar Pradesh. Shortages of MB-Adult were found in Chhattisgarh, Jharkhand and Madhya Pradesh, as well as short supply of PB-Adult blister packs in Jharkhand and Madhya Pradesh.
These findings showed that MDT stock management at health facility and district levels is still a major issue. The availability of MDT drugs is not a problem, but adequate distribution of MDT blister packs, in relation to the number of cases at health facilities, is a major concern. The patient-months indicator, included in the SIS format was found rarely used at these levels by the programme managers. Probably managers are not sensitive or either not trained to calculated patient months blister packs. According to GoI, district and state authorities should maintain this parameter as close to ‘3’ as possible. A major effort is needed to ensure that adequate stock of MDT drugs, without shortage or excess, is regularly maintained at health facility and district levels. Accessibility of patients to MDT – Distance and Cost
The patients taking treatment from health facilities were interviewed by the monitors. In general, the median distance travelled by patients in order to collect MDT was 2.0 kms. In Madhya Pradesh the median distance travelled by patients was the least (1.0 km.) and the maximum median value of 8.0 kms was for Delhi. The median money spent for travel cost (both ways) was Rs. 10.0. Flexibility in delivering MDT
In nearly 89.6% of health facilities, MDT services were available on all working days of the month.
The option of providing accompanied MDT, for patients who needed it, was being
followed in nearly 60% of the health facilities visited by the monitors, ranging from 27.2% in Maharashtra to 100% in Delhi. Accompanied MDT is offered to patients who are unable to come to health facilities for treatment due to social stigma, migration, employment etc.
The integration process was observed to have progressed satisfactorily, yet the level of
integration varied from state to state. Efforts to enhance integration should be made in Andhra Pradesh, Madhya Pradesh and West Bengal.

55
III. Quality of MDT Services
As per the records maintained at health facilities visited by survey teams, all the newly diagnosed leprosy cases were being treated with MDT. Quality of diagnosis Accuracy of leprosy diagnosis is a very important component of the National Leprosy Elimination Programme, both from an individual point of view as well as a public health perspective. The results of the validation study showed that an average of 9.4% of cases were in fact not leprosy, therefore they were wrongly diagnosed. Wide variations occurred among states from 3.7% (Chhattisgarh) to 19% (Madhya Pradesh). Similarly, the proportion of re-registered cases was 18.7% overall, with some states reporting more than 35% of re-registered case (Tamil Nadu, Delhi). This finding clearly showed that correct history of patients was not adequately taken at the time of diagnosis. The proportion of wrong grouping of leprosy cases was 12.8% overall. Wrong classification was higher for MB cases (17.8%) than for PB cases (6.6%). It means that a significant proportion of cases diagnosed as MB were in fact true PB cases, and therefore received a 12-month treatment instead of the 6-month doses necessary for PB. It was also found that 5.2% of newly detected cases by the health staff was non existent (fake cases). Altogether, it can be considered that about 30-35% of leprosy cases were over-reported. When applied to the entire country, this proportion represents a large number of individuals, who received a treatment which was not needed. Cure rate
The status of case holding was assessed by cohort analysis by survey teams. The cured case was considered as a patient who completed full course of MDT (12 doses for MB, 6 doses for PB). The defaulter was a patient who did not take treatment consecutively for more than 12 months.
The overall cure rate was 83.9% for MB and 93.4% for PB cases in the health facilities
visited in these states. Within these states, the MB cure rate ranged from 32.8% in Karnataka and 64.4% in
Delhi to a maximum of 93.9% in Madhya Pradesh and Maharashtra. The cure rate for PB was lowest in Delhi (66.2%). Defaulter rate
The defaulter proportion was 6.5% for MB and 3.7% for PB. The high MB defaulter rates were found in Delhi (27.8%), Bihar and West Bengal (29.9%). In Andhra Pradesh, Chhattisgarh, Madhya Pradesh, Karnataka, Maharashtra and Tamil Nadu it was below 2%.
The PB defaulter rate was 31.4% in Delhi and 28.7% in West Bengal. In Bihar,
Chhattisgarh, Orissa, Karnataka, Madhya Pradesh and Maharashtra it was below 2.0%.
Cases continuing treatment after completing fixed duration of MDT It was observed that 1.3% of MB cases and 1.6% of PB cases continued treatment after
completion of fixed duration MDT.
56
Quality of MDT blister packs At the state stores, out of the examined stock, 94.3% (MBA), 100% (MBC), 96.8% (PBA) and 98.8% (PBC) were of good quality blister packs. Damaged/expired drugs were mainly found in Chhattisgarh, Jharkhand and Madhya Pradesh.
At the district stores, the proportion MDT blister packs found damaged was 10.6% MBA in Chhattisgarh and 7.4% MBA in Jharkhand. The expired MDT blister packs were mainly reported from Madhya Pradesh Tamil Nadu, Orissa and Uttaranchal.
At health facility level, the highest proportion of damaged blister packs was found in
Delhi and Maharashtra. The highest proportion of expired MDT blister packs was found in Chhattisgarh, Uttaranchal and Tamil Nadu. IV. Status of implementation of Simplified Information System (SIS)
In general, the status of implementation of SIS in various states had made some good progress from last year’s performance, irrespective of state variations, but important gaps were still found.
Overall, 47.1% of the health facilities visited by monitors had SIS guidelines. The range
was 6.8% in Uttaranchal and Karnataka to 100% in Andhra Pradesh. Overall, 94.6% of health facilities had SIS patient cards, 94.9% had new SIS treatment
register, 84.2% had SIS MDT drug register and 98.0% of the visited health facilities had SIS monthly reporting format. 96.0% of the health facilities had sent their last monthly report on the new format.
Only in 33.8% of health facilities, at least three NLEP monitoring indicators were being
calculated, ranging from 0% in Delhi to 80.8% in Andhra Pradesh. Quality of recording and reporting
The leprosy records from treatment register were compared with annual report (12 monthly progress reports from April 2003 to March 2004) for new cases detected. Among these states, in 47.8% of the health facilities there was discrepancy between registered and reported new cases. The discrepancy was high in nearly all the states except Andhra Pradesh. The cause of discrepancy was delay in updating the registers and errors in compilation of data. Completeness and Timeliness of Reporting
Nearly 80.6% of the health facilities had mentioned the complete information/data on the latest available monthly progress reports including drug stock and its expiry. In Delhi only 61.9% and in Uttaranchal 98.8% had mentioned complete information. Information of drug stock and expiry dates is important in better stock management to prevent drug damage/expiry.
Nearly 85.0% of the health facilities had sent the April 2004 monthly report (LF04) to the
district headquarters by the day of visit of monitors. In Andhra Pradesh, it was only 74.6% and in Jharkhand 96.5% of the health facilities had sent their report on time. Almost all the visited districts (98.6%) had sent the April 2004 (LF05) to the state headquarters on time except in the states of Orissa (83.0%), Uttar Pradesh (85.0%) and West Bengal (75.0% of the visited district).

57
The proportion of districts which sent the April report to the state was significantly higher that the proportion of health facilities which sent the April report to the district. It clearly showed that some district reports sent to the state were incomplete, with missing reports from some health facilities. The incomplete compilation of health facility reports at district headquarters artificially under-estimated the real prevalence, detection and MDT stock.
The objective of any information system is to use data for decision making. The LEM findings showed that this objective was achieved by very few of the health facilities visited. Therefore, the monitoring component of the SIS at block level was rarely utilised, making it difficult for leprosy managers to take corrective actions.
The SIS is one of the components of the NLEP that needs to be strengthened and
sustained, if a decent routine monitoring system is to be in place. V. Status of community awareness about leprosy
Overall, 62.0% of the respondents knew at least one sign/symptom of leprosy. This
knowledge was lowest in Delhi (51.0%) and highest in West Bengal (73.0%). About 59.0% of the community members knew that leprosy was curable. The range was from 44.9% (Madhya Pradesh) to 66.8% (Jharkhand and West Bengal). The availability of treatment for leprosy free of charge was known to 60.0% of the community members, this was maximum in Orissa (73.4%) and minimum in Delhi (51.0%). The cause of leprosy (germ/microbiological agent) was known to 11.0% of community member. This knowledge was lowest in Uttar Pradesh (5.6%) and highest in Maharashtra and Madhya Pradesh (15.0%).
In general the awareness of community members about cause of leprosy was low in all
the states. IEC and Inter Personal Communication should focus in spreading clear and crisp message regarding sign/symptom of leprosy, leprosy being curable, leprosy treatment being available free of cost and correct cause of leprosy (germ/microbiological agent).
The main sources of information, by order of importance, were: 1) health workers, 2)
relatives/friends, and 3) TV/radio. The other sources of information used by the NLEP programme (e.g. posters, billboards, miking, haat/mela, etc.) were negligible according to the community members interviewed. VI. Additional observations of Monitors
In addition to the LEM indicators, Monitors made some other important observations, which were valid for most of the states visited. It included:
Supervision of the NLEP was poor in a large number of districts visited. It was attributed to
multiple tasks given to the DLOs, lack of mobility, and priorities given to other national programmes
Coordination between the different actors and partners of the NLEP was also noticed by
many monitors. It involved lack of communication between district managers and peripheral staff at health facility level, as well as poor coordination with various NGOs involved in leprosy services. Some of the teaching hospital and larger urban health facilities were not following the standard definitions and treatment guidelines as mentioned in NLEP. Some of them were not found to be reporting to local district authorities.

58
In some of the districts vertical infrastructure were still operational due to non receival of
Government orders towards integration/dismantle. Most of the visited districts had no proper IEC plan and expressed their helpness towards its implementation due to paucity of funds.
It was also found by the monitors that many teaching hospitals were neither following the
updated strategy for Elimination of Leprosy, nor the Government of India guidelines. It was not uncommon to observe that the fixed duration for MB treatment was taught to be 24 months instead of the 12 months. Similarly, the standard leprosy case definitions of a new case, a defaulter and a cured case were not used by most of the teaching hospitals. Teaching materials on leprosy were also found to be outdated on many occasions.
Definition of roles among former NLEP vertical staff and general health care staff was still
not clear in various states

59
RECOMMENDATIONS State and District authorities have done a commendable job towards Elimination of Leprosy from the country. They need to sustain and strengthen their ongoing Leprosy activities. Based on the findings of the LEM 2004, the following recommendations have been formulated: Elimination
• Enquire past use of MDT (old case) at time of diagnosis. • Ensure that old leprosy case when present to another health facility from which the
diagnosis had been originally made are given MDT as per requirement (only when needed) but are not included and reported as new cases detected, to avoid re-registration.
• Wrong diagnosis of cases should be reduced by applying standard clinical diagnosis procedures (especially in testing sensory loss and nerve thickening).
• Enhance case detection among female, especially in the states where the female detection ratio is low by involving Anganwadi Worker (ICDS) and MPW (F).
• Reduce the delay in diagnosis in areas not well covered by the IEC programme. • The leprosy register should be updated monthly at the time of reporting, thus deleting
patients according to the standard definitions, of case, cured and defaulter. • Analyse SC and ST cases data at block level, with the SC and ST population data, in
order to determine if the leprosy services coverage is adequate or not. Integration
• Enhance/sustain the MDT coverage in urban/rural areas by making MDT services available to communities in a patient friendly environment and compassionate manner, by making MDT services available through all functioning health facilities, on all working days, as for any other disease.
• The integration of MDT services with the general health care staff should be strengthened.
• In areas where the structural integration has been done by dismantling the vertical structures and re-deployment of the NLEP staff, ensure that the general health care staff is involved in diagnosis, treatment and special efforts should be made for the records and reports maintenance.
• Mind set of the workers may take some more time towards integration but all-vertical infrastructure should be integrated with GHS.
MDT stock management at health facility and district levels
• Improve the MDT supply and stock management at district and health facility levels, by regular indent based on the caseload. Ensure availability of all categories of MDT drugs in peripheral of health facilities, by following the Government of India MDT stock management guidelines. Health staff at health facility and district levels should regularly assess the adequacy of MDT stock by using the blister pack patient-months indicator.
• Re-deploy excess of MDT drugs to other districts/blocks accordingly, based on the blister pack patient-month indicator.
• Ensure an adequate storage of MDT drugs. Use the principle of FIFO (First In – First Out) in drug management. First use the blister packs with the shortest expiry date. Keep updated the MDT drug register at the health facility and district levels.
• Destroy expired and/or damaged MDT stock.

60
Quality of MDT services • All health workers (including specialist in teaching hospital and urban health facilities)
should strictly follow the Government of India (GoI) guidelines on the fixed duration of treatment (12 months for MB and 6 months for PB patients).
• Ensure the completion of treatment for all patients under MDT. • Patients likely to be irregular should be provided the option of Accompanied-MDT. • Adequate counselling of patients, especially at the time of diagnosis and initiation of
treatment should be promoted. • The quality of patient records and leprosy registers should be improved by monthly
updating the information. • The completeness and timeliness of reporting to the higher level should be improved,
especially with the implementation of the new Simplified Information System.
Implementation of SIS • The state governments should ensure that all the reporting and recording formats and
SIS guidelines are available at health facility level. • Ensure completeness and timeliness of the monthly progress reports. • Old recording and reporting formats should be discarded. • The staff should be oriented to calculate, interpret and use the essential NLEP indicators
for monitoring the programme and taking corrective measures accordingly. District Leprosy Officers, WHO/NLEP coordinators and District Technical Support Teams should be involved in this process. The use of graphs and maps should be promoted for a better monitoring.
Community awareness about leprosy • IEC should specifically focus on the dissemination of information on sign/symptoms and
cause of leprosy, leprosy being curable and treatment available free of charge at health facilities.
• Interpersonal communication during field visit of health workers should be further strengthened.
• TV should be used more extensively for dissemination of these messages Training: • On-the-job training of health staff at health facilities should be done for diagnosis,
grouping of leprosy cases, MDT stock management, and maintenance of records and reports. They should also be oriented to take proper detailed history of cases at the time of diagnosis to rule out re-registered cases.
• Teaching institutions involved in leprosy should update their curriculum and training materials, in accordance with the strategy and policies given by the Central Leprosy Division, Government of India.

61
Annexure – I
List of LEM Team Members (Monitors) Andhra Pradesh Bihar
1. Dr. T.S.R. Sai 1. Dr. Neeraj Bedi 2. Dr. K.S. Sudhakar 2. Dr. Rajan Shukla 3. Dr. A. Kameshwar Rao 3. Dr. Mithila Dayanithi 4. Dr. B.R. Mahapatra 4. Dr. V.B. Sharan
5. Dr. T. Bir 6. Dr. Saurab Jain
7. Dr. Sonu Goel Chhattisgarh 8. Dr. Himanshu B. Barwar
1. Dr. H.S. Agarwal Delhi 2. Mr. M.A. Khalid 3. Dr. Ajay Handa 1. Dr. Sunder Lal 4. Dr. (Col.) A.L. Sharma 2. Dr. Mohit Singh
Jharkhand Karnataka
1. Dr. D.A. Dev 1. Dr. Ranjan Das 2. Dr. Sandeep Rai 2. Dr. Mr. Franklin 3. Dr. J.A. Khan 3. Dr. L. Swasticharan 4. Mr. S.P. Singh 4. Mr. Sudhakar 5. Dr. (Mrs.) Tarenakar 5. Dr. Salig Ram 6. Dr. B.K. Panda 6. Dr. P.N. Halagi
Maharashtra Madhya Pradesh
1. Dr. Jyoti 1. Dr. S.C. Tiwari 2. Dr. (Col.) S.S. Verma 2. Dr. P. Jadhar 3. Dr. P.V. Bahulekar 3. Dr. Yash Saraf 4. Dr. S.G. Bhure 4. Dr. Bhaskar 5. Dr. P.R.Deshmukh 5. Dr. Sunil Nandeshwar 6. Dr. Astankar 6. Dr. Yunus Mohamad
Orissa Tamil Nadu
1. Dr. M. Behera 1. Dr. M.L. Showkat Ali 2. Dr. D. Bhuyan 2. Mr. Elango (DFIT) 3. Dr. V. Santaram 3. Dr. D.M. Thorat 4. Dr. S.M.R. Kadam 4. Dr. Prabhakar Rao 5. Dr. D.C. Mohapatra 5. Dr. Anmol Gupta 6. Dr. Sanjeev Davey 6. Dr. N. Elango (GLRA)

62
Uttar Pradesh Uttaranchal
1. Dr. Sangeeta 1. Dr. R.B. Jain 2. Dr. S.N. Mishra 2. Dr. V.K. Misra 3. Dr. S.C. Gupta 3. Dr. M.S. Punia 4. Dr. Ved Pal Singh 4. Dr. S.K. Maheshwari 5. Dr. A.M. Dixit 6. Dr. K. Mahmood West Bengal 7. Dr. G.K. Gupta 8. Dr. D.K. Giri 1. Dr. Asis De 9. Dr. S. Goel 2. Dr. Jeram parmar 10. Dr. Rajesh Pandey 3. Dr. Tusharkant Dey 11. Dr. A.K. Malhotra 4. Dr. H.G. Thakor 12. Dr. Rashmi Shukla 13. Dr. S.B. Gupta 14. Dr. A.K. Singh

63
Annexure – II
List of Validation Teams (1 & 2 = Validators, 3 = District Facilitators)
Andhra Pradesh Bihar
1. Dr. M.N. Casabianca 1. Dr. Veera Kumar 2. Dr. D.C. Mohapatara 2. Dr. Ajay N. Walter 3. Mr. John Aruldoss 3. Mr. Peter Paul
Chhattisgarh Delhi
1. Dr. Raman 1. Dr. V.K. Jain 2. Dr. R. Nagesh 2. Dr. Vijayshankar 3. Mr. Appalaswamy 3. Mr. Anil Kumar
Jharkhand Karnataka
1. Dr. A.K. Mishra 1. Dr. M.V. Bhatt 2. Dr. R. Nagesh 2. Dr. Sumit Talukdar 3. Mr. Srinivasan 3. Mr. Rajesh
Maharashtra Madhya Pradesh
1. Dr. R.K. Mishra 1. Dr. Shivakumar 2. Dr. Subash Chandra Reddy 2. Dr. Rathore 3. Mr. Nemade Rajeev K. 3. Mr. B.S. Raghuwanshi
Orissa Tamil Nadu
1. Dr. R.K. Mishra 1. Dr. Balasubramanyam 2. Dr. Durai Venkatesan 2. Dr. Durai Venkatesan 3. Mr. V.K. Gochayat 3. Mr. P.G. Rajendaran
Uttar Pradesh West Bengal
1. Dr. Sekar 1. Dr. A.K. Mishra 2. Dr. Govida 2. Dr. Parareddy 3. Mr. Amar Kashyap 3. Mr. S. Saha