lernen, wissen, daten, analysen (lwda ... · exploring the application potential of relational web...
TRANSCRIPT

Exploring the Application Potential of Relational Web Tables
Prof. Dr. Christian Bizer
Lernen, Wissen, Daten, Analysen (LWDA)Hasso Plattner Institute, Potsdam
13.9.2016

09/13/2016 Bizer: Exploring the Application Potential of Relational Web Tables 2
Hello
Professor Christian Bizer
University of Mannheim
Research Topics• Web Technologies• Web Data Integration• Web Data Profiling

09/13/2016 Bizer: Exploring the Application Potential of Relational Web Tables 3
Data and Web Science Group @ University of Mannheim
• 5 Professors• Heiner Stuckenschmidt• Rainer Gemulla• Christian Bizer• Simone Ponzetto• Heiko Paulheim
• http://dws.informatik.uni‐mannheim.de/
1. Research methods for integrating and mining heterogeneous information from the Web
2. Empirically analyze the content and structure of the Web

09/13/2016 Bizer: Exploring the Application Potential of Relational Web Tables 4
Application Potential of Relational Web Tables
Main applications so far1. Table Augmentation 2. Data Translation
09/13/2016 Bizer: Exploring the Application Potential of Relational Web Tables 5
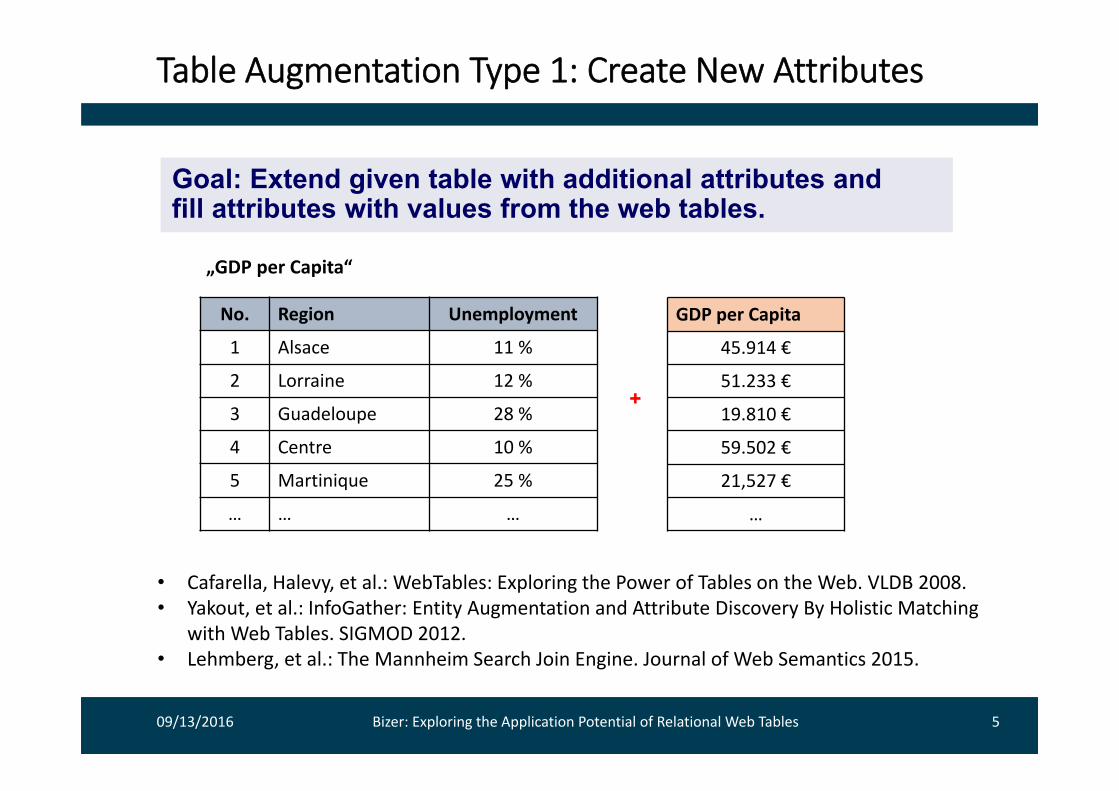
Table Augmentation Type 1: Create New Attributes
No. Region Unemployment
1 Alsace 11 %
2 Lorraine 12 %
3 Guadeloupe 28 %
4 Centre 10 %
5 Martinique 25 %
… … …
GDP per Capita
45.914 €
51.233 €
19.810 €
59.502 €
21,527 €
…
+
„GDP per Capita“
• Cafarella, Halevy, et al.: WebTables: Exploring the Power of Tables on the Web. VLDB 2008.• Yakout, et al.: InfoGather: Entity Augmentation and Attribute Discovery By Holistic Matching
with Web Tables. SIGMOD 2012.• Lehmberg, et al.: The Mannheim Search Join Engine. Journal of Web Semantics 2015.
Goal: Extend given table with additional attributes andfill attributes with values from the web tables.

09/13/2016 Bizer: Exploring the Application Potential of Relational Web Tables 6
Table Augmentation Type 2: Fill Missing Values
• Interesting for cross‐domain knowledge bases• Easier as more existing knowledge can be exploited
Web TablesCorpus
Country Capital Population
Germany Berlin
France 64,000,000
United Kingdom London 60,900,000
Canada
USA Washington D.C.
Mexico Mexico City 109,900,00Country Capital Population
Germany Berlin 82,000,000
France Paris 64,000,000
United Kingdom London 61,000,000
Canada Ottawa 33,000,000
USA Washington D.C. 304,000,000
Mexico Mexico City 110,000,00
• Dong, et al.: Knowledge Vault: A Web‐Scale Approach to Probabilistic Knowledge Fusion. KDD 2014. • Ritze, et al: Profiling the Potential of Web Tables for Augmenting Knowledge Bases. WWW 2016.

09/13/2016 Bizer: Exploring the Application Potential of Relational Web Tables 7
The Table Augmentation Process
1. Extraction 2. Matching 3. Fusion
Code Code

Outline
1. WDC Web Table Corpus2. Matching the WDC Corpus to DBpedia3. Fusing Web Table Data 4. Lessons Learned
09/13/2016 Bizer: Exploring the Application Potential of Relational Web Tables 8

1. Web Data Commons (WDC) Web Tables Corpus
• Early research used tables from Google and Bing crawls• Cafarella/Halevy (2008): In corpus of 14B raw tables, 154M are “good” relations (1.1%).
• Yakout, et al. (2012): 650M single‐attribute tables
• Problem: Crawls/tables not public, research not verifiable• Common Crawl enabled public research in this area
• Series of 1.8‐3.5 billion page public web crawls, since 2012
• Public Web Table Corpora• WDC Web Tables Corpus 2012: 147 million web tables• Dresden Web Tables Corpus 2014: 125 million web tables• WDC Web Tables Corpus 2015: 233 million web tables
• http://webdatacommons.org/webtables
09/13/2016 Bizer: Exploring the Application Potential of Relational Web Tables 9

Table Extraction & Classification
1. Common Crawl 2012• 3,3b HTML pages• from 40m PLDs
2. HTML Table Extraction• 11b HTML tables
10
3. Layout vs. Relational Table Classification• 147m relational tables (1.3%)
4. Filtering by Size & Language• At least three columns & five rows• Only English language• 33m resulting tables
Layout98,7%
Relational EnglishMin. Size: 0,3%
Relational Non‐English Small:
1,0%
09/13/2016 Bizer: Exploring the Application Potential of Relational Web Tables

Most Frequent Websites
04/14/2015 University of Mannheim; Ritze, Lehmberg, Oulabi, Bizer: Profiling Web Tables for Augmenting KBs 11
Website # Tables Topicapple.com 50,910 Music
baseball‐reference.com 25,647 Sports
latestf1news.com 17,726 Sports
nascar.com 17,465 Sports
amazon.com 16,551 Products
wikipedia.org 13,993 Various
inkjetsuperstore.com 12,282 Products
flightmemory.com 8,044 Flights
windshieldguy.com 7,305 Products
citytowninfo.com 6,293 Cities
blogspot.com 4,762 Various
7digital.com 4,462 Music

09/13/2016 Bizer: Exploring the Application Potential of Relational Web Tables 12
Types of Web Tables
1. Relational Tables 2. Entity Tables
Table Types in WDC 2015 Corpus
#Type #Tables % of all tables
Relational 90,266,223 0.90
Entity 139,687,207 1.40
Matrix 3,086,430 0.03
Sum 233,039,860 2.25
3. Matrix
• Eberius, et al.: Building the Dresden Web Table Corpus: A Classification Approach. BDC 2015.• Qiu, et al.:, DEXTER: Large‐Scale Discovery and Extraction of Product Specifications, VLDB 2015.

Assumptions of the Existing Extension Algorithms
1. Input is corpus of relational tables• One entity per row
2. Each table has a subject column • name of the entity• string, no number or other data type• used as pseudo‐key• accuracy of automatic subject column detection: >90%
Rank Film Studio Director Length
1. Star Wars –Episode 1 Lucasfilm George Lucas 121 min
2. Alien Brandwine Ridley Scott 117 min
3. Black Moon NEF Louis Malle 100 min
09/13/2016 Bizer: Exploring the Application Potential of Relational Web Tables 13

09/13/2016 Bizer: Exploring the Application Potential of Relational Web Tables 14
• Manual annotation of 400 relational tables (1,814 columns)
• Binary• Attribute depends onlyon subject column (key)
• N‐Ary• Attribute depends onsubject key and otherpartial keys contained on the page around the table
• e.g. type or date of competition in sports results
Attribute Dependency on Subject Column
Lehmberg, et al.: Web Table Column Categorisation and Profiling. WebDB 2016.

• T2K Matching Framework creates • Table‐to‐Class correspondences• Row‐to‐Instance correspondences• Column‐to‐Property correspondences
• Size of DBpedia (2014) • 680 classes• 2700 properties• 4.5 millioninstances
Year Game Company
2007 Portal Valve Corporation
2008 Fallout 3 Bethesda Game Studios
2009 Uncharted 2: Among Thieves Naughty Dog2010 Red Dead Redemption Rockstar San Diego
2011 The Elder Scrolls V: Skyrim Bethesda Game Studios
2012 Journey Thatgamecompany2013 The Last of Us Naughty Dog
2014 Middle‐earth: Shadow of Mordor Monolith Productions
2015 The Witcher 3: Wild Hunt CD Projekt RED
2. Table Matching
15
DBpedia:Developer
DBpedia:Portal
DBpedia:VideoGame
Ritze, et al.: Matching HTML Tables to DBpedia. WIMS 2015.
09/13/2016 Bizer: Exploring the Application Potential of Relational Web Tables

T2K Table Matching Algorithm
16
Candidate Selection
Class Decision
Candidate Refinement
Identity Resolution
Schema Matching
Candidate Class Distribution
Add/Remove Candidates
Tested on gold standard of 233 tables• 26,124 instance correspondences • 653 property correspondences
Task Precision Recall F1Instance .90 .76 .82Property .77 .65 .70Class .94 .94 .94
Iterate until results stabilize
09/13/2016 Bizer: Exploring the Application Potential of Relational Web Tables
Ritze, et al.: Matching HTML Tables to DBpedia. WIMS 2015.

• Approx. 1 million tables match DBpedia (~3%)• 13,726,582 instance correspondences• 562,445 property correspondences• 301,450 tables with property correspondences (ca. 32%)• = 8 million triples
• Content variety• 274 different classes (40% of DBpedia)• 721 unique properties (26% of DBpedia)• 717,174 unique instances (15.6% of DBpedia)
• Head vs. tail instances• 30% appear only once• 25% appear at least in 10 sources• 3% appear in more than 100 sources
Table Matching Results
1709/13/2016 Bizer: Exploring the Application Potential of Relational Web Tables

Table Matching – Detailed Results
DBpedia Class Number of Tables/Values Number of Values per Data TypeTables T. w/ property Values Numeric Date String Reference
Person 265 685 103 801 4 176 370 2 117 793 1 588 475 266 628 203 474Athlete 243 322 95 916 3 861 641 2 084 017 1 435 775 163 771 178 078Artist 9 981 2 356 18 886 3 11 527 3 499 3 857Politician 3 701 1 388 18 505 10 7 725 3 393 7 377Office Holder 2 178 1 435 131 633 30 66 762 59 332 5 509Organisation 194 317 36 402 573 633 99 714 187 370 100 710 185 839Company 97 891 6 943 203 899 58 621 83 001 34 665 27 612Sports Team 50 043 2 722 31 866 2 206 22 368 43 7 249Educational Inst. 25 737 14 415 238 365 38 056 64 578 13 334 122 397Broadcaster 14 515 11 315 93 042 564 13 095 52 186 27 197Work 269 570 127 677 2 284 916 109 265 1 354 923 33 091 787 637Musical Work 138 676 80 880 1 131 167 64 545 396 940 7 610 662 072Film 43 163 9 725 256 425 10 844 198 913 14 382 32 286Software 39 382 23 829 486 868 418 414 092 9 194 63 164Place 133 141 24 341 859 995 413 375 273 510 84 111 88 999Populated Place 119 361 21 486 787 854 405 406 257 780 57 064 67 604Country 36 009 6 556 208 886 93 107 66 492 31 793 17 494Settlement 17 388 2 672 17 585 4 492 6 662 2 444 3 987Region 12 109 427 5 625 3 097 897 292 1 339Architect. Struct. 10 136 1 815 46 067 3 976 7 387 23 110 11 594Natural Place 1 704 254 2 568 866 696 340 666Species 14 247 4 893 83 359 ‐ 7 902 38 682 36 775Σ 949 970 301 450 8 037 562 2 751 105 3 437 420 536 526 1 312 511
1809/13/2016 Bizer: Exploring the Application Potential of Relational Web Tables

3. Data Fusion
• Next Step: Estimate the quality of the values that can be added to the knowledge base
• Quality depends on data fusion strategy
• Recent research in this area• Knowledge‐based Trust as fusion strategy (KBT)• Local Closed World Assumption for evaluation (LCWA)
19
Country CityGermany BerlinFrance ParisUnited Kingdom LondonCanada OttawaUSA Washington D.C.Mexico Ecatepec
Web Table
?
?
Country CapitalGermany BerlinFranceUnited Kingdom LondonCanadaUSA Washington D.C.Mexico Mexico City
Knowledge Base
09/13/2016 Bizer: Exploring the Application Potential of Relational Web Tables
Dong, et al.: Knowledge Vault: A Web‐Scale Approach to Probabilistic Knowledge Fusion. KDD 2014.
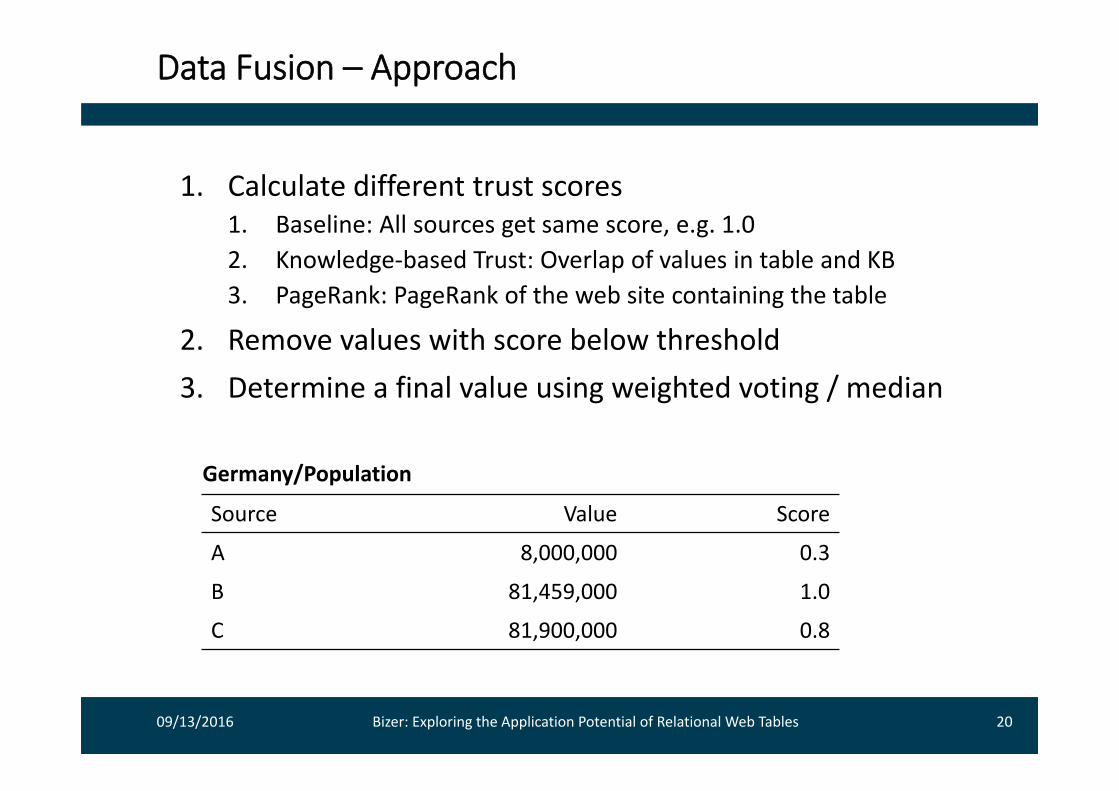
Data Fusion – Approach
1. Calculate different trust scores1. Baseline: All sources get same score, e.g. 1.02. Knowledge‐based Trust: Overlap of values in table and KB3. PageRank: PageRank of the web site containing the table
2. Remove values with score below threshold3. Determine a final value using weighted voting / median
20
Source Value Score
A 8,000,000 0.3
B 81,459,000 1.0
C 81,900,000 0.8
Germany/Population
09/13/2016 Bizer: Exploring the Application Potential of Relational Web Tables

Data Fusion – Evaluation
04/14/2015 University of Mannheim; Ritze, Lehmberg, Oulabi, Bizer: Profiling Web Tables for Augmenting KBs 21
Strategy Precision Recall F1Baseline .369 .823 .509Knowledge-based Trust .639 .785 .705PageRank .365 .814 .504
• Evaluation Results
• Group Sizes• For 58% of all groups we have at least two alternative sources
• Frequent (Head entities): likely already exist in the KB
• Infrequent (Tail entities): likely new, but hard to fuse

09/13/2016 Bizer: Exploring the Application Potential of Relational Web Tables 22
Data Fusion – Detailed Results
DBpedia Class Existing Values New Values Precision Recall F1Person 117 522 15 050 0.639 0.723 0.678Athlete 84 562 9 067 0.646 0.679 0.662Artist 2 019 427 0.711 0.830 0.766Office Holder 3 465 510 0.698 0.849 0.766Politician 3 124 1 167 0.533 0.765 0.628Organisation 20 522 7 903 0.645 0.691 0.667Company 6 376 2 547 0.700 0.834 0.761Sports Team 790 132 0.671 0.892 0.766Educational Inst. 8 844 3 132 0.638 0.714 0.674Broadcaster 4 004 1 924 0.557 0.459 0.503Work 189 131 27 867 0.614 0.828 0.705Musical Work 118 511 8 427 0.599 0.830 0.695Film 29 903 12 143 0.573 0.803 0.669Software 17 554 2 766 0.591 0.760 0.665Place 32 855 9 871 0.767 0.858 0.810Populated Place 16 604 6 704 0.711 0.779 0.743Country 2 084 433 0.738 0.690 0.713Settlement 540 224 0.583 0.669 0.623Region 362 70 0.587 0.784 0.671Architectural Struct. 10 441 1 775 0.834 0.940 0.884Natural Place 743 64 0.843 0.940 0.889Species 9 016 1 429 0.783 0.892 0.834

4. Lessons Learned
• Web Table data is useful for KB completion, but• Small number of new values in comparison to overall input
• Challenge: Improve matching recall, especially for long tail entities• Ongoing work:
• Exploit table context to improve matching• Further improve value normalization (surface forms of names,
units of measurement) to improve matching
• Knowledge‐based trust outperforms other fusion strategies• F1 = 0.7 is below the quality required for automating the task• Shortcoming: Time dimension not taken into account• Ongoing work: Exploit timestamps in webpages and tables
09/13/2016 Bizer: Exploring the Application Potential of Relational Web Tables 23
Oulabi, et al.: Fusing Time‐Dependent Web Table Data. WebDB 2016.

Exploiting other Types of Web Data
09/13/2016 Bizer: Exploring the Application Potential of Relational Web Tables 24
Lehmberg, et al.: The Mannheim Search Join Engine. Journal of Web Semantics 2015.
Public Data Corpora
• Microdata: Web Data Commons Corpus. http://webdatacommons.org/structureddata/
• HTML Tables: Web Data Commons Table Corpus. http://webdatacommons.org/webtables/
• Wiki Tables: Northwestern University Corpus. http://downey‐n1.cs.northwestern.edu/public/
• Linked Data: Billion Triples Challenge 2014: http://km.aifb.kit.edu/projects/btc‐2014/
schema.orgMicrodata
LinkedData
Entity Tables
DataPortals

Thank you!
http://webdatacommons.org/webtables
09/13/2016 Bizer: Exploring the Application Potential of Relational Web Tables 25