lesson 1: the concept of a function - engageny · nys common core mathematics curriculum 8•5...
TRANSCRIPT
Lesson 1: The Concept of a Function Date: 12/17/13
S.1
© 2013 Common Core, Inc. Some rights reserved. commoncore.org
This work is licensed under a Creative Commons Attribution-NonCommercial-ShareAlike 3.0 Unported License.
NYS COMMON CORE MATHEMATICS CURRICULUM 8•5 Lesson 1
Lesson 1: The Concept of a Function
Classwork
Example 1
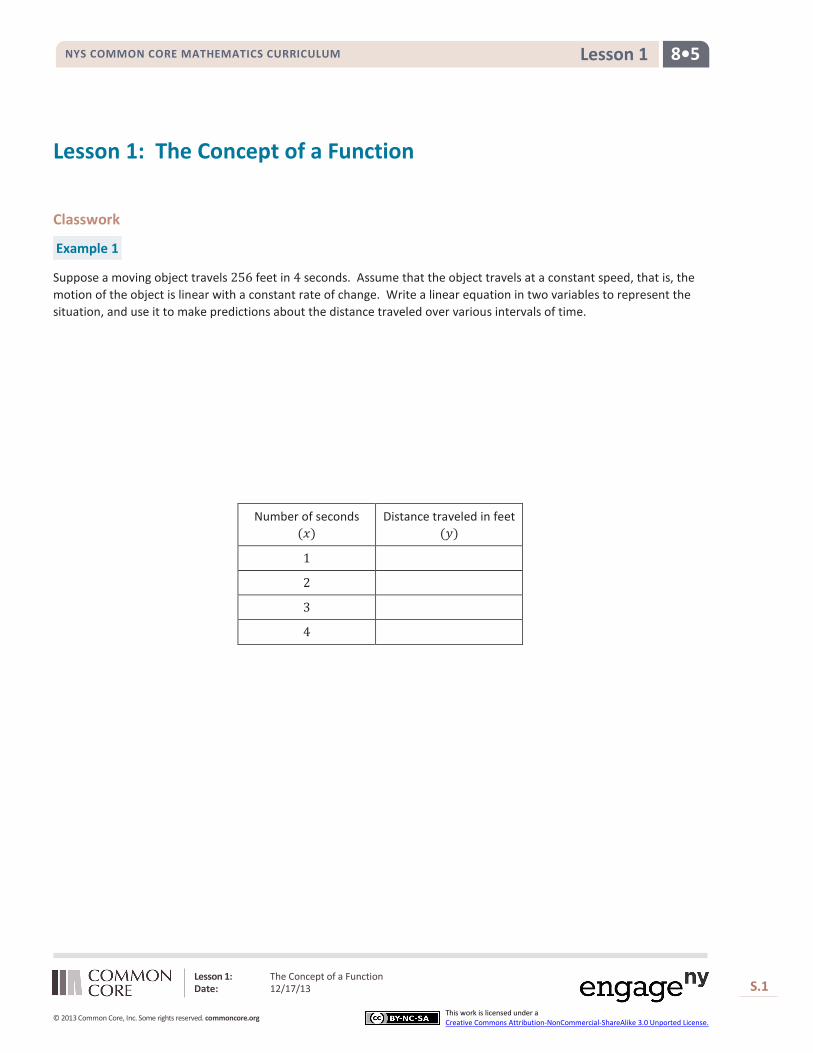
Suppose a moving object travels 256 feet in 4 seconds. Assume that the object travels at a constant speed, that is, the motion of the object is linear with a constant rate of change. Write a linear equation in two variables to represent the situation, and use it to make predictions about the distance traveled over various intervals of time.
Number of seconds (𝑥)
Distance traveled in feet (𝑦)
1
2
3
4
Lesson 1: The Concept of a Function Date: 12/17/13
S.2
© 2013 Common Core, Inc. Some rights reserved. commoncore.org
This work is licensed under a Creative Commons Attribution-NonCommercial-ShareAlike 3.0 Unported License.
NYS COMMON CORE MATHEMATICS CURRICULUM 8•5 Lesson 1
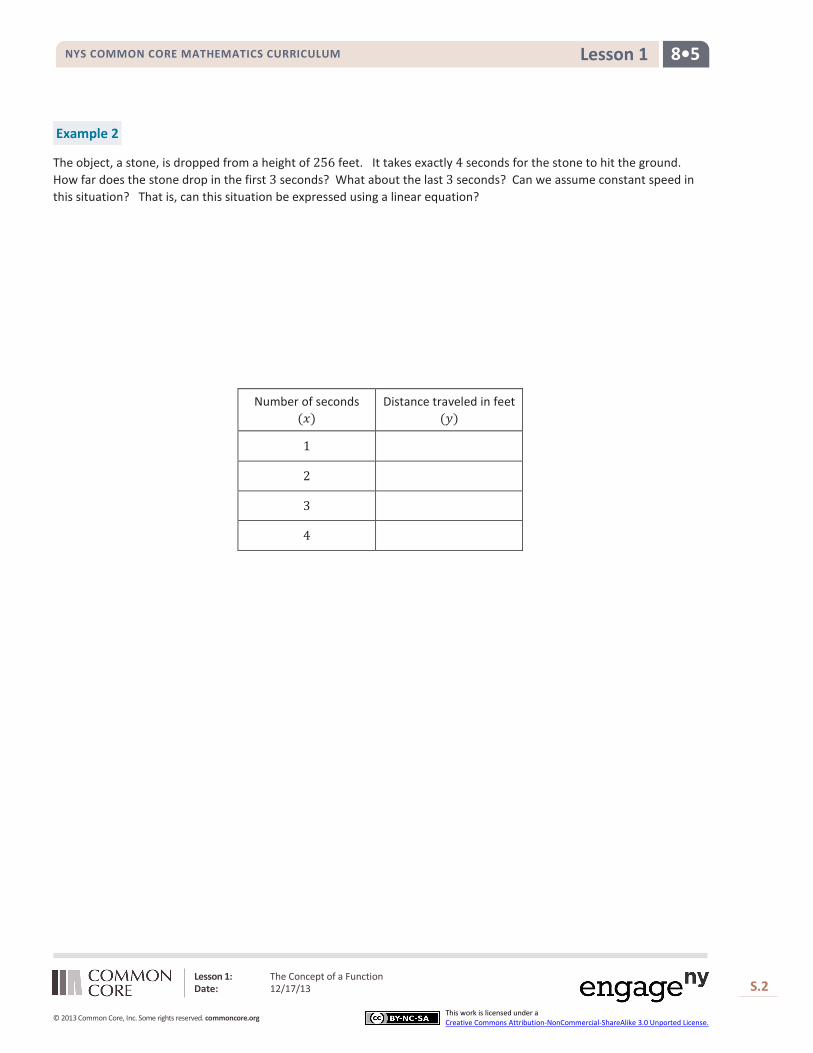
Example 2
The object, a stone, is dropped from a height of 256 feet. It takes exactly 4 seconds for the stone to hit the ground. How far does the stone drop in the first 3 seconds? What about the last 3 seconds? Can we assume constant speed in this situation? That is, can this situation be expressed using a linear equation?
Number of seconds (𝑥)
Distance traveled in feet (𝑦)
1
2
3
4

Lesson 1: The Concept of a Function Date: 12/17/13
S.3
© 2013 Common Core, Inc. Some rights reserved. commoncore.org
This work is licensed under a Creative Commons Attribution-NonCommercial-ShareAlike 3.0 Unported License.
NYS COMMON CORE MATHEMATICS CURRICULUM 8•5 Lesson 1
Exercises
Use the table to answer Exercises 1–5.
Number of seconds (𝑥)
Distance traveled in feet (𝑦)
0.5 4 1 16
1.5 36 2 64
2.5 100 3 144
3.5 196 4 256
1. Name two predictions you can make from this table.
2. Name a prediction that would require more information.
3. What is the average speed of the object between zero and three seconds? How does this compare to the average speed calculated over the same interval in Example 1?
Average Speed =distance traveled over a given time interval
time interval
4. Take a closer look at the data for the falling stone by answering the questions below.
a. How many feet did the stone drop between 0 and 1 second?
b. How many feet did the stone drop between 1 and 2 seconds?
c. How many feet did the stone drop between 2 and 3 seconds?
d. How many feet did the stone drop between 3 and 4 seconds?
Lesson 1: The Concept of a Function Date: 12/17/13
S.4
© 2013 Common Core, Inc. Some rights reserved. commoncore.org
This work is licensed under a Creative Commons Attribution-NonCommercial-ShareAlike 3.0 Unported License.
NYS COMMON CORE MATHEMATICS CURRICULUM 8•5 Lesson 1
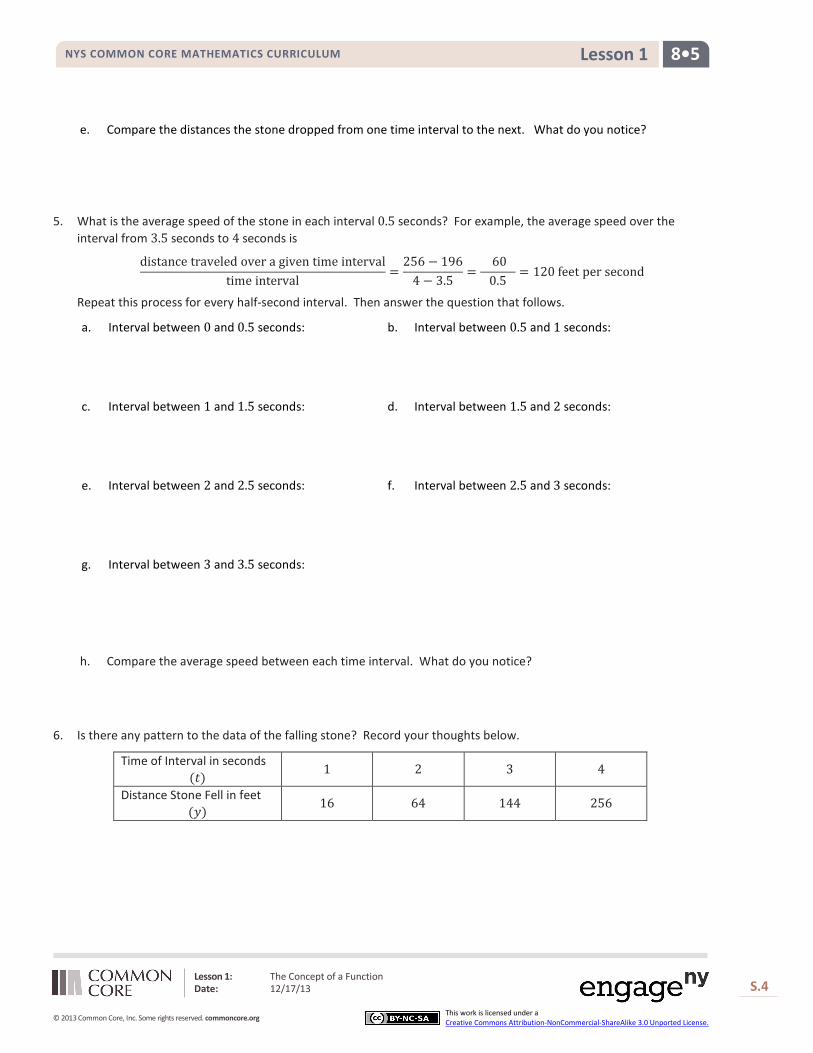
e. Compare the distances the stone dropped from one time interval to the next. What do you notice?
5. What is the average speed of the stone in each interval 0.5 seconds? For example, the average speed over the interval from 3.5 seconds to 4 seconds is
distance traveled over a given time intervaltime interval
=256 − 196
4 − 3.5=
60 0.5
= 120 feet per second
Repeat this process for every half-second interval. Then answer the question that follows.
a. Interval between 0 and 0.5 seconds:
b. Interval between 0.5 and 1 seconds:
c. Interval between 1 and 1.5 seconds:
d. Interval between 1.5 and 2 seconds:
e. Interval between 2 and 2.5 seconds:
f. Interval between 2.5 and 3 seconds:
g. Interval between 3 and 3.5 seconds:
h. Compare the average speed between each time interval. What do you notice?
6. Is there any pattern to the data of the falling stone? Record your thoughts below.
Time of Interval in seconds (𝑡)
1 2 3 4
Distance Stone Fell in feet (𝑦)
16 64 144 256
Lesson 1: The Concept of a Function Date: 12/17/13
S.5
© 2013 Common Core, Inc. Some rights reserved. commoncore.org
This work is licensed under a Creative Commons Attribution-NonCommercial-ShareAlike 3.0 Unported License.
NYS COMMON CORE MATHEMATICS CURRICULUM 8•5 Lesson 1
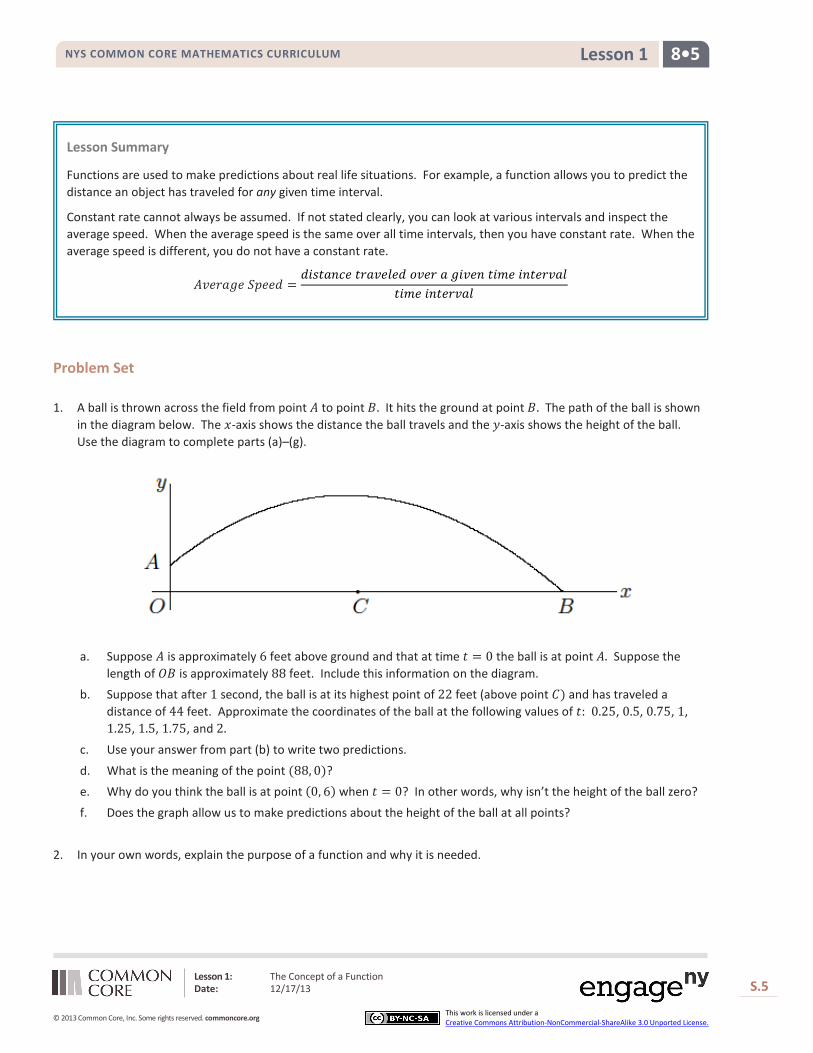
Problem Set 1. A ball is thrown across the field from point 𝐴 to point 𝐵. It hits the ground at point 𝐵. The path of the ball is shown
in the diagram below. The 𝑥-axis shows the distance the ball travels and the 𝑦-axis shows the height of the ball. Use the diagram to complete parts (a)–(g).
a. Suppose 𝐴 is approximately 6 feet above ground and that at time 𝑡 = 0 the ball is at point 𝐴. Suppose the
length of 𝑂𝐵 is approximately 88 feet. Include this information on the diagram. b. Suppose that after 1 second, the ball is at its highest point of 22 feet (above point 𝐶) and has traveled a
distance of 44 feet. Approximate the coordinates of the ball at the following values of 𝑡: 0.25, 0.5, 0.75, 1, 1.25, 1.5, 1.75, and 2.
c. Use your answer from part (b) to write two predictions.
d. What is the meaning of the point (88, 0)? e. Why do you think the ball is at point (0, 6) when 𝑡 = 0? In other words, why isn’t the height of the ball zero?
f. Does the graph allow us to make predictions about the height of the ball at all points?
2. In your own words, explain the purpose of a function and why it is needed.
𝐴𝑣𝑒𝑟𝑎𝑔𝑒 𝑆𝑝𝑒𝑒𝑑 =𝑑𝑖𝑠𝑡𝑎𝑛𝑐𝑒 𝑡𝑟𝑎𝑣𝑒𝑙𝑒𝑑 𝑜𝑣𝑒𝑟 𝑎 𝑔𝑖𝑣𝑒𝑛 𝑡𝑖𝑚𝑒 𝑖𝑛𝑡𝑒𝑟𝑣𝑎𝑙
𝑡𝑖𝑚𝑒 𝑖𝑛𝑡𝑒𝑟𝑣𝑎𝑙
Lesson Summary
Functions are used to make predictions about real life situations. For example, a function allows you to predict the distance an object has traveled for any given time interval.
Constant rate cannot always be assumed. If not stated clearly, you can look at various intervals and inspect the average speed. When the average speed is the same over all time intervals, then you have constant rate. When the average speed is different, you do not have a constant rate.

Lesson 2: Formal Definition of a Function Date: 12/17/13
S.6
© 2013 Common Core, Inc. Some rights reserved. commoncore.org
This work is licensed under a Creative Commons Attribution-NonCommercial-ShareAlike 3.0 Unported License.
NYS COMMON CORE MATHEMATICS CURRICULUM 8•5 Lesson 2
Lesson 2: Formal Definition of a Function
Classwork
Exercises
1. Let 𝑦 be the distance traveled in time 𝑡. Use the function 𝑦 = 16𝑡2 to calculate the distance the stone dropped for the given time 𝑡.
Time of Interval in seconds (𝑡) 0.5 1 1.5 2 2.5 3 3.5 4
Distance Stone Fell in feet (𝑦)
a. Are the distances you calculated equal to the table from Lesson 1?
b. Does the function 𝑦 = 16𝑡2 accurately represent the distance the stone fell after a given time 𝑡? In other words, does the function assign to 𝑡 the correct distance? Explain.
Lesson 2: Formal Definition of a Function Date: 12/17/13
S.7
© 2013 Common Core, Inc. Some rights reserved. commoncore.org
This work is licensed under a Creative Commons Attribution-NonCommercial-ShareAlike 3.0 Unported License.
NYS COMMON CORE MATHEMATICS CURRICULUM 8•5 Lesson 2
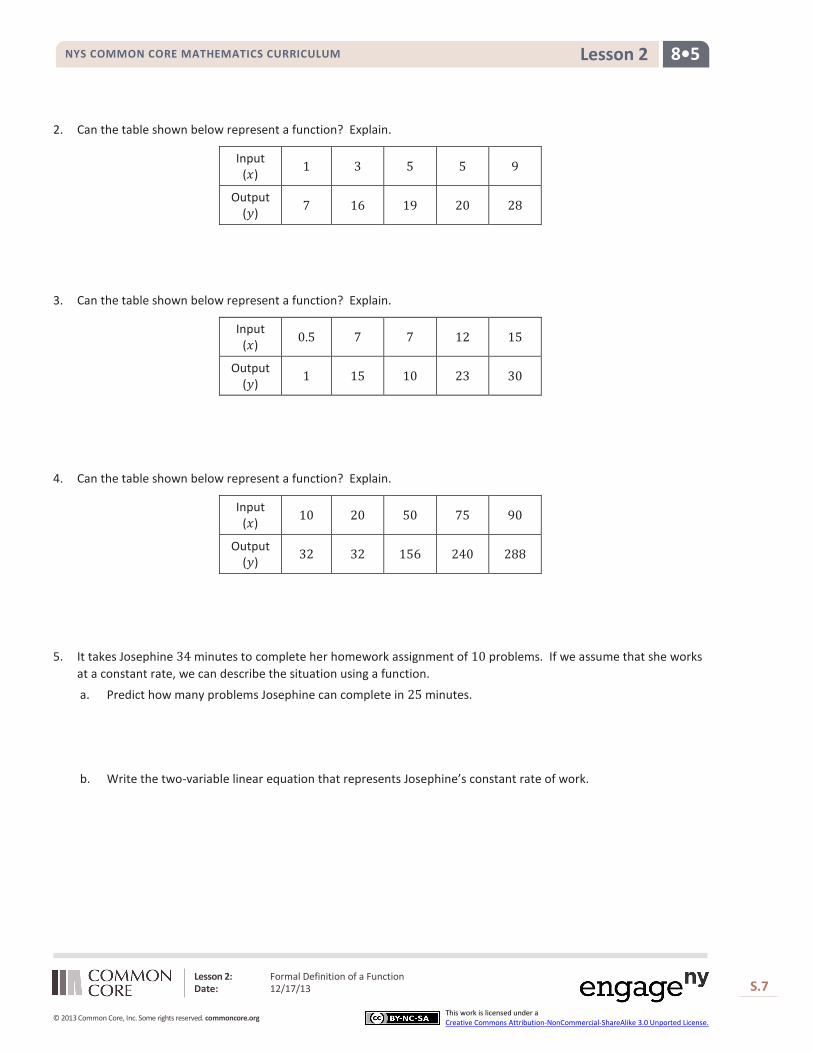
2. Can the table shown below represent a function? Explain.
Input (𝑥) 1 3 5 5 9
Output (𝑦) 7 16 19 20 28
3. Can the table shown below represent a function? Explain.
Input (𝑥) 0.5 7 7 12 15
Output (𝑦) 1 15 10 23 30
4. Can the table shown below represent a function? Explain.
Input (𝑥) 10 20 50 75 90
Output (𝑦) 32 32 156 240 288
5. It takes Josephine 34 minutes to complete her homework assignment of 10 problems. If we assume that she works at a constant rate, we can describe the situation using a function.
a. Predict how many problems Josephine can complete in 25 minutes.
b. Write the two-variable linear equation that represents Josephine’s constant rate of work.

Lesson 2: Formal Definition of a Function Date: 12/17/13
S.8
© 2013 Common Core, Inc. Some rights reserved. commoncore.org
This work is licensed under a Creative Commons Attribution-NonCommercial-ShareAlike 3.0 Unported License.
NYS COMMON CORE MATHEMATICS CURRICULUM 8•5 Lesson 2
c. Use the equation you wrote in part (b) as the formula for the function to complete the table below. Round your answers to the hundredths place.
Time taken to complete problems (𝑥) 5 10 15 20 25
Number of problems completed (𝑦) 1.47
After 5 minutes, Josephine was able to complete 1.47 problems, which means that she was able to complete 1 problem, then get about halfway through the next problem.
d. Compare your prediction from part (a) to the number you found in the table above.
e. Use the formula from part (b) to compute the number of problems completed when 𝑥 = −7. Does your answer make sense? Explain.
f. For this problem we assumed that Josephine worked at a constant rate. Do you think that is a reasonable assumption for this situation? Explain.

Lesson 2: Formal Definition of a Function Date: 12/17/13
S.9
© 2013 Common Core, Inc. Some rights reserved. commoncore.org
This work is licensed under a Creative Commons Attribution-NonCommercial-ShareAlike 3.0 Unported License.
NYS COMMON CORE MATHEMATICS CURRICULUM 8•5 Lesson 2
Problem Set 1. The table below represents the number of minutes Francisco spends at the gym each day for a week. Does the data
shown below represent a function? Explain.
Day (𝑥) 1 2 3 4 5 6 7
Time in minutes (𝑦)
35 45 30 45 35 0 0
2. Can the table shown below represent a function? Explain.
Input (𝑥) 9 8 7 8 9
Output (𝑦) 11 15 19 24 28
3. Olivia examined the table of values shown below and stated that a possible rule to describe this function could be 𝑦 = −2𝑥 + 9. Is she correct? Explain.
Input (𝑥) −4 0 4 8 12 16 20 24
Output (𝑦) 17 9 1 −7 −15 −23 −31 −39
Lesson Summary
A function is a rule that assigns to each input exactly one output. The phrase “exactly one output” must be part of the definition so that the function can serve its purpose of being predictive.
Functions are sometimes described as an input-output machine. For example, given a function 𝐷, the input is time 𝑡 and the output is the distance traveled in 𝑡 seconds.

Lesson 2: Formal Definition of a Function Date: 12/17/13
S.10
© 2013 Common Core, Inc. Some rights reserved. commoncore.org
This work is licensed under a Creative Commons Attribution-NonCommercial-ShareAlike 3.0 Unported License.
NYS COMMON CORE MATHEMATICS CURRICULUM 8•5 Lesson 2
4. Peter said that the set of data in part (a) describes a function, but the set of data in part (b) does not. Do you agree? Explain why or why not.
a.
Input (𝑥)
1 2 3 4 5 6 7 8
Output (𝑦)
8 10 32 6 10 27 156 4
b.
Input (𝑥)
−6 −15 −9 −3 −2 −3 8 9
Output (𝑦)
0 −6 8 14 1 2 11 41
5. A function can be described by the rule 𝑦 = 𝑥2 + 4. Determine the corresponding output for each given input.
Input (𝑥) −3 −2 −1 0 1 2 3 4
Output (𝑦)
6. Examine the data in the table below. The inputs and outputs represent a situation where constant rate can be assumed. Determine the rule that describes the function.
Input (𝑥) −1 0 1 2 3 4 5 6
Output (𝑦)
3 8 13 18 23 28 33 38
7. Examine the data in the table below. The inputs represent the number of bags of candy purchased, and the outputs
represent the cost. Determine the cost of one bag of candy, assuming the price per bag is the same no matter how much candy is purchased. Then, complete the table.
Bags of Candy
(𝑥) 1 2 3 4 5 6 7 8
Cost (𝑦)
$5 $6.25 $10
a. Write the rule that describes the function.
b. Can you determine the value of the output for an input of 𝑥 = −4? If so, what is it?
c. Does an input of −4 make sense in this situation? Explain.
8. A local grocery store sells 2 pounds of bananas for $1. Can this situation be represented by a function? Explain.

Lesson 2: Formal Definition of a Function Date: 12/17/13
S.11
© 2013 Common Core, Inc. Some rights reserved. commoncore.org
This work is licensed under a Creative Commons Attribution-NonCommercial-ShareAlike 3.0 Unported License.
NYS COMMON CORE MATHEMATICS CURRICULUM 8•5 Lesson 2
9. Write a brief explanation to a classmate who was absent today about why the table in part (a) is a function and the table in part (b) is not.
a.
Input (𝑥)
−1 −2 −3 −4 4 3 2 1
Output (𝑦)
81 100 320 400 400 320 100 81
b.
Input (𝑥)
1 6 −9 −2 1 −10 8 14
Output (𝑦)
2 6 −47 −8 19 −2 15 31
Lesson 3: Linear Functions and Proportionality Date: 12/18/13
S.12
© 2013 Common Core, Inc. Some rights reserved. commoncore.org
This work is licensed under a Creative Commons Attribution-NonCommercial-ShareAlike 3.0 Unported License.
NYS COMMON CORE MATHEMATICS CURRICULUM 8•5 Lesson 3
Lesson 3: Linear Functions and Proportionality
Classwork
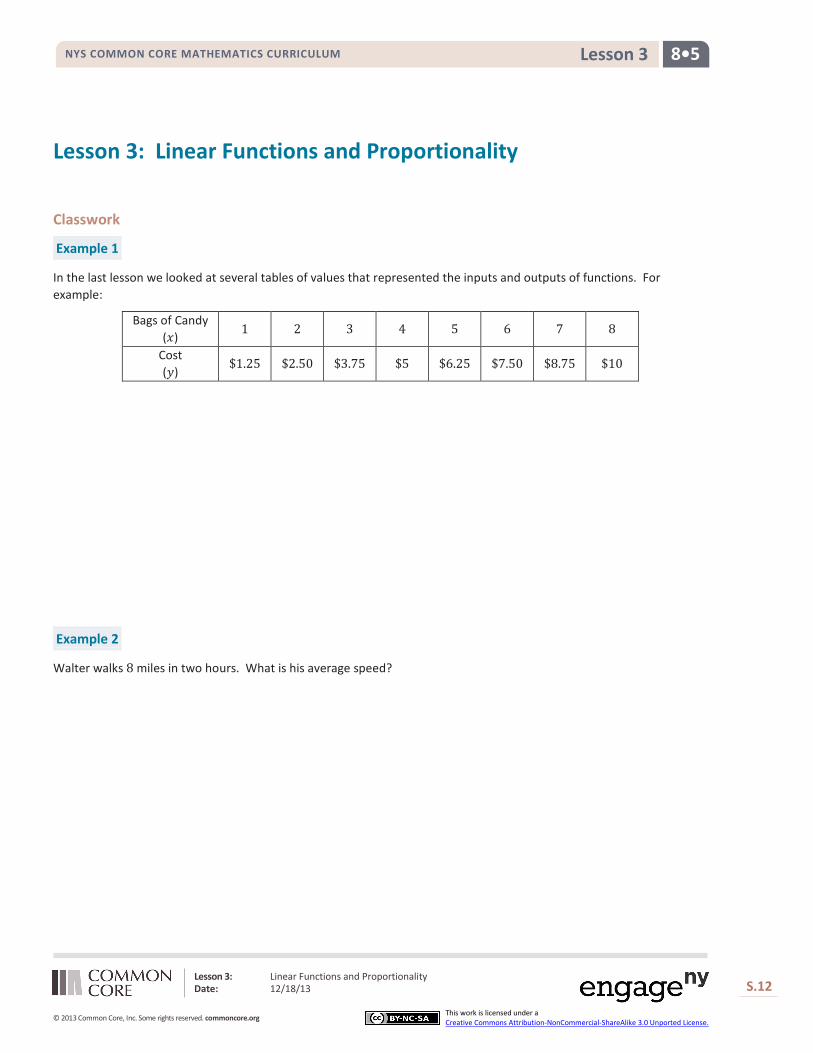
Example 1
In the last lesson we looked at several tables of values that represented the inputs and outputs of functions. For example:
Bags of Candy (𝑥) 1 2 3 4 5 6 7 8
Cost (𝑦)
$1.25 $2.50 $3.75 $5 $6.25 $7.50 $8.75 $10
Example 2
Walter walks 8 miles in two hours. What is his average speed?
Lesson 3: Linear Functions and Proportionality Date: 12/18/13
S.13
© 2013 Common Core, Inc. Some rights reserved. commoncore.org
This work is licensed under a Creative Commons Attribution-NonCommercial-ShareAlike 3.0 Unported License.
NYS COMMON CORE MATHEMATICS CURRICULUM 8•5 Lesson 3
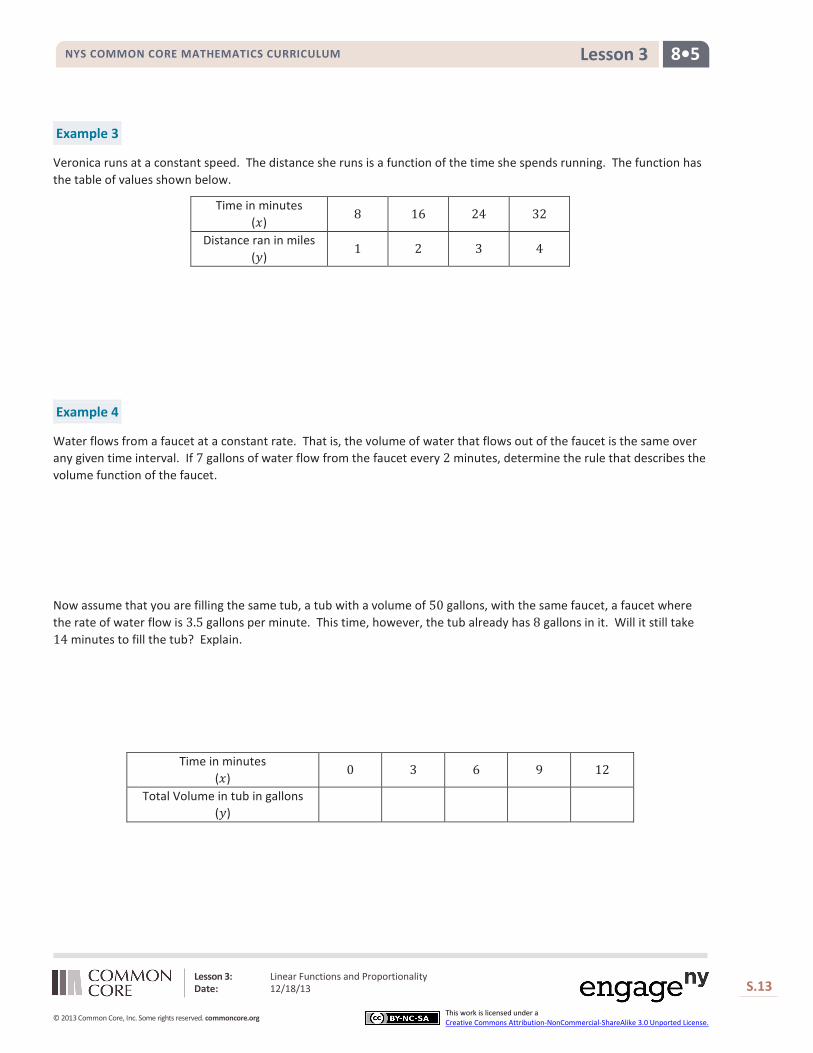
Example 3
Veronica runs at a constant speed. The distance she runs is a function of the time she spends running. The function has the table of values shown below.
Time in minutes (𝑥) 8 16 24 32
Distance ran in miles (𝑦)
1 2 3 4
Example 4
Water flows from a faucet at a constant rate. That is, the volume of water that flows out of the faucet is the same over any given time interval. If 7 gallons of water flow from the faucet every 2 minutes, determine the rule that describes the volume function of the faucet.
Now assume that you are filling the same tub, a tub with a volume of 50 gallons, with the same faucet, a faucet where the rate of water flow is 3.5 gallons per minute. This time, however, the tub already has 8 gallons in it. Will it still take 14 minutes to fill the tub? Explain.
Time in minutes (𝑥)
0 3 6 9 12
Total Volume in tub in gallons (𝑦)

Lesson 3: Linear Functions and Proportionality Date: 12/18/13
S.14
© 2013 Common Core, Inc. Some rights reserved. commoncore.org
This work is licensed under a Creative Commons Attribution-NonCommercial-ShareAlike 3.0 Unported License.
NYS COMMON CORE MATHEMATICS CURRICULUM 8•5 Lesson 3
Example 5
Water flows from a faucet at a constant rate. Assume that 6 gallons of water are already in a tub by the time we notice the faucet is on. This information is recorded as 0 minutes and 6 gallons of water in the table below. The other values show how many gallons of water are in the tub at the given number of minutes.
Time in minutes (𝑥) 0 3 5 9
Total Volume in tub in gallons (𝑦) 6 9.6 12 16.8

Lesson 3: Linear Functions and Proportionality Date: 12/18/13
S.15
© 2013 Common Core, Inc. Some rights reserved. commoncore.org
This work is licensed under a Creative Commons Attribution-NonCommercial-ShareAlike 3.0 Unported License.
NYS COMMON CORE MATHEMATICS CURRICULUM 8•5 Lesson 3
Exercises
1. A linear function has the table of values below. The information in the table shows the function of time in minutes with respect to mowing an area of lawn in square feet.
Number of minutes (𝑥) 5 20 30 50
Area mowed in square feet (𝑦) 36 144 216 360
a. Explain why this is a linear function.
b. Describe the function in terms of area mowed and time.
c. What is the rate of mowing a lawn in 5 minutes?
d. What is the rate of mowing a lawn in 20 minutes?
e. What is the rate for mowing a lawn in 30 minutes?
f. What is the rate for mowing a lawn in in 50 minutes?
g. Write the rule that represents the linear function that describes the area in square feet mowed, 𝑦, in 𝑥 minutes.

Lesson 3: Linear Functions and Proportionality Date: 12/18/13
S.16
© 2013 Common Core, Inc. Some rights reserved. commoncore.org
This work is licensed under a Creative Commons Attribution-NonCommercial-ShareAlike 3.0 Unported License.
NYS COMMON CORE MATHEMATICS CURRICULUM 8•5 Lesson 3
h. Describe the limitations of 𝑥 and 𝑦.
i. What number does the function assign to 24? That is, what area of lawn can be mowed in 24 minutes?
j. How many minutes would it take to mow an area of 400 square feet?
2. A linear function has the table of values below. The information in the table shows the volume of water that flows from a hose in gallons as a function of time in minutes.
Time in Minutes (𝑥) 10 25 50 70
Total Volume of Water in Gallons (𝑦) 44 110 220 308
a. Describe the function in terms of volume and time.
b. Write the rule that represents the linear function that describes the volume of water in gallons, 𝑦, in 𝑥 minutes.
c. What number does the function assign to 250? That is, how many gallons of water flow from the hose in 250 minutes?
d. The average pool has about 17,300 gallons of water. The pool has already been filled 14 of its volume. Write
the rule that describes the volume of water flow as a function of time for filling the pool using the hose, including the number of gallons that are already in the pool.

Lesson 3: Linear Functions and Proportionality Date: 12/18/13
S.17
© 2013 Common Core, Inc. Some rights reserved. commoncore.org
This work is licensed under a Creative Commons Attribution-NonCommercial-ShareAlike 3.0 Unported License.
NYS COMMON CORE MATHEMATICS CURRICULUM 8•5 Lesson 3
e. Approximately how much time, in hours, will it take to finish filling the pool?
3. Recall that a linear function can be described by a rule in the form of 𝑦 = 𝑚𝑥 + 𝑏, where 𝑚 and 𝑏 are constants. A particular linear function has the table of values below.
Input (𝑥)
0 4 10 11 15 20 23
Output (𝑦) 4 24 54 59
a. What is the equation that describes the function?
b. Complete the table using the rule.

Lesson 3: Linear Functions and Proportionality Date: 12/18/13
S.18
© 2013 Common Core, Inc. Some rights reserved. commoncore.org
This work is licensed under a Creative Commons Attribution-NonCommercial-ShareAlike 3.0 Unported License.
NYS COMMON CORE MATHEMATICS CURRICULUM 8•5 Lesson 3
Problem Set 1. A food bank distributes cans of vegetables every Saturday. They keep track of the cans in the following manner in
the table. A linear function can be used to represent the data. The information in the table shows the function of time in weeks to the number of cans of vegetables distributed by the food bank.
Number of Weeks (𝑥)
1 12 20 45
Number of Cans of Vegetables Distributed (𝑦) 180 2,160 3,600 8,100
a. Describe the function in terms of cans distributed and time.
b. Write the equation or rule that represents the linear function that describes the number of cans handed out, 𝑦, in 𝑥 weeks.
c. Assume that the food bank wants to distribute 20,000 cans of vegetables. How long will it take them to meet that goal?
d. Assume that the food bank has already handed out 35,000 cans of vegetables and continues to hand out cans at the same rate each week. Write a linear function that accounts for the number of cans already handed out.
e. Using your function in part (c), determine how long in years it will take the food bank to hand out 80,000 cans of vegetables.
2. A linear function has the table of values below. The information in the table shows the function of time in hours to the distance an airplane travels in miles. Assume constant speed.
Number of hour traveled (𝑥) 2.5 4 4.2
Distance in miles (𝑦) 1,062.5 1700 1,785
a. Describe the function in terms of distance and time.
b. Write the rule that represents the linear function that describes the distance traveled in miles, 𝑦, in 𝑥 hours.
c. Assume that the airplane is making a trip from New York to Los Angeles which is approximately 2,475 miles. How long will it take the airplane to get to Los Angeles?
d. The airplane flies for 8 hours. How many miles will it be able to travel in that time interval?
Lesson Summary
Functions can be described by a rule in the form of 𝑦 = 𝑚𝑥 + 𝑏, where 𝑚 and 𝑏 are constants.
Constant rates and proportional relationships can be described by a function, specifically a linear function where the rule is a linear equation.
Functions are described in terms of their inputs and outputs. For example, if the inputs are related to time and the output are distances traveled at given time intervals then we say that the distance traveled is a function of the time spent traveling.
Lesson 3: Linear Functions and Proportionality Date: 12/18/13
S.19
© 2013 Common Core, Inc. Some rights reserved. commoncore.org
This work is licensed under a Creative Commons Attribution-NonCommercial-ShareAlike 3.0 Unported License.
NYS COMMON CORE MATHEMATICS CURRICULUM 8•5 Lesson 3
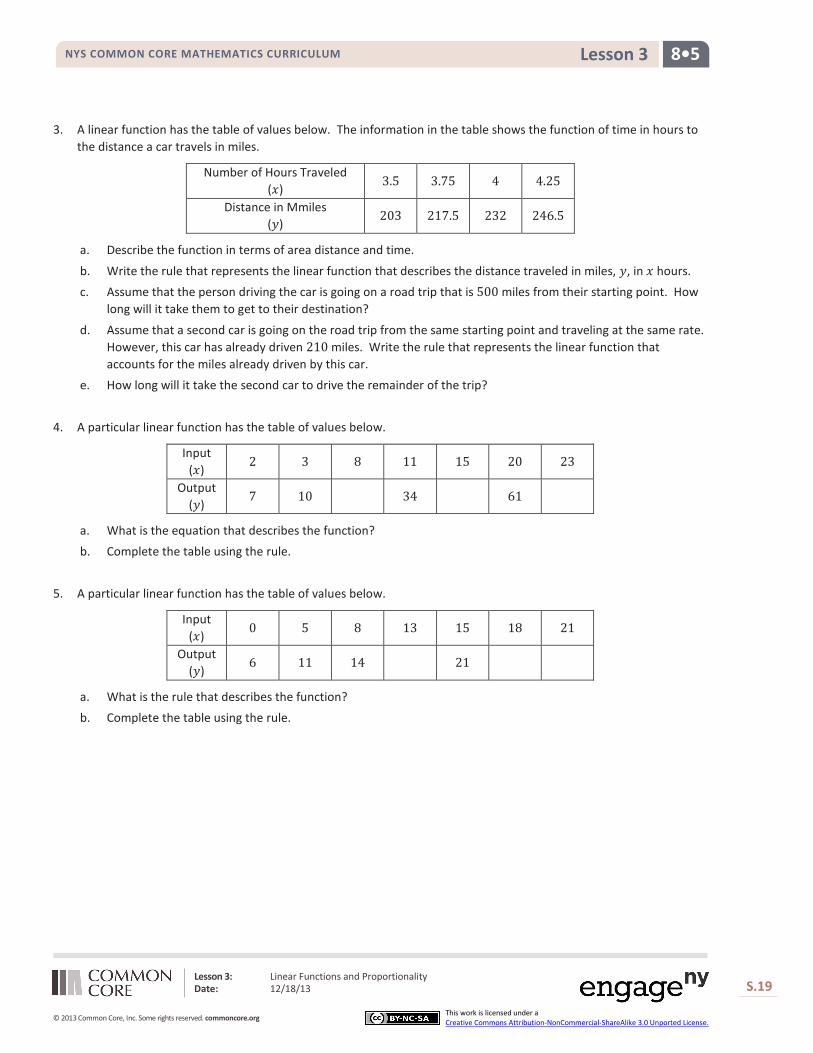
3. A linear function has the table of values below. The information in the table shows the function of time in hours to the distance a car travels in miles.
Number of Hours Traveled (𝑥) 3.5 3.75 4 4.25
Distance in Mmiles (𝑦)
203 217.5 232 246.5
a. Describe the function in terms of area distance and time.
b. Write the rule that represents the linear function that describes the distance traveled in miles, 𝑦, in 𝑥 hours. c. Assume that the person driving the car is going on a road trip that is 500 miles from their starting point. How
long will it take them to get to their destination?
d. Assume that a second car is going on the road trip from the same starting point and traveling at the same rate. However, this car has already driven 210 miles. Write the rule that represents the linear function that accounts for the miles already driven by this car.
e. How long will it take the second car to drive the remainder of the trip?
4. A particular linear function has the table of values below.
Input (𝑥) 2 3 8 11 15 20 23
Output (𝑦)
7 10 34 61
a. What is the equation that describes the function? b. Complete the table using the rule.
5. A particular linear function has the table of values below.
Input (𝑥) 0 5 8 13 15 18 21
Output (𝑦)
6 11 14 21
a. What is the rule that describes the function? b. Complete the table using the rule.
Lesson 4: More Examples of Functions Date: 12/18/13
S.20
© 2013 Common Core, Inc. Some rights reserved. commoncore.org
This work is licensed under a Creative Commons Attribution-NonCommercial-ShareAlike 3.0 Unported License.
NYS COMMON CORE MATHEMATICS CURRICULUM 8•5 Lesson 4
Lesson 4: More Examples of Functions
Classwork
Example 1
If 4 copies of the same book cost $256, what is the unit rate for the book?
Example 2
Water flows from a faucet at a constant rate. That is, the volume of water that flows out of the faucet is the same over any given time interval. If 7 gallons of water flow from the faucet every 2 minutes, determine the rule that describes the volume function of the faucet.
Example 3
You have just been served freshly made soup that is so hot that it cannot be eaten. You measure the temperature of the soup, and it is 210°F. Since 212°F is boiling, there is no way it can safely be eaten yet. One minute after receiving the soup the temperature has dropped to 203°F. If you assume that the rate at which the soup cools is linear, write a rule that would describe the rate of cooling of the soup.

Lesson 4: More Examples of Functions Date: 12/18/13
S.21
© 2013 Common Core, Inc. Some rights reserved. commoncore.org
This work is licensed under a Creative Commons Attribution-NonCommercial-ShareAlike 3.0 Unported License.
NYS COMMON CORE MATHEMATICS CURRICULUM 8•5 Lesson 4
Example 4
Consider the following function: There is a function 𝐺 so that the function assigns to each input, the number of a particular player, an output, their height. For example, the function 𝐺 assigns to the input, 1 an output of 5’11”.
1 5’11” 2 5’4” 3 5’9” 4 5’6” 5 6’3” 6 6’8” 7 5’9” 8 5’10” 9 6’2”
Exercises
1. A linear function has the table of values below related to the number of buses needed for a fieldtrip.
Number of students (𝑥) 35 70 105 140
Number of buses (𝑦) 1 2 3 4
a. Write the linear function that represents the number of buses needed, 𝑦, for 𝑥 number of students.
b. Describe the limitations of 𝑥 and 𝑦.
c. Is the rate discrete or continuous?

Lesson 4: More Examples of Functions Date: 12/18/13
S.22
© 2013 Common Core, Inc. Some rights reserved. commoncore.org
This work is licensed under a Creative Commons Attribution-NonCommercial-ShareAlike 3.0 Unported License.
NYS COMMON CORE MATHEMATICS CURRICULUM 8•5 Lesson 4
d. The entire 8th grade student body of 321 students is going on a fieldtrip. What number of buses does our function assign to 321 students? Explain.
e. Some 7th grade students are going on their own field trip to a different destination, but just 180 are attending. What number does the function assign to 180? How many buses will be needed for the trip?
f. What number does the function assign to 50? Explain what this means and what your answer means.
2. A linear function has the table of values below related to the cost of movie tickets.
Number of tickets (𝑥) 3 6 9 12
Total cost (𝑦)
$27.75 $55.50 $83.25 $111
a. Write the linear function that represents the total cost,𝑦, for 𝑥 tickets purchased.
b. Is the rate discrete or continuous? Explain.
c. What number does the function assign to 4? What does the question and your answer mean?

Lesson 4: More Examples of Functions Date: 12/18/13
S.23
© 2013 Common Core, Inc. Some rights reserved. commoncore.org
This work is licensed under a Creative Commons Attribution-NonCommercial-ShareAlike 3.0 Unported License.
NYS COMMON CORE MATHEMATICS CURRICULUM 8•5 Lesson 4
3. A function produces the following table of values.
Input Output
Banana Yellow
Cherry Red
Orange Orange
Tangerine Orange
Strawberry Red
a. Can this function be described by a rule using numbers? Explain.
b. Describe the assignment of the function.
c. State an input and the assignment the function would give to its output.

Lesson 4: More Examples of Functions Date: 12/18/13
S.24
© 2013 Common Core, Inc. Some rights reserved. commoncore.org
This work is licensed under a Creative Commons Attribution-NonCommercial-ShareAlike 3.0 Unported License.
NYS COMMON CORE MATHEMATICS CURRICULUM 8•5 Lesson 4
Problem Set 1. A linear function has the table of values below related to the total cost for gallons of gas purchased.
Number of gallons (𝑥)
5.4 6 15 17
Total cost (𝑦) $19.71 $21.90 $54.75 $62.05
a. Write the linear function that represents the total cost, 𝑦, for 𝑥 gallons of gas.
b. Describe the limitations of 𝑥 and 𝑦.
c. Is the rate discrete or continuous?
d. What number does the function assign to 20? Explain what your answer means.
2. A function has the table of values below. Examine the information in the table to answer the questions below.
Input Output one 3 two 3
three 5 four 4 five 4 six 3
seven 5
a. Describe the function.
b. What number would the function assign to the word “eleven”?
Lesson Summary
Not all functions are linear. In fact, not all functions can be described using numbers.
Linear functions can have discrete rates and continuous rates.
A rate that can have only integer inputs may be used in a function so that it makes sense, and it is then called a discrete rate. For example, when planning for a field trip, it only makes sense to plan for a whole number of students and a whole number of buses, not fractional values of either.
Continuous rates are those where any interval, including fractional values, can be used for an input. For example, determining the distance a person walks for a given time interval. The input, which is time in this case, can be in minutes or fractions of minutes.

Lesson 4: More Examples of Functions Date: 12/18/13
S.25
© 2013 Common Core, Inc. Some rights reserved. commoncore.org
This work is licensed under a Creative Commons Attribution-NonCommercial-ShareAlike 3.0 Unported License.
NYS COMMON CORE MATHEMATICS CURRICULUM 8•5 Lesson 4
3. A linear function has the table of values below related to the total number of miles driven in a given time interval in hours.
Number of hours driven (𝑥) 3 4 5 6
Total miles driven (𝑦)
141 188 235 282
a. Write the linear function that represents the total miles driven, 𝑦, for 𝑥 number of hours.
b. Describe the limitations of 𝑥 and 𝑦. c. Is the rate discrete or continuous?
d. What number does the function assign to 8? Explain what your answer means.
e. Use the function to determine how much time it would take to drive 500 miles.
4. A function has the table of values below that gives temperatures at specific times over a period of 8 hours.
12:00 p.m. 92°
1:00 p.m. 90.5°
2:00 p.m. 89°
4:00 p.m. 86°
8:00 p.m. 80°
a. Is the function a linear function? Explain. b. Describe the limitations of 𝑥 and 𝑦.
c. Is the rate discrete or continuous?
d. Let 𝑦 represent the temperature and 𝑥 represent the number of hours from 12:00 p.m. Write a rule that describes the function of time on temperature.
e. Check that the rule you wrote to describe the function works for each of the input and output values given in the table.
f. Use the function to determine the temperature at 5:30 p.m.
g. Is it reasonable to assume that this function could be used to predict the temperature for 10:00 a.m. the following day or a temperature at any time on a day next week? Give specific examples in your explanation.

Lesson 5: Graphs of Functions and Equations Date: 12/18/13
S.26
© 2013 Common Core, Inc. Some rights reserved. commoncore.org
This work is licensed under a Creative Commons Attribution-NonCommercial-ShareAlike 3.0 Unported License.
NYS COMMON CORE MATHEMATICS CURRICULUM 8•5 Lesson 5
Lesson 5: Graphs of Functions and Equations
Classwork
Exercises
1. The distance that Giselle can run is a function of the amount of time she spends running. Giselle runs 3 miles in 21 minutes. Assume she runs at a constant rate. a. Write an equation in two variables that represents her distance ran, 𝑦, as a function of the time, 𝑥, she spends
running.
b. Use the equation you wrote in part (a) to determine how many miles Giselle can run in 14 minutes.
c. Use the equation you wrote in part (a) to determine how many miles Giselle can run in 28 minutes.
d. Use the equation you wrote in part (a) to determine how many miles Giselle can run in 7 minutes.
e. The input of the function, 𝑥, is time and the output of the function, 𝑦, is the distance Giselle ran. Write the input and outputs from parts (b)–(d) as ordered pairs and plot them as points on a coordinate plane.

Lesson 5: Graphs of Functions and Equations Date: 12/18/13
S.27
© 2013 Common Core, Inc. Some rights reserved. commoncore.org
This work is licensed under a Creative Commons Attribution-NonCommercial-ShareAlike 3.0 Unported License.
NYS COMMON CORE MATHEMATICS CURRICULUM 8•5 Lesson 5
f. What shape does the graph of the points appear to take?
g. Is the rate continuous or discrete?
h. Use the equation you wrote in part (a) to determine how many miles Giselle can run in 36 minutes. Write your answer as an ordered pair as you did in part (e) and include the point on the graph. Is the point in a place where you expected it to be? Explain.
i. Assume you used the rule that describes the function to determine how many miles Giselle can run for any
given time and wrote each answer as an ordered pair. Where do you think these points would appear on the graph?
j. What do you think the graph of this function will look like? Explain.

Lesson 5: Graphs of Functions and Equations Date: 12/18/13
S.28
© 2013 Common Core, Inc. Some rights reserved. commoncore.org
This work is licensed under a Creative Commons Attribution-NonCommercial-ShareAlike 3.0 Unported License.
NYS COMMON CORE MATHEMATICS CURRICULUM 8•5 Lesson 5
k. Connect the points you have graphed to make a line. Select a point on the graph that has integer coordinates. Verify that this point has an output that the function would assign to the input.
l. Graph the equation 𝑦 = 17 𝑥 using the same coordinate plane in part (e). What do you notice about the graph
of the function that describes Giselle’s constant rate of running and the graph of the equation 𝑦 = 17 𝑥?
2. Graph the equation 𝑦 = 𝑥2 for positive values of 𝑥. Organize your work using the table below, and then answer the questions that follow.
𝑥 𝑦
0
1
2
3
4
5
6

Lesson 5: Graphs of Functions and Equations Date: 12/18/13
S.29
© 2013 Common Core, Inc. Some rights reserved. commoncore.org
This work is licensed under a Creative Commons Attribution-NonCommercial-ShareAlike 3.0 Unported License.
NYS COMMON CORE MATHEMATICS CURRICULUM 8•5 Lesson 5
a. Graph the ordered pairs on the coordinate plane.
b. What shape does the graph of the points appear to take?
c. Is this equation a linear equation? Explain.
d. An area function has the rule so that it assigns to each input, the length of one side of a square, 𝑠, the output, the area of the square, 𝐴. Write the rule for this function.
Lesson 5: Graphs of Functions and Equations Date: 12/18/13
S.30
© 2013 Common Core, Inc. Some rights reserved. commoncore.org
This work is licensed under a Creative Commons Attribution-NonCommercial-ShareAlike 3.0 Unported License.
NYS COMMON CORE MATHEMATICS CURRICULUM 8•5 Lesson 5
e. What do you think the graph of this function will look like? Explain.
f. Use the function you wrote in part (d) to determine the area of a square with side length 2.5. Write the input
and output as an ordered pair. Does this point appear to belong to the graph of 𝑦 = 𝑥2?
3. The number of devices a particular manufacturing company can produce is a function of the number of hours spent making the devices. On average, 4 devices are produced each hour. Assume that devices are produced at a constant rate.
a. Write an equation in two variables that represents the number of devices, 𝑦, as a function of the time the company spends making the devices, 𝑥.
b. Use the equation you wrote in part (a) to determine how many devices are produced in 8 hours.
c. Use the equation you wrote in part (a) to determine how many devices are produced in 6 hours.
d. Use the equation you wrote in part (a) to determine how many devices are produced in 4 hours.
e. The input of the function, 𝑥, is time and the output of the function, 𝑦, is the number of devices produced. Write the input and outputs from parts (b)–(d) as ordered pairs and plot them as points on a coordinate plane.
Lesson 5: Graphs of Functions and Equations Date: 12/18/13
S.31
© 2013 Common Core, Inc. Some rights reserved. commoncore.org
This work is licensed under a Creative Commons Attribution-NonCommercial-ShareAlike 3.0 Unported License.
NYS COMMON CORE MATHEMATICS CURRICULUM 8•5 Lesson 5
f. What shape does the graph of the points appear to take?
g. Is the rate continuous or discrete?
h. Use the equation you wrote in part (a) to determine how many devices are produced in 1.5 hours. Write your answer as an ordered pair as you did in part (e) and include the point on the graph. Is the point in a place where you expected it to be? Explain.

Lesson 5: Graphs of Functions and Equations Date: 12/18/13
S.32
© 2013 Common Core, Inc. Some rights reserved. commoncore.org
This work is licensed under a Creative Commons Attribution-NonCommercial-ShareAlike 3.0 Unported License.
NYS COMMON CORE MATHEMATICS CURRICULUM 8•5 Lesson 5
i. Assume you used the rule that describes the function to determine how many devices are produced for any given time and wrote each answer as an ordered pair. Where do you think these points would appear on the graph?
j. What do you think the graph of this function will look like? Explain.
k. Connect the points you have graphed to make a line. Select a point on the graph that has integer coordinates. Verify that this point has an output that the function would assign to the input.
l. Graph the equation 𝑦 = 4𝑥 using the same coordinate plane in part (e). What do you notice about the graph of the function that describes the company’s constant rate of producing devices and the graph of the equation 𝑦 = 4𝑥?
4. Examine the three graphs below. Which, if any, could represent the graph of a function? Explain why or why not for each graph.
Graph 1:

Lesson 5: Graphs of Functions and Equations Date: 12/18/13
S.33
© 2013 Common Core, Inc. Some rights reserved. commoncore.org
This work is licensed under a Creative Commons Attribution-NonCommercial-ShareAlike 3.0 Unported License.
NYS COMMON CORE MATHEMATICS CURRICULUM 8•5 Lesson 5
Graph 2:
Graph 3:
Lesson 5: Graphs of Functions and Equations Date: 12/18/13
S.34
© 2013 Common Core, Inc. Some rights reserved. commoncore.org
This work is licensed under a Creative Commons Attribution-NonCommercial-ShareAlike 3.0 Unported License.
NYS COMMON CORE MATHEMATICS CURRICULUM 8•5 Lesson 5
Problem Set
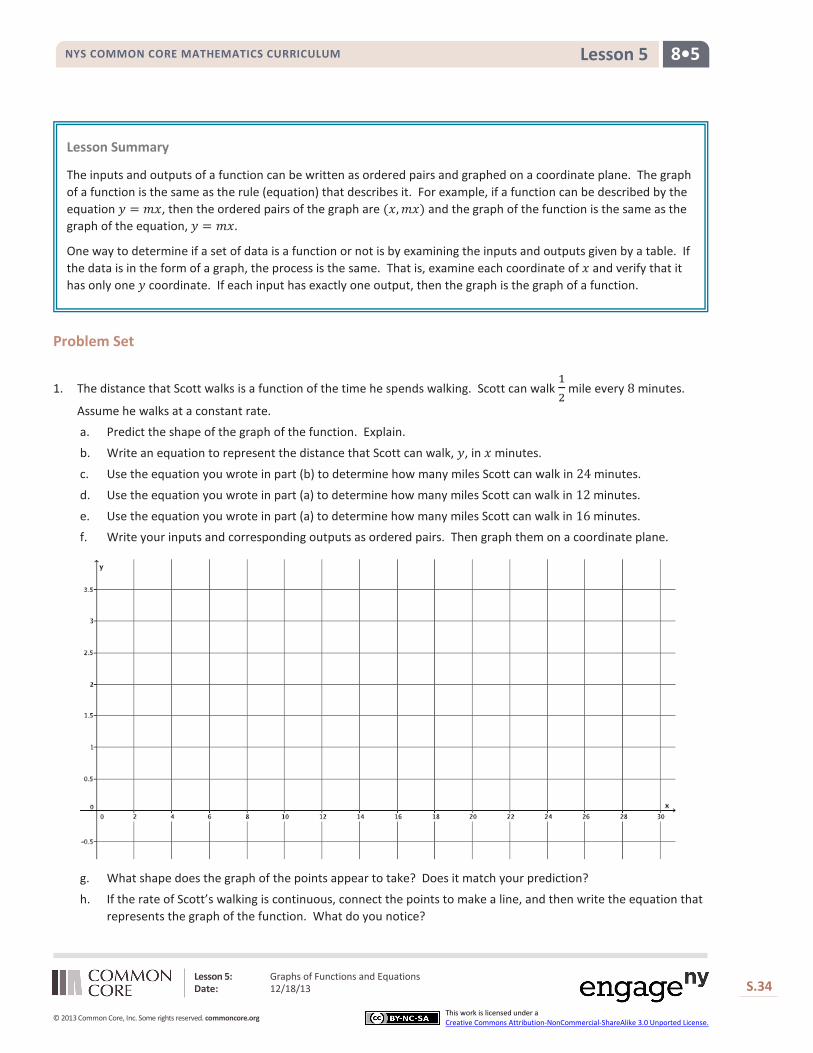
1. The distance that Scott walks is a function of the time he spends walking. Scott can walk 12
mile every 8 minutes.
Assume he walks at a constant rate. a. Predict the shape of the graph of the function. Explain.
b. Write an equation to represent the distance that Scott can walk, 𝑦, in 𝑥 minutes.
c. Use the equation you wrote in part (b) to determine how many miles Scott can walk in 24 minutes.
d. Use the equation you wrote in part (a) to determine how many miles Scott can walk in 12 minutes.
e. Use the equation you wrote in part (a) to determine how many miles Scott can walk in 16 minutes. f. Write your inputs and corresponding outputs as ordered pairs. Then graph them on a coordinate plane.
g. What shape does the graph of the points appear to take? Does it match your prediction?
h. If the rate of Scott’s walking is continuous, connect the points to make a line, and then write the equation that represents the graph of the function. What do you notice?
Lesson Summary
The inputs and outputs of a function can be written as ordered pairs and graphed on a coordinate plane. The graph of a function is the same as the rule (equation) that describes it. For example, if a function can be described by the equation 𝑦 = 𝑚𝑥, then the ordered pairs of the graph are (𝑥,𝑚𝑥) and the graph of the function is the same as the graph of the equation, 𝑦 = 𝑚𝑥.
One way to determine if a set of data is a function or not is by examining the inputs and outputs given by a table. If the data is in the form of a graph, the process is the same. That is, examine each coordinate of 𝑥 and verify that it has only one 𝑦 coordinate. If each input has exactly one output, then the graph is the graph of a function.

Lesson 5: Graphs of Functions and Equations Date: 12/18/13
S.35
© 2013 Common Core, Inc. Some rights reserved. commoncore.org
This work is licensed under a Creative Commons Attribution-NonCommercial-ShareAlike 3.0 Unported License.
NYS COMMON CORE MATHEMATICS CURRICULUM 8•5 Lesson 5
2. Graph the equation 𝑦 = 𝑥3 for positive values of 𝑥. Organize your work using the table below, and then answer the questions that follow.
𝑥 𝑦
0
0.5
1
1.5
2
2.5
a. Graph the ordered pairs on the coordinate plane.
b. What shape does the graph of the points appear to take?
c. Is this the graph of a linear function? Explain.
d. A volume function has the rule so that it assigns to each input, the length of one side of a cube, 𝑠, the output, the volume of the cube, 𝑉. The rule for this function is 𝑉 = 𝑠3. What do you think the graph of this function will look like? Explain.
e. Use the function in part (d) to determine the area of a volume with side length of 3. Write the input and output as an ordered pair. Does this point appear to belong to the graph of 𝑦 = 𝑥3?
Lesson 5: Graphs of Functions and Equations Date: 12/18/13
S.36
© 2013 Common Core, Inc. Some rights reserved. commoncore.org
This work is licensed under a Creative Commons Attribution-NonCommercial-ShareAlike 3.0 Unported License.
NYS COMMON CORE MATHEMATICS CURRICULUM 8•5 Lesson 5
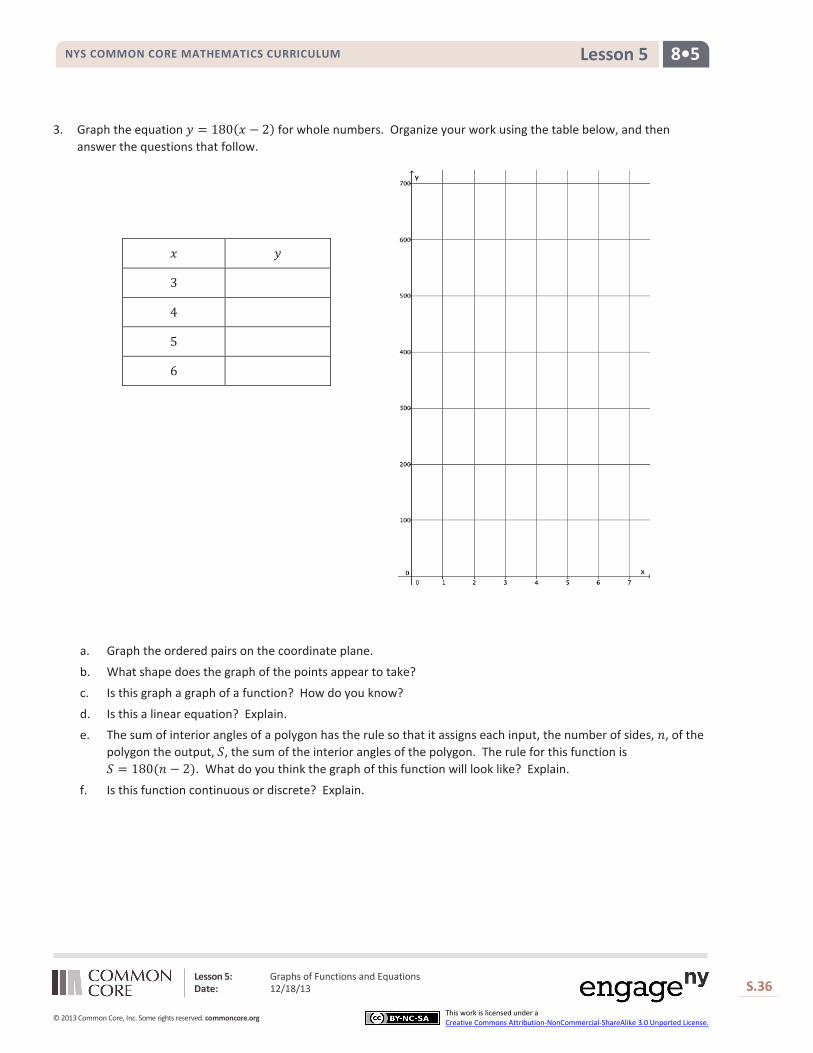
3. Graph the equation 𝑦 = 180(𝑥 − 2) for whole numbers. Organize your work using the table below, and then answer the questions that follow.
𝑥 𝑦
3
4
5
6
a. Graph the ordered pairs on the coordinate plane.
b. What shape does the graph of the points appear to take?
c. Is this graph a graph of a function? How do you know?
d. Is this a linear equation? Explain. e. The sum of interior angles of a polygon has the rule so that it assigns each input, the number of sides, 𝑛, of the
polygon the output, 𝑆, the sum of the interior angles of the polygon. The rule for this function is 𝑆 = 180(𝑛 − 2). What do you think the graph of this function will look like? Explain.
f. Is this function continuous or discrete? Explain.

Lesson 5: Graphs of Functions and Equations Date: 12/18/13
S.37
© 2013 Common Core, Inc. Some rights reserved. commoncore.org
This work is licensed under a Creative Commons Attribution-NonCommercial-ShareAlike 3.0 Unported License.
NYS COMMON CORE MATHEMATICS CURRICULUM 8•5 Lesson 5
4. Examine the graph below. Could the graph represent the graph of a function? Explain why or why not.
5. Examine the graph below. Could the graph represent the graph of a function? Explain why or why not.
6. Examine the graph below. Could the graph represent the graph of a function? Explain why or why not.
Lesson 6: Graphs of Linear Functions and Rate of Change Date: 12/18/13
S.38
© 2013 Common Core, Inc. Some rights reserved. commoncore.org
This work is licensed under a Creative Commons Attribution-NonCommercial-ShareAlike 3.0 Unported License.
NYS COMMON CORE MATHEMATICS CURRICULUM 8•5 Lesson 6
Lesson 6: Graphs of Linear Functions and Rate of Change
Classwork
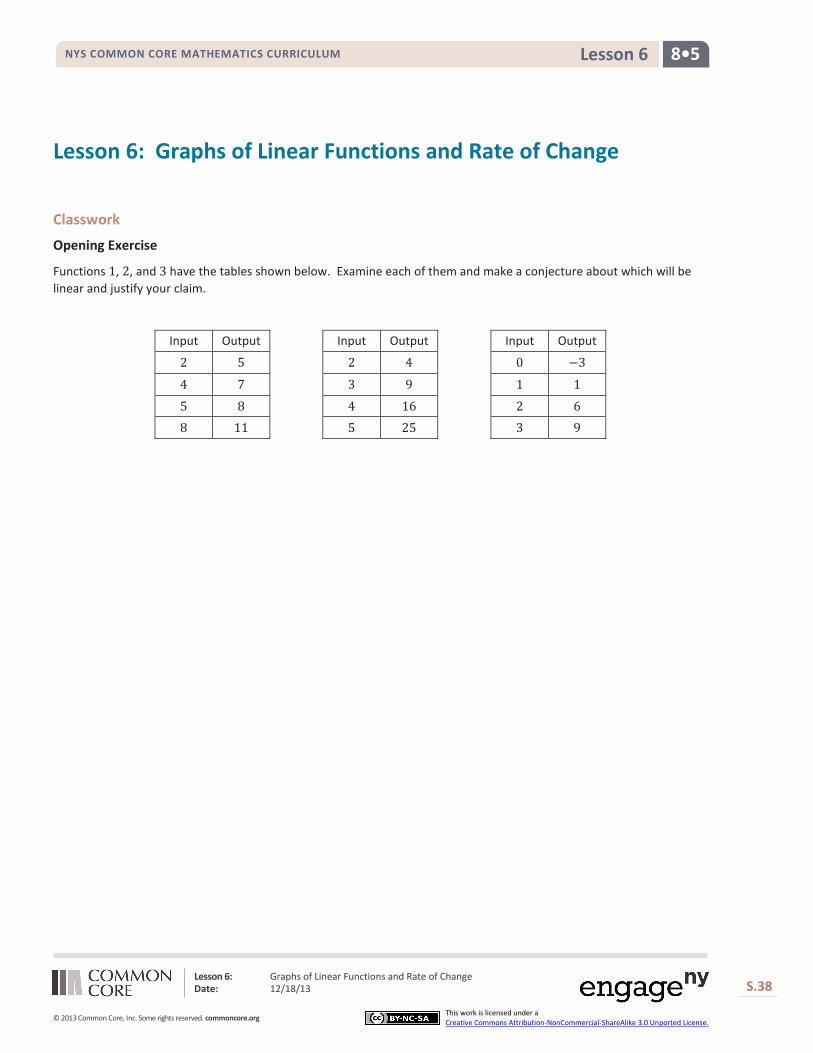
Opening Exercise
Functions 1, 2, and 3 have the tables shown below. Examine each of them and make a conjecture about which will be linear and justify your claim.
Input Output Input Output Input Output
2 5 2 4 0 −3
4 7 3 9 1 1
5 8 4 16 2 6
8 11 5 25 3 9
Lesson 6: Graphs of Linear Functions and Rate of Change Date: 12/18/13
S.39
© 2013 Common Core, Inc. Some rights reserved. commoncore.org
This work is licensed under a Creative Commons Attribution-NonCommercial-ShareAlike 3.0 Unported License.
NYS COMMON CORE MATHEMATICS CURRICULUM 8•5 Lesson 6
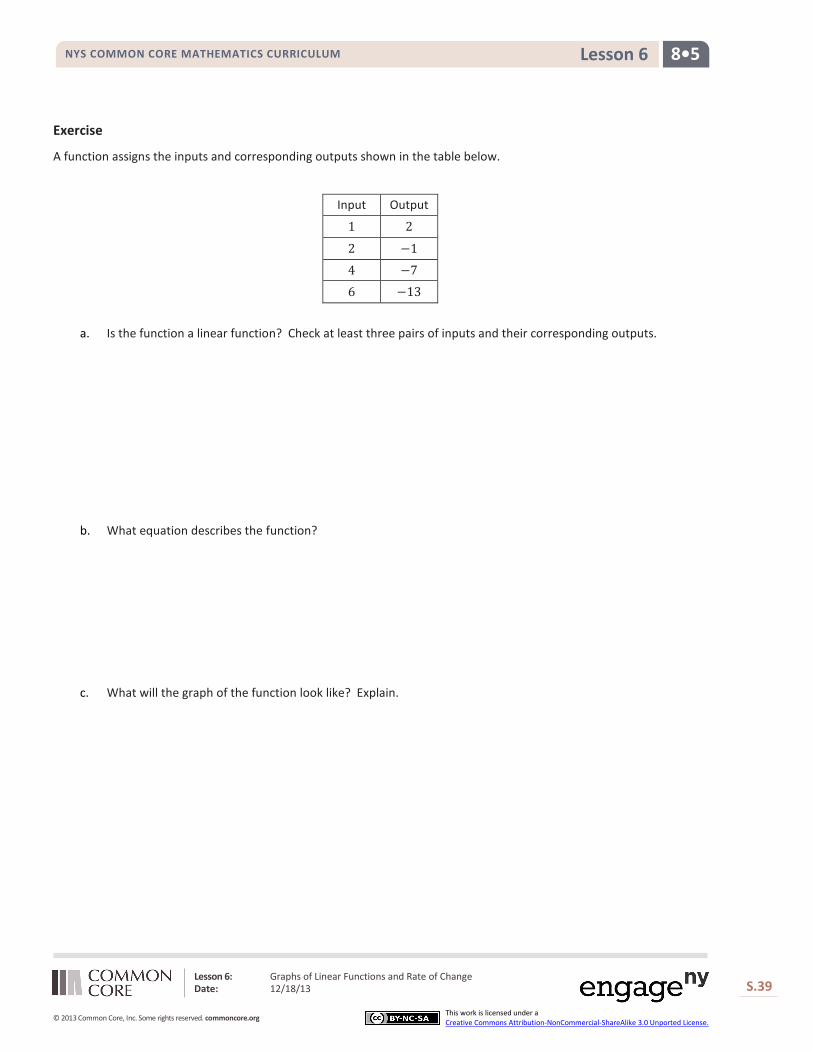
Exercise
A function assigns the inputs and corresponding outputs shown in the table below.
Input Output
1 2 2 −1 4 −7 6 −13
a. Is the function a linear function? Check at least three pairs of inputs and their corresponding outputs.
b. What equation describes the function?
c. What will the graph of the function look like? Explain.

Lesson 6: Graphs of Linear Functions and Rate of Change Date: 12/18/13
S.40
© 2013 Common Core, Inc. Some rights reserved. commoncore.org
This work is licensed under a Creative Commons Attribution-NonCommercial-ShareAlike 3.0 Unported License.
NYS COMMON CORE MATHEMATICS CURRICULUM 8•5 Lesson 6
Problem Set 1. A function assigns the inputs and corresponding outputs shown in the table below.
Input Output 3 9 9 17
12 21 15 25
a. Is the function a linear function? Check at least three pairs of inputs and their corresponding outputs.
b. What equation describes the function?
c. What will the graph of the function look like? Explain.
2. A function assigns the inputs and corresponding outputs shown in the table below.
Input Output −1 2 0 0 1 2 2 8 3 18
a. Is the function a linear function?
b. What equation describes the function?
3. A function assigns the inputs and corresponding outputs shown in the table below.
Input Output 0.2 2 0.6 6 1.5 15 2.1 21
a. Is the function a linear function? Check at least three pairs of inputs and their corresponding outputs.
b. What equation describes the function?
c. What will the graph of the function look like? Explain.
Lesson Summary
When the rate of change is constant for pairs of inputs and their corresponding outputs, the function is a linear function.
We can write linear equations in the form of 𝑦 = 𝑚𝑥 + 𝑏 to express a linear function.
From the last lesson we know that the graph of a function is the same as the graph of the equation that describes it. When a function can be described by the linear equation 𝑦 = 𝑚𝑥 + 𝑏, the graph of the function will be a line because the graph of the equation 𝑦 = 𝑚𝑥 + 𝑏 is a line.
Lesson 6: Graphs of Linear Functions and Rate of Change Date: 12/18/13
S.41
© 2013 Common Core, Inc. Some rights reserved. commoncore.org
This work is licensed under a Creative Commons Attribution-NonCommercial-ShareAlike 3.0 Unported License.
NYS COMMON CORE MATHEMATICS CURRICULUM 8•5 Lesson 6
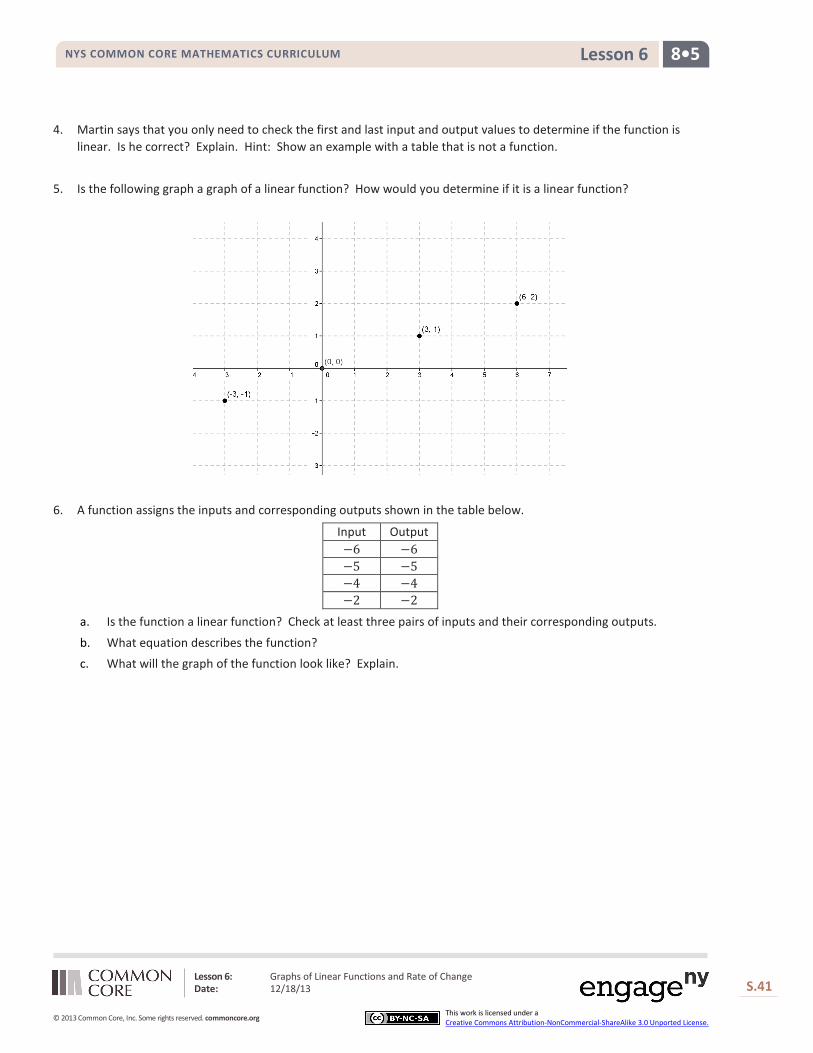
4. Martin says that you only need to check the first and last input and output values to determine if the function is linear. Is he correct? Explain. Hint: Show an example with a table that is not a function.
5. Is the following graph a graph of a linear function? How would you determine if it is a linear function?
6. A function assigns the inputs and corresponding outputs shown in the table below.
Input Output −6 −6 −5 −5 −4 −4 −2 −2
a. Is the function a linear function? Check at least three pairs of inputs and their corresponding outputs.
b. What equation describes the function? c. What will the graph of the function look like? Explain.

Lesson 7: Comparing Linear Functions and Graphs Date: 12/18/13
S.42
© 2013 Common Core, Inc. Some rights reserved. commoncore.org
This work is licensed under a Creative Commons Attribution-NonCommercial-ShareAlike 3.0 Unported License.
NYS COMMON CORE MATHEMATICS CURRICULUM 8•5 Lesson 7
Lesson 7: Comparing Linear Functions and Graphs
Classwork
Exercises
Each of the Exercises 1–4 provides information about functions. Use that information to help you compare the functions and answer the question.
1. Alan and Margot drive at a constant speed. They both drive the same route from City 𝐴 to City 𝐵, a distance of 147 miles. Alan begins driving at 1: 40 p.m. and arrives at City 𝐵 at 4: 15 p.m. Margot’s trip from City 𝐴 to City 𝐵 can be described with the equation 𝑦 = 64𝑥, where 𝑦 is the distance traveled and 𝑥 is the time in hours spent traveling. Who gets from City 𝐴 to City 𝐵 faster?

Lesson 7: Comparing Linear Functions and Graphs Date: 12/18/13
S.43
© 2013 Common Core, Inc. Some rights reserved. commoncore.org
This work is licensed under a Creative Commons Attribution-NonCommercial-ShareAlike 3.0 Unported License.
NYS COMMON CORE MATHEMATICS CURRICULUM 8•5 Lesson 7
2. You have recently begun researching phone billing plans. Phone Company 𝐴 charges a flat rate of $75 a month. A flat rate means that your bill will be $75 each month with no additional costs. The billing plan for Phone Company 𝐵 is a function of the number of texts that you send that month. That is, the total cost of the bill changes each month depending on how many texts you send. The table below represents the inputs and the corresponding outputs that the function assigns.
Input (number of texts)
Output (cost of bill)
50 $50 150 $60 200 $65 500 $95
At what number of texts would the bill from each phone plan be the same? At what number of texts is Phone Company 𝐴 the better choice? At what number of texts is Phone Company 𝐵 the better choice?

Lesson 7: Comparing Linear Functions and Graphs Date: 12/18/13
S.44
© 2013 Common Core, Inc. Some rights reserved. commoncore.org
This work is licensed under a Creative Commons Attribution-NonCommercial-ShareAlike 3.0 Unported License.
NYS COMMON CORE MATHEMATICS CURRICULUM 8•5 Lesson 7
3. A function describes the volume of water in gallons, 𝑦, that flows from faucet 𝐴 for 𝑥 minutes. The graph below is
the graph of this function. Faucet 𝐵’s water flow can be described by the equation 𝑦 = 56 𝑥, where 𝑦 is the volume
of water in gallons that flows from the faucet in 𝑥 minutes. Assume the flow of water from each faucet is constant. Which faucet has a faster flow of water? Each faucet is being used to fill tubs with a volume of 50 gallons. How long will it take each faucet to fill the tub? How do you know? The tub that is filled by faucet 𝐴 already has 15 gallons in it. If both faucets are turned on at the same time, which faucet will fill its tub faster?

Lesson 7: Comparing Linear Functions and Graphs Date: 12/18/13
S.45
© 2013 Common Core, Inc. Some rights reserved. commoncore.org
This work is licensed under a Creative Commons Attribution-NonCommercial-ShareAlike 3.0 Unported License.
NYS COMMON CORE MATHEMATICS CURRICULUM 8•5 Lesson 7
4. Two people, Adam and Bianca, are competing to see who can save the most money in one month. Use the table and the graph below to determine who will save more money at the end of the month. State how much money each person had at the start of the competition.
Adam’s Savings:
Bianca’s Savings:
Input (Number of Days)
Output (Total amount of money)
5 $17 8 $26
12 $38 20 $62
Lesson 7: Comparing Linear Functions and Graphs Date: 12/18/13
S.46
© 2013 Common Core, Inc. Some rights reserved. commoncore.org
This work is licensed under a Creative Commons Attribution-NonCommercial-ShareAlike 3.0 Unported License.
NYS COMMON CORE MATHEMATICS CURRICULUM 8•5 Lesson 7
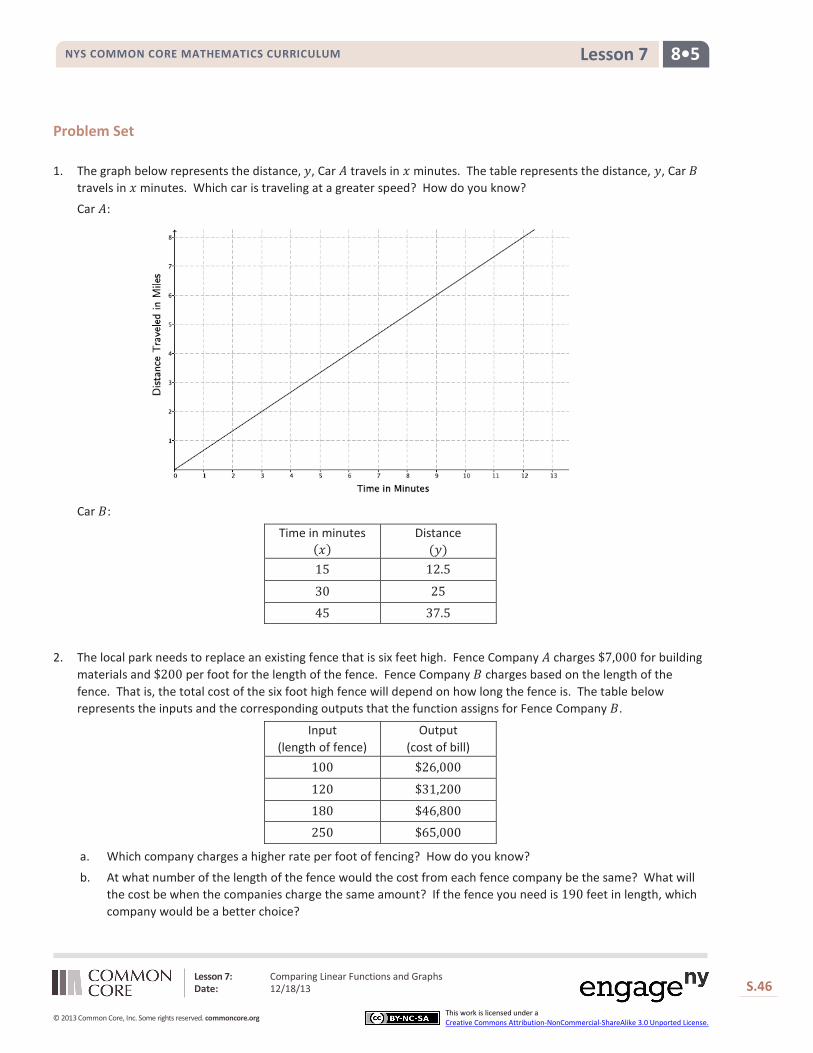
Problem Set 1. The graph below represents the distance, 𝑦, Car 𝐴 travels in 𝑥 minutes. The table represents the distance, 𝑦, Car 𝐵
travels in 𝑥 minutes. Which car is traveling at a greater speed? How do you know?
Car 𝐴:
Car 𝐵:
Time in minutes (𝑥)
Distance (𝑦)
15 12.5 30 25 45 37.5
2. The local park needs to replace an existing fence that is six feet high. Fence Company 𝐴 charges $7,000 for building materials and $200 per foot for the length of the fence. Fence Company 𝐵 charges based on the length of the fence. That is, the total cost of the six foot high fence will depend on how long the fence is. The table below represents the inputs and the corresponding outputs that the function assigns for Fence Company 𝐵.
Input (length of fence)
Output (cost of bill)
100 $26,000 120 $31,200 180 $46,800 250 $65,000
a. Which company charges a higher rate per foot of fencing? How do you know?
b. At what number of the length of the fence would the cost from each fence company be the same? What will the cost be when the companies charge the same amount? If the fence you need is 190 feet in length, which company would be a better choice?

Lesson 7: Comparing Linear Functions and Graphs Date: 12/18/13
S.47
© 2013 Common Core, Inc. Some rights reserved. commoncore.org
This work is licensed under a Creative Commons Attribution-NonCommercial-ShareAlike 3.0 Unported License.
NYS COMMON CORE MATHEMATICS CURRICULUM 8•5 Lesson 7
3. The rule 𝑦 = 123𝑥 is used to describe the function for the number of minutes needed 𝑥 to produce 𝑦 toys at Toys Plus. Another company, #1 Toys, has a similar function that assigned the values shown in the table below. Which company produces toys at a slower rate? Explain.
Time in minutes (𝑥)
Toys Produced (𝑦)
5 600 11 1,320 13 1,560
4. A function describes the number of miles a train can travel, 𝑦, for the number of hours, 𝑥. The graph below is the graph of this function. Assume constant speed. The train is traveling from City 𝐴 to City 𝐵 (a distance of 320 miles). After 4 hours, the train slows down to a constant speed of 48 miles per hour.
a. How long will it take the train to reach its destination?
b. If the train had not slowed down after 4 hours, how long would it have taken to reach its destination?
c. Suppose after 4 hours, the train increased its constant speed. How fast would the train have to travel to complete the destination in 1.5 hours?

Lesson 7: Comparing Linear Functions and Graphs Date: 12/18/13
S.48
© 2013 Common Core, Inc. Some rights reserved. commoncore.org
This work is licensed under a Creative Commons Attribution-NonCommercial-ShareAlike 3.0 Unported License.
NYS COMMON CORE MATHEMATICS CURRICULUM 8•5 Lesson 7
5. a. A hose is used to fill up a 1,200 gallon water truck at a constant rate. After 10 minutes, there are 65 gallons of water in the truck. After 15 minutes, there are 82 gallons of water in the truck. How long will it take to fill up the water truck?
b. The driver of the truck realizes that something is wrong with the hose he is using. After 30 minutes, he shuts off the hose and tries a different hose. The second hose has a constant rate of 18 gallons per minute. How long does it take the second hose to fill up the truck?
c. Could there ever be a time when the first hose and the second hose filled up the same amount of water?

Lesson 8: Graphs of Simple Non-Linear Functions Date: 12/18/13
S.49
© 2013 Common Core, Inc. Some rights reserved. commoncore.org
This work is licensed under a Creative Commons Attribution-NonCommercial-ShareAlike 3.0 Unported License.
NYS COMMON CORE MATHEMATICS CURRICULUM 8•5 Lesson 8
Lesson 8: Graphs of Simple Non-Linear Functions
Classwork
Exercises
1. A function has the rule so that each input of 𝑥 is assigned an output of 𝑥2. a. Do you think the function is linear or non-linear? Explain.
b. Develop a list of inputs and outputs for this function. Organize your work using the table below. Then, answer the questions that follow.
Input (𝑥) Output (𝑥2)
−5
−4
−3
−2
−1
0
1
2
3
4
5
c. Graph the inputs and outputs as points on the coordinate plane where the output is the 𝑦-coordinate.

Lesson 8: Graphs of Simple Non-Linear Functions Date: 12/18/13
S.50
© 2013 Common Core, Inc. Some rights reserved. commoncore.org
This work is licensed under a Creative Commons Attribution-NonCommercial-ShareAlike 3.0 Unported License.
NYS COMMON CORE MATHEMATICS CURRICULUM 8•5 Lesson 8
d. What shape does the graph of the points appear to take?
e. Find the rate of change using rows 1 and 2 from the table above.
f. Find the rate of change using rows 2 and 3 from the above table.
g. Find the rate of change using any two other rows from the above table.
h. Return to your initial claim about the function. Is it linear or non-linear? Justify your answer with as many pieces of evidence as possible.
2. A function has the rule so that each input of 𝑥 is assigned an output of 𝑥3. a. Do you think the function is linear or non-linear? Explain.

Lesson 8: Graphs of Simple Non-Linear Functions Date: 12/18/13
S.51
© 2013 Common Core, Inc. Some rights reserved. commoncore.org
This work is licensed under a Creative Commons Attribution-NonCommercial-ShareAlike 3.0 Unported License.
NYS COMMON CORE MATHEMATICS CURRICULUM 8•5 Lesson 8
b. Develop a list of inputs and outputs for this function. Organize your work using the table below. Then, answer the questions that follow.
Input (𝑥) Output (𝑥3)
−2.5
−2
−1.5
−1
−0.5
0
0. 5
1
1.5
2
2.5
c. Graph the inputs and outputs as points on the coordinate
plane where the output is the 𝑦-coordinate.
d. What shape does the graph of the points appear to take?
e. Find the rate of change using rows 2 and 3 from the table above.
f. Find the rate of change using rows 3 and 4 from the table above.

Lesson 8: Graphs of Simple Non-Linear Functions Date: 12/18/13
S.52
© 2013 Common Core, Inc. Some rights reserved. commoncore.org
This work is licensed under a Creative Commons Attribution-NonCommercial-ShareAlike 3.0 Unported License.
NYS COMMON CORE MATHEMATICS CURRICULUM 8•5 Lesson 8
g. Find the rate of change using rows 8 and 9 from the table above.
h. Return to your initial claim about the function. Is it linear or non-linear? Justify your answer with as many pieces of evidence as possible.
3. A function has the rule so that each input of 𝑥 is assigned an output of 1𝑥
for values of 𝑥 > 0.
a. Do you think the function is linear or non-linear? Explain.
b. Develop a list of inputs and outputs for this function. Organize your work using the table below. Then, answer the questions that follow.
Input (𝑥) Output �1𝑥�
0.1
0.2
0.4
0.5
0.8
1
1.6
2
2.5
4
5
c. Graph the inputs and outputs as points on the coordinate plane where the output is the 𝑦-coordinate.

Lesson 8: Graphs of Simple Non-Linear Functions Date: 12/18/13
S.53
© 2013 Common Core, Inc. Some rights reserved. commoncore.org
This work is licensed under a Creative Commons Attribution-NonCommercial-ShareAlike 3.0 Unported License.
NYS COMMON CORE MATHEMATICS CURRICULUM 8•5 Lesson 8
d. What shape does the graph of the points appear to take?
e. Find the rate of change using rows 1 and 2 from the table above.
f. Find the rate of change using rows 2 and 3 from the table above.
g. Find the rate of change using any two other rows from the table above.
h. Return to your initial claim about the function. Is it linear or non-linear? Justify your answer with as many pieces of evidence as possible.
In Exercises 4–10 the rule that describes a function is given. If necessary, use a table to organize pairs of inputs and outputs, and then graph each on a coordinate plane to help answer the questions.
4. What shape do you expect the graph of the function described by 𝑦 = 𝑥 to take? Is it a linear or non-linear function?

Lesson 8: Graphs of Simple Non-Linear Functions Date: 12/18/13
S.54
© 2013 Common Core, Inc. Some rights reserved. commoncore.org
This work is licensed under a Creative Commons Attribution-NonCommercial-ShareAlike 3.0 Unported License.
NYS COMMON CORE MATHEMATICS CURRICULUM 8•5 Lesson 8
5. What shape do you expect the graph of the function described by 𝑦 = 2𝑥2 − 𝑥 to take? Is it a linear or non-linear function?
6. What shape do you expect the graph of the function described by 3𝑥 + 7𝑦 = 8 to take? Is it a linear or non-linear
function?
7. What shape do you expect the graph of the function described by 𝑦 = 4𝑥3 to take? Is it a linear or non-linear function?
8. What shape do you expect the graph of the function described by 3𝑥
= 𝑦 to take? Is it a linear or non-linear function?
9. What shape do you expect the graph of the function described by 4𝑥2
= 𝑦 to take? Is it a linear or non-linear function?
10. What shape do you expect the graph of the equation 𝑥2 + 𝑦2 = 36 to take? Is it a linear or non-linear? Is it a function? Explain.

Lesson 8: Graphs of Simple Non-Linear Functions Date: 12/18/13
S.55
© 2013 Common Core, Inc. Some rights reserved. commoncore.org
This work is licensed under a Creative Commons Attribution-NonCommercial-ShareAlike 3.0 Unported License.
NYS COMMON CORE MATHEMATICS CURRICULUM 8•5 Lesson 8
Problem Set 1. A function has the rule so that each input of 𝑥 is assigned an output of 𝑥2 − 4.
a. Do you think the function is linear or non-linear? Explain.
b. What shape do you expect the graph of the function to be?
c. Develop a list of inputs and outputs for this function. Graph the input and outputs as points on the coordinate plane where the output is the 𝑦-coordinate.
d. Was your prediction correct?
2. A function has the rule so that each input of 𝑥 is assigned an output of 1
𝑥+3.
a. Is the function linear or non-linear? Explain.
b. What shape do you expect the graph of the function to take?
c. Given the inputs in the table below, use the rule of the function to determine the corresponding outputs. Graph the inputs and outputs as points on the coordinate plane where the output is the 𝑦-coordinate.
d. Was your prediction correct?
Input (𝑥) Output (𝑥2 − 4)
−3 −2 −1 0 1 2 3
Input (𝑥) Output � 1𝑥+3�
−2 −1 0 1 2 3
Lesson Summary
One way to determine if a function is linear or non-linear is by inspecting the rate of change using a table of values or by examining its graph. Functions described by non-linear equations do not have a constant rate of change. Because some functions can be described by equations, an examination of the equation allows you to determine if the function is linear or non-linear. Just like with equations, when the exponent of the variable 𝑥 is not equal to 1, then the equation is non-linear; therefore, the function described by a non-linear equation will graph as some kind of curve, i.e., not a line.

Lesson 8: Graphs of Simple Non-Linear Functions Date: 12/18/13
S.56
© 2013 Common Core, Inc. Some rights reserved. commoncore.org
This work is licensed under a Creative Commons Attribution-NonCommercial-ShareAlike 3.0 Unported License.
NYS COMMON CORE MATHEMATICS CURRICULUM 8•5 Lesson 8
3. Is the function that is represented by this graph linear or non-linear? Explain. Show work that supports your claim.
Lesson 9: Examples of Functions from Geometry Date: 12/18/13
S.57
© 2013 Common Core, Inc. Some rights reserved. commoncore.org
This work is licensed under a Creative Commons Attribution-NonCommercial-ShareAlike 3.0 Unported License.
NYS COMMON CORE MATHEMATICS CURRICULUM 8•5 Lesson 9
Lesson 9: Examples of Functions from Geometry
Classwork
Exercises
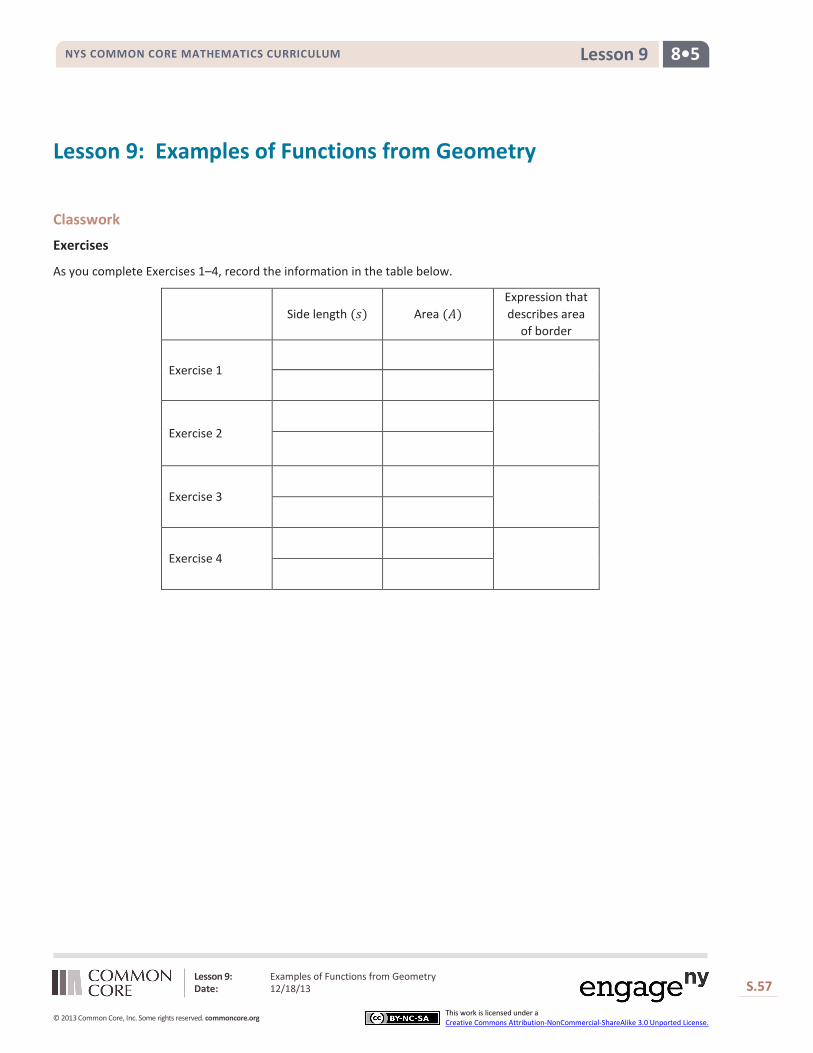
As you complete Exercises 1–4, record the information in the table below.
Side length (𝑠) Area (𝐴)
Expression that describes area
of border
Exercise 1
Exercise 2
Exercise 3
Exercise 4

Lesson 9: Examples of Functions from Geometry Date: 12/18/13
S.58
© 2013 Common Core, Inc. Some rights reserved. commoncore.org
This work is licensed under a Creative Commons Attribution-NonCommercial-ShareAlike 3.0 Unported License.
NYS COMMON CORE MATHEMATICS CURRICULUM 8•5 Lesson 9
1. Use the figure below to answer parts (a)–(f).
a. What is the length of one side of the smaller, inner square?
b. What is the area of the smaller, inner square?
c. What is the length of one side of the larger, outer square?
d. What is the area of the area of the larger, outer square?
e. Use your answers in parts (b) and (d) to determine the area of the 1-inch white border of the figure.
f. Explain your strategy for finding the area of the white border.

Lesson 9: Examples of Functions from Geometry Date: 12/18/13
S.59
© 2013 Common Core, Inc. Some rights reserved. commoncore.org
This work is licensed under a Creative Commons Attribution-NonCommercial-ShareAlike 3.0 Unported License.
NYS COMMON CORE MATHEMATICS CURRICULUM 8•5 Lesson 9
2. Use the figure below to answer parts (a)–(f).
a. What is the length of one side of the smaller, inner square?
b. What is the area of the smaller, inner square?
c. What is the length of one side of the larger, outer square?
d. What is the area of the area of the larger, outer square?
e. Use your answers in parts (b) and (d) to determine the area of the 1-inch white border of the figure.
f. Explain your strategy for finding the area of the white border.

Lesson 9: Examples of Functions from Geometry Date: 12/18/13
S.60
© 2013 Common Core, Inc. Some rights reserved. commoncore.org
This work is licensed under a Creative Commons Attribution-NonCommercial-ShareAlike 3.0 Unported License.
NYS COMMON CORE MATHEMATICS CURRICULUM 8•5 Lesson 9
3. Use the figure below to answer parts (a)–(f).
a. What is the length of one side of the smaller, inner square?
b. What is the area of the smaller, inner square?
c. What is the length of one side of the larger, outer square?
d. What is the area of the area of the larger, outer square?
e. Use your answers in parts (b) and (d) to determine the area of the 1-inch white border of the figure.
f. Explain your strategy for finding the area of the white border.

Lesson 9: Examples of Functions from Geometry Date: 12/18/13
S.61
© 2013 Common Core, Inc. Some rights reserved. commoncore.org
This work is licensed under a Creative Commons Attribution-NonCommercial-ShareAlike 3.0 Unported License.
NYS COMMON CORE MATHEMATICS CURRICULUM 8•5 Lesson 9
4. Write a function that would allow you to calculate the area of a 1-inch white border for any sized square picture measured in inches.
a. Write an expression that represents the side length of the smaller, inner square.
b. Write an expression that represents the area of the smaller, inner square.
c. Write an expression that represents the side lengths of the larger, outer square.
d. Write an expression that represents the area of the larger, outer square.
e. Use your expressions in parts (b) and (d) to write a function for the area 𝐴 of the 1-inch white border for any sized square picture measured in inches.

Lesson 9: Examples of Functions from Geometry Date: 12/18/13
S.62
© 2013 Common Core, Inc. Some rights reserved. commoncore.org
This work is licensed under a Creative Commons Attribution-NonCommercial-ShareAlike 3.0 Unported License.
NYS COMMON CORE MATHEMATICS CURRICULUM 8•5 Lesson 9
5. The volume of the prism shown below is 61.6 in3. What is the height of the prism?
6. Find the value of the ratio that compares the volume of the larger prism to the smaller prism.

Lesson 9: Examples of Functions from Geometry Date: 12/18/13
S.63
© 2013 Common Core, Inc. Some rights reserved. commoncore.org
This work is licensed under a Creative Commons Attribution-NonCommercial-ShareAlike 3.0 Unported License.
NYS COMMON CORE MATHEMATICS CURRICULUM 8•5 Lesson 9
As you complete Exercises 7–10, record the information in the table below.
Area of base (𝐴) Height (ℎ) Volume
Exercise 7
Exercise 8
Exercise 9
Exercise 10
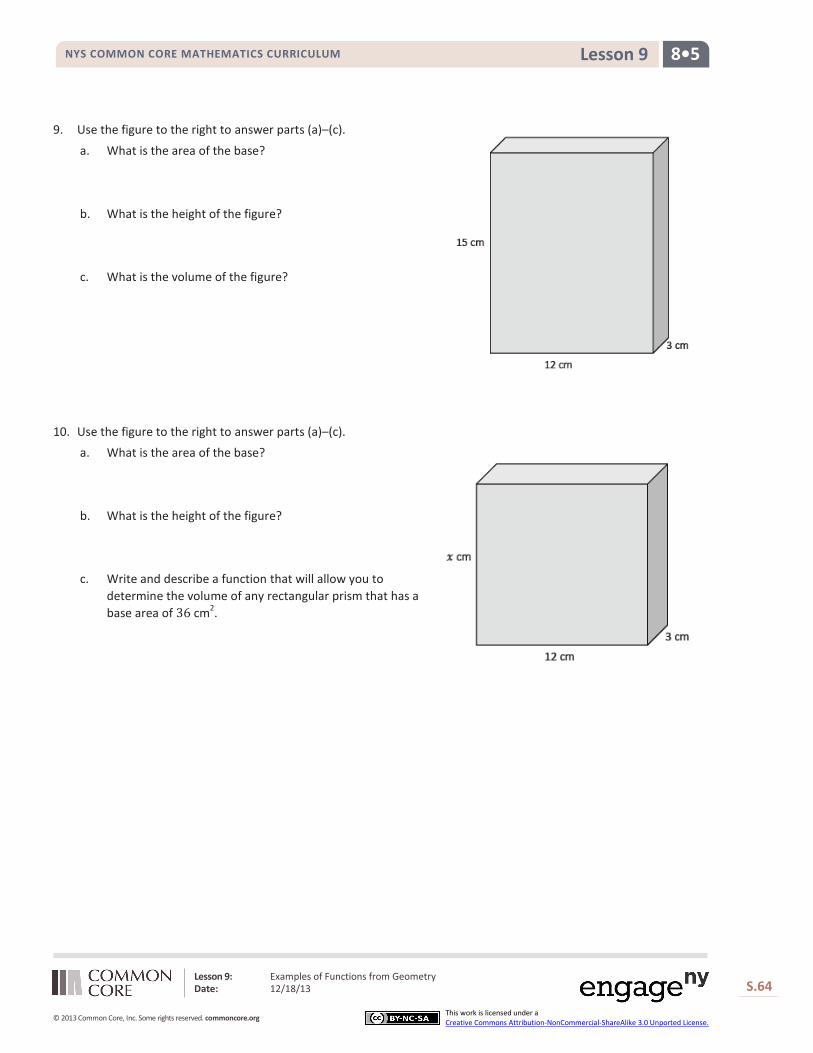
7. Use the figure below to answer parts (a)–(c).
a. What is the area of the base?
b. What is the height of the figure?
c. What is the volume of the figure?
8. Use the figure to the right to answer parts (a)–(c). a. What is the area of the base?
b. What is the height of the figure?
c. What is the volume of the figure?
Lesson 9: Examples of Functions from Geometry Date: 12/18/13
S.64
© 2013 Common Core, Inc. Some rights reserved. commoncore.org
This work is licensed under a Creative Commons Attribution-NonCommercial-ShareAlike 3.0 Unported License.
NYS COMMON CORE MATHEMATICS CURRICULUM 8•5 Lesson 9
9. Use the figure to the right to answer parts (a)–(c).
a. What is the area of the base?
b. What is the height of the figure?
c. What is the volume of the figure?
10. Use the figure to the right to answer parts (a)–(c). a. What is the area of the base?
b. What is the height of the figure?
c. Write and describe a function that will allow you to determine the volume of any rectangular prism that has a base area of 36 cm2.
Lesson 9: Examples of Functions from Geometry Date: 12/18/13
S.65
© 2013 Common Core, Inc. Some rights reserved. commoncore.org
This work is licensed under a Creative Commons Attribution-NonCommercial-ShareAlike 3.0 Unported License.
NYS COMMON CORE MATHEMATICS CURRICULUM 8•5 Lesson 9
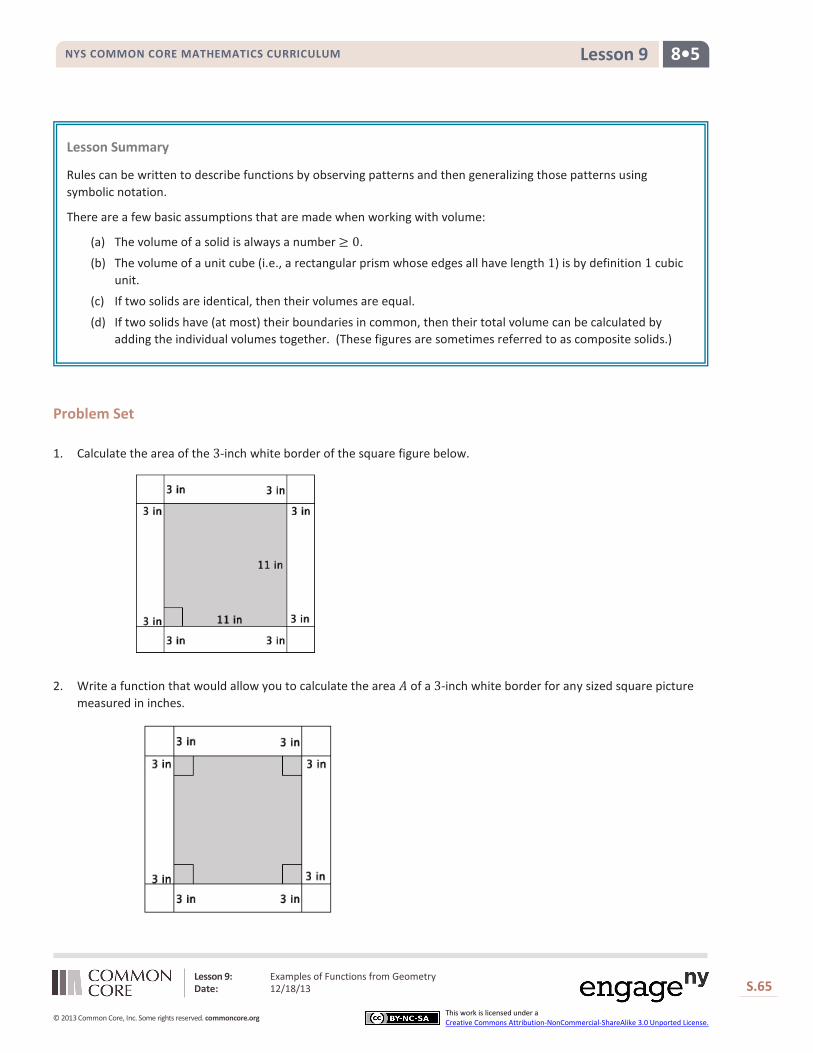
Problem Set 1. Calculate the area of the 3-inch white border of the square figure below.
2. Write a function that would allow you to calculate the area 𝐴 of a 3-inch white border for any sized square picture measured in inches.
Lesson Summary
Rules can be written to describe functions by observing patterns and then generalizing those patterns using symbolic notation.
There are a few basic assumptions that are made when working with volume:
(a) The volume of a solid is always a number ≥ 0.
(b) The volume of a unit cube (i.e., a rectangular prism whose edges all have length 1) is by definition 1 cubic unit.
(c) If two solids are identical, then their volumes are equal.
(d) If two solids have (at most) their boundaries in common, then their total volume can be calculated by adding the individual volumes together. (These figures are sometimes referred to as composite solids.)
Lesson 9: Examples of Functions from Geometry Date: 12/18/13
S.66
© 2013 Common Core, Inc. Some rights reserved. commoncore.org
This work is licensed under a Creative Commons Attribution-NonCommercial-ShareAlike 3.0 Unported License.
NYS COMMON CORE MATHEMATICS CURRICULUM 8•5 Lesson 9
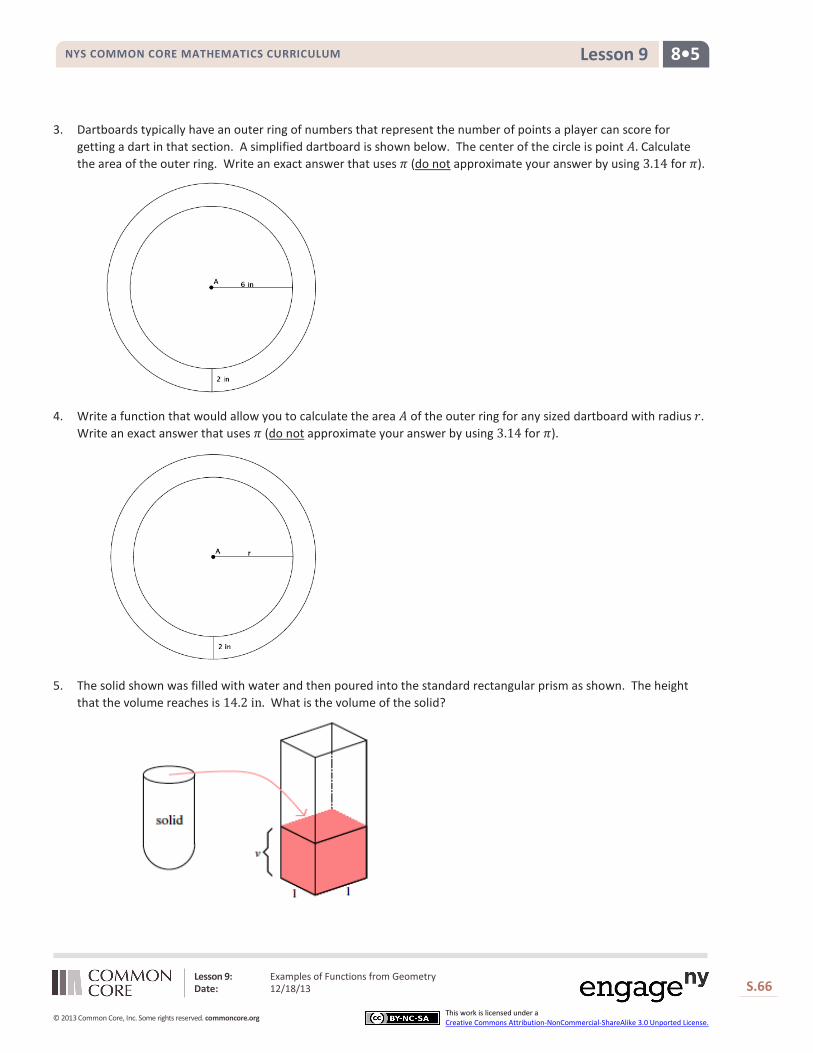
3. Dartboards typically have an outer ring of numbers that represent the number of points a player can score for getting a dart in that section. A simplified dartboard is shown below. The center of the circle is point 𝐴. Calculate the area of the outer ring. Write an exact answer that uses 𝜋 (do not approximate your answer by using 3.14 for 𝜋).
4. Write a function that would allow you to calculate the area 𝐴 of the outer ring for any sized dartboard with radius 𝑟. Write an exact answer that uses 𝜋 (do not approximate your answer by using 3.14 for 𝜋).
5. The solid shown was filled with water and then poured into the standard rectangular prism as shown. The height that the volume reaches is 14.2 in. What is the volume of the solid?
Lesson 9: Examples of Functions from Geometry Date: 12/18/13
S.67
© 2013 Common Core, Inc. Some rights reserved. commoncore.org
This work is licensed under a Creative Commons Attribution-NonCommercial-ShareAlike 3.0 Unported License.
NYS COMMON CORE MATHEMATICS CURRICULUM 8•5 Lesson 9
6.4 in.
5.1 in.
10.2 in.
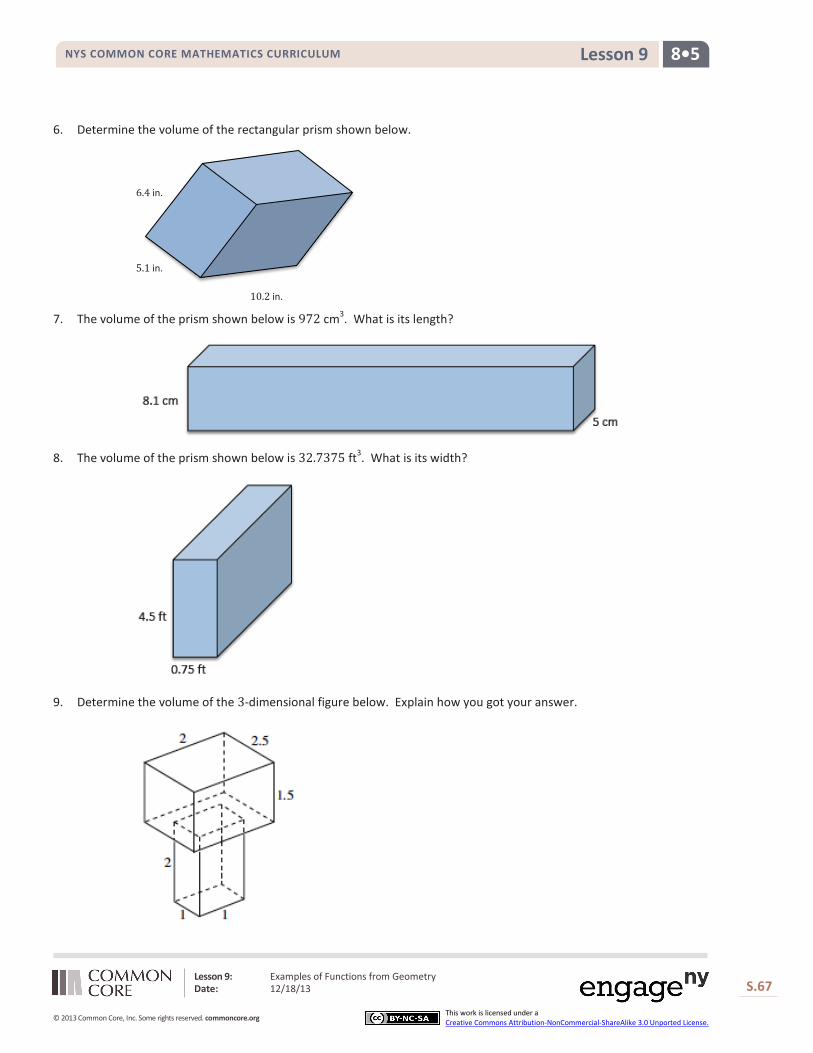
6. Determine the volume of the rectangular prism shown below.
7. The volume of the prism shown below is 972 cm3. What is its length?
8. The volume of the prism shown below is 32.7375 ft3. What is its width?
9. Determine the volume of the 3-dimensional figure below. Explain how you got your answer.
Lesson 10: Volumes of Familiar Solids–Cones and Cylinders Date: 12/18/13
S.68
© 2013 Common Core, Inc. Some rights reserved. commoncore.org
This work is licensed under a Creative Commons Attribution-NonCommercial-ShareAlike 3.0 Unported License.
NYS COMMON CORE MATHEMATICS CURRICULUM 8•5 Lesson 10
Lesson 10: Volumes of Familiar Solids—Cones and Cylinders
Classwork
Exercises
1.
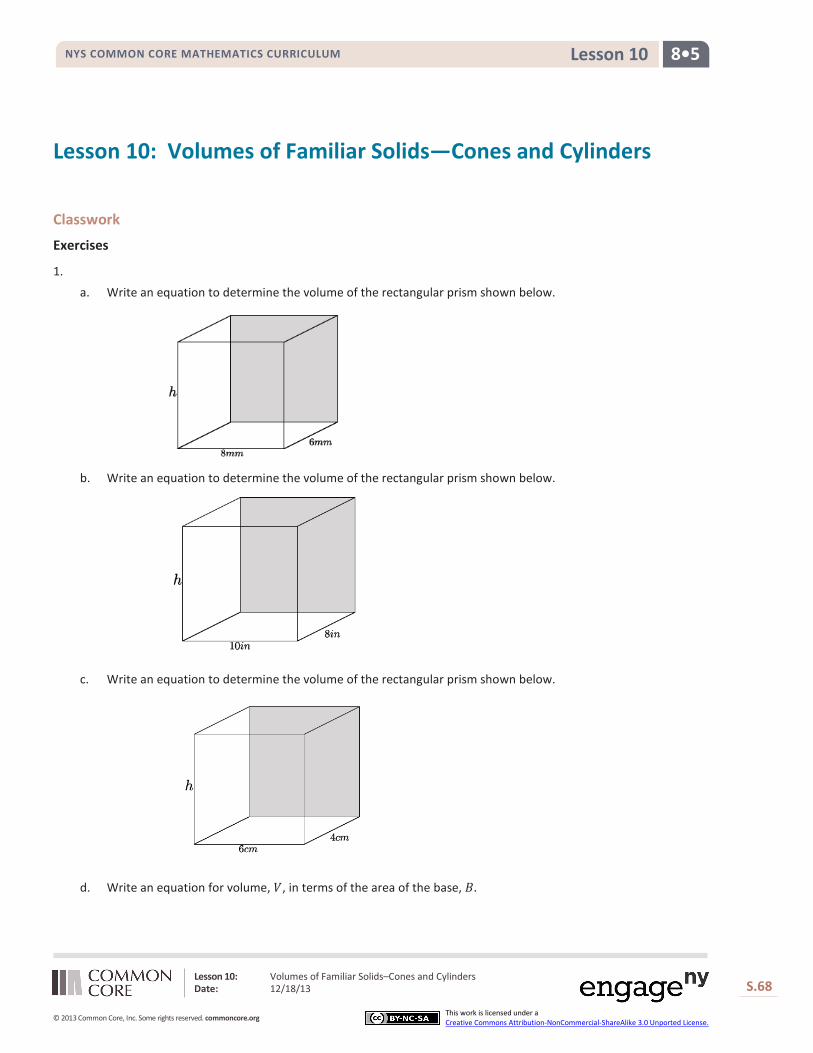
a. Write an equation to determine the volume of the rectangular prism shown below.
b. Write an equation to determine the volume of the rectangular prism shown below.
c. Write an equation to determine the volume of the rectangular prism shown below.
d. Write an equation for volume, 𝑉, in terms of the area of the base, 𝐵.
Lesson 10: Volumes of Familiar Solids–Cones and Cylinders Date: 12/18/13
S.69
© 2013 Common Core, Inc. Some rights reserved. commoncore.org
This work is licensed under a Creative Commons Attribution-NonCommercial-ShareAlike 3.0 Unported License.
NYS COMMON CORE MATHEMATICS CURRICULUM 8•5 Lesson 10
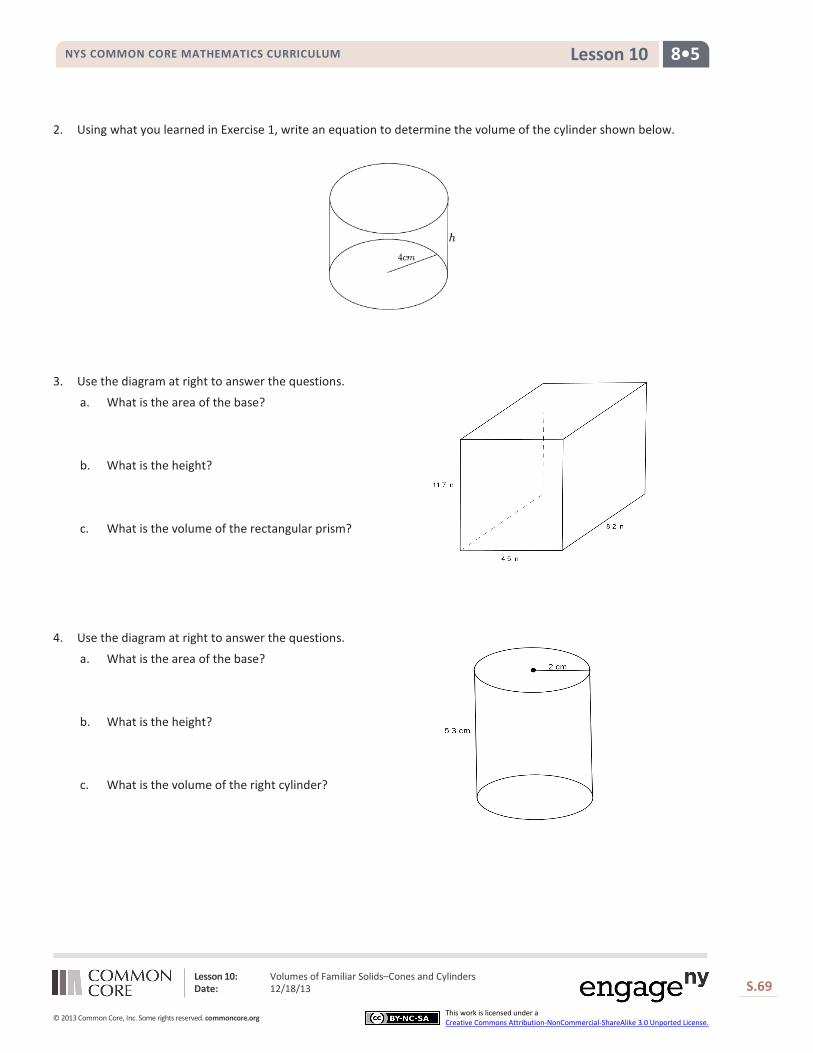
2. Using what you learned in Exercise 1, write an equation to determine the volume of the cylinder shown below.
3. Use the diagram at right to answer the questions.
a. What is the area of the base?
b. What is the height?
c. What is the volume of the rectangular prism?
4. Use the diagram at right to answer the questions.
a. What is the area of the base?
b. What is the height?
c. What is the volume of the right cylinder?

Lesson 10: Volumes of Familiar Solids–Cones and Cylinders Date: 12/18/13
S.70
© 2013 Common Core, Inc. Some rights reserved. commoncore.org
This work is licensed under a Creative Commons Attribution-NonCommercial-ShareAlike 3.0 Unported License.
NYS COMMON CORE MATHEMATICS CURRICULUM 8•5 Lesson 10
5. Use the diagram at right to answer the questions.
a. What is the area of the base?
b. What is the height?
c. What is the volume of the right cylinder?
6. Use the diagram to find the volume of the right cone.
7. Use the diagram to find the volume of the right cone.
Lesson 10: Volumes of Familiar Solids–Cones and Cylinders Date: 12/18/13
S.71
© 2013 Common Core, Inc. Some rights reserved. commoncore.org
This work is licensed under a Creative Commons Attribution-NonCommercial-ShareAlike 3.0 Unported License.
NYS COMMON CORE MATHEMATICS CURRICULUM 8•5 Lesson 10
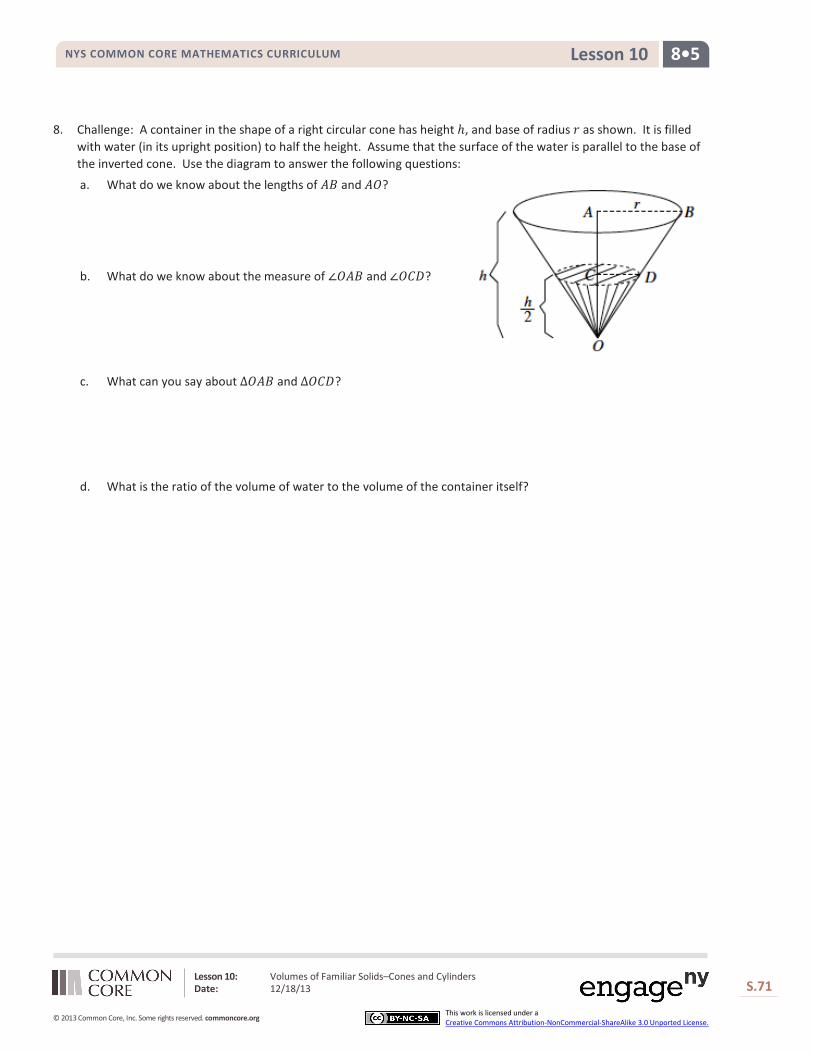
8. Challenge: A container in the shape of a right circular cone has height ℎ, and base of radius 𝑟 as shown. It is filled with water (in its upright position) to half the height. Assume that the surface of the water is parallel to the base of the inverted cone. Use the diagram to answer the following questions:
a. What do we know about the lengths of 𝐴𝐵 and 𝐴𝑂?
b. What do we know about the measure of ∠𝑂𝐴𝐵 and ∠𝑂𝐶𝐷?
c. What can you say about Δ𝑂𝐴𝐵 and Δ𝑂𝐶𝐷?
d. What is the ratio of the volume of water to the volume of the container itself?

Lesson 10: Volumes of Familiar Solids–Cones and Cylinders Date: 12/18/13
S.72
© 2013 Common Core, Inc. Some rights reserved. commoncore.org
This work is licensed under a Creative Commons Attribution-NonCommercial-ShareAlike 3.0 Unported License.
NYS COMMON CORE MATHEMATICS CURRICULUM 8•5 Lesson 10
Problem Set 1. Use the diagram to help you find the volume of the right cylinder.
2. Use the diagram to help you find the volume of the right cone.
Lesson Summary
The formula to find the volume 𝑉, of a right cylinder is 𝑉 = 𝜋𝑟2ℎ = 𝐵ℎ, where 𝐵 is the area of the base.
The formula to find the volume of a cone is directly related to that of the cylinder. Given a cylinder with radius 𝑟 and height ℎ, the volume of a cone with those same dimensions is exaclty one-third of the cylinder. The formula for the volume 𝑉, of a cone is 𝑉 = 1
3𝜋𝑟2ℎ = 1
3𝐵ℎ, where 𝐵 is the area of the base.

Lesson 10: Volumes of Familiar Solids–Cones and Cylinders Date: 12/18/13
S.73
© 2013 Common Core, Inc. Some rights reserved. commoncore.org
This work is licensed under a Creative Commons Attribution-NonCommercial-ShareAlike 3.0 Unported License.
NYS COMMON CORE MATHEMATICS CURRICULUM 8•5 Lesson 10
3. Use the diagram to help you find the volume of the right cylinder.
4. Use the diagram to help you find the volume of the right cone.
5. Oscar wants to fill with water a bucket that is the shape of a right cylinder. It has a 6-inch radius and 12-inch height. He uses a shovel that has the shape of right cone with a 3-inch radius and 4-inch height. How many shovelfuls will it take Oscar to fill the bucket up level with the top?
6. A cylindrical tank (with dimensions shown below) contains water that is 1-foot deep. If water is poured into the
tank at a constant rate of 20 𝑓𝑡3
𝑚𝑖𝑛 for 20 min., will the tank overflow? Use 3.14 to estimate 𝜋.
Lesson 11: Volume of a Sphere Date: 12/18/13
S.74
© 2013 Common Core, Inc. Some rights reserved. commoncore.org
This work is licensed under a Creative Commons Attribution-NonCommercial-ShareAlike 3.0 Unported License.
NYS COMMON CORE MATHEMATICS CURRICULUM 8•5 Lesson 11
Lesson 11: Volume of a Sphere
Classwork
Exercises 1–3
1. What is the volume of a cylinder?
2. What is the height of the cylinder?
3. If 𝑣𝑜𝑙𝑢𝑚𝑒(𝑠𝑝ℎ𝑒𝑟𝑒) = 23 𝑣𝑜𝑙𝑢𝑚𝑒(𝑐𝑦𝑙𝑖𝑛𝑑𝑒𝑟 𝑤𝑖𝑡ℎ 𝑠𝑎𝑚𝑒 𝑑𝑖𝑎𝑚𝑒𝑡𝑒𝑟 𝑎𝑛𝑑 ℎ𝑒𝑖𝑔ℎ𝑡), what is the formula for the volume
of a sphere?
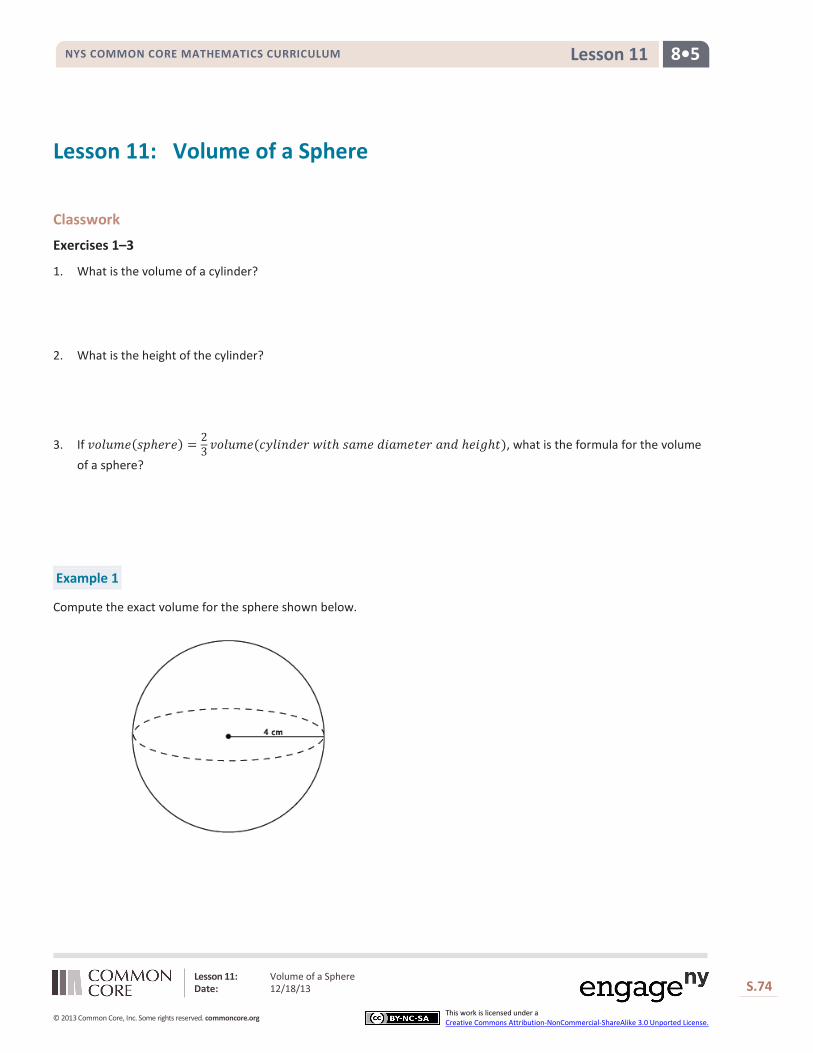
Example 1
Compute the exact volume for the sphere shown below.

Lesson 11: Volume of a Sphere Date: 12/18/13
S.75
© 2013 Common Core, Inc. Some rights reserved. commoncore.org
This work is licensed under a Creative Commons Attribution-NonCommercial-ShareAlike 3.0 Unported License.
NYS COMMON CORE MATHEMATICS CURRICULUM 8•5 Lesson 11
Example 2
A cylinder has a diameter of 16 inches and a height of 14 inches. What is the volume of the largest sphere that will fit into the cylinder?
Exercises4–8
4. Use the diagram and the general formula to find the volume of the sphere.
Lesson 11: Volume of a Sphere Date: 12/18/13
S.76
© 2013 Common Core, Inc. Some rights reserved. commoncore.org
This work is licensed under a Creative Commons Attribution-NonCommercial-ShareAlike 3.0 Unported License.
NYS COMMON CORE MATHEMATICS CURRICULUM 8•5 Lesson 11
5. The average basketball has a diameter of 9.5 inches. What is the volume of an average basketball? Round your answer to the tenths place.
6. A spherical fish tank has a radius of 8 inches. Assuming the entire tank could be filled with water, what would the volume of the tank be? Round your answer to the tenths place.
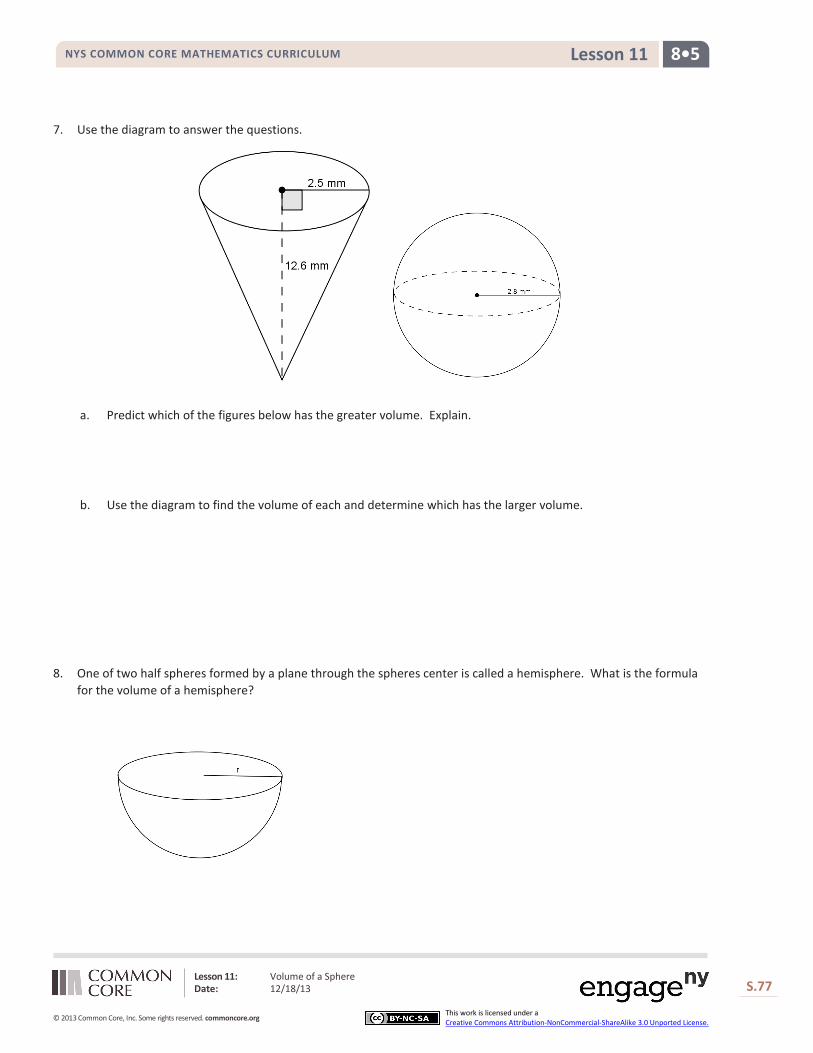
Lesson 11: Volume of a Sphere Date: 12/18/13
S.77
© 2013 Common Core, Inc. Some rights reserved. commoncore.org
This work is licensed under a Creative Commons Attribution-NonCommercial-ShareAlike 3.0 Unported License.
NYS COMMON CORE MATHEMATICS CURRICULUM 8•5 Lesson 11
7. Use the diagram to answer the questions.
a. Predict which of the figures below has the greater volume. Explain.
b. Use the diagram to find the volume of each and determine which has the larger volume.
8. One of two half spheres formed by a plane through the spheres center is called a hemisphere. What is the formula for the volume of a hemisphere?

Lesson 11: Volume of a Sphere Date: 12/18/13
S.78
© 2013 Common Core, Inc. Some rights reserved. commoncore.org
This work is licensed under a Creative Commons Attribution-NonCommercial-ShareAlike 3.0 Unported License.
NYS COMMON CORE MATHEMATICS CURRICULUM 8•5 Lesson 11
Problem Set
1. Use the diagram to find the volume of the sphere.
Lesson Summary
The formula to find the volume of a sphere is directly related to that of the right circular cylinder. Given a right circular cylinder with radius 𝑟 and height ℎ , which is equal to 2𝑟, a sphere with the same radius 𝑟 has a volume that is exactly two-thirds of the cylinder.
Therefore, the volume of a sphere with radius 𝑟 has a volume given by the formula 𝑉 = 43𝜋𝑟
3.

Lesson 11: Volume of a Sphere Date: 12/18/13
S.79
© 2013 Common Core, Inc. Some rights reserved. commoncore.org
This work is licensed under a Creative Commons Attribution-NonCommercial-ShareAlike 3.0 Unported License.
NYS COMMON CORE MATHEMATICS CURRICULUM 8•5 Lesson 11
2. Determine the volume of a sphere with diameter 9 mm, shown below.
3. Determine the volume of a sphere with diameter 22 in., shown below.
4. Which of the two figures below has the lesser volume?
5. Which of the two figures below has the greater volume?

Lesson 11: Volume of a Sphere Date: 12/18/13
S.80
© 2013 Common Core, Inc. Some rights reserved. commoncore.org
This work is licensed under a Creative Commons Attribution-NonCommercial-ShareAlike 3.0 Unported License.
NYS COMMON CORE MATHEMATICS CURRICULUM 8•5 Lesson 11
6. Bridget wants to determine which ice cream option is the best choice. The chart below gives the description and prices for her options. Use the space below each item to record your findings.
$2.00 $3.00 $4.00
1 scoop in a cup 2 scoops in a cup 3 scoops in a cup
Half a scoop on a cone filled with ice cream
A cup filled with ice cream (level to the top of the cup)
A scoop of ice cream is considered a perfect sphere and has a 2-inch diameter. A cone has a 2-inch diameter and a height of 4.5 inches. A cup is considered a right circular cylinder, has a 3-inch diameter, and a height of 2 inches.
a. Determine the volume of each choice. Use 3.14 to approximate 𝜋.
b. Determine which choice is the best value for her money. Explain your reasoning.