lesson 10: the structure of ratio tables additive and...
TRANSCRIPT

Lesson 10: The Structure of Ratio Tables—Additive and Multiplicative Date: 2/23/15
S.36
© 2014 Common Core, Inc. Some rights reserved. commoncore.org This work is licensed under a Creative Commons Attribution-NonCommercial-ShareAlike 3.0 Unported License.
6•1 Lesson 10 NYS COMMON CORE MATHEMATICS CURRICULUM
Lesson 10: The Structure of Ratio Tables—Additive and
Multiplicative
Classwork
Exploratory Challenge
Imagine that you are making a fruit salad. For every quart of blueberries you add, you would like to put in quarts of
strawberries. Create three ratio tables that show the amounts of blueberries and strawberries you would use if you
needed to make fruit salad for greater numbers of people.
Table 1 should contain amounts where you have added fewer than quarts of blueberries to the salad.
Table 2 should contain amounts of blueberries between and quarts.
Table 3 should contain amounts of blueberries greater than quarts.
Table 1
Quarts of Blueberries Quarts of Strawberries
Table 3
Quarts of Blueberries Quarts of Strawberries
Table 2
Quarts of Blueberries Quarts of Strawberries

Lesson 10: The Structure of Ratio Tables—Additive and Multiplicative Date: 2/23/15
S.37
© 2014 Common Core, Inc. Some rights reserved. commoncore.org This work is licensed under a Creative Commons Attribution-NonCommercial-ShareAlike 3.0 Unported License.
6•1 Lesson 10 NYS COMMON CORE MATHEMATICS CURRICULUM
a. Describe any patterns you see in the tables. Be specific in your descriptions.
b. How are the amounts of blueberries and strawberries related to each other?
c. How are the values in the blueberries column related to each other?
d. How are the values in the strawberries column related to each other?
e. If we know we want to add quarts of blueberries to the fruit salad in Table 1, how can we use the table to
help us determine how many strawberries to add?

Lesson 10: The Structure of Ratio Tables—Additive and Multiplicative Date: 2/23/15
S.38
© 2014 Common Core, Inc. Some rights reserved. commoncore.org This work is licensed under a Creative Commons Attribution-NonCommercial-ShareAlike 3.0 Unported License.
6•1 Lesson 10 NYS COMMON CORE MATHEMATICS CURRICULUM
f. If we know we used quarts of blueberries to make our salad, how can we use a ratio table to find out how
many quarts of strawberries were used?
Exercise 1
The following tables were made incorrectly. Find the mistakes that were made, create the correct ratio table, and state
the ratio that was used to make the correct ratio table.
a.
Hours Pay in Dollars
Ratio ________________ Value ____________
b.
Blue Yellow
Ratio _________________ Value ____________
Hours Pay in Dollars
Blue Yellow

Lesson 10: The Structure of Ratio Tables—Additive and Multiplicative Date: 2/23/15
S.39
© 2014 Common Core, Inc. Some rights reserved. commoncore.org This work is licensed under a Creative Commons Attribution-NonCommercial-ShareAlike 3.0 Unported License.
6•1 Lesson 10 NYS COMMON CORE MATHEMATICS CURRICULUM
Lesson Summary
Ratio tables are constructed in a special way.
Each pair of values in the table will be equivalent to the same ratio.
You can use repeated addition or multiplication to create a ratio table.
There is a constant value that we can multiply the values in the first column by to get the values in the second
column.
red white
3 x 4 12
6 x 4 24
12 x 4 48
21 x 4 84
If you add a certain number to each entry in one column, you may not be able to add that same number to the
entries in the other column and keep the same ratio. Instead, the numbers you add to the entries must be related
to the ratio used to make the table. However, if you multiply the entries in one column by a certain number, you
can multiply the entries in the other column by the same number to create equivalent ratios.

Lesson 10: The Structure of Ratio Tables—Additive and Multiplicative Date: 2/23/15
S.40
© 2014 Common Core, Inc. Some rights reserved. commoncore.org This work is licensed under a Creative Commons Attribution-NonCommercial-ShareAlike 3.0 Unported License.
6•1 Lesson 10 NYS COMMON CORE MATHEMATICS CURRICULUM
Problem Set
1. a. Create a ratio table for making lemonade with a lemon juice-to-water ratio of . Show how much lemon
juice would be needed if you use cups of water to make lemonade.
b. How is the value of the ratio used to create the table?
2. Ryan made a table to show how much blue and red paint he mixed to get the shade of purple he will use to paint
the room. He wants to use the table to help him make larger and smaller batches of purple paint.
Blue Red
a. What ratio was used to create this table? Support your answer.
b. How are the values in each row related to each other?
c. How are the values in each column related to each other?

Lesson 11: Comparing Ratios Using Ratio Tables Date: 2/23/15
S.41
© 2014 Common Core, Inc. Some rights reserved. commoncore.org This work is licensed under a Creative Commons Attribution-NonCommercial-ShareAlike 3.0 Unported License.
6•1 Lesson 11 NYS COMMON CORE MATHEMATICS CURRICULUM
Lesson 11: Comparing Ratios Using Ratio Tables
Classwork
Example 1
Create four equivalent ratios ( by scaling up and by scaling down) using the ratio to .
Write a ratio to describe the relationship shown in the table.
Hours Number of Pizzas Sold Ratio
Exercise 1
The following tables show how many words each person can text in a given amount of time. Compare the rates of
texting for each person using the ratio table.
Michaela
Minutes Words
Jenna
Minutes Words
Maria
Minutes Words

Lesson 11: Comparing Ratios Using Ratio Tables Date: 2/23/15
S.42
© 2014 Common Core, Inc. Some rights reserved. commoncore.org This work is licensed under a Creative Commons Attribution-NonCommercial-ShareAlike 3.0 Unported License.
6•1 Lesson 11 NYS COMMON CORE MATHEMATICS CURRICULUM
Complete the table so that it shows Max has a texting rate of words per minute.
Max
Minutes
Words
Exercise 2: Making Juice (Comparing Juice to Water)
a. The tables below show the comparison of the amount of water to the amount of juice concentrate (JC) in grape
juice made by three different people. Whose juice has the greatest water-to-juice concentrate ratio, and whose
juice would taste strongest? Be sure to justify your answer.
Laredo’s Juice Franca’s Juice Milton’s Juice
Water JC Total Water JC Total Water JC Total
Put the juices in order from the juice containing the most water to the juice containing the least water.
___________________ ____________________ _____________________
Explain how you used the values in the table to determine the order.
What ratio was used to create each table?
Laredo: ___________________________ Franca: ____________________________
Milton: ___________________________

Lesson 11: Comparing Ratios Using Ratio Tables Date: 2/23/15
S.43
© 2014 Common Core, Inc. Some rights reserved. commoncore.org This work is licensed under a Creative Commons Attribution-NonCommercial-ShareAlike 3.0 Unported License.
6•1 Lesson 11 NYS COMMON CORE MATHEMATICS CURRICULUM
Explain how the ratio could help you compare the juices.
b. The next day, each of the three people made juice again, but this time they were making apple juice. Whose juice
has the greatest water-to-juice concentrate ratio, and whose juice would taste the strongest? Be sure to justify
your answer.
Laredo’s Juice Franca’s Juice Milton’s Juice
Water JC Total Water JC Total Water JC Total
Put the juices in order from the strongest apple taste to the weakest apple taste.
___________________ ____________________ _____________________
Explain how you used the values in the table to determine the order.
What ratio was used to create each table?
Laredo: ___________________________ Franca: ____________________________
Milton: ___________________________

Lesson 11: Comparing Ratios Using Ratio Tables Date: 2/23/15
S.44
© 2014 Common Core, Inc. Some rights reserved. commoncore.org This work is licensed under a Creative Commons Attribution-NonCommercial-ShareAlike 3.0 Unported License.
6•1 Lesson 11 NYS COMMON CORE MATHEMATICS CURRICULUM
Explain how the ratio could help you compare the juices.
How was this problem different than the grape juice questions in part (a)?
c. Max and Sheila are making orange juice. Max has mixed cups of water with cups of juice concentrate. Sheila
has made her juice by mixing cups water with cups of juice concentrate. Compare the ratios of juice
concentrate to water using ratio tables. State which beverage has a higher juice concentrate-to-water ratio.
d. Victor is making recipes for smoothies. His first recipe calls for cups of strawberries and cups of other
ingredients. His second recipe says that cups of strawberries are combined with cups of other ingredients.
Which smoothie recipe has more strawberries compared to other ingredients? Use ratio tables to justify your
answer.

Lesson 11: Comparing Ratios Using Ratio Tables Date: 2/23/15
S.45
© 2014 Common Core, Inc. Some rights reserved. commoncore.org This work is licensed under a Creative Commons Attribution-NonCommercial-ShareAlike 3.0 Unported License.
6•1 Lesson 11 NYS COMMON CORE MATHEMATICS CURRICULUM
Problem Set
1. Sarah and Eva were swimming.
a. Use the ratio tables below to determine who the faster swimmer is.
Sarah
Time (min) Distance (meters)
Eva
Time (min) Distance (meters)
b. Explain the method that you used to determine your answer.
2. A lb. person would weigh about lb. on the earth’s moon. A lb. person would weigh lb. on Io, a moon
of Jupiter. Use ratio tables to determine which moon would make a person weigh the most.
Lesson Summary
Ratio tables can be used to compare two ratios.
Look for equal amounts in a row or column to compare the second amount associated with it.
3 6 12 30
7 14 28 70
You can also extend the values of the tables in order to get comparable amounts. Another method would be to
compare the values of the ratios. Write the values of the ratios as fractions and then use your knowledge of
fractions to compare the ratios.
When ratios are given in words, students can create a table of equivalent ratios in order to compare the ratios.
12:35 compared to 8:20
Quantity 1 12 24 36 48
Quantity 2 35 70 105 140
10 25 30 45
16 40 48 72
Quantity 1 8 56
Quantity 2 20 140

Lesson 12: From Ratio Tables to Double Number Line Diagrams Date: 2/19/155/14/14
S.46
© 2014 Common Core, Inc. Some rights reserved. commoncore.org This work is licensed under a Creative Commons Attribution-NonCommercial-ShareAlike 3.0 Unported License.
6•1 Lesson 12 NYS COMMON CORE MATHEMATICS CURRICULUM
Lesson 12: From Ratio Tables to Double Number Line Diagrams
Classwork
Exercise 2
The amount of sugary beverages Americans consume is a leading health concern. For a given brand of cola, a -ounce
serving of cola contains about grams of sugar. Complete the ratio table, using the given ratio to find equivalent
ratios.
Cola (ounces)
Sugar (grams)
Exercise 3
A -liter bottle of cola contains approximately fluid ounces. How many grams of sugar would be in a -liter bottle of
the cola? Explain and show how to arrive at the solution.
Exercise 4
A school cafeteria has a restriction on the amount of sugary drinks available to students. Drinks may not have more than
grams of sugar. Based on this restriction, what is the largest size cola (in ounces) the cafeteria can offer to students?

Lesson 12: From Ratio Tables to Double Number Line Diagrams Date: 2/19/155/14/14
S.47
© 2014 Common Core, Inc. Some rights reserved. commoncore.org This work is licensed under a Creative Commons Attribution-NonCommercial-ShareAlike 3.0 Unported License.
6•1 Lesson 12 NYS COMMON CORE MATHEMATICS CURRICULUM
Exercise 5
Shontelle solves three math problems in four minutes.
a. Use this information to complete the table below.
Number of Questions
Number of Minutes
b. Shontelle has soccer practice on Thursday evening. She has a half hour before practice to work on her math
homework and to talk to her friends. She has math skill-work questions for homework, and she wants to
complete them before talking with her friends. How many minutes will Shontelle have left after completing
her math homework to talk to her friends?
Use a double number line diagram to support your answer, and show all work.

Lesson 12: From Ratio Tables to Double Number Line Diagrams Date: 2/19/155/14/14
S.48
© 2014 Common Core, Inc. Some rights reserved. commoncore.org This work is licensed under a Creative Commons Attribution-NonCommercial-ShareAlike 3.0 Unported License.
6•1 Lesson 12 NYS COMMON CORE MATHEMATICS CURRICULUM
Problem Set
1. While shopping, Kyla found a dress that she would like to purchase, but it costs $ more than she has. Kyla
charges an hour for babysitting. She wants to figure out how many hours she must babysit to earn $ to
buy the dress. Use a double number line to support your answer.
2. Frank has been driving at a constant speed for hours, during which time he traveled miles. Frank would like
to know how long it will take him to complete the remaining miles, assuming he maintains the same constant
speed. Help Frank determine how long the remainder of the trip will take. Include a table or diagram to support
your answer.
Lesson Summary
Double Number Line Diagram: a tool used for understanding the equivalence of two related numbers. It is called
double because each mark on the line has two numbers matched to it. The top row of numbers describes the whole
represented by the line in one way, and the bottom row describes the whole represented by the line in another
way. Because the whole line is the same, it is possible to see the equivalences between the rows of numbers at any
point on the line.

Lesson 13: From Ratio Tables to Equations Using the Value of a Ratio Date: 2/23/15
S.49
© 2014 Common Core, Inc. Some rights reserved. commoncore.org This work is licensed under a Creative Commons Attribution-NonCommercial-ShareAlike 3.0 Unported License.
6•1 Lesson 13 NYS COMMON CORE MATHEMATICS CURRICULUM
Lesson 13: From Ratio Tables to Equations Using the Value of a Ratio
Classwork
Exercise 1
Jorge is mixing a special shade of orange paint. He mixed gallon of red paint with gallons of yellow paint.
Based on this ratio, which of the following statements are true?
of a -gallon mix would be yellow paint. T or F
Every gallon of yellow paint requires gallon of red paint. T or F
Every gallon of red paint requires gallons of yellow paint. T or F
There is gallon of red paint in a -gallon mix of orange paint. T or F
There are gallons of yellow paint in an -gallon mix of orange paint. T or F
Use the space below to determine if each statement is true or false.
Gallons of
Red Paint
Gallons of
Yellow Paint Red:Yellow Red:Total Yellow:Total

Lesson 13: From Ratio Tables to Equations Using the Value of a Ratio Date: 2/23/15
S.50
© 2014 Common Core, Inc. Some rights reserved. commoncore.org This work is licensed under a Creative Commons Attribution-NonCommercial-ShareAlike 3.0 Unported License.
6•1 Lesson 13 NYS COMMON CORE MATHEMATICS CURRICULUM
Exercise 2
Based on the information on red and yellow paint given in Exercise 1, complete the table below.
Exercise 3 – Jorge now plans to mix red paint and blue paint to create purple paint. The color of purple he has decided
to make combines red paint and blue paint in the ratio 4:1. If Jorge can only purchase paint in one gallon containers, construct a ratio table for all possible combinations of red and blue paint that will give Jorge no more than 25 gallons of purple paint.
Blue ( ) Red ( ) Relationship
Red Paint ( ) Yellow Paint ( ) Relationship
a. Write an equation that will let Jorge calculate the
amount of red paint he will need for any given amount
of blue paint.
b. Write an equation that will let Jorge calculate the
amount of blue paint he will need for any given
amount of red paint.
c. If Jorge has 24 gallons of red paint, how much blue paint will he have to use to create the desired color of purple? d. If Jorge has 24 gallons of blue paint, how much red paint will he have to use to create the desired color of purple?
a. If I use 5 gallons of red paint, how many gallons of yellow paint would I need?
b. How is the amount of yellow paint related to the amount of red paint?
c. How would we write this relationship as an equation?
d. What is another way we could write this relationship as an equation?

Lesson 13: From Ratio Tables to Equations Using the Value of a Ratio Date: 2/23/15
S.51
© 2014 Common Core, Inc. Some rights reserved. commoncore.org This work is licensed under a Creative Commons Attribution-NonCommercial-ShareAlike 3.0 Unported License.
6•1 Lesson 13 NYS COMMON CORE MATHEMATICS CURRICULUM
Using the same relationship of red to blue from Exercise 3, create a new table that models the relationship of the three
colors blue, red, and purple (total) paint. Let represent the number of gallons of blue paint, let represent the
number of gallons of red paint, and let represent the total number of gallons of (purple) paint. Then write an
equation that models the relationship between the blue paint and the total paint and answer the questions.
Blue ( ) Red ( ) Total Paint
( )
Exercise 4: During a particular U.S. Air Force training exercise, the ratio of the number of men to the number of women
was . Use the ratio table provided below to create at least two equations that model the relationship between the
number of men and the number of women participating in this training exercise.
Women ( ) Men ( )
If women participated in the training exercise, use one of your equations to calculate the number of men who
participated.
Equations:
e. Write an equation that models the relationship between the blue paint
and the total paint.
f. What is the value of the ratio of total paint to blue paint?
g. How is the value of the ratio related to the equation?
Lesson 13: From Ratio Tables to Equations Using the Value of a Ratio Date: 2/23/15
S.52
© 2014 Common Core, Inc. Some rights reserved. commoncore.org This work is licensed under a Creative Commons Attribution-NonCommercial-ShareAlike 3.0 Unported License.
6•1 Lesson 13 NYS COMMON CORE MATHEMATICS CURRICULUM
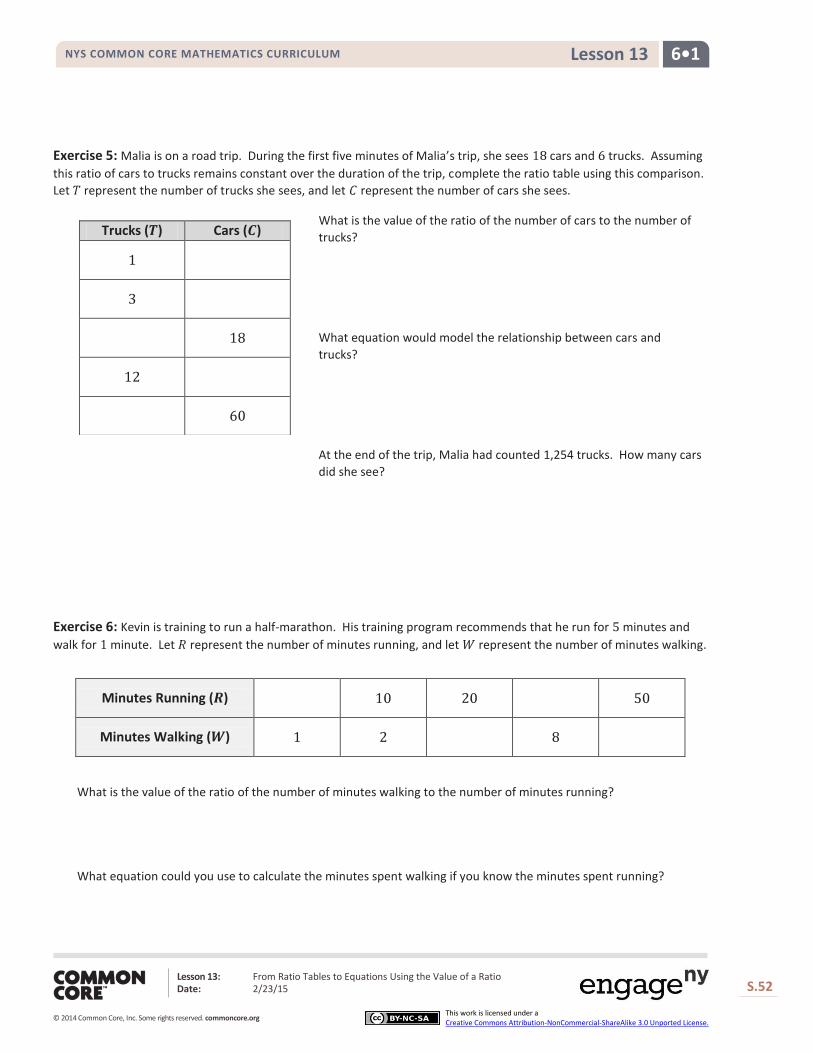
Exercise 5: Malia is on a road trip. During the first five minutes of Malia’s trip, she sees cars and trucks. Assuming
this ratio of cars to trucks remains constant over the duration of the trip, complete the ratio table using this comparison.
Let represent the number of trucks she sees, and let represent the number of cars she sees.
Exercise 6: Kevin is training to run a half-marathon. His training program recommends that he run for minutes and
walk for minute. Let represent the number of minutes running, and let represent the number of minutes walking.
Minutes Running ( )
Minutes Walking ( )
What is the value of the ratio of the number of minutes walking to the number of minutes running?
What equation could you use to calculate the minutes spent walking if you know the minutes spent running?
Trucks ( ) Cars ( )
What is the value of the ratio of the number of cars to the number of
trucks?
What equation would model the relationship between cars and
trucks?
At the end of the trip, Malia had counted 1,254 trucks. How many cars
did she see?

Name Date
From Ratio Tables to Equations Using the Value of a Ratio
Mr. Hockhalter and Ms. Thompson are going to order pizza for their fabulous 6th grade math students but
they are unsure how many pizzas to order.
1 . Complete the table to represent the relationship between the number of students (S) and the number of
slices of pizza (P).
4. Using one of your equations from #3, if your math teacher has 26 students in her class, how many slices of pizza will she need to order for this class? 4. If there are 8 slices in each whole pizza, how many pizzas will she need to order to feed all 3 of her classes?
2. What is the value of the ratio of the number of
students to the number of slices of pizza?
3. Write two equations which would model the
relationship between the number of students and
the number of slices of pizza.
Students (S)
Slices of Pizza (P)
2 6
18
8

Lesson 13: From Ratio Tables to Equations Using the Value of a Ratio Date: 2/23/15
S.53
© 2014 Common Core, Inc. Some rights reserved. commoncore.org This work is licensed under a Creative Commons Attribution-NonCommercial-ShareAlike 3.0 Unported License.
6•1 Lesson 13 NYS COMMON CORE MATHEMATICS CURRICULUM
Problem Set
A cookie recipe calls for cup of white sugar and cups of brown sugar.
Make a table showing the comparison of the amount of white sugar to the amount of brown sugar.
White Sugar ( ) Brown Sugar ( )
1. Write the value of the ratio of the amount of white sugar to the amount of brown sugar.
2. Write an equation that shows the relationship of the amount of white sugar to the amount of brown sugar.
3. Explain how the value of the ratio can be seen in the table.
4. Explain how the value of the ratio can be seen in the equation.
Lesson Summary
The value of a ratio can be determined using a ratio table. This value can be used to write an equation that also
represents the ratio.
Example:
1 4
2 8
3 12
4 16
The multiplication table can be a valuable resource to use in seeing ratios. Different rows can be used to find
equivalent ratios.