lesson 20: stretching and shrinking graphs of functions · lesson 20: stretching and shrinking...
TRANSCRIPT
NYS COMMON CORE MATHEMATICS CURRICULUM M4 Lesson 20
ALGEBRA I
Lesson 20: Stretching and Shrinking Graphs of Functions
218
This work is derived from Eureka Math ™ and licensed by Great Minds. ©2015 Great Minds. eureka-math.org This file derived from ALG I-M4-TE-1.3.0-09.2015
This work is licensed under a Creative Commons Attribution-NonCommercial-ShareAlike 3.0 Unported License.
(−𝟓,𝟑)
Lesson 20: Stretching and Shrinking Graphs of Functions
Student Outcomes
Students recognize and use parent functions for absolute value, quadratic, square root, and cube root to
perform transformations that stretch and shrink the graphs of the functions. They identify the effect on the
graph of 𝑦 = 𝑓(𝑥) when 𝑓(𝑥) is replaced with 𝑘𝑓(𝑥) and 𝑓(𝑘𝑥), for any specified value of 𝑘, positive or
negative, and identify the constant value, 𝑘, given the graphs of the parent functions and the transformed
functions. Students write the formulas for the transformed functions given their graphs.
Lesson Notes
In Lesson 19, students learned how to write the formulas for the graphs of parent functions (including quadratic, square
root, and cube root) that were translated up, down, right, or left by 𝑘 units. In this lesson, students extend what they
learned in Module 3 about how multiplying the parent function by a constant or multiplying the 𝑥-values of the parent
function results in the shrinking or stretching (scaling) of the graph of the parent function and, in some cases, results in
the reflection of the function about the 𝑦- or 𝑥-axis. In this lesson, we will review some of Module 3’s work with
quadratic functions but will focus on cubic, square root, and cube root functions.
Classwork
Opening Exercise (4 minutes)
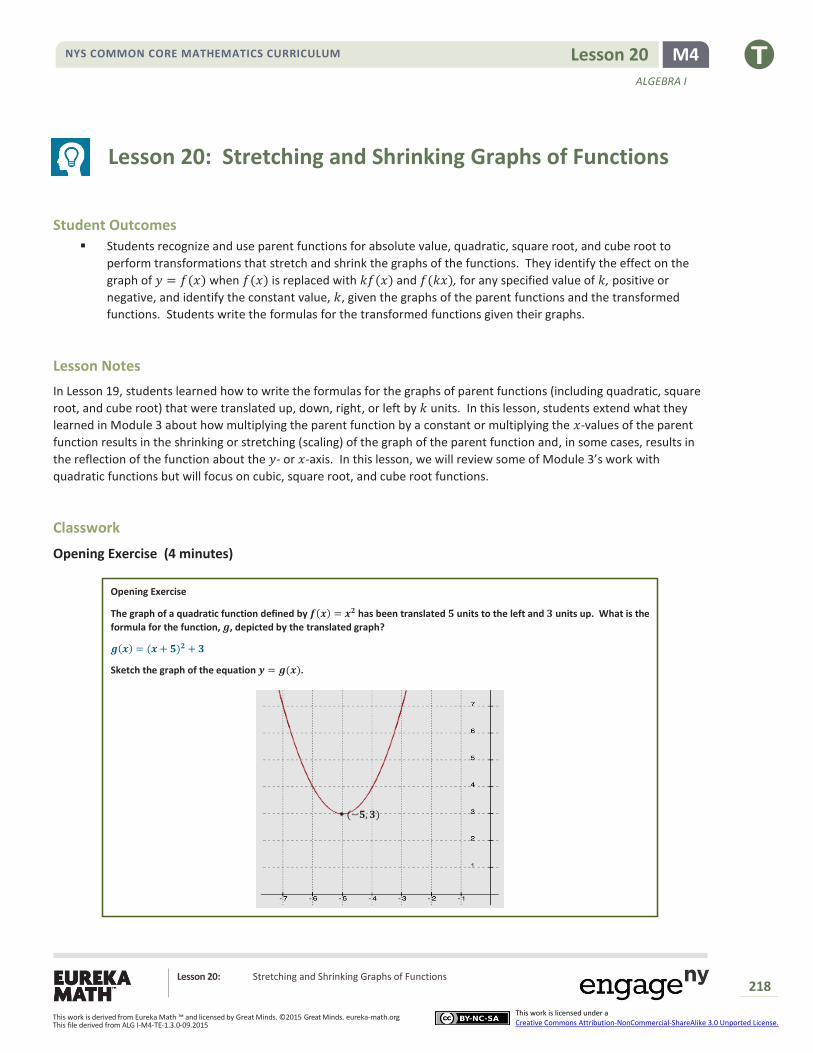
Opening Exercise
The graph of a quadratic function defined by 𝒇(𝒙) = 𝒙𝟐 has been translated 𝟓 units to the left and 𝟑 units up. What is the
formula for the function, 𝒈, depicted by the translated graph?
𝒈(𝒙) = (𝒙 + 𝟓)𝟐 + 𝟑
Sketch the graph of the equation 𝒚 = 𝒈(𝒙).
NYS COMMON CORE MATHEMATICS CURRICULUM M4 Lesson 20
ALGEBRA I
Lesson 20: Stretching and Shrinking Graphs of Functions
219
This work is derived from Eureka Math ™ and licensed by Great Minds. ©2015 Great Minds. eureka-math.org This file derived from ALG I-M4-TE-1.3.0-09.2015
This work is licensed under a Creative Commons Attribution-NonCommercial-ShareAlike 3.0 Unported License.
Example (1 minute)
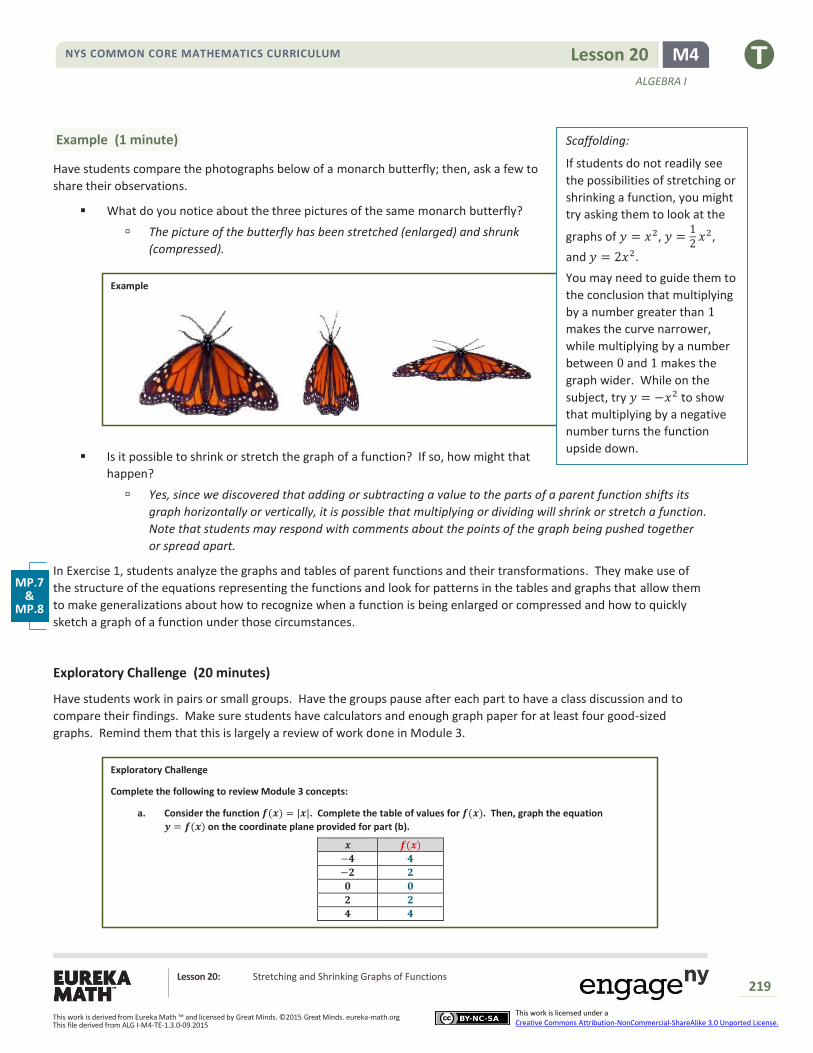
Have students compare the photographs below of a monarch butterfly; then, ask a few to
share their observations.
What do you notice about the three pictures of the same monarch butterfly?
The picture of the butterfly has been stretched (enlarged) and shrunk
(compressed).
Example
Is it possible to shrink or stretch the graph of a function? If so, how might that
happen?
Yes, since we discovered that adding or subtracting a value to the parts of a parent function shifts its
graph horizontally or vertically, it is possible that multiplying or dividing will shrink or stretch a function.
Note that students may respond with comments about the points of the graph being pushed together
or spread apart.
In Exercise 1, students analyze the graphs and tables of parent functions and their transformations. They make use of
the structure of the equations representing the functions and look for patterns in the tables and graphs that allow them
to make generalizations about how to recognize when a function is being enlarged or compressed and how to quickly
sketch a graph of a function under those circumstances.
Exploratory Challenge (20 minutes)
Have students work in pairs or small groups. Have the groups pause after each part to have a class discussion and to
compare their findings. Make sure students have calculators and enough graph paper for at least four good-sized
graphs. Remind them that this is largely a review of work done in Module 3.
Exploratory Challenge
Complete the following to review Module 3 concepts:
a. Consider the function 𝒇(𝒙) = |𝒙|. Complete the table of values for 𝒇(𝒙). Then, graph the equation
𝒚 = 𝒇(𝒙) on the coordinate plane provided for part (b).
𝒙 𝒇(𝒙)
−𝟒 𝟒 −𝟐 𝟐 𝟎 𝟎 𝟐 𝟐 𝟒 𝟒
Scaffolding:
If students do not readily see
the possibilities of stretching or
shrinking a function, you might
try asking them to look at the
graphs of 𝑦 = 𝑥2, 𝑦 =12
𝑥2,
and 𝑦 = 2𝑥2.
You may need to guide them to
the conclusion that multiplying
by a number greater than 1
makes the curve narrower,
while multiplying by a number
between 0 and 1 makes the
graph wider. While on the
subject, try 𝑦 = −𝑥2 to show
that multiplying by a negative
number turns the function
upside down.
MP.7 &
MP.8
NYS COMMON CORE MATHEMATICS CURRICULUM M4 Lesson 20
ALGEBRA I
Lesson 20: Stretching and Shrinking Graphs of Functions
220
This work is derived from Eureka Math ™ and licensed by Great Minds. ©2015 Great Minds. eureka-math.org This file derived from ALG I-M4-TE-1.3.0-09.2015
This work is licensed under a Creative Commons Attribution-NonCommercial-ShareAlike 3.0 Unported License.
𝒚 = 𝒇(𝒙)
𝒚 = 𝒈(𝒙)
𝒚 = 𝒉(𝒙)
𝒚 = 𝒋(𝒙)
𝒚 = 𝒌(𝒙)
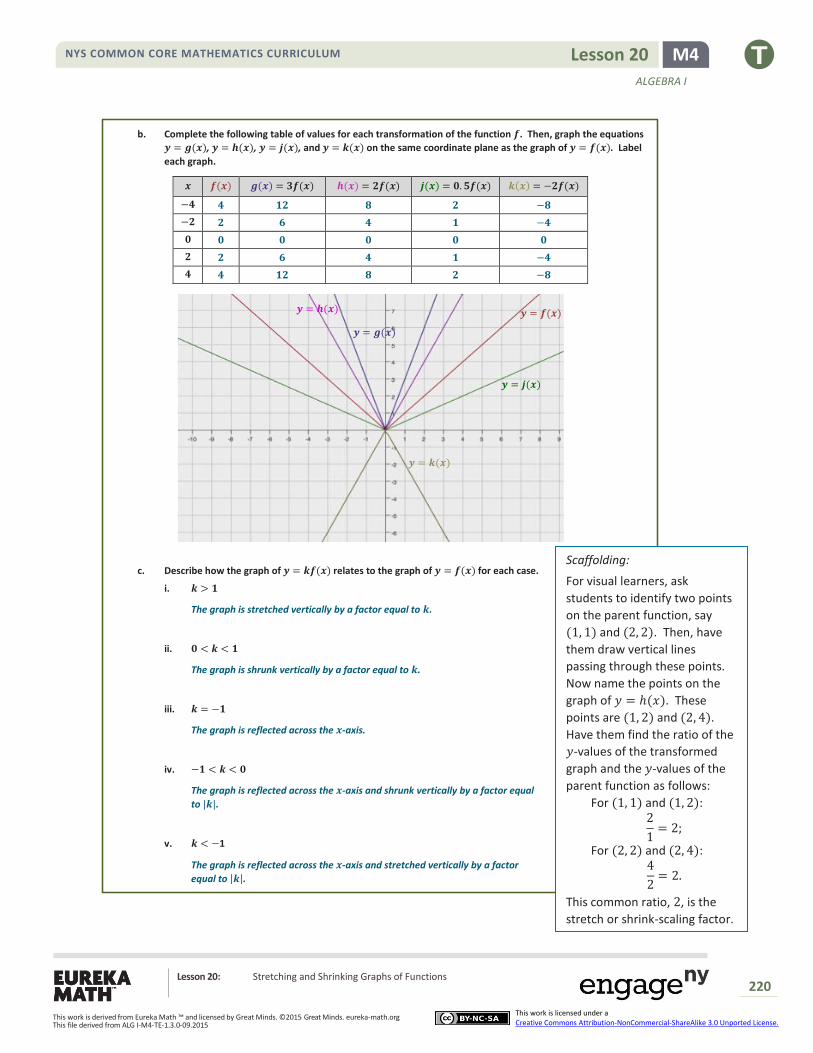
b. Complete the following table of values for each transformation of the function 𝒇. Then, graph the equations
𝒚 = 𝒈(𝒙), 𝒚 = 𝒉(𝒙), 𝒚 = 𝒋(𝒙), and 𝒚 = 𝒌(𝒙) on the same coordinate plane as the graph of 𝒚 = 𝒇(𝒙). Label
each graph.
𝒙 𝒇(𝒙) 𝒈(𝒙) = 𝟑𝒇(𝒙) 𝒉(𝒙) = 𝟐𝒇(𝒙) 𝒋(𝒙) = 𝟎. 𝟓𝒇(𝒙) 𝒌(𝒙) = −𝟐𝒇(𝒙)
−𝟒 𝟒 𝟏𝟐 𝟖 𝟐 −𝟖
−𝟐 𝟐 𝟔 𝟒 𝟏 −𝟒
𝟎 𝟎 𝟎 𝟎 𝟎 𝟎
𝟐 𝟐 𝟔 𝟒 𝟏 −𝟒
𝟒 𝟒 𝟏𝟐 𝟖 𝟐 −𝟖
c. Describe how the graph of 𝒚 = 𝒌𝒇(𝒙) relates to the graph of 𝒚 = 𝒇(𝒙) for each case.
i. 𝒌 > 𝟏
The graph is stretched vertically by a factor equal to 𝒌.
ii. 𝟎 < 𝒌 < 𝟏
The graph is shrunk vertically by a factor equal to 𝒌.
iii. 𝒌 = −𝟏
The graph is reflected across the 𝒙-axis.
iv. −𝟏 < 𝒌 < 𝟎
The graph is reflected across the 𝒙-axis and shrunk vertically by a factor equal
to |𝒌|.
v. 𝒌 < −1
The graph is reflected across the 𝒙-axis and stretched vertically by a factor
equal to |𝒌|.
2
1= 2;
4
2= 2.
Scaffolding:
For visual learners, ask
students to identify two points
on the parent function, say
(1, 1) and (2, 2). Then, have
them draw vertical lines
passing through these points.
Now name the points on the
graph of 𝑦 = ℎ(𝑥). These
points are (1, 2) and (2, 4).
Have them find the ratio of the
𝑦-values of the transformed
graph and the 𝑦-values of the
parent function as follows:
For (1, 1) and (1, 2):
For (2, 2) and (2, 4):
This common ratio, 2, is the
stretch or shrink-scaling factor.
NYS COMMON CORE MATHEMATICS CURRICULUM M4 Lesson 20
ALGEBRA I
Lesson 20: Stretching and Shrinking Graphs of Functions
221
This work is derived from Eureka Math ™ and licensed by Great Minds. ©2015 Great Minds. eureka-math.org This file derived from ALG I-M4-TE-1.3.0-09.2015
This work is licensed under a Creative Commons Attribution-NonCommercial-ShareAlike 3.0 Unported License.
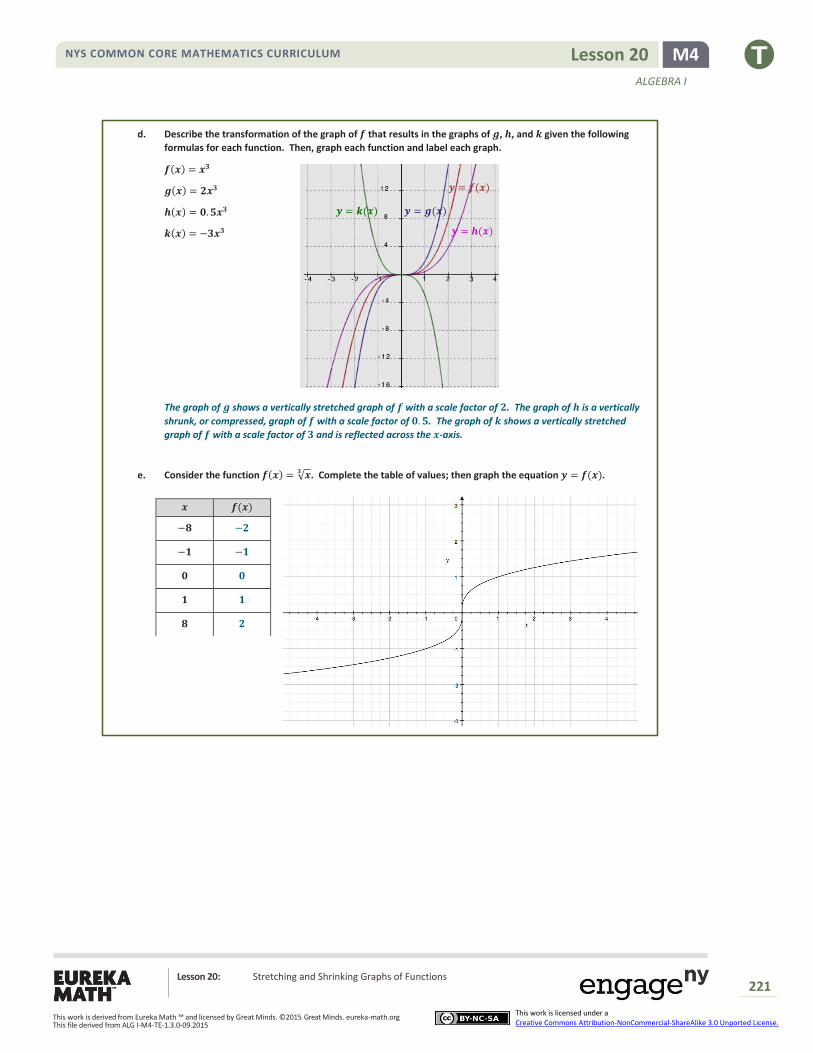
d. Describe the transformation of the graph of 𝒇 that results in the graphs of 𝒈, 𝒉, and 𝒌 given the following
formulas for each function. Then, graph each function and label each graph.
𝒇(𝒙) = 𝒙𝟑
𝒈(𝒙) = 𝟐𝒙𝟑
𝒉(𝒙) = 𝟎. 𝟓𝒙𝟑
𝒌(𝒙) = −𝟑𝒙𝟑
The graph of 𝒈 shows a vertically stretched graph of 𝒇 with a scale factor of 𝟐. The graph of 𝒉 is a vertically
shrunk, or compressed, graph of 𝒇 with a scale factor of 𝟎. 𝟓. The graph of 𝒌 shows a vertically stretched
graph of 𝒇 with a scale factor of 𝟑 and is reflected across the 𝒙-axis.
e. Consider the function 𝒇(𝒙) = √𝒙𝟑 . Complete the table of values; then graph the equation 𝒚 = 𝒇(𝒙).
𝒙 𝒇(𝒙)
−𝟖 −𝟐
−𝟏 −𝟏
𝟎 𝟎
𝟏 𝟏
𝟖 𝟐
𝒚 = 𝒌(𝒙) 𝒚 = 𝒈(𝒙)
𝒚 = 𝒇(𝒙)
𝒚 = 𝒉(𝒙)
NYS COMMON CORE MATHEMATICS CURRICULUM M4 Lesson 20
ALGEBRA I
Lesson 20: Stretching and Shrinking Graphs of Functions
222
This work is derived from Eureka Math ™ and licensed by Great Minds. ©2015 Great Minds. eureka-math.org This file derived from ALG I-M4-TE-1.3.0-09.2015
This work is licensed under a Creative Commons Attribution-NonCommercial-ShareAlike 3.0 Unported License.
𝒚
= 𝒇(𝒙)
𝒚
= 𝒈(𝒙) 𝒚
= 𝒉(𝒙)
𝒚 = 𝒋(𝒙)
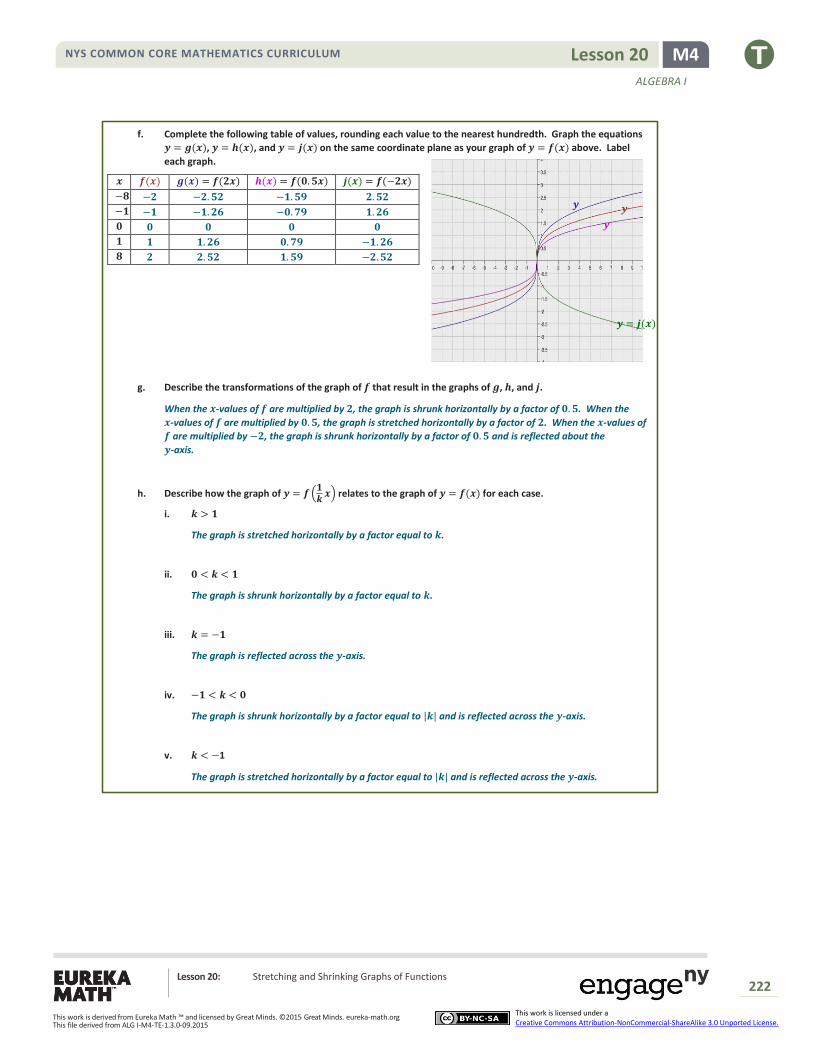
f. Complete the following table of values, rounding each value to the nearest hundredth. Graph the equations
𝒚 = 𝒈(𝒙), 𝒚 = 𝒉(𝒙), and 𝒚 = 𝒋(𝒙) on the same coordinate plane as your graph of 𝒚 = 𝒇(𝒙) above. Label
each graph.
g. Describe the transformations of the graph of 𝒇 that result in the graphs of 𝒈, 𝒉, and 𝒋.
When the 𝒙-values of 𝒇 are multiplied by 𝟐, the graph is shrunk horizontally by a factor of 𝟎. 𝟓. When the
𝒙-values of 𝒇 are multiplied by 𝟎. 𝟓, the graph is stretched horizontally by a factor of 𝟐. When the 𝒙-values of
𝒇 are multiplied by −𝟐, the graph is shrunk horizontally by a factor of 𝟎. 𝟓 and is reflected about the
𝒚-axis.
h. Describe how the graph of 𝒚 = 𝒇 (𝟏𝒌
𝒙) relates to the graph of 𝒚 = 𝒇(𝒙) for each case.
i. 𝒌 > 𝟏
The graph is stretched horizontally by a factor equal to 𝒌.
ii. 𝟎 < 𝒌 < 𝟏
The graph is shrunk horizontally by a factor equal to 𝒌.
iii. 𝒌 = −𝟏
The graph is reflected across the 𝒚-axis.
iv. −𝟏 < 𝒌 < 𝟎
The graph is shrunk horizontally by a factor equal to |𝒌| and is reflected across the 𝒚-axis.
v. 𝒌 < −1
The graph is stretched horizontally by a factor equal to |𝒌| and is reflected across the 𝒚-axis.
𝒙 𝒇(𝒙) 𝒈(𝒙) = 𝒇(𝟐𝒙) 𝒉(𝒙) = 𝒇(𝟎. 𝟓𝒙) 𝒋(𝒙) = 𝒇(−𝟐𝒙)
−𝟖 −𝟐 −𝟐. 𝟓𝟐 −𝟏. 𝟓𝟗 𝟐. 𝟓𝟐
−𝟏 −𝟏 −𝟏. 𝟐𝟔 −𝟎. 𝟕𝟗 𝟏. 𝟐𝟔
𝟎 𝟎 𝟎 𝟎 𝟎
𝟏 𝟏 𝟏. 𝟐𝟔 𝟎. 𝟕𝟗 −𝟏. 𝟐𝟔
𝟖 𝟐 𝟐. 𝟓𝟐 𝟏. 𝟓𝟗 −𝟐. 𝟓𝟐
NYS COMMON CORE MATHEMATICS CURRICULUM M4 Lesson 20
ALGEBRA I
Lesson 20: Stretching and Shrinking Graphs of Functions
223
This work is derived from Eureka Math ™ and licensed by Great Minds. ©2015 Great Minds. eureka-math.org This file derived from ALG I-M4-TE-1.3.0-09.2015
This work is licensed under a Creative Commons Attribution-NonCommercial-ShareAlike 3.0 Unported License.
Is it possible to transform the square root function by a horizontal stretch or shrink using a negative scale
factor? Why or why not?
Yes, it will work for a different limited domain. For example, 𝑓(𝑥) = √𝑥 has all nonnegative numbers
as its domain. However, multiplying the 𝑥-values by −1 gives us 𝑔(𝑥) = √(−𝑥), which is a congruent
graph but with a domain of all numbers less than or equal to 0, and so is a reflection of 𝑓 across the
𝑦-axis.
Exercise 1 (8 minutes)
Work through Exercise 1 as a class, perhaps posting the graphs on the board as you go through the questions.
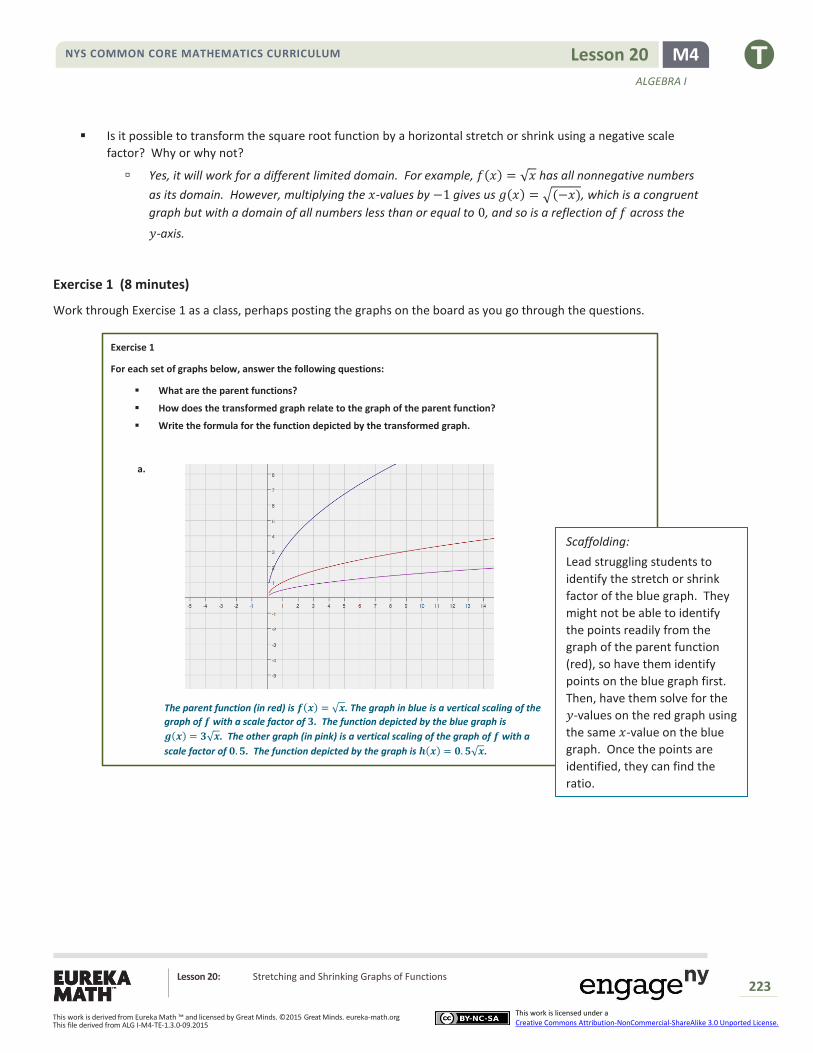
Exercise 1
For each set of graphs below, answer the following questions:
What are the parent functions?
How does the transformed graph relate to the graph of the parent function?
Write the formula for the function depicted by the transformed graph.
a.
The parent function (in red) is 𝒇(𝒙) = √𝒙. The graph in blue is a vertical scaling of the
graph of 𝒇 with a scale factor of 𝟑. The function depicted by the blue graph is
𝒈(𝒙) = 𝟑√𝒙. The other graph (in pink) is a vertical scaling of the graph of 𝒇 with a
scale factor of 𝟎. 𝟓. The function depicted by the graph is 𝒉(𝒙) = 𝟎. 𝟓√𝒙.
Scaffolding:
Lead struggling students to
identify the stretch or shrink
factor of the blue graph. They
might not be able to identify
the points readily from the
graph of the parent function
(red), so have them identify
points on the blue graph first.
Then, have them solve for the
𝑦-values on the red graph using
the same 𝑥-value on the blue
graph. Once the points are
identified, they can find the
ratio.
NYS COMMON CORE MATHEMATICS CURRICULUM M4 Lesson 20
ALGEBRA I
Lesson 20: Stretching and Shrinking Graphs of Functions
224
This work is derived from Eureka Math ™ and licensed by Great Minds. ©2015 Great Minds. eureka-math.org This file derived from ALG I-M4-TE-1.3.0-09.2015
This work is licensed under a Creative Commons Attribution-NonCommercial-ShareAlike 3.0 Unported License.
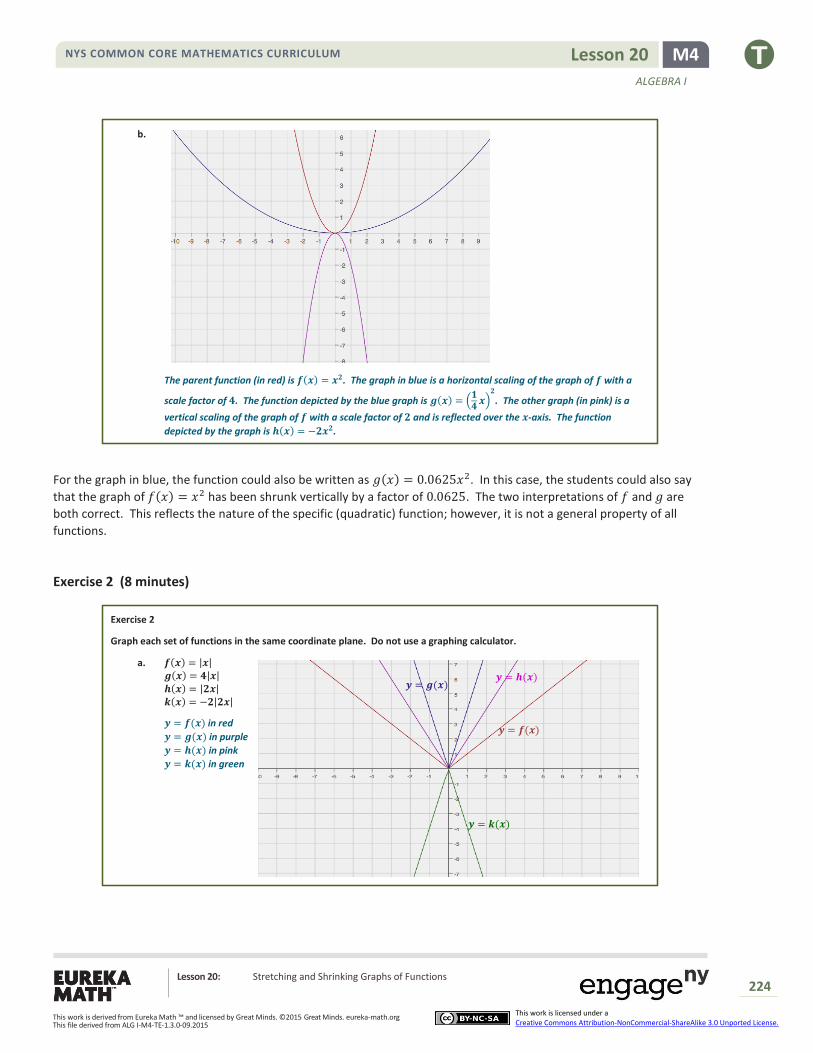
b.
The parent function (in red) is 𝒇(𝒙) = 𝒙𝟐. The graph in blue is a horizontal scaling of the graph of 𝒇 with a
scale factor of 𝟒. The function depicted by the blue graph is 𝒈(𝒙) = (𝟏𝟒
𝒙)𝟐
. The other graph (in pink) is a
vertical scaling of the graph of 𝒇 with a scale factor of 𝟐 and is reflected over the 𝒙-axis. The function
depicted by the graph is 𝒉(𝒙) = −𝟐𝒙𝟐.
For the graph in blue, the function could also be written as 𝑔(𝑥) = 0.0625𝑥2. In this case, the students could also say
that the graph of 𝑓(𝑥) = 𝑥2 has been shrunk vertically by a factor of 0.0625. The two interpretations of 𝑓 and 𝑔 are
both correct. This reflects the nature of the specific (quadratic) function; however, it is not a general property of all
functions.
Exercise 2 (8 minutes)
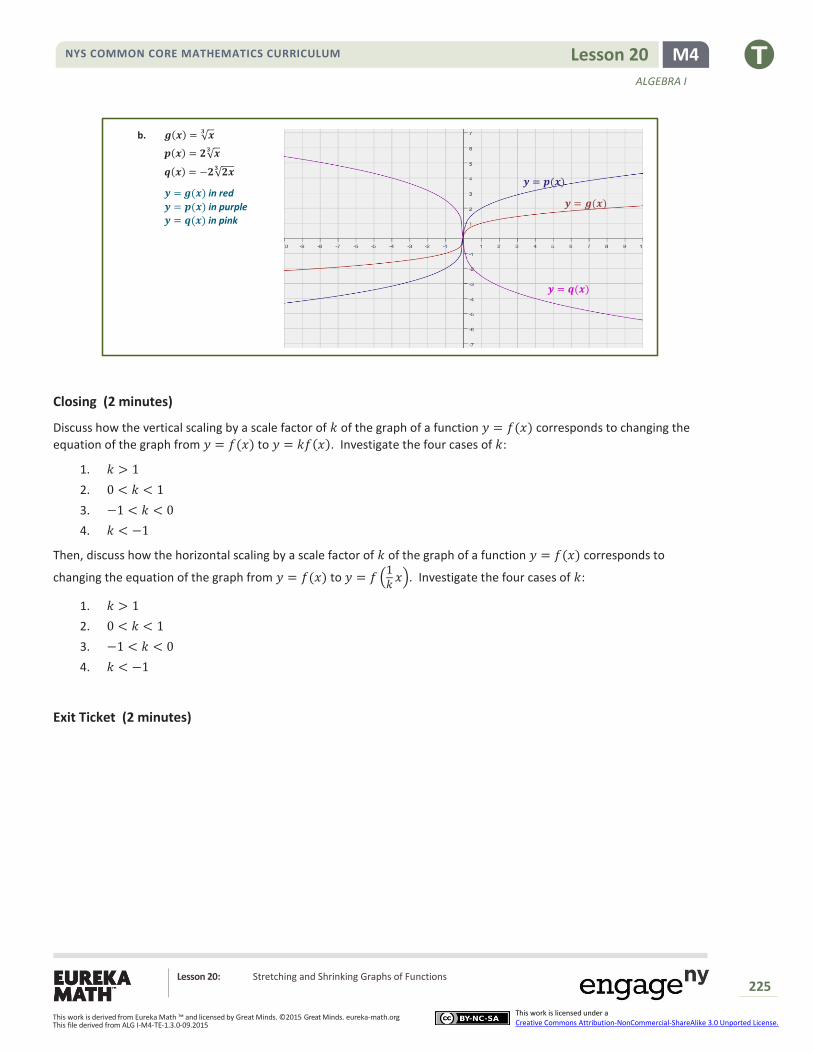
Exercise 2
Graph each set of functions in the same coordinate plane. Do not use a graphing calculator.
a. 𝒇(𝒙) = |𝒙| 𝒈(𝒙) = 𝟒|𝒙| 𝒉(𝒙) = |𝟐𝒙| 𝒌(𝒙) = −𝟐|𝟐𝒙|
𝒚 = 𝒇(𝒙) in red
𝒚 = 𝒈(𝒙) in purple
𝒚 = 𝒉(𝒙) in pink
𝒚 = 𝒌(𝒙) in green
𝒚 = 𝒇(𝒙)
𝒚 = 𝒈(𝒙) 𝒚 = 𝒉(𝒙)
𝒚 = 𝒌(𝒙)
NYS COMMON CORE MATHEMATICS CURRICULUM M4 Lesson 20
ALGEBRA I
Lesson 20: Stretching and Shrinking Graphs of Functions
225
This work is derived from Eureka Math ™ and licensed by Great Minds. ©2015 Great Minds. eureka-math.org This file derived from ALG I-M4-TE-1.3.0-09.2015
This work is licensed under a Creative Commons Attribution-NonCommercial-ShareAlike 3.0 Unported License.
b. 𝒈(𝒙) = √𝒙𝟑
𝒑(𝒙) = 𝟐√𝒙𝟑
𝒒(𝒙) = −𝟐√𝟐𝒙𝟑
𝒚 = 𝒈(𝒙) in red
𝒚 = 𝒑(𝒙) in purple
𝒚 = 𝒒(𝒙) in pink
Closing (2 minutes)
Discuss how the vertical scaling by a scale factor of 𝑘 of the graph of a function 𝑦 = 𝑓(𝑥) corresponds to changing the
equation of the graph from 𝑦 = 𝑓(𝑥) to 𝑦 = 𝑘𝑓(𝑥). Investigate the four cases of 𝑘:
1. 𝑘 > 1
2. 0 < 𝑘 < 1
3. −1 < 𝑘 < 0
4. 𝑘 < −1
Then, discuss how the horizontal scaling by a scale factor of 𝑘 of the graph of a function 𝑦 = 𝑓(𝑥) corresponds to
changing the equation of the graph from 𝑦 = 𝑓(𝑥) to 𝑦 = 𝑓 (1𝑘
𝑥). Investigate the four cases of 𝑘:
1. 𝑘 > 1
2. 0 < 𝑘 < 1
3. −1 < 𝑘 < 0
4. 𝑘 < −1
Exit Ticket (2 minutes)
𝒚 = 𝒈(𝒙)
𝒚 = 𝒑(𝒙)
𝒚 = 𝒒(𝒙)
NYS COMMON CORE MATHEMATICS CURRICULUM M4 Lesson 20
ALGEBRA I
Lesson 20: Stretching and Shrinking Graphs of Functions
226
This work is derived from Eureka Math ™ and licensed by Great Minds. ©2015 Great Minds. eureka-math.org This file derived from ALG I-M4-TE-1.3.0-09.2015
This work is licensed under a Creative Commons Attribution-NonCommercial-ShareAlike 3.0 Unported License.
Name Date
Lesson 20: Stretching and Shrinking Graphs of Functions
Exit Ticket
1. How would the graph of 𝑓(𝑥) = √𝑥 be affected if it were changed to 𝑔(𝑥) = −2√𝑥?
2. Sketch and label the graphs of both 𝑓 and 𝑔 on the grid below.
NYS COMMON CORE MATHEMATICS CURRICULUM M4 Lesson 20
ALGEBRA I
Lesson 20: Stretching and Shrinking Graphs of Functions
227
This work is derived from Eureka Math ™ and licensed by Great Minds. ©2015 Great Minds. eureka-math.org This file derived from ALG I-M4-TE-1.3.0-09.2015
This work is licensed under a Creative Commons Attribution-NonCommercial-ShareAlike 3.0 Unported License.
Exit Ticket Sample Solutions
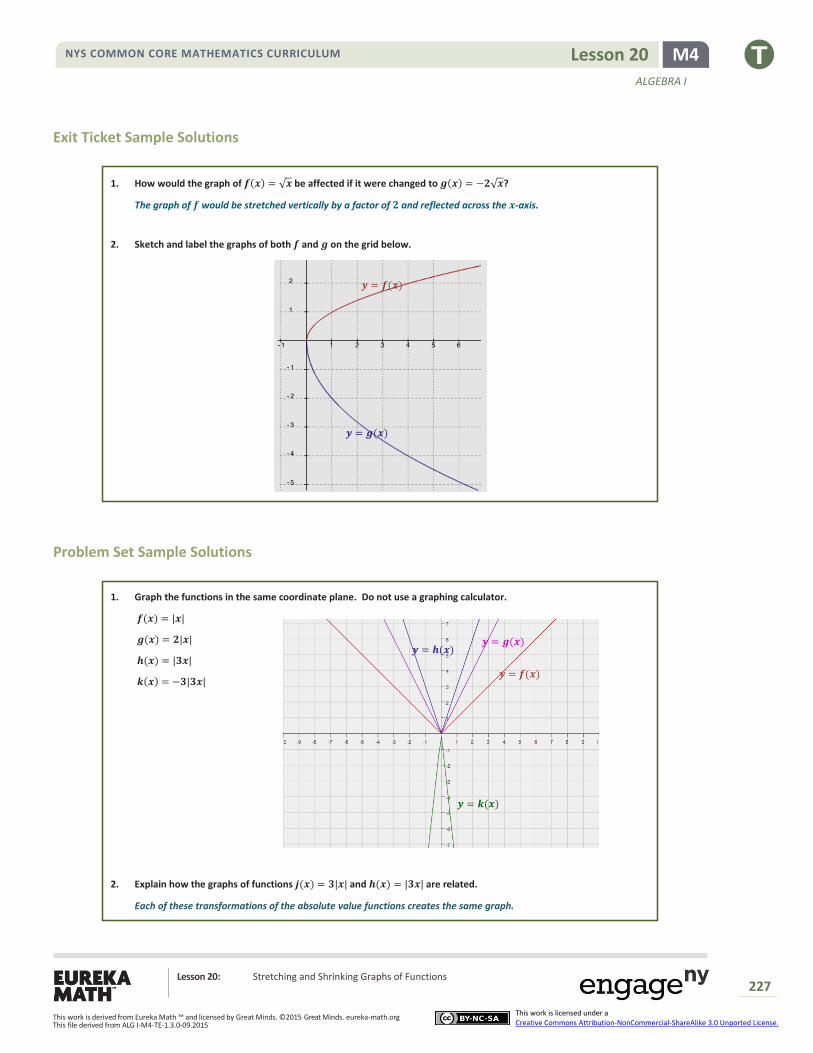
How would the graph of 𝒇(𝒙) = √𝒙 be affected if it were changed to 𝒈(𝒙) = −𝟐√𝒙? 1.
The graph of 𝒇 would be stretched vertically by a factor of 𝟐 and reflected across the 𝒙-axis.
Sketch and label the graphs of both 𝒇 and 𝒈 on the grid below. 2.
Problem Set Sample Solutions
Graph the functions in the same coordinate plane. Do not use a graphing calculator. 1.
𝒇(𝒙) = |𝒙|
𝒈(𝒙) = 𝟐|𝒙|
𝒉(𝒙) = |𝟑𝒙|
𝒌(𝒙) = −𝟑|𝟑𝒙|
Explain how the graphs of functions 𝒋(𝒙) = 𝟑|𝒙| and 𝒉(𝒙) = |𝟑𝒙| are related. 2.
Each of these transformations of the absolute value functions creates the same graph.
𝒚 = 𝒇(𝒙)
𝒚 = 𝒈(𝒙)
𝒚 = 𝒇(𝒙)
𝒚 = 𝒉(𝒙) 𝒚 = 𝒈(𝒙)
𝒚 = 𝒌(𝒙)
NYS COMMON CORE MATHEMATICS CURRICULUM M4 Lesson 20
ALGEBRA I
Lesson 20: Stretching and Shrinking Graphs of Functions
228
This work is derived from Eureka Math ™ and licensed by Great Minds. ©2015 Great Minds. eureka-math.org This file derived from ALG I-M4-TE-1.3.0-09.2015
This work is licensed under a Creative Commons Attribution-NonCommercial-ShareAlike 3.0 Unported License.
𝒚 = 𝒇(𝒙)
𝒚 = 𝒈(𝒙)
Explain how the graphs of functions 𝒒(𝒙) = −𝟑|𝒙| and 𝒓(𝒙) = | − 𝟑𝒙| are related. 3.
The two graphs have the same scaling factor of 𝟑, but they are reflections of each other across the 𝒙-axis.
Multiplying an absolute value by a negative number will reflect it across the 𝒙-axis. However, multiplying by a
negative number INSIDE the absolute value has the same effect as multiplying by a positive number on the outside.
Write a function, 𝒈, in terms of another function, 𝒇, such that the graph of 𝒈 is a vertical shrink of the graph 𝒇 by a 4.
factor of 𝟎. 𝟕𝟓.
𝒈(𝒙) = 𝟎. 𝟕𝟓 𝒇(𝒙)
In Problem 5, students critique the reasoning of each answer, determine which of the two is correct, and provide a
justification for their response.
A teacher wants the students to write a function based on the parent function 𝒇(𝒙) = √𝒙𝟑 . The graph of 𝒇 is 5.
stretched vertically by a factor of 𝟒 and shrunk horizontally by a factor of 𝟏
𝟑. Mike wrote 𝒈(𝒙) = 𝟒√𝟑𝒙
𝟑 as the new
function, while Lucy wrote 𝒉(𝒙) = 𝟑√𝟒𝒙𝟑
. Which one is correct? Justify your answer.
Mike is correct. A vertical stretch by a factor of 𝟒 means multiplying 𝒇(𝒙) by 𝟒, and a horizontal shrink by a factor of 𝟏
𝟑 means that the 𝒙-values of 𝒇(𝒙) must be multiplied by 𝟑.
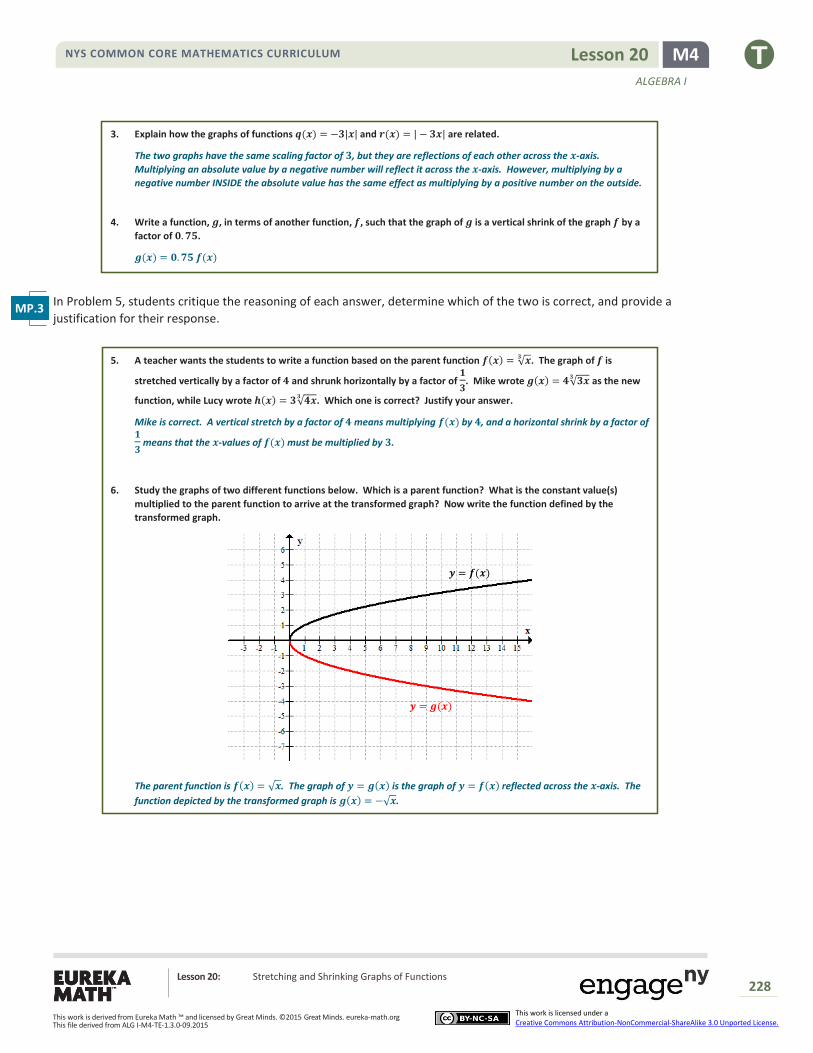
Study the graphs of two different functions below. Which is a parent function? What is the constant value(s) 6.
multiplied to the parent function to arrive at the transformed graph? Now write the function defined by the
transformed graph.
The parent function is 𝒇(𝒙) = √𝒙. The graph of 𝒚 = 𝒈(𝒙) is the graph of 𝒚 = 𝒇(𝒙) reflected across the 𝒙-axis. The
function depicted by the transformed graph is 𝒈(𝒙) = −√𝒙.
MP.3