lesson 4: mapping the deep-ocean...
TRANSCRIPT
65
Section 3: Multibeam SonarSection 3: Multibeam Sonar
The NOAA Ship Okeanos Explorer Education Materials Collection oceanexplorer.noaa.gov
FocusBathymetric mapping
Grade Level7-8 (Physical Science/Earth Science)
Focus QuestionWhat is multibeam sonar, and what are its advantages for ocean exploration?
Learning Objectives• Students will analyze and interpret data from the Okeanos Explorer to explain how
multibeam sonar is used to identify patterns of ocean floor structures, and how multibeam sonar technology extends the measurement and exploration capacity of modern ocean exploration.
Materials• Copies of Making Three-Dimensional Surface Charts using Microsoft Excel™
and Table 1: Bathymetric Survey Data from Kawio Barat Volcano; one copy for each student group
Audio Visual Materials• (Optional) Images of exploration technologies and animations (see Learning
Procedure, Step 1c)
Teaching Time Two or three 45-minute class periods
Seating ArrangementGroups of three to four students
Maximum Number of Students30
Key Words and ConceptsOcean ExplorationOkeanos ExplorerBathymetric mapMultibeam sonar
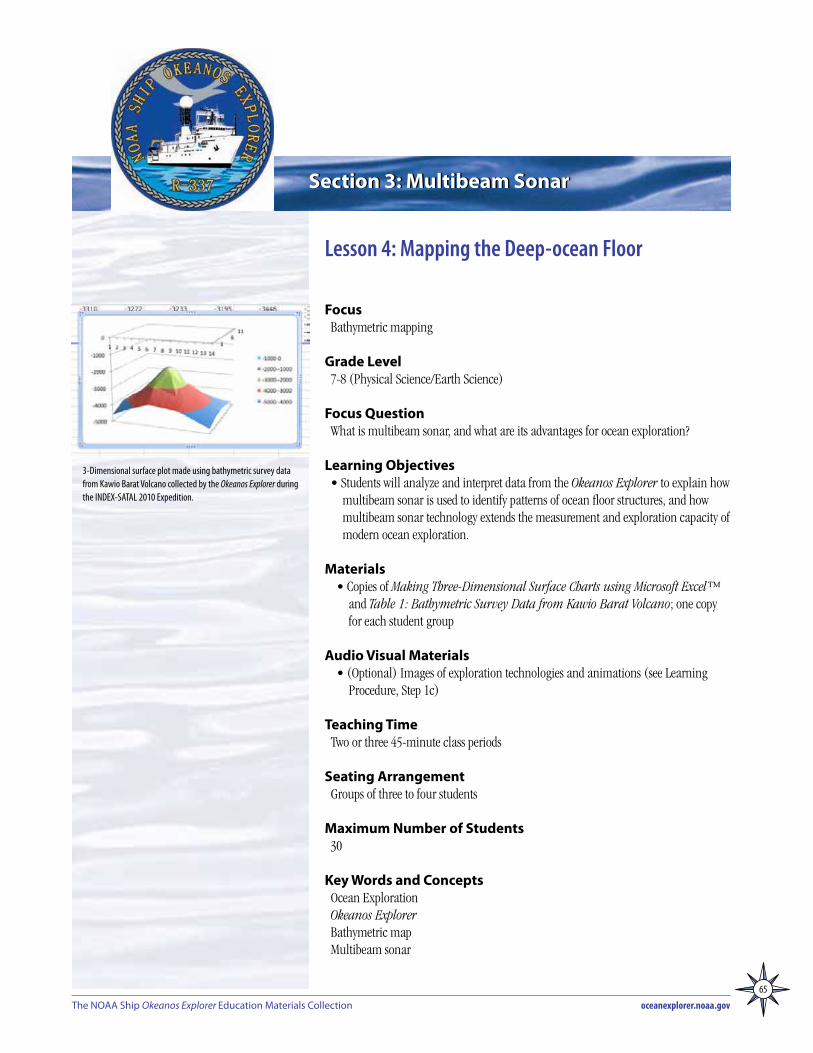
Lesson 4: Mapping the Deep-ocean Floor
3-Dimensional surface plot made using bathymetric survey data from Kawio Barat Volcano collected by the Okeanos Explorer during the INDEX-SATAL 2010 Expedition.

66
Volume 2: How Do We Explore? Multibeam Sonar – Mapping the Deep-ocean Floor (7-8)
The NOAA Ship Okeanos Explorer Education Materials Collectionoceanexplorer.noaa.gov
BackgroundMultibeam sonar is one of the most powerful tools available for modern deep-sea exploration, and can create high-resolution maps, three dimensional models, or even “fly-through” videos that simulate a trip across the area being mapped.
For more information about how multibeam sonar is used aboard the NOAA Ship Okeanos Explorer, please see Introduction to Multibeam Sonar on page 49. In this lesson, students will learn about multibeam sonar and its role in the exploration strategy used aboard the Okeanos Explorer; and use data from the Okeanos Explorer to create a bathymetric map.
Learning ProcedureNOTE: This lesson uses Microsoft Excel™ version 12.2.0. Other versions may require modifications to instructions provided on the student worksheet.
1. To prepare for this lesson:(a) Review:
• Introductory essays for the INDEX-SATAL 2010 Expedition (http://oceanexplorer.noaa.gov/okeanos/explorations/10index/welcome.html);
• Minding the Multibeam at Midnight by Colleen Peters (http://oceanexplorer.noaa.gov/okeanos/explorations/10index/logs/aug05/aug05.html); and
• State of the Art Seafloor Survey by Meme Lobecker and Elaine Stuart (http://oceanexplorer.noaa.gov/okeanos/explorations/10index/logs/july31/july31.html).
(b) Review background information about the Okeanos Explorer exploration strategy and technologies.
(c) If desired, download images to accompany discussions in Step 2. You may also want to download this “before and after” image to illustrate the capabilities of multibeam sonar:
http://oceanexplorer.noaa.gov/okeanos/explorations/10index/back-ground/hires/em302_before_after_hires.jpg,
as well as one or more of the following animations to accompany discussions in Step 3:
http://oceanexplorer.noaa.gov/explorations/02fire/logs/jul08/media/sm2k.html;
http://oceanexplorer.noaa.gov/explorations/02fire/logs/magicmountain; andhttp://oceanexplorer.noaa.gov/okeanos/media/movies/ex_podcast_video.html.
(d) Review Making Three-Dimensional Surface Charts using Microsoft Excel™.
(e) (Optional) Review procedures for viewing multibeam imagery in the Fledermaus file format explained in the Watching in 3D lesson, and decide whether to demonstrate this imagery as part of class discussions.
(f) Ensure that students will have access to Microsoft Excel™ on the computers they will use to complete the chart activity (Step 5) and download the file KawioBaratReduced.xlsx (http://oceanexplorer.noaa.gov/okeanos/edu/resources/media/KawioBaratReduced.xlsx); OR
KawioBaratReduced.xls (http://oceanexplorer.noaa.gov/okeanos/edu/resources/media/KawioBaratReduced.xls) depending upon which version of Microsoft Excel™ students will be using.

67
Volume 2: How Do We Explore? Multibeam Sonar – Mapping the Deep-ocean Floor (7-8)
The NOAA Ship Okeanos Explorer Education Materials Collectionoceanexplorer.noaa.gov
2. Briefly introduce the NOAA Ship Okeanos Explorer and the INDEX-SATAL 2010 Expedition. Briefly discuss why this kind of exploration is important (for background information, please see the lesson, Earth’s Ocean is 95% Unexplored: So What?; http://oceanexplorer.noaa.gov/okeanos/explorations/10index/background/edu/media/so_what.pdf). Highlight the overall exploration strategy used by the Okeanos Explorer, including the following points:
• The overall strategy is based on finding anomalies;• This strategy involves
- Underway reconnaissance;- Water column exploration; and- Site characterization;
• This strategy relies on four key technologies:- Multibeam sonar mapping system;- CTD and other electronic sensors to measure chemical and physical
seawater properties; - A Remotely Operated Vehicle (ROV) capable of obtaining high-quality
imagery and samples in depths as great as 4,000 meters; and- Telepresence technologies that allow people to observe and interact with
events at a remote location. You may want to show some or all of the images in the adjacent sidebar to
accompany this review.
3. Ask students what they know about sonar, and provide additional information as necessary. (See Introduction to Multibeam Sonar on page 49). You may want to show one or more of the video clips referenced in Step 1c.
Describe the role of multibeam sonar in ocean exploration aboard the Okeanos Explorer. Students should realize that this is the key technology for the “reconnaissance” component of the overall exploration strategy, and provides the “big picture” view as explorers look for anomalies. Another important point is that, thanks to telepresence, images from mapping results can be shared in real-time with scientists in Exploration Command Centers, so that these scientists can have input into selecting sites where water column studies and underwater robot dives are to take place.
Briefly discuss other types of bathymetric maps, and how they were made. Before
the invention of sonar, water depths were determined by dropping a weighted line over the side of a ship and measuring the amount of line needed to reach the bottom. These measurement (called soundings) were recorded on nautical charts.
Many nautical charts still in use today are covered with tiny numbers that represent individual soundings, some of which were made many years ago. Sonar made it possible to collect many more depth readings, but until recently these could only be recorded directly beneath a ship. Improvements in electronics and modern computer technologies led to the development of multibeam sonar, which provides three-dimensional images of the seafloor, in much greater detail than older methods. Maps generated by multibeam sonar systems are particularly useful for ocean exploration, since they allow scientists to focus on areas that are geologically interesting or have a high probability of being inhabited by unusual organisms. This image: http://oceanexplorer.noaa.gov/okeanos/explorations/10index/background/hires/em302_before_after_hires.jpg.
Okeanos Explorer crew launch the vehicle during test dives off Hawaii. Image courtesy of NOAA Okeanos Explorer Program, INDEX-SATAL 2010.http://oceanexplorer.noaa.gov/okeanos/explorations/10index/background/hires/launch_hires.jpg
Okeanos Explorer’s EM302 multibeam sonar mapping system produced this detailed image of the Kawio Barat seamount, which rises around 3800 meters from the seafloor. Image courtesy of NOAA Okeanos Explorer Program, INDEX-SATAL 2010.http://oceanexplorer.noaa.gov/okeanos/explorations/10index/logs/hires/june26fig1_hires.jpg
ROV Team Lead, Commanding Officer, and Science Team Lead discuss operations at the Mid-Cayman Rise with participants located at both the Silver Spring ECC, and URI’s Inner Space Center. Image courtesy of NOAA Okeanos Explorer Program, MCR Expedition 2011.http://oceanexplorer.noaa.gov/okeanos/explorations/ex1104/logs/hires/daily_updates_aug9_1_hires.jpg
A CTD is attached to a metal frame called a rosette, or carousel, along with numerous water sampling bottles and when deployed, provides information about the composition of the water column. Image courtesy of NOAA.http://oceanexplorer.noaa.gov/technology/tools/sondectd/sondectd.html

68
Volume 2: How Do We Explore? Multibeam Sonar – Mapping the Deep-ocean Floor (7-8)
The NOAA Ship Okeanos Explorer Education Materials Collectionoceanexplorer.noaa.gov
The EM302 gives us a high resolution “bird’s eye” view of large areas. What we see underwater is similar to what we see around us every day. In the above image, a panorama of mountains and volcanoes sit majestically near a massive river delta surrounded by a soft sand beach. Since what we see here is actually underwater, there are of course no rivers or river deltas, or mountains and sand bars, but seeing these features makes one wonder how an area like this was formed. Image courtesy of NOAA Okeanos Explorer Program, INDEX-SATAL 2010.http://oceanexplorer.noaa.gov/okeanos/explorations/10index/logs/july31/media/seamount_channels.html
shows how much Okeanos Explorer’s EM302 mapping system adds to what we know about seafloor terrain.
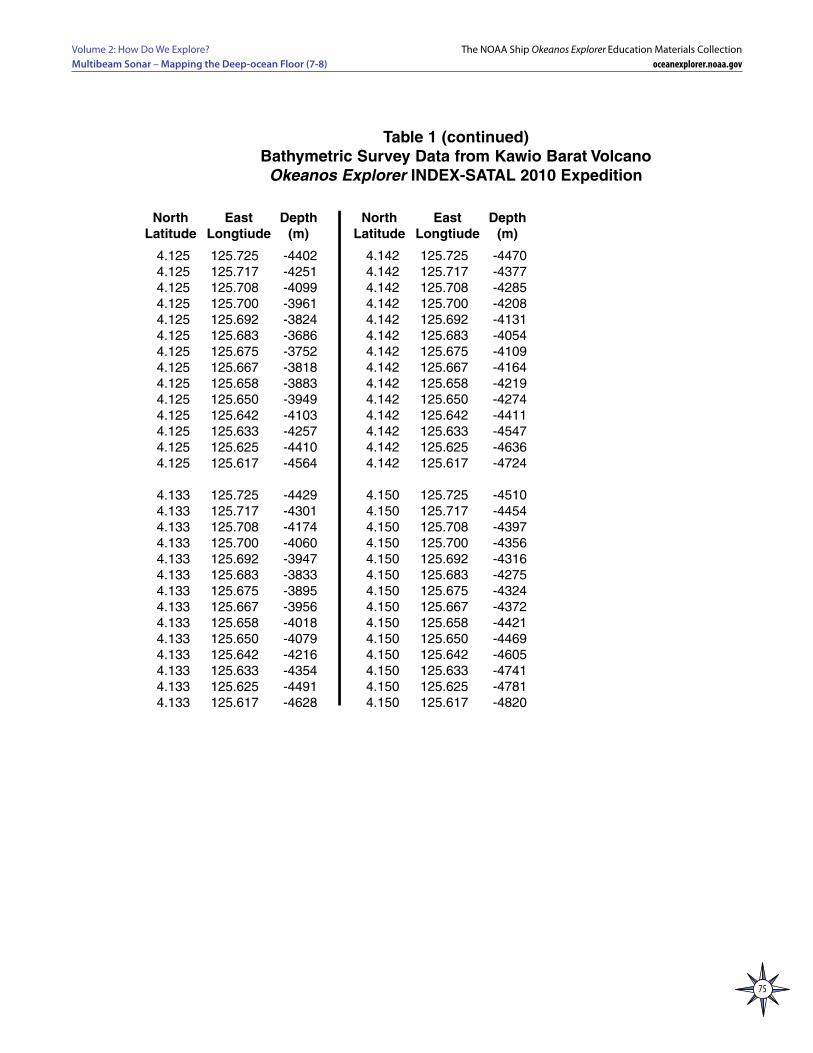
4. Tell students that one of the priorities for the INDEX-SATAL 2010 Expedition was to explore a submarine volcano named Kawio Barat. Say that their assignment is to create a three-dimensional graph called a surface plot using depth data from the Kawio Barat area. Provide each student group with a copy of Making Three-Dimensional Surface Charts using Microsoft Excel™ as well as Table 1: Bathymetric Survey Data from Kawio Barat Volcano. Tell students that these data were collected by the Okeanos Explorer’s multibeam sonar mapping
This “before and after” image provides a glimpse of Okeanos Explorer’s EM302 mapping system capabilities in deep water. The top image shows what we previously knew about the seafloor terrain in the southern Mariana region from satellite altimetry data. The bottom image includes an overlay of the information provided by the ship’s EM302 multibeam system. Image courtesy of NOAA Office of Ocean Exploration and Research.http://oceanexplorer.noaa.gov/okeanos/explorations/10index/background/hires/em302_before_after_hires.jpg

69
Volume 2: How Do We Explore? Multibeam Sonar – Mapping the Deep-ocean Floor (7-8)
The NOAA Ship Okeanos Explorer Education Materials Collectionoceanexplorer.noaa.gov
system during the INDEX-SATAL 2010 Expedition. Be sure students understand that each data point represents the depth of water at the location described by the geographic coordinates. Note that for the purposes of this exercise, we are only using a small sample of all the data collected, which for this site amounts to hundreds of thousands of data points.
When students have completed their surface plots, lead a discussion of their results. Figure 1 shows a typical plot of the data, and the results of several rotations as described on the worksheet. Call students’ attention to, and ask them to explain how these data demonstrate how technologies extend the measurement, exploration, modeling, and computational capacity of scientific investigations. Students should recognize that the data were produced from multibeam sonar technology that greatly extends the capabilities for ocean exploration compared to the capabilities that existed before this technology was available.
Students should also realize that the large number of data points is very difficult to interpret simply by inspecting the table of numbers. In fact, Table 1 only includes 182 data points, while the actual multibeam data file for the Kawio Barat volcano contains thousands of data points. Mathematical analysis technology makes it possible to understand relationships in a large data set, and to have a clear visual image of the geographic structure that the data represents. In this case, the mathematical analysis technology is provided by Microsoft Excel™. Analysis of full datasets produced by multibeam sonar uses an analysis tool called Fledermaus (which is the German word for “bat,” and is pronounced “FLEE-der-mouse”) that provides three-dimensional visualizations from multibeam data. The Watching in 3-D lesson includes a simple analysis of multibeam data using free viewing software for multibeam imagery in the Fledermaus file format.
The BRIDGE Connectionwww.vims.edu/bridge/ – Scroll over “Ocean Science Topics” in the menu on the left side of the page, then “Human Activities,” then click on “Technology” for activities and links about ocean exploration technologies.
The “Me” ConnectionHave students write a first-hand account of their experiences on an exploratory mission to the Kawio Barat volcano, including topographic features revealed by multibeam sonar surveys.
Connections to Other SubjectsEnglish Language Arts, Social Studies, Mathematics
AssessmentClass discussions and students’ work with the charting activity provide opportunities for assessment.
ExtensionsSee the Calling All Explorers lesson for an activity involving maps and GPS technology: http://oceanexplorer.noaa.gov/okeanos/edu/collection/media/wdwe_callingex.pdf.
70
Volume 2: How Do We Explore? Multibeam Sonar – Mapping the Deep-ocean Floor (7-8)
The NOAA Ship Okeanos Explorer Education Materials Collectionoceanexplorer.noaa.gov
Multimedia Discovery Missions http://oceanexplorer.noaa.gov/edu/learning/welcome.html – Click on the links to Lessons 5 and 6 for interactive multimedia presentations and Learning Activities on Chemosynthesis and Hydrothermal Vent Life, and Deep-Sea Benthos.
Other Relevant Lesson Plans from NOAA’s Ocean Exploration ProgramEarth’s Ocean is 95% Unexplored: So What?
(from the INDEX-SATAL 2010 Expedition)http://oceanexplorer.noaa.gov/okeanos/explorations/10index/background/edu/
media/so_what.pdfFocus: Importance of deep-ocean exploration (Grades 5-6; Life Science/Earth Science)
Students describe at least three different deep-ocean ecosystems; explain at least three reasons for exploring Earth’s deep ocean; explain at least three ways that deep-ocean ecosystems may benefit humans; and create a wall magazine to communicate scientific ideas.
Sonar Simulation (from the Cradle of the Earthquake: Exploring the Underwater San Andreas Fault
2010 Expedition)http://oceanexplorer.noaa.gov/explorations/10sanandreas/background/edu/
media/sonarsim78.pdfFocus: Side-scan sonar (Grades 7-8; Earth Science/Physical Science)
Students describe side-scan sonar; compare and contrast side-scan sonar with other methods used to search for underwater objects; and make inferences about the topography of an unknown and invisible landscape based on systematic discontinuous measurements of surface relief.
Mapping the Deep Ocean (from the INSPIRE: Chile Margin 2010 expedition)http://oceanexplorer.noaa.gov/explorations/10chile/background/edu/media/
mapping.pdfFocus: Bathymetric Mapping (Grades 7-8; Physical Science/Earth Science)
Students create a two-dimensional topographic map from bathymetric survey data; create a three-dimensional model of seafloor topography from a two-dimensional topographic map; and interpret two- and three-dimensional topographic data.
How Does Your Magma Grow? (from the 2005 GalAPAGos: Where Ridge Meets Hotspot Expedition)http://oceanexplorer.noaa.gov/explorations/05galapagos/background/edu/
media/05galapagos_magma.pdfFocus: Hot spots and mid-ocean ridges (Grades 7-8; Physical Science)
Students identify types of plate boundaries associated with movement of the Earth’s tectonic plates; compare and contrast volcanic activity associated with spreading centers and hot spots; describe processes which resulted in the formation of the Galapagos Islands; and describe processes that produce hydrothermal vents.

71
Volume 2: How Do We Explore? Multibeam Sonar – Mapping the Deep-ocean Floor (7-8)
The NOAA Ship Okeanos Explorer Education Materials Collectionoceanexplorer.noaa.gov
Sound Pictures (from the Cradle of the Earthquake: Exploring the Underwater San Andreas Fault
2010 Expedition)http://oceanexplorer.noaa.gov/explorations/10sanandreas/background/edu/
media/soundpics912.pdfFocus: Sonar (Grades 9-12; Physical Science)
Students explain the concept of sonar, describe the major components of a sonar system; explain how multibeam and side-scan sonar systems are useful to ocean explorers; and simulate sonar operation using a motion detector and a graphing calculator.
Next Generation Science StandardsLesson plans developed for Volume 2 are correlated with Ocean Literacy Essential Principles and Fundamental Concepts as indicated in the back of this book. Additionally, a separate online document illustrates individual lesson support for the Performance Expectations and three dimensions of the Next Generation Science Standards and associated Common Core State Standards for Mathematics and for English Language Arts & Literacy. This information is provided to educators as a context or point of departure for addressing particular standards and does not necessarily mean that any lesson fully develops a particular standard, principle or concept. Please see: http://oceanexplorer.noaa.gov/okeanos/edu/collection/hdwe_ngss.pdf
Send Us Your FeedbackWe value your feedback on this lesson, including how you use it in your formal/informal education settings.Please send your comments to: [email protected]
For More InformationPaula Keener, Director, Education ProgramsNOAA Office of Ocean Exploration and ResearchHollings Marine Laboratory331 Fort Johnson Road, Charleston SC 29412843.762.8818 843.762.8737 (fax)[email protected]
AcknowledgmentsProduced by Mel Goodwin, PhD, Marine Biologist and Science Writer, Charleston, SC. Design/layout: Coastal Images Graphic Design, Charleston, SC. If reproducing this lesson, please cite NOAA as the source, and provide the following URL: http://oceanexplorer.noaa.gov
72
Volume 2: How Do We Explore? Multibeam Sonar – Mapping the Deep-ocean Floor (7-8)
The NOAA Ship Okeanos Explorer Education Materials Collectionoceanexplorer.noaa.gov
Making Three-Dimensional Surface Charts using Microsoft Excel™
NOTE: The following instructions are written for Microsoft Excel™ version 12.2.0. Other versions may require modifications to these instructions. If you are using Office 2003 or an older version of Office, you may need to use the Office Compatibility Pack, which can be downloaded from: http://www.microsoft.com/download/en/details.aspx?displaylang=en&id=3.
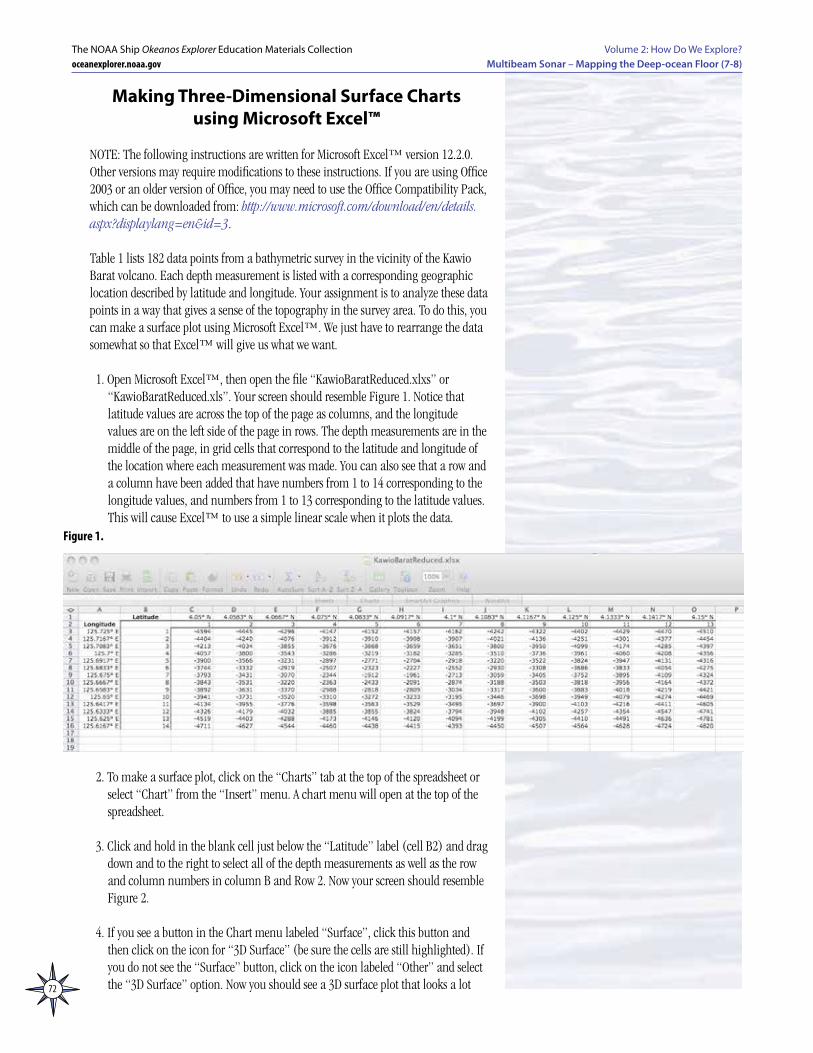
Table 1 lists 182 data points from a bathymetric survey in the vicinity of the Kawio Barat volcano. Each depth measurement is listed with a corresponding geographic location described by latitude and longitude. Your assignment is to analyze these data points in a way that gives a sense of the topography in the survey area. To do this, you can make a surface plot using Microsoft Excel™. We just have to rearrange the data somewhat so that Excel™ will give us what we want.
1. Open Microsoft Excel™, then open the file “KawioBaratReduced.xlxs” or “KawioBaratReduced.xls”. Your screen should resemble Figure 1. Notice that latitude values are across the top of the page as columns, and the longitude values are on the left side of the page in rows. The depth measurements are in the middle of the page, in grid cells that correspond to the latitude and longitude of the location where each measurement was made. You can also see that a row and a column have been added that have numbers from 1 to 14 corresponding to the longitude values, and numbers from 1 to 13 corresponding to the latitude values. This will cause Excel™ to use a simple linear scale when it plots the data.
2. To make a surface plot, click on the “Charts” tab at the top of the spreadsheet or select “Chart” from the “Insert” menu. A chart menu will open at the top of the spreadsheet.
3. Click and hold in the blank cell just below the “Latitude” label (cell B2) and drag down and to the right to select all of the depth measurements as well as the row and column numbers in column B and Row 2. Now your screen should resemble Figure 2.
4. If you see a button in the Chart menu labeled “Surface”, click this button and then click on the icon for “3D Surface” (be sure the cells are still highlighted). If you do not see the “Surface” button, click on the icon labeled “Other” and select the “3D Surface” option. Now you should see a 3D surface plot that looks a lot
Figure 1.
73
Volume 2: How Do We Explore? Multibeam Sonar – Mapping the Deep-ocean Floor (7-8)
The NOAA Ship Okeanos Explorer Education Materials Collectionoceanexplorer.noaa.gov
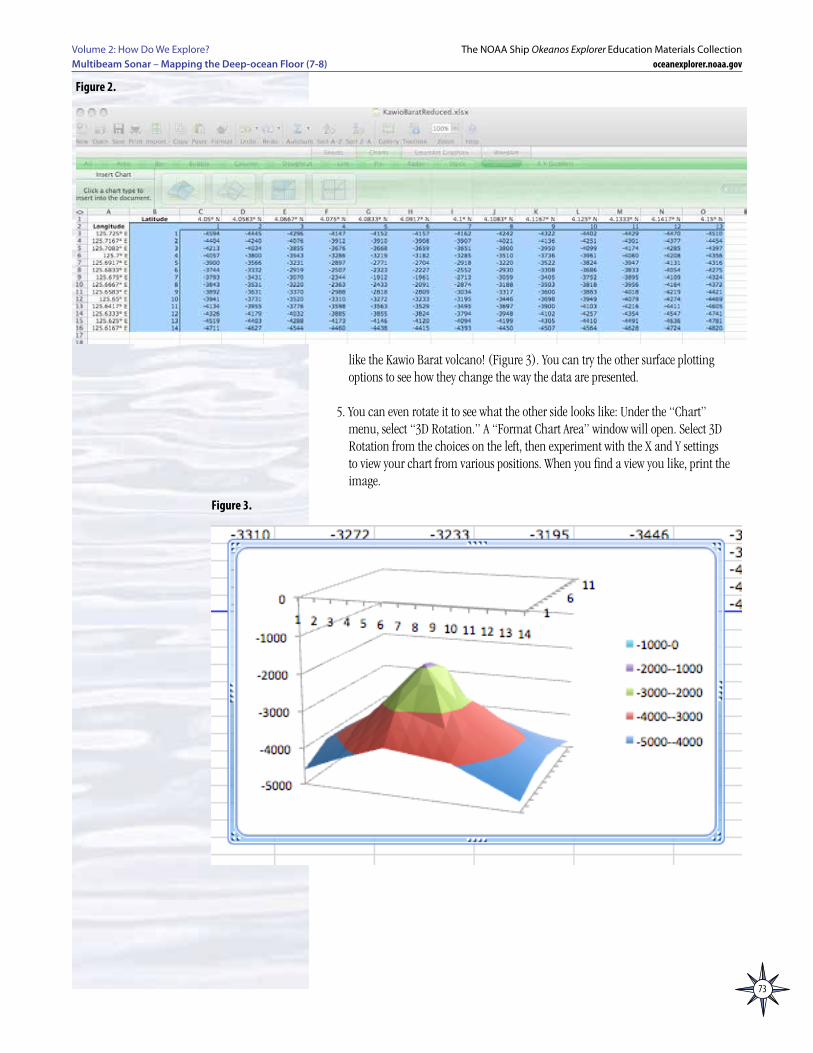
like the Kawio Barat volcano! (Figure 3). You can try the other surface plotting options to see how they change the way the data are presented.
5. You can even rotate it to see what the other side looks like: Under the “Chart” menu, select “3D Rotation.” A “Format Chart Area” window will open. Select 3D Rotation from the choices on the left, then experiment with the X and Y settings to view your chart from various positions. When you find a view you like, print the image.
Figure 3.
Figure 2.

74
Volume 2: How Do We Explore? Multibeam Sonar – Mapping the Deep-ocean Floor (7-8)
The NOAA Ship Okeanos Explorer Education Materials Collectionoceanexplorer.noaa.gov
4.050 125.725 -45944.050 125.717 -44044.050 125.708 -42134.050 125.700 -40574.050 125.692 -39004.050 125.683 -37444.050 125.675 -37934.050 125.667 -38434.050 125.658 -38924.050 125.650 -39414.050 125.642 -41344.050 125.633 -43264.050 125.625 -45194.050 125.617 -4711
4.058 125.725 -44454.058 125.717 -42404.058 125.708 -40344.058 125.700 -38004.058 125.692 -35664.058 125.683 -33324.058 125.675 -34314.058 125.667 -35314.058 125.658 -36314.058 125.650 -37314.058 125.642 -39554.058 125.633 -41794.058 125.625 -44034.058 125.617 -4627
4.067 125.725 -42964.067 125.717 -40764.067 125.708 -38554.067 125.700 -35434.067 125.692 -32314.067 125.683 -29194.067 125.675 -30704.067 125.667 -32204.067 125.658 -33704.067 125.650 -35204.067 125.642 -37764.067 125.633 -40324.067 125.625 -42884.067 125.617 -4544
4.075 125.725 -41474.075 125.717 -39124.075 125.708 -36764.075 125.700 -32864.075 125.692 -28974.075 125.683 -25074.075 125.675 -23444.075 125.667 -23634.075 125.658 -29884.075 125.650 -33104.075 125.642 -35984.075 125.633 -38854.075 125.625 -41734.075 125.617 -4460
4.083 125.725 -41524.083 125.717 -39104.083 125.708 -36684.083 125.700 -32194.083 125.692 -27714.083 125.683 -23234.083 125.675 -19124.083 125.667 -24334.083 125.658 -28184.083 125.650 -32724.083 125.642 -35634.083 125.633 -38554.083 125.625 -41464.083 125.617 -4438
4.092 125.725 -41574.092 125.717 -39084.092 125.708 -36594.092 125.700 -31824.092 125.692 -27044.092 125.683 -22274.092 125.675 -19614.092 125.667 -20914.092 125.658 -28094.092 125.650 -32334.092 125.642 -35294.092 125.633 -38244.092 125.625 -41204.092 125.617 -4415
4.100 125.725 -41624.100 125.717 -39074.100 125.708 -36514.100 125.700 -32854.100 125.692 -29184.100 125.683 -25524.100 125.675 -27134.100 125.667 -28744.100 125.658 -30344.100 125.650 -31954.100 125.642 -34954.100 125.633 -37944.100 125.625 -40944.100 125.617 -4393
4.108 125.725 -42424.108 125.717 -40214.108 125.708 -38004.108 125.700 -35104.108 125.692 -32204.108 125.683 -29304.108 125.675 -30594.108 125.667 -31884.108 125.658 -33174.108 125.650 -34464.108 125.642 -36974.108 125.633 -39484.108 125.625 -41994.108 125.617 -4450
4.117 125.725 -43224.117 125.717 -41364.117 125.708 -39504.117 125.700 -37364.117 125.692 -35224.117 125.683 -33084.117 125.675 -34054.117 125.667 -35034.117 125.658 -36004.117 125.650 -36984.117 125.642 -39004.117 125.633 -41024.117 125.625 -43054.117 125.617 -4507
Table 1Bathymetric Survey Data from Kawio Barat Volcano
Okeanos Explorer INDEX-SATAL 2010 Expedition
North East DepthLatitude Longtiude (m)
North East DepthLatitude Longtiude (m)
North East DepthLatitude Longtiude (m)
75
Volume 2: How Do We Explore? Multibeam Sonar – Mapping the Deep-ocean Floor (7-8)
The NOAA Ship Okeanos Explorer Education Materials Collectionoceanexplorer.noaa.gov
4.125 125.725 -44024.125 125.717 -42514.125 125.708 -40994.125 125.700 -39614.125 125.692 -38244.125 125.683 -36864.125 125.675 -37524.125 125.667 -38184.125 125.658 -38834.125 125.650 -39494.125 125.642 -41034.125 125.633 -42574.125 125.625 -44104.125 125.617 -4564
4.133 125.725 -44294.133 125.717 -43014.133 125.708 -41744.133 125.700 -40604.133 125.692 -39474.133 125.683 -38334.133 125.675 -38954.133 125.667 -39564.133 125.658 -40184.133 125.650 -40794.133 125.642 -42164.133 125.633 -43544.133 125.625 -44914.133 125.617 -4628
4.142 125.725 -44704.142 125.717 -43774.142 125.708 -42854.142 125.700 -42084.142 125.692 -41314.142 125.683 -40544.142 125.675 -41094.142 125.667 -41644.142 125.658 -42194.142 125.650 -42744.142 125.642 -44114.142 125.633 -45474.142 125.625 -46364.142 125.617 -4724
4.150 125.725 -45104.150 125.717 -44544.150 125.708 -43974.150 125.700 -43564.150 125.692 -43164.150 125.683 -42754.150 125.675 -43244.150 125.667 -43724.150 125.658 -44214.150 125.650 -44694.150 125.642 -46054.150 125.633 -47414.150 125.625 -47814.150 125.617 -4820
Table 1 (continued)Bathymetric Survey Data from Kawio Barat Volcano
Okeanos Explorer INDEX-SATAL 2010 Expedition
North East DepthLatitude Longtiude (m)
North East DepthLatitude Longtiude (m)

76
Notes: