lesson question
TRANSCRIPT

© Edgenuity, Inc. 1
Warm-Up Interpreting Clusters and Outliers
Lesson Question
?
Lesson Goals
Interpret clusters and outliersin scatterplots.
Identify clusters and
in scatterplots.
Identify outliers in a
set.
Words to Know
Write the letter of the definition next to the matching word as you work through the lesson. You may use the glossary to help you.
cluster A. a value in a data set that varies significantly from the rest of the data
scatterplot B. to examine; to study carefully and in detail
analyze C. a graph where two sets of data are plotted as points so that relationships between the data can be visualized
outlier D. a group of data points that are together
WK2

© Edgenuity, Inc. 2
Warm-Up Interpreting Clusters and Outliers
Recognizing Relationships with Scatterplots
• The scatterplot compares the score on homework with the score on a test.
• Are the variables related?
As homework scores ,
test scores also increased.20
40
60
80
100
20 60 8040 100
Test
Sco
res
Homework Scores
x
y

© Edgenuity, Inc. 3
Instruction
2Slide
Interpreting Clusters and Outliers
Defining Clusters
A cluster is a of data points that are together.
Graphs with clusters:
x
y
x
y
They’re all grouped together in both of these graphs.
Data points that are in clusters tend to indicate that the variables are related.
Graphs without clusters:
x
y
x
y
The data points are just scattered about.
Graphs without clusters tend to indicate that there is no relationship between the variables.

© Edgenuity, Inc. 4
Instruction Interpreting Clusters and Outliers
4Slide
Clusters Formed from Data Grouped Together
• Is there a pattern of data points grouped together in the scatterplot?
, all the data is clustered fairly
close together.
• Is there a relationship between the amount of time in an experiment and the number of bacteria that have grown?
Yes, there is a
between the variables.
It appears that as time goes on, the amount of bacteria increases.N
umbe
r of
Bac
teri
a
Time
x
y
Analysis of a Scatterplot
• Does the scatterplot have a cluster?
, the data points are spread all
over with no grouping together at all.
• Is there a relationship between the population of a city and the amount of rainfall?
There is relationship between
the amount of rainfall that a city receives and the population of that city.
Am
ount
of R
ainf
all
Population of a City
x
y

© Edgenuity, Inc. 5
Instruction Interpreting Clusters and Outliers
7Slide
Outliers in a Scatterplot
An outlier is a value in a data set that significantly from the rest of the data.
Outliers represent values.
Are there outliers in this graph?
Number of Cashiers
Sal
es (d
olla
rs)
x
y
1 72 3 4 5 6 8 9
20
40
60
80
100
; when the number of cashiers is high, 8, but the sales are low, $20.

© Edgenuity, Inc. 6
Instruction Interpreting Clusters and Outliers
9Slide
12
Outliers in a Table
Are there any outliers?
, where four home runs were
hit total, but the winning team scored a total of 13 runs.
This is an unusual or event
when compared with the rest of the data.
This point then is an .
Total Home Runs in Baseball
Game, x
Final Score of Winning
Team, y
1 32 32 43 54 136 76 87 6
Impact of Outliers
• Outliers do not represent the data set as well as points located in a
.
• Outliers are often extreme values
that occur .
• How would you interpret this cluster?
Test scores tend to increase as the number of hours slept
.
Circle the outliers in the scatterplot.
Sco
re o
n Te
st (p
erce
nt)
Amount of Sleep on Nightbefore Test (hours)
x
y
2 4 8
20
40
80
60
100
6 10
© Edgenuity, Inc. 7
Instruction Interpreting Clusters and Outliers
14Slide
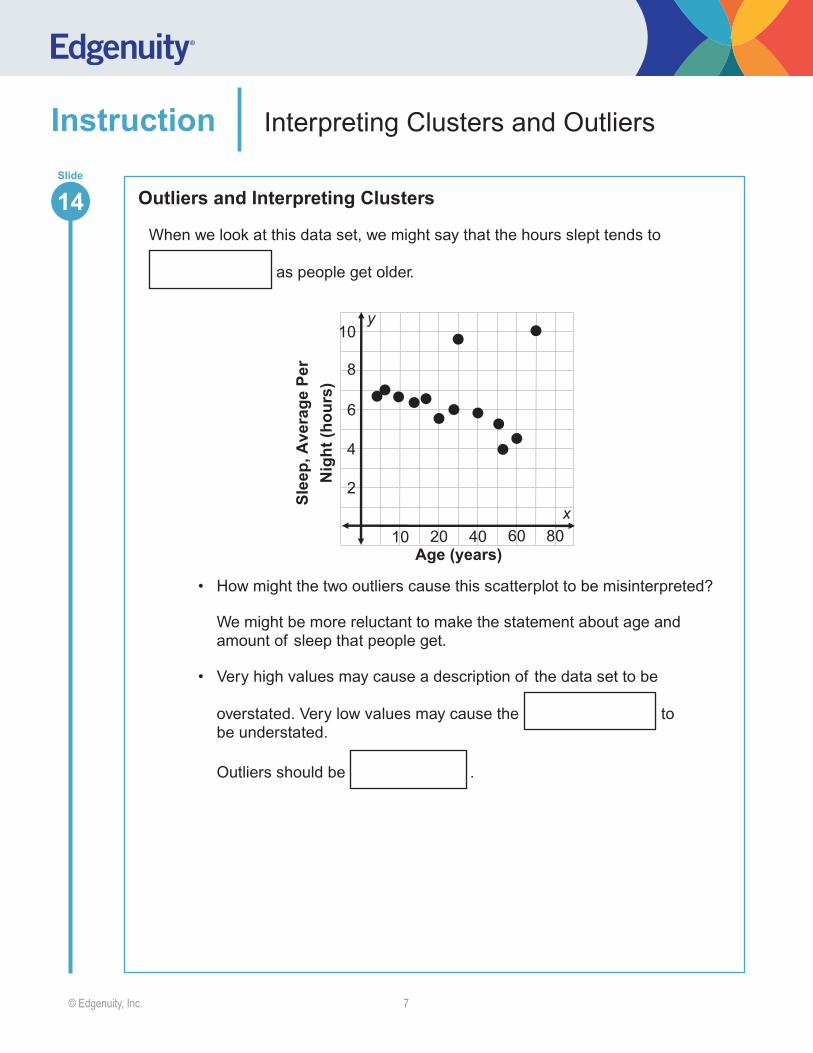
Outliers and Interpreting Clusters
When we look at this data set, we might say that the hours slept tends to
as people get older.
Sle
ep, A
vera
ge P
erN
ight
(hou
rs)
Age (years)
x
y
2
4
6
10 20 40 60 80
8
10
• How might the two outliers cause this scatterplot to be misinterpreted?
We might be more reluctant to make the statement about age and amount of sleep that people get.
• Very high values may cause a description of the data set to be
overstated. Very low values may cause the to be understated.
Outliers should be .

© Edgenuity, Inc. 8
Summary Interpreting Clusters and Outliers
?
Answer
Review: Key Concepts
• Clusters
Dis
tanc
e W
alke
d (f
eet)
Time Walked (minutes)
x
y
The cluster shows that there is a relationship between this data. The
distance walked as
the time walked increases.
• Outliers
Am
ount
of R
ainf
all
x
y
Population of a City
In this graph, we see a cluster of data and three other points that are extreme and far away from the rest of the data points. These are called
.
Lesson Question How do you interpret clusters and outliers in a scatterplot?
2

© Edgenuity, Inc. 9
Summary Interpreting Clusters and Outliers
Use this space to write any questions or thoughts about this lesson.