lessons 25 and 26 - istituto nazionale di fisica nucleare
TRANSCRIPT

A.A. 2021-2022 Prof. Antonio Capone - Particle and AstroParcle Physics 1
– Measurement of C.R. with E>1018 eV with hybrid detectors• The Telescope Array (TA) detector in the Northern
hemisphere• The "chemical composition" of UHE C.R. as measured by
hybrid detectors at ground with AUGER and Telescope Array detectors
• Search for U.H.E. neutrinos with Pierre Auger Observatory• Measurement of the CR anisotropy (AGASA, Pierre Auger,
ARGO, other experiments…)
Lessons 25 and 26
A.A. 2021-2022 Prof. Antonio Capone - Particle and AstroParcle Physics 2
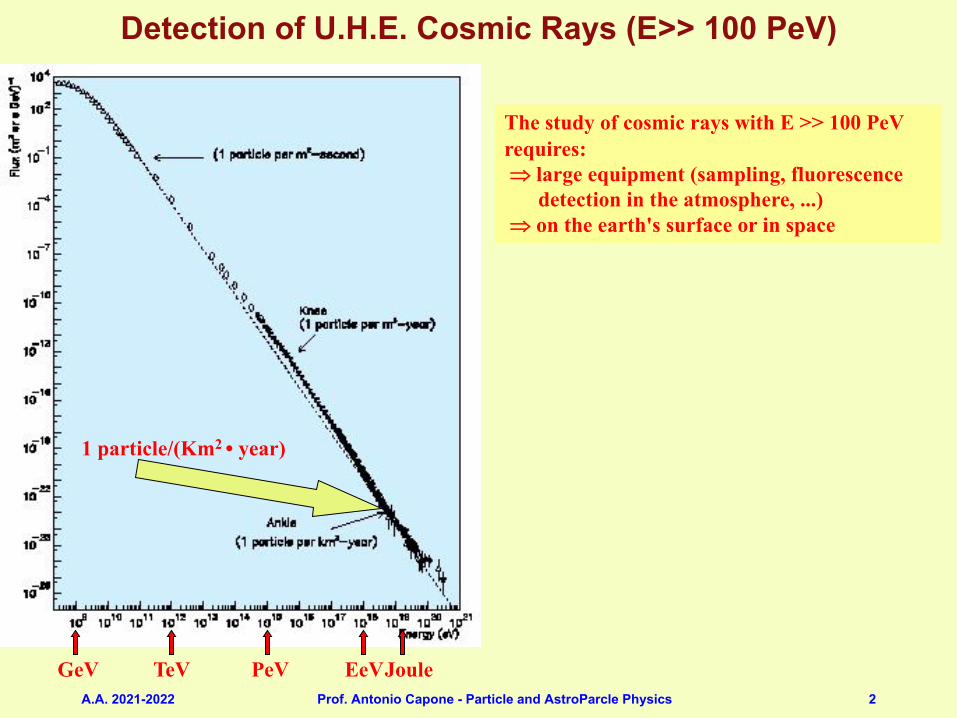
Detection of U.H.E. Cosmic Rays (E>> 100 PeV)
~ 10 particelle/s
GeV TeV PeV EeVJoule
The study of cosmic rays with E >> 100 PeVrequires:Þ large equipment (sampling, fluorescence
detection in the atmosphere, ...)Þ on the earth's surface or in space
1 particle/(Km2 • year)
A.A. 2021-2022 Prof. Antonio Capone - Particle and AstroParcle Physics 3
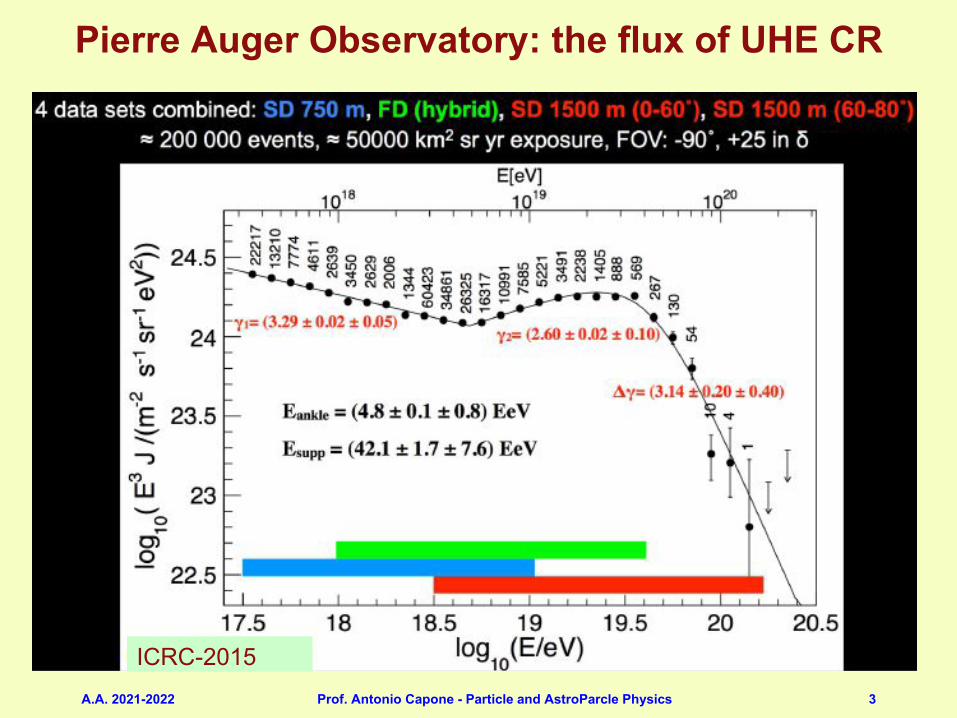
Pierre Auger Observatory: the flux of UHE CR
ICRC-2015
A.A. 2021-2022 Prof. Antonio Capone - Particle and AstroParcle Physics 4
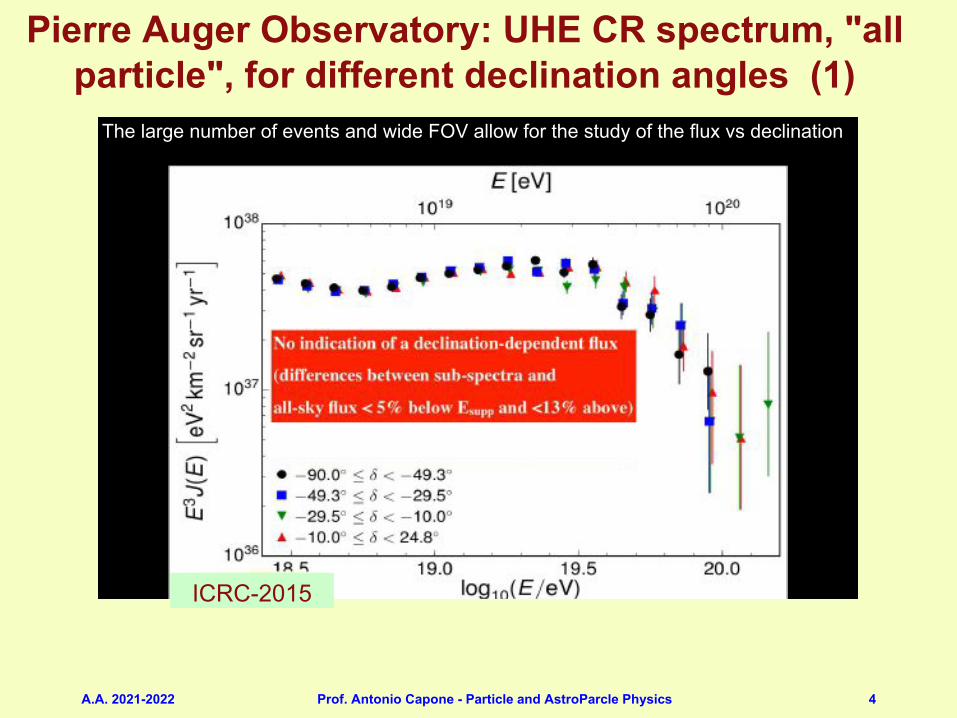
Pierre Auger Observatory: UHE CR spectrum, "all particle", for different declination angles (1)All-particle spectrum in different declination bands
The large number of events and wide FOV allow for the study of the flux vs declination
9
No indication of a declination-dependent flux
(differences between sub-spectra and
all-sky flux < 5% below Esupp and <13% above)
[see talk by Ines Valiño tomorrow]
Valiño #271ICRC-2015
A.A. 2021-2022 Prof. Antonio Capone - Particle and AstroParcle Physics 5
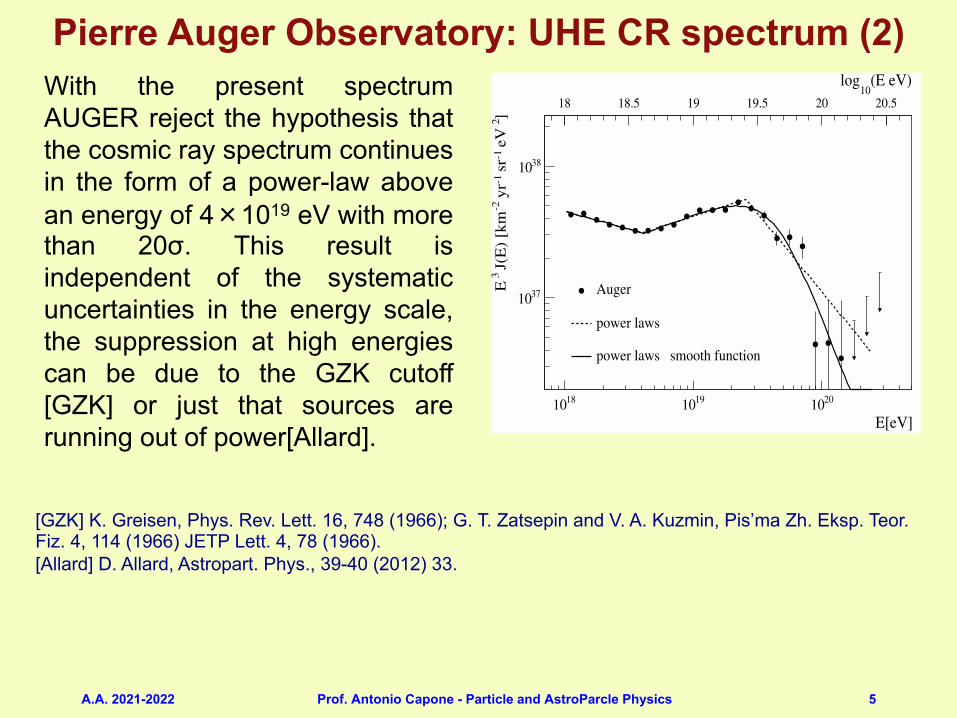
With the present spectrumAUGER reject the hypothesis thatthe cosmic ray spectrum continuesin the form of a power-law abovean energy of 4×10¹⁹ eV with morethan 20σ. This result isindependent of the systematicuncertainties in the energy scale,the suppression at high energiescan be due to the GZK cutoff[GZK] or just that sources arerunning out of power[Allard].
Pierre Auger Observatory: UHE CR spectrum (2)
[GZK] K. Greisen, Phys. Rev. Lett. 16, 748 (1966); G. T. Zatsepin and V. A. Kuzmin, Pis’ma Zh. Eksp. Teor. Fiz. 4, 114 (1966) JETP Lett. 4, 78 (1966).[Allard] D. Allard, Astropart. Phys., 39-40 (2012) 33.
E[eV]
1810 1910 2010
]�2
�eV
-1�s
r-1
�yr
-2�J
(E)�
[km
�3�E 3710
3810
(E�eV)10
log
18 18.5 19 19.5 20 20.5
Auger
power�laws
power�laws���smooth�function
Figure 5: The combined energy spectrum is fitted with two functions (see text).Only statistical uncertainties are shown. The systematic uncertainty in the en-ergy scale is 22%.
where Ec is the energy at which the flux is suppressed 50%186
compared to a pure power-law, and Wc determines the sharp-187
ness of the cut-off. The derived parameters are in Table 1 with188
statistical uncertainties.189
Table 1: Fitted parameters and their statistical uncertainties characterizing thecombined energy spectrum.
parameter broken power laws power laws
+smooth function
γ1(E < Eankle) 3.27 ± 0.02 3.27 ± 0.01
lg(Eankle/eV) 18.61 ± 0.01 18.62 ± 0.01
γ2(E > Eankle) 2.68 ± 0.01 2.63 ± 0.02
lg(Ebreak/eV) 19.41 ± 0.02
γ3(E > Ebreak) 4.2 ± 0.1
lg(Ec/eV) 19.63 ± 0.02
Wc 0.15 ± 0.02
χ2/ndof 37.8/16 = 2.4 33.7/16 = 2.1
See [4] for more details.190
4. Conclusion191
We have reported the measurement of the cosmic ray energy192
flux with the Pierre Auger Observatory. Two independent mea-193
surements have been performed, by exploiting surface detector194
and hybrid data, and then combined to derive the energy spec-195
trum above 1018 eV.196
The ground parameter S (1000) derived from the SD array is197
converted to S 38◦ using the constant intensity cut method, which198
is calculated from data assuming that the flux is isotropic. S 38◦199
may be regarded as the signal S (1000) the shower would have200
produced if it had arrived at θ = 38◦. Finally we use a high qual-201
ity sample of hybrid events to relate S 38◦ to EFD. The system-202
atic uncertainties in determining ES D coming from the FD sum203
up to 22%. Several activities are on-going to reduce the sys-204
tematic uncertainties of the energy estimate, e.g. the detector205
calibration uncertainty and the uncertainty of the fluorescence206
yield. Reducing these uncertainties will make it desirable to de-207
convolve the energy spectrum using the estimate of the energy208
resolution.209
The combination of the high statistics obtained with the sur-210
face detector and the extension to lower energies using hybrid211
observations enables the precise measurement of both the ankle212
and the flux suppression at highest energies. With the present213
spectrum we reject the hypothesis that the cosmic ray spectrum214
continues in the form of a power-law above an energy of 4×1019215
eV with more than 20σ. This result is independent of the sys-216
tematic uncertainties in the energy scale, the suppression at high217
energies can be due to the GZK cutoff[14] or just that sources218
are running out of power[15]. The astrophysical interpretation219
of the ankle depends on several factors like the primary com-220
position and the sources distribution, see [16] for more details.221
A precise measurement of the energy spectrum, together with222
anisotropy and mass composition studies in this energy range,223
will shed light on the origin of the highest energy particles ob-224
served in nature [17, 18].225
References226
[1] The Pierre Auger Collaboration, NIMA 523 (2004) 50.227
[2] The Pierre Auger Collaboration, NIMA 613 (2010) 29.228
[3] The Pierre Auger Collaboration, NIMA 620 (2010) 227.229
[4] F. Salamida, for The Pierre Auger Collaboration Proc. 32th ICRC, Beijing230
(2011), arXiv:1107.4809.231
[5] D. Barnhill, for The Pierre Auger Collaboration Proc. 29th ICRC, Pune232
(2005), 7, 291. astro-ph/0507590233
[6] D. Allard, for The Pierre Auger Collaboration Proc. 29th ICRC, Pune234
(2005), 7, 71. astro-ph/0511104235
[7] R. Pesce, for The Pierre Auger Collaboration Proc. 32th ICRC,236
arXiv:1107.4809 (2011).237
[8] M. Ave, for The Pierre Auger Collaboration Proc. 30th ICRC, Merida238
(2007), 4, 601, arXiv:0709.2125239
[9] H. Barbosa et al., Astropart. Phys., 22 (2004) 159.240
[10] M. Nagano, K. Kobayakawa, N. Sakaki, K. Ando, Astropart. Phys. 22241
(2004) 235.242
[11] The Pierre Auger Collaboration, JINST, in press (2013)243
[12] The Pierre Auger Collaboration, Astropart. Phys. 34 (2011) 368.244
[13] M. Settimo, for The Pierre Auger Collaboration, Eur. Phys. J. Plus. 127245
(2012) 87.246
[14] K. Greisen, Phys. Rev. Lett. 16, 748 (1966); G. T. Zatsepin and V. A.247
Kuzmin, Pis’ma Zh. Eksp. Teor. Fiz. 4, 114 (1966) JETP Lett. 4, 78248
(1966).249
[15] D. Allard, Astropart. Phys., 39-40 (2012) 33.250
[16] M. Unger, arXiv:0812.2763 (2008).251
[17] P. Facal, for The Pierre Auger Collaboration Proc. 32th ICRC,252
arXiv:1107.4804 (2011).253
[18] E. M. Santos, for The Pierre Auger Collaboration Proc. 32th ICRC,254
arXiv:1107.4805 (2011).255
4
A.A. 2021-2022 Prof. Antonio Capone - Particle and AstroParcle Physics 6
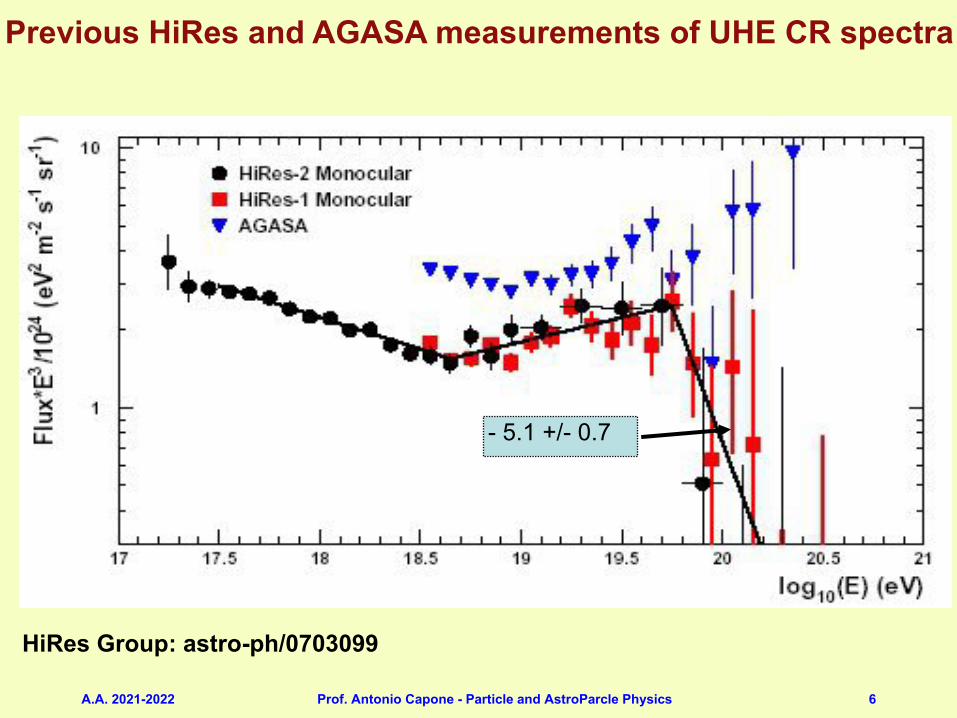
Previous HiRes and AGASA measurements of UHE CR spectra
HiRes Group: astro-ph/0703099
- 5.1 +/- 0.7
A.A. 2021-2022 Prof. Antonio Capone - Particle and AstroParcle Physics 7
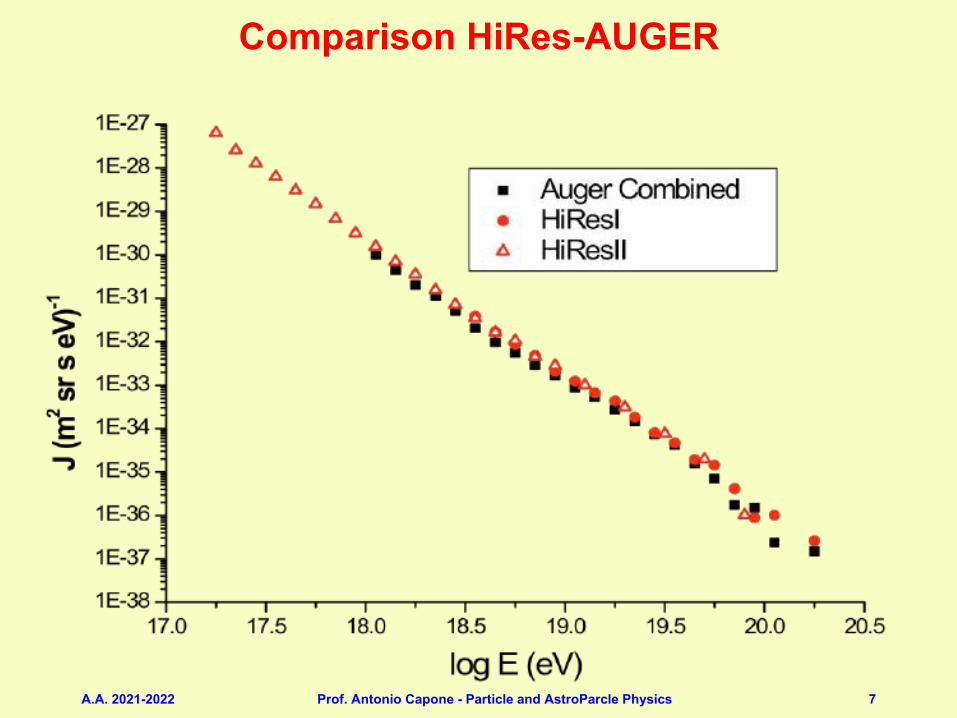
Comparison HiRes-AUGER
A.A. 2021-2022 Prof. Antonio Capone - Particle and AstroParcle Physics 8
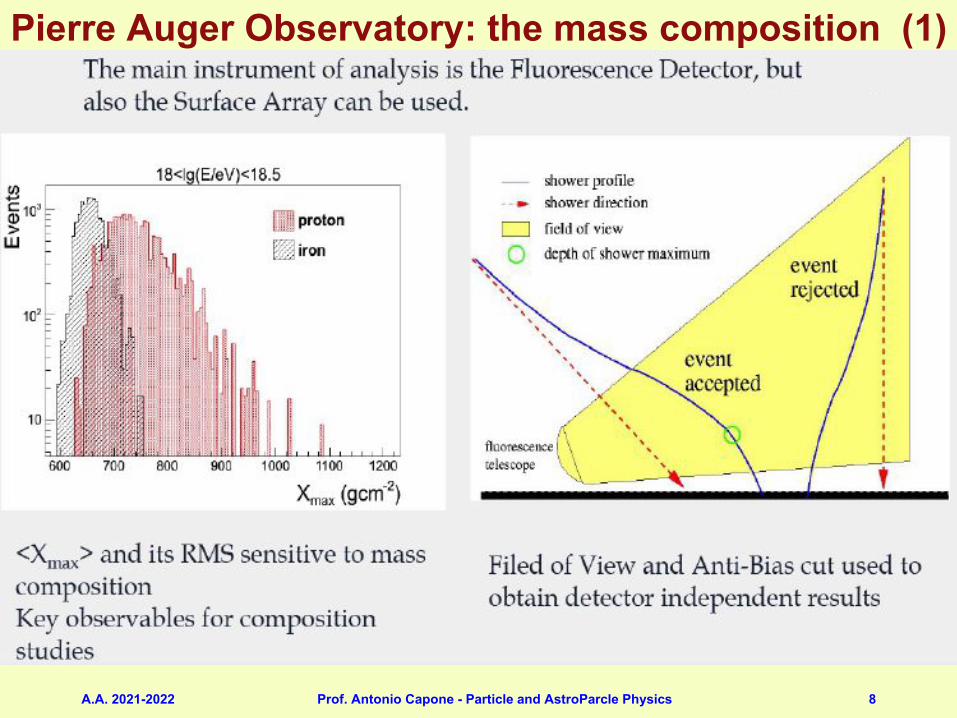
Pierre Auger Observatory: the mass composition (1)

A.A. 2021-2022 Prof. Antonio Capone - Particle and AstroParcle Physics 9
Fluorescence detectors field of view includes heights 1km- 5km above the sea-level: this is sufficient to observe the major part of the showers longitudinal development.
A.A. 2021-2022 Prof. Antonio Capone - Particle and AstroParcle Physics 10
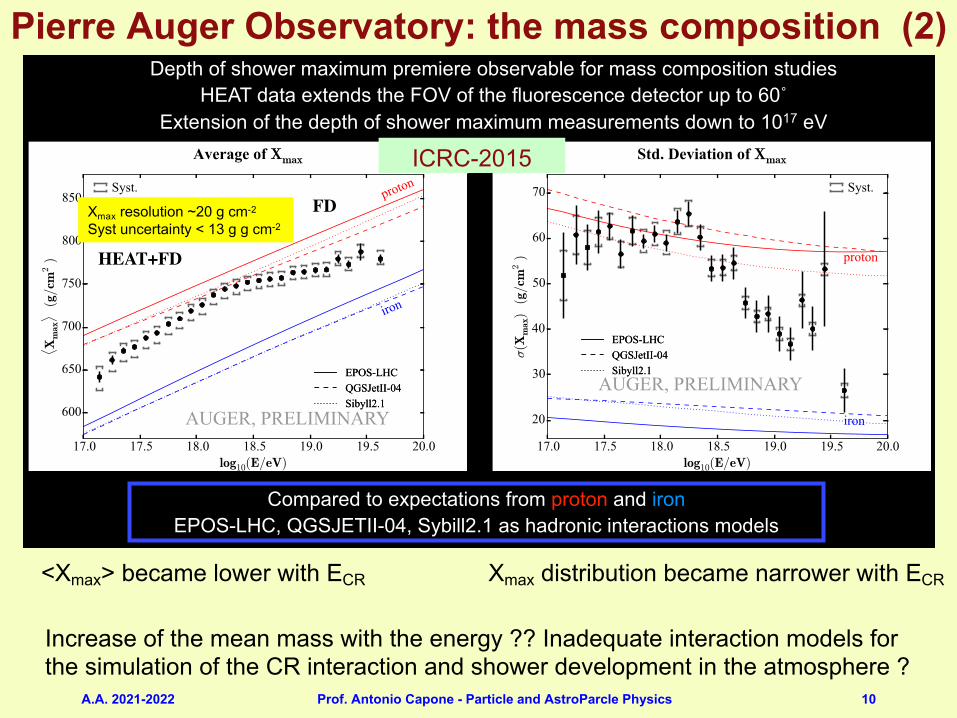
Pierre Auger Observatory: the mass composition (2)First measurement of the depth of shower maximum over 3 decades in energyDepth of shower maximum premiere observable for mass composition studies
HEAT data extends the FOV of the fluorescence detector up to 60˚ Extension of the depth of shower maximum measurements down to 1017 eV
Compared to expectations from proton and ironEPOS-LHC, QGSJETII-04, Sybill2.1 as hadronic interactions models
10
Porcelli #420
HEAT+FD
FDXmax resolution ~20 g cm-2
Syst uncertainty < 13 g g cm-2
<Xmax> became lower with ECR Xmax distribution became narrower with ECR
Increase of the mean mass with the energy ?? Inadequate interaction models for the simulation of the CR interaction and shower development in the atmosphere ?
ICRC-2015
A.A. 2021-2022 Prof. Antonio Capone - Particle and AstroParcle Physics 11
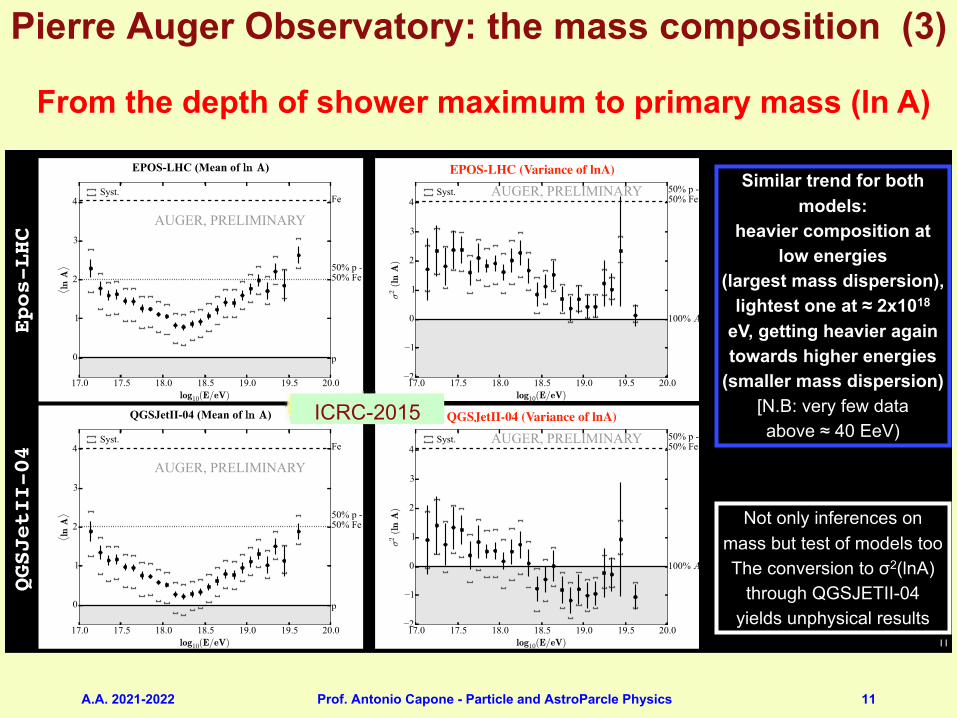
Pierre Auger Observatory: the mass composition (3)
EPOS-LHC (Variance of lnA)
QGSJetII-04 (Variance of lnA)
From the depth of shower maximum to primary mass (lnA)
Epos-LHC
QGSJetII-04
Similar trend for both models:
heavier composition at low energies
(largest mass dispersion), lightest one at ≈ 2x10¹⁸
eV, getting heavier again towards higher energies
(smaller mass dispersion)[N.B: very few data above ≈ 40 EeV)
11
Porcelli #420
Not only inferences on mass but test of models tooThe conversion to σ2(lnA)
through QGSJETII-04 yields unphysical results
From the depth of shower maximum to primary mass (ln A)
ICRC-2015

A.A. 2021-2022 Prof. Antonio Capone - Particle and AstroParcle Physics 12
Pierre Auger Observatory: the mass composition (4)
(Simple) Model of UHECR to reproduce the Auger spectrum and Xmax distributions at the same timeHomogeneous distribution of identical sources accelerating p, He, N and Fe nuclei.
Fit parameters: injection flux normalization and spectral index γ, cutoff rigidity Rcut, p-He-N-Fe fractions
γ-1.5 -1 -0.5 0 0.5 1 1.5 2 2.5
/V)
cut
(R10
log
18
18.5
19
19.5
20
20.5
0
2
4
6
8
10
12
γ
-1 0 1 2
200
250
300
350
Rcut and γ
(E/eV)10
log18 18.5 19 19.5 20
]-2
[g
cm
⟩m
axX⟨
650
700
750
800
850HHeNFe
EPOS-LHC
(E/eV)10
log18 18.5 19 19.5 20
]-2
) [g
cm
max
(Xσ
20
40
60 H
He
NFe
Energy spectrum and elements fractions<Xmax> and σ(Xmax)
What do spectrum and composition data tell us?
Best fit with very hard injection spectra (γ ≤ 1)Flux limited by maximum energy at the sources (Rcut ≤ 101..7 eV
Di Matteo #249
13
ICRC-2015
A.A. 2021-2022 Prof. Antonio Capone - Particle and AstroParcle Physics 13
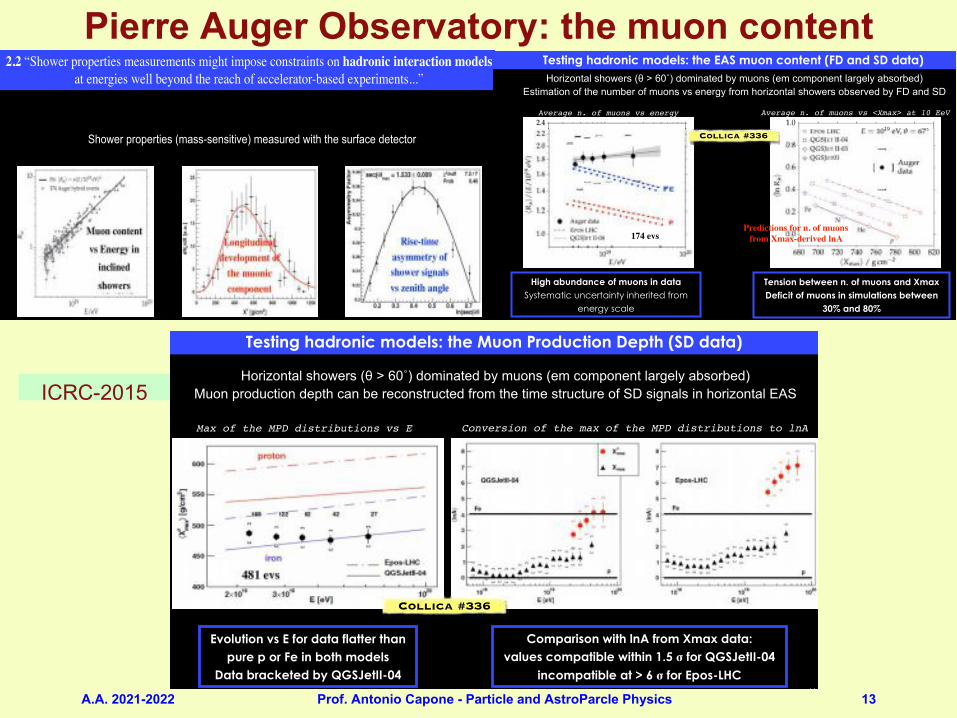
Pierre Auger Observatory: the muon content2.2 “Shower properties measurements might impose constraints on hadronic interaction models
at energies well beyond the reach of accelerator-based experiments...”
Longitudinal development of
the muonic component
Shower properties (mass-sensitive) measured with the surface detector
Muon content vs Energy in
inclined
showers
Rise-time asymmetry of shower signals vs zenith angle
14
Collica #336 Minaya #405
ICRC-2015
Testing hadronic models: the EAS muon content (FD and SD data)Horizontal showers (θ > 60˚) dominated by muons (em component largely absorbed)
Estimation of the number of muons vs energy from horizontal showers observed by FD and SD
Average n. of muons vs energy Average n. of muons vs <Xmax> at 10 EeV
High abundance of muons in dataSystematic uncertainty inherited from
energy scale
Fe
p
Collica #336
Predictions for n. of muons from Xmax-derived lnA
Tension between n. of muons and XmaxDeficit of muons in simulations between
30% and 80%15
174 evs
Testing hadronic models: the Muon Production Depth (SD data)
Horizontal showers (θ > 60˚) dominated by muons (em component largely absorbed)Muon production depth can be reconstructed from the time structure of SD signals in horizontal EAS
Max of the MPD distributions vs E Conversion of the max of the MPD distributions to lnA
481 evs
Evolution vs E for data flatter than pure p or Fe in both models
Data bracketed by QGSJetII-04
Comparison with lnA from Xmax data:values compatible within 1.5 σ for QGSJetII-04
incompatible at > 6 σ for Epos-LHC
Collica #336
16
A.A. 2021-2022 Prof. Antonio Capone - Particle and AstroParcle Physics 14
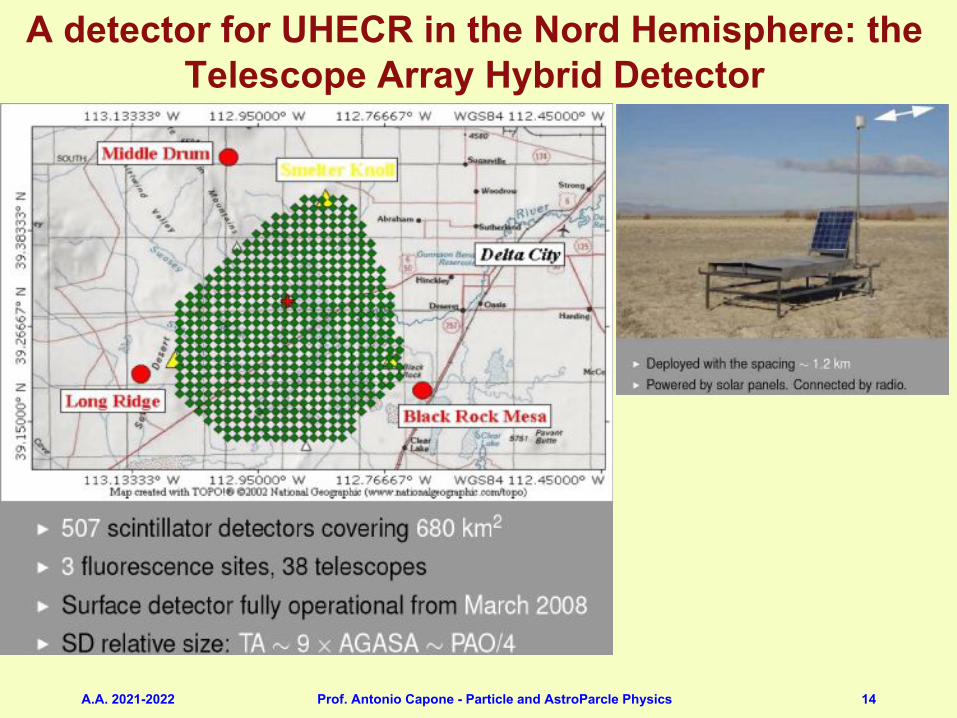
A detector for UHECR in the Nord Hemisphere: the Telescope Array Hybrid Detector
A.A. 2021-2022 Prof. Antonio Capone - Particle and AstroParcle Physics 15
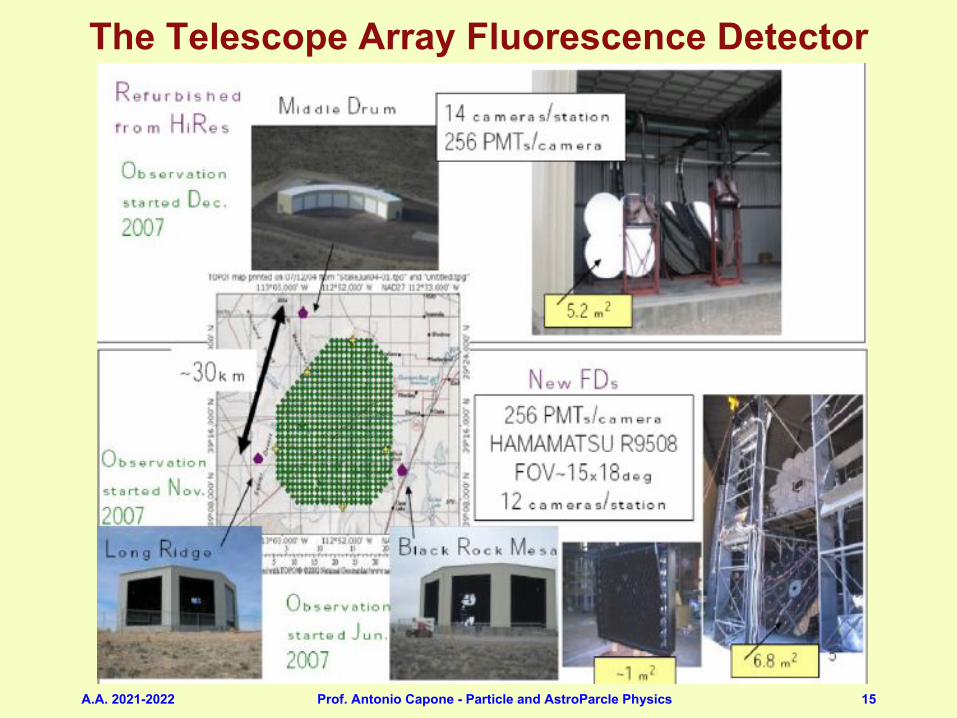
The Telescope Array Fluorescence Detector
A.A. 2021-2022 Prof. Antonio Capone - Particle and AstroParcle Physics 16
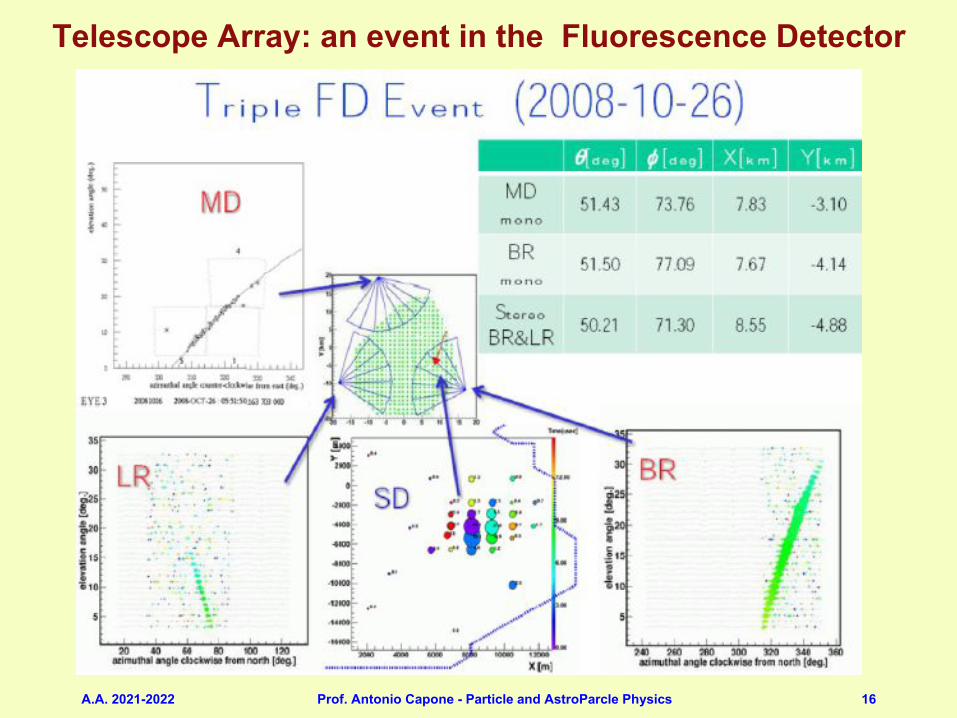
Telescope Array: an event in the Fluorescence Detector

A.A. 2021-2022 Prof. Antonio Capone - Particle and AstroParcle Physics 17
Telescope Array: measurement of the UHECR spectrum - 1
A.A. 2021-2022 Prof. Antonio Capone - Particle and AstroParcle Physics 18
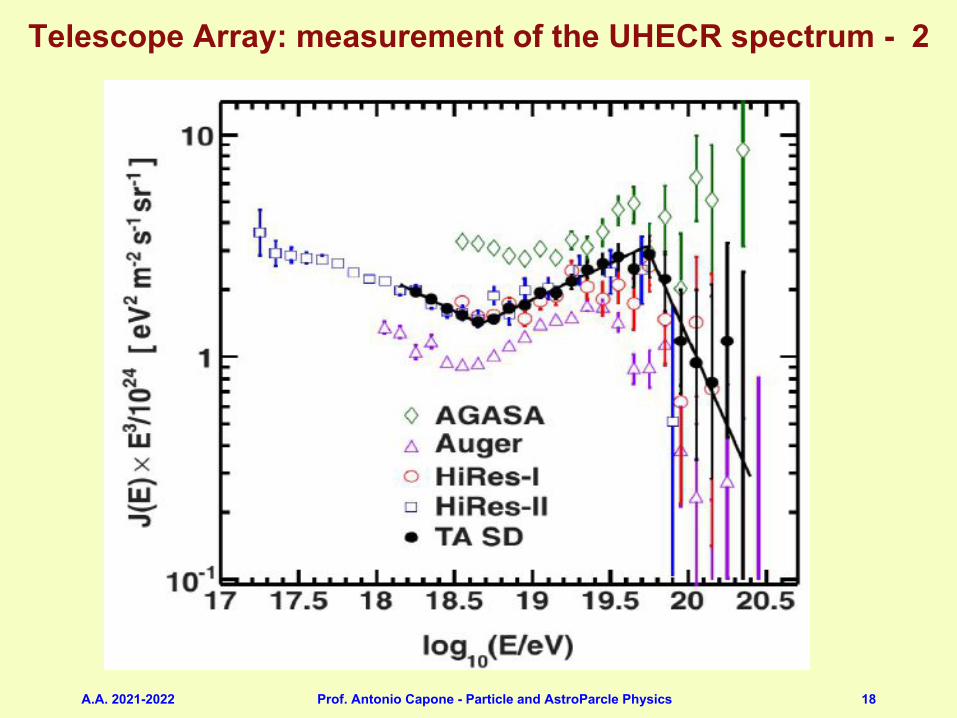
Telescope Array: measurement of the UHECR spectrum - 2

A.A. 2021-2022 Prof. Antonio Capone - Particle and AstroParcle Physics 19
Telescope Array: measurement of the UHECR composition (1)
A.A. 2021-2022 Prof. Antonio Capone - Particle and AstroParcle Physics 20
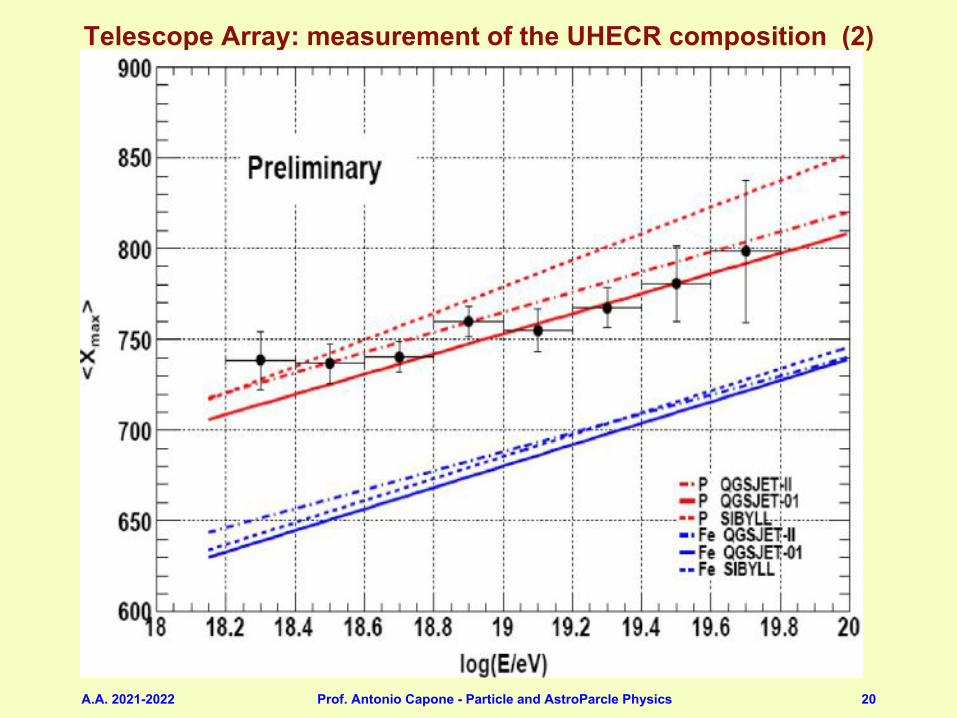
Telescope Array: measurement of the UHECR composition (2)
A.A. 2021-2022 Prof. Antonio Capone - Particle and AstroParcle Physics 21
Combined PAO and TA measurement of the UHECR spectra and composition – ICRC 2015 (1)
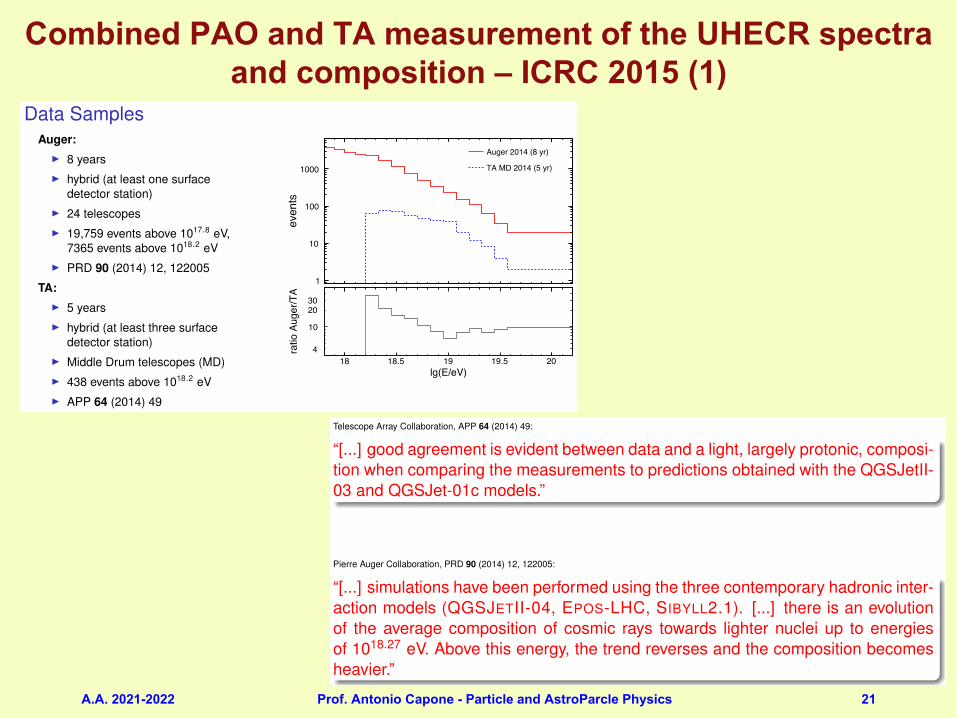
Data SamplesAuger:
I 8 yearsI hybrid (at least one surface
detector station)I 24 telescopesI 19,759 events above 1017.8 eV,
7365 events above 1018.2 eVI PRD 90 (2014) 12, 122005
TA:I 5 yearsI hybrid (at least three surface
detector station)I Middle Drum telescopes (MD)I 438 events above 1018.2 eVI APP 64 (2014) 49
18 18.5 19 19.5 20ev
ents
1
10
100
1000
Auger 2014 (8 yr)
TA MD 2014 (5 yr)
lg(E/eV)18 18.5 19 19.5 20
ratio
Aug
er/T
A
4
10
2030
3
Composition from Shower Maximum (Xmax)
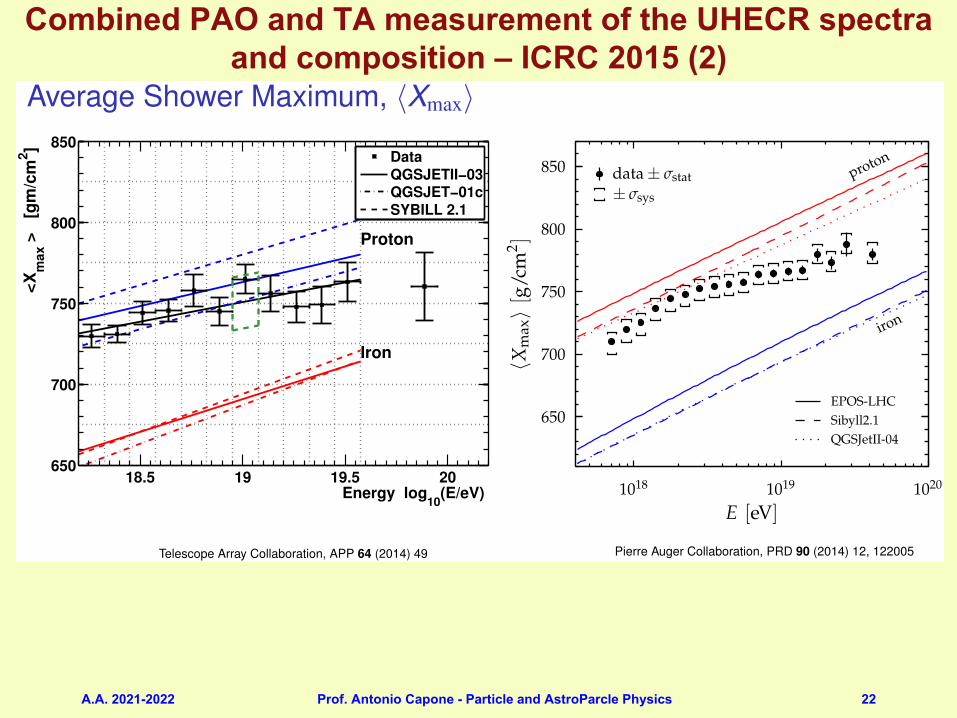
Telescope Array Collaboration, APP 64 (2014) 49:
“[...] good agreement is evident between data and a light, largely protonic, composi-tion when comparing the measurements to predictions obtained with the QGSJetII-03 and QGSJet-01c models.”
Pierre Auger Collaboration, PRD 90 (2014) 12, 122005:
“[...] simulations have been performed using the three contemporary hadronic inter-action models (QGSJETII-04, EPOS-LHC, SIBYLL2.1). [...] there is an evolutionof the average composition of cosmic rays towards lighter nuclei up to energiesof 1018.27 eV. Above this energy, the trend reverses and the composition becomesheavier.”
4
A.A. 2021-2022 Prof. Antonio Capone - Particle and AstroParcle Physics 22
Combined PAO and TA measurement of the UHECR spectra and composition – ICRC 2015 (2)
Average Shower Maximum, hXmaxi
Energy log10(E/eV)
<Xmax
>[gm/cm
2 ]
Proton
Iron
18.5 19 19.5 20650
700
750
800
850DataQGSJETII(03QGSJET(01cSYBILL 2.1
Telescope Array Collaboration, APP 64 (2014) 49
E [eV]1018 1019 1020
hXm
axi[g
/cm
2 ]
650
700
750
800
850 data ± sstat± ssys
EPOS-LHCSibyll2.1QGSJetII-04
iron
proton
E [eV]1018 1019 1020
s(X
max)[g
/cm
2 ]
0
10
20
30
40
50
60
70
80
iron
proton
Pierre Auger Collaboration, PRD 90 (2014) 12, 122005
5
A.A. 2021-2022 Prof. Antonio Capone - Particle and AstroParcle Physics 23
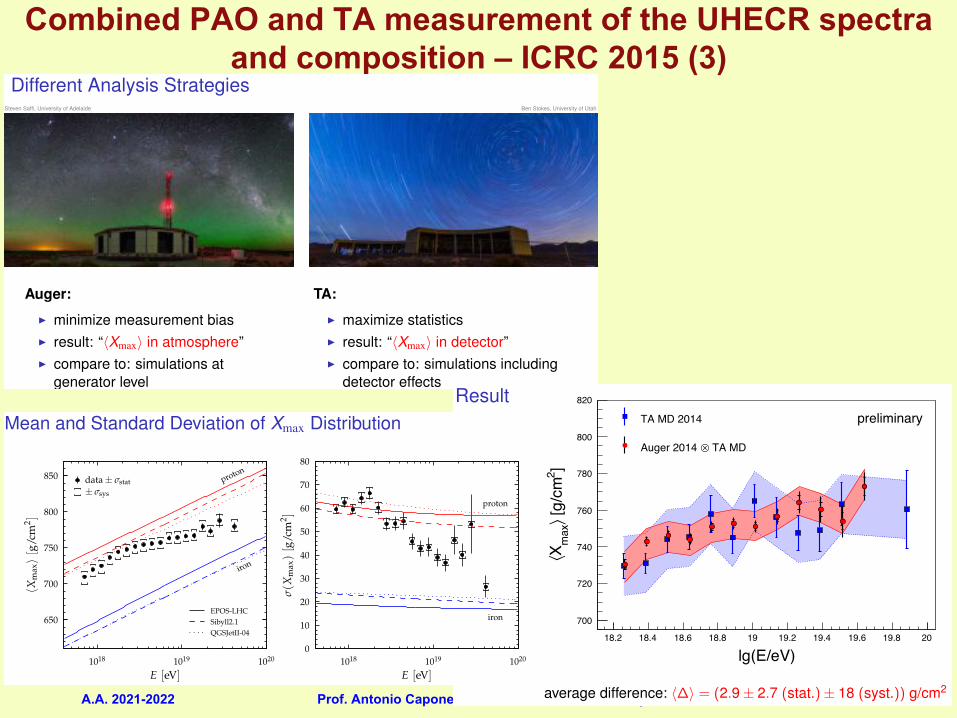
Combined PAO and TA measurement of the UHECR spectra and composition – ICRC 2015 (3)
Different Analysis StrategiesSteven Saffi, University of Adelaide Ben Stokes, University of Utah
Auger:
I minimize measurement biasI result: “hXmaxi in atmosphere”I compare to: simulations at
generator level
TA:
I maximize statisticsI result: “hXmaxi in detector”I compare to: simulations including
detector effects6Result
lg(E/eV)18.2 18.4 18.6 18.8 19 19.2 19.4 19.6 19.8 20
]2 [g
/cm
⟩m
axX⟨
700
720
740
760
780
800
820
TA MD 2014
TA MD⊗Auger 2014
preliminary
average difference: h�i = (2.9 ± 2.7 (stat.) ± 18 (syst.)) g/cm211
Mean and Standard Deviation of Xmax Distribution
E [eV]1018 1019 1020
hXm
axi[g
/cm
2 ]
650
700
750
800
850 data ± sstat± ssys
EPOS-LHCSibyll2.1QGSJetII-04
iron
proton
E [eV]1018 1019 1020
s(X
max)[g
/cm
2 ]
0
10
20
30
40
50
60
70
80
iron
proton
14
A.A. 2021-2022 Prof. Antonio Capone - Particle and AstroParcle Physics 24
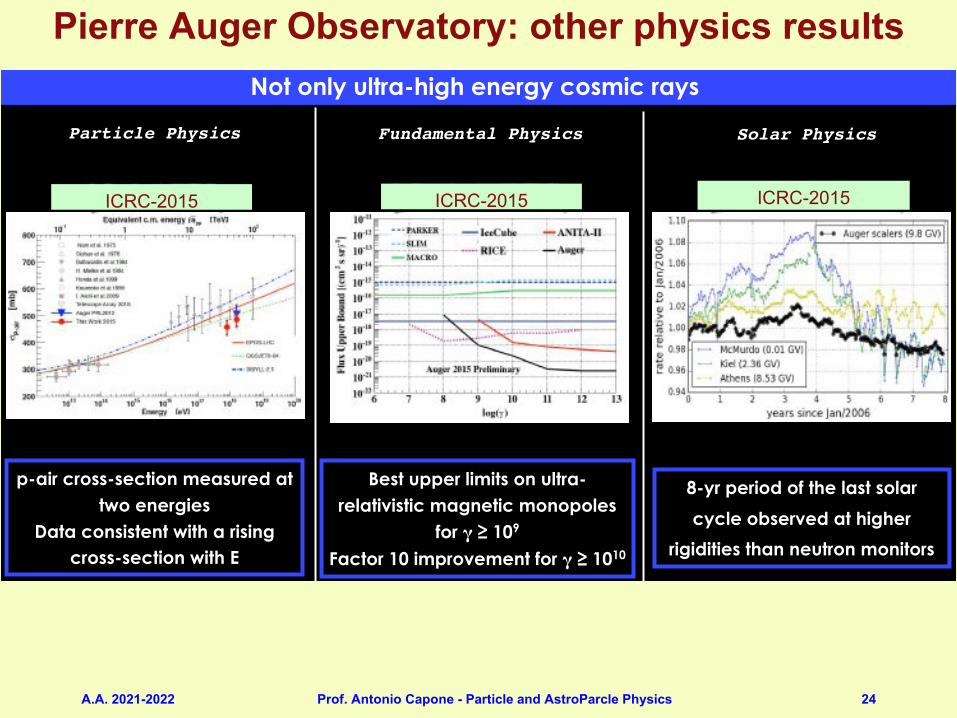
Pierre Auger Observatory: other physics results Not only ultra-high energy cosmic rays
Ulrich #401
p-air cross-section measured at two energies
Data consistent with a rising cross-section with E
Particle Physics Fundamental Physics
Fujii #319 Masias-Meza #074
Solar Physics
Best upper limits on ultra-relativistic magnetic monopoles
for γ ≥ 109
Factor 10 improvement for γ ≥ 1010
8-yr period of the last solar
cycle observed at higher
rigidities than neutron monitors
21
ICRC-2015 ICRC-2015 ICRC-2015
A.A. 2021-2022 Prof. Antonio Capone - Particle and AstroParcle Physics 25
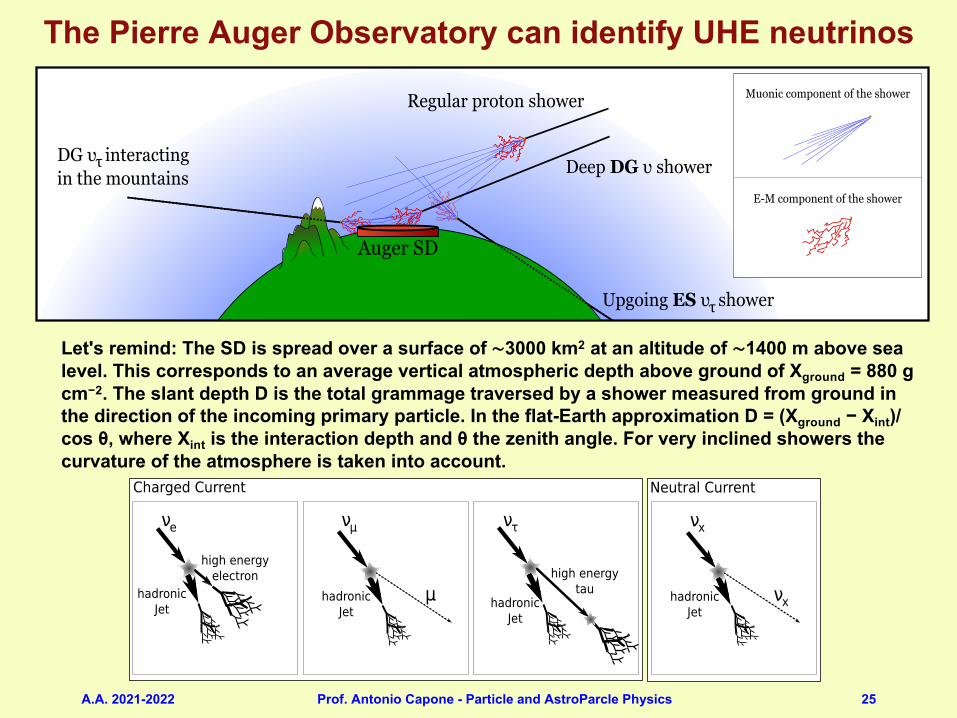
The Pierre Auger Observatory can identify UHE neutrinos 5
FIG. 1. Pictorial representation of the different types of showers induced by protons, heavy nuclei and “down-going” (DG) aswell as “Earth-skimming” (ES) neutrinos. The search for down-going showers initiated deep in the atmosphere is the subjectof this work.
flat-Earth approximation D = (Xground − Xint)/ cos θ,where Xint is the interaction depth and θ the zenith an-gle. For very inclined showers the curvature of the atmo-sphere is taken into account.
The four fluorescence sites are located at the perime-ter of the surface array viewing the atmosphere aboveit [23]. In this work only data collected with the SDof the Pierre Auger Observatory are used to search fordown-going neutrinos.
A. The Surface Detector
Since the beginning of its operation for physics analy-sis, in January 2004, the SD array has grown steadily andit has been recording an increasing amount of data. Itconsists of ∼1660 detector units (water-Cherenkov sta-tions) regularly spaced in a triangular grid of side 1.5km. Each detector unit is a cylindrical polyethylene tankof 3.6 m diameter and 1.2 m height containing 12,000liters of purified water. The top surface has three pho-tomultiplier tubes (PMTs) in optical contact with thewater in the tank. The PMT signals are sampled byflash analog digital converters (FADC) with a frequencyof 40 MHz. Each surface detector is regularly moni-tored and calibrated in units of vertical equivalent muons(VEM) corresponding to the signal produced by a µtraversing the tank vertically and through its center [24].The surface stations transmit information by radio linksto the Central Data Acquisition System (CDAS) locatedin Malargue. The PMTs, local processor, GPS receiver,and the radio system are powered by batteries regulatedby solar panels. Once installed, the local stations workcontinuously without external intervention.
B. The trigger
A local trigger selects signals, either with a high peakvalue, or with a long duration. The second condition
favours stations hit in the early stage of the shower devel-opment (moderately inclined or deeply induced showers).The global trigger requires either 4 stations satisfying oneof the conditions, or 3 stations satisfying the second one,in a compact configuration (see [25] for more details).
With the complete array, the global trigger rate isabout two events per minute, one half being actualshower events with median energy of 3 × 10¹⁷ eV.
III. SIMULATION OF NEUTRINOINTERACTIONS, INDUCED SHOWERS AND
THE RESPONSE OF THE SURFACEDETECTOR.
Monte Carlo simulations of neutrino-induced showersare used to establish identification criteria and to com-pute the acceptance of the SD to UHEνs. The wholesimulation chain is divided in three stages:
1. High energy processes:
• The ν-nucleon interaction is simulated withherwig [26].
• In the case of ντ CC interactions, the τ lep-ton propagation is simulated with a dedicatedcode and its decay (when necessary) withtauola [27].
2. The shower development in the atmosphere is pro-cessed by aires [28].
3. The Surface Detector simulation is performed withthe Offline software [29].
In the next subsections we discuss each stage in detail.
A. Neutrino interaction
herwig is a general-purpose event generator for high-energy processes, with particular emphasis on the de-tailed simulation of QCD parton showers. Here it is used
Let's remind: The SD is spread over a surface of ∼3000 km2 at an altitude of ∼1400 m above sea level. This corresponds to an average vertical atmospheric depth above ground of Xground = 880 g cm−2. The slant depth D is the total grammage traversed by a shower measured from ground in the direction of the incoming primary particle. In the flat-Earth approximation D = (Xground − Xint)/ cos θ, where Xint is the interaction depth and θ the zenith angle. For very inclined showers the curvature of the atmosphere is taken into account. 7
FIG. 2. Different types of atmospheric showers induced by neutrinos.
gated: L/W > 3, where L and W are the length andthe width (eigenvalues of the inertia tensor, as definedin [16]). These cuts reject only 10% of genuine inclinedshowers.
For events where all stations are aligned along one ofthe directions of the array, θrec cannot be computed andwe rely on the average speed of the event, 〈V 〉. These“in-line” events are of great importance since the MonteCarlo simulations show that low energy neutrinos (! 1018
eV) typically present this type of configuration in the SD.
There is an additional requirement for events consti-tuted by an in-line event plus a non-aligned station (anon-aligned event that would become in-line by remov-ing just one station). This kind of spatial configurationis particularly prone to bad reconstruction if the non-aligned station was triggered by accidental muons notbelonging to the shower front. To avoid this problemwe also reconstruct the in-line event obtained by the re-moval of the non-aligned station and require it to havemean ground speed compatible with a zenith angle largerthan 75◦.
V. IDENTIFICATION OF NEUTRINOCANDIDATES
For this analysis, the whole data period (1 Jan 04 -31 May 10), was divided into two separate samples. Se-lected events recorded between 1 Jan 04 and 31 Oct 07(equivalent to ∼ 1.4 years of a complete SD array work-ing continuosly) constitute the “training” sample, usedto develop and optimize the neutrino identification algo-rithms. Data collected between 1 Nov 07 and 31 May10 (equivalent to ∼ 2 yr of the full array), constitutethe “search” sample. These latter events were not pro-cessed before the final tuning of the algorithms definingthe neutrino identification criteria.
A. Discrimination of neutrinos from hadronicshowers
Neutrinos, unlike protons and heavier nuclei, can gen-erate showers initiated deeply into the atmosphere. Themain signature of these deep showers in the SD is a sig-nificant electromagnetic (EM) component spread in timeover hundreds of nanoseconds, especially in the regionon the ground at which the shower arrives earlier (seeFig. 5). On the other hand, hadron-induced showers starthigh in the atmosphere, their electromagnetic componentis fully absorbed and only high energy muons and theirradiative and decay products reach the surface, concen-trated within a few tens of nanoseconds.
We identify stations reached by wide EM-rich showerfronts via their Area-over-Peak ratio (AoP), defined asthe ratio of the integral of the FADC trace to its peakvalue, normalized to 1 for the average signal producedby a single muon. In background horizontal showers themuons and their electromagnetic products are concen-trated within a short time interval, so their AoP is closeto 1. In the first stations hit by a deep inclined shower,it is typically between 3 and 5 (see left panel of Fig. 6).
To quantify the distinctive features of hadronic anddeeply penetrating showers induced by neutrinos at largezenith angle, improve the separation between the samplesand enhance the efficiency, while keeping a simple physi-cal interpretation of the identification process, we choosea multivariate technique known as the Fisher discrimi-nant method [35]. To tune it we used as a “signal” sam-ple the Monte Carlo simulations – exclusively composedof neutrino-induced showers – and as “background” thetraining sample introduced above – overwhelmingly, ifnot totally, constituted of nucleonic showers. We use realdata to train the Fisher discrimination method, insteadof simulations of hadronic showers, for two main reasons:
• the composition of the primary flux is not known,and moreover the interaction models used to sim-ulate hadronic showers may bias some features ofthe tail of the distributions of the observables usedin this analysis.
A.A. 2021-2022 Prof. Antonio Capone - Particle and AstroParcle Physics 26
The Pierre Auger Observatory can identify UHE neutrinos8
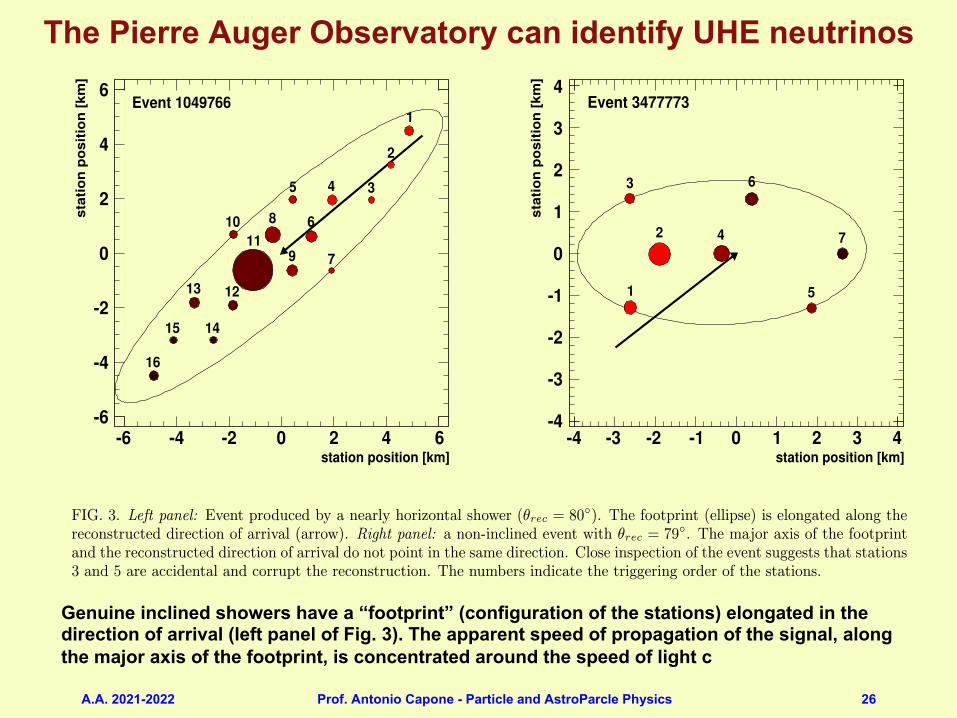
FIG. 3. Left panel: Event produced by a nearly horizontal shower (θrec = 80◦). The footprint (ellipse) is elongated along thereconstructed direction of arrival (arrow). Right panel: a non-inclined event with θrec = 79◦. The major axis of the footprintand the reconstructed direction of arrival do not point in the same direction. Close inspection of the event suggests that stations3 and 5 are accidental and corrupt the reconstruction. The numbers indicate the triggering order of the stations.
mean ground speed ⟨V⟩ [m ns
⟨V⟩ compat.with
]-1 0.29 0.3 0.31 0.32 0.33 0.34 0.350
100200300400500600700800900
1000
°>75recθ
arcsin(c/⟨V⟩) < 75°
Eve
nts
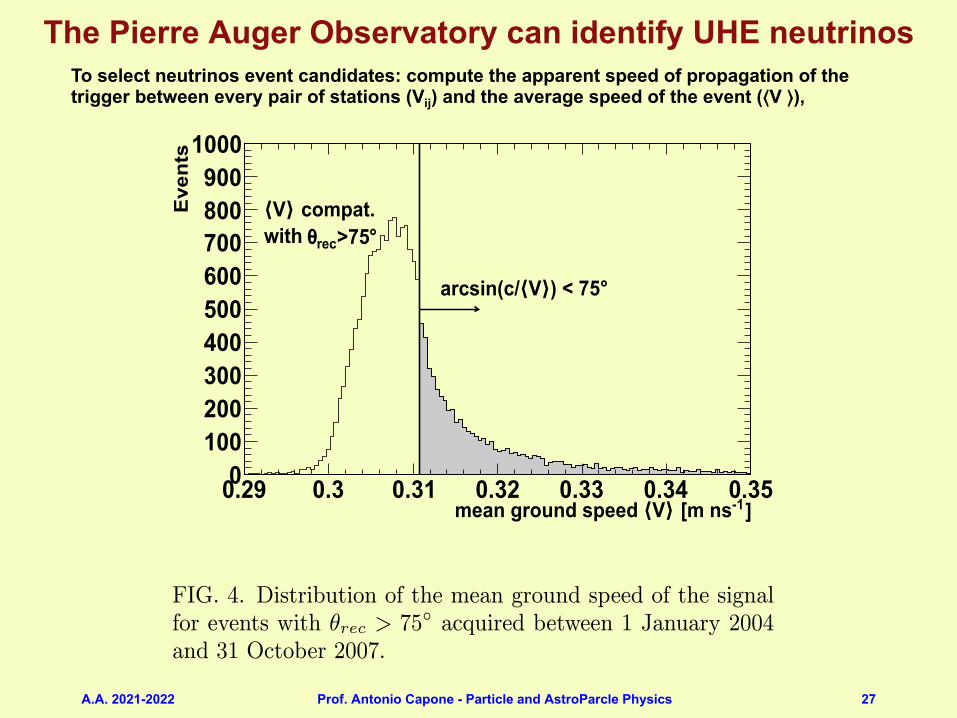
FIG. 4. Distribution of the mean ground speed of the signalfor events with θrec > 75◦ acquired between 1 January 2004and 31 October 2007.
• the detector simulation may not account for all pos-sible detector defects or fluctuations that may con-tribute to the background to ultra-high energy neu-trinos, while the real data contain all of them, in-cluding those which are not well known, or evennot yet diagnosed.
Note that, since we apply a statistical method for the dis-crimination, the use of real data as a background sampledoes not imply that we assume it contains no neutrinos,but just that, if any, they constitute a small fraction ofthe total recorded events.
After training the Fisher method, a good discrimi-
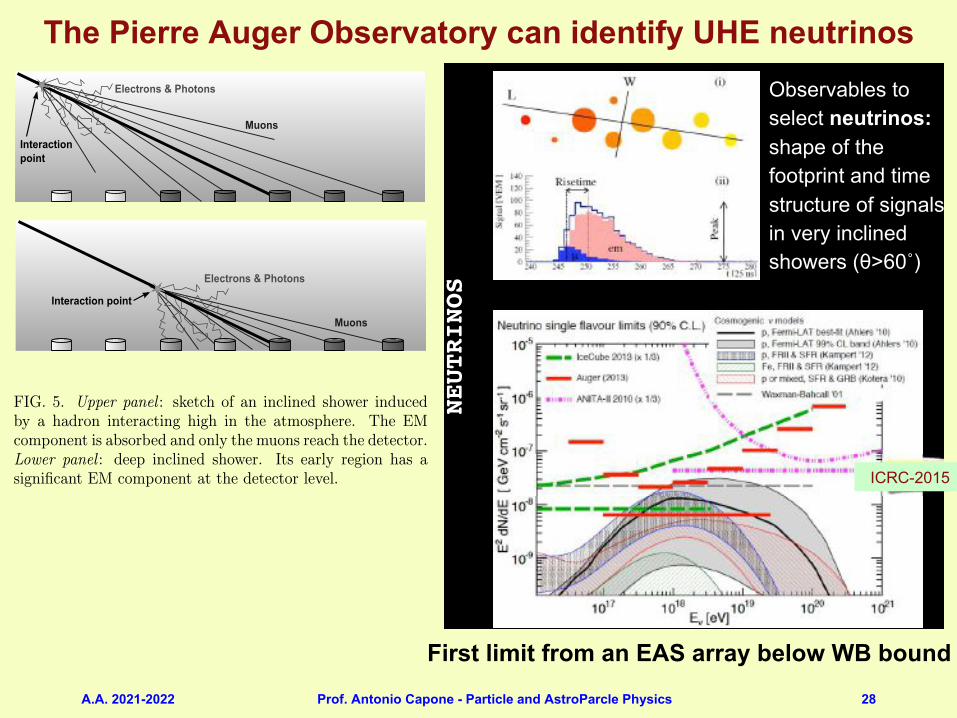
FIG. 5. Upper panel : sketch of an inclined shower inducedby a hadron interacting high in the atmosphere. The EMcomponent is absorbed and only the muons reach the detector.Lower panel : deep inclined shower. Its early region has asignificant EM component at the detector level.
nation is found when using the following ten variables[14]: the AoP of the four earliest triggered stations ineach event, their squares, their product, and a globalearly-late asymmetry parameter of the event. We in-clude the square of the AoP because when the distribu-tion of the input variables is not gaussian the additionof a non-linear combination of them improves the dis-crimination power [36]. The product of the AoP of theearliest four stations in the event aims at minimizing therelative weight of an accidentally large AoP produced,
Genuine inclined showers have a “footprint” (configuration of the stations) elongated in the direction of arrival (left panel of Fig. 3). The apparent speed of propagation of the signal, along the major axis of the footprint, is concentrated around the speed of light c
A.A. 2021-2022 Prof. Antonio Capone - Particle and AstroParcle Physics 27
The Pierre Auger Observatory can identify UHE neutrinos
8
FIG. 3. Left panel: Event produced by a nearly horizontal shower (θrec = 80◦). The footprint (ellipse) is elongated along thereconstructed direction of arrival (arrow). Right panel: a non-inclined event with θrec = 79◦. The major axis of the footprintand the reconstructed direction of arrival do not point in the same direction. Close inspection of the event suggests that stations3 and 5 are accidental and corrupt the reconstruction. The numbers indicate the triggering order of the stations.
mean ground speed ⟨V⟩ [m ns
⟨V⟩ compat.with
]-1 0.29 0.3 0.31 0.32 0.33 0.34 0.350
100200300400500600700800900
1000
°>75recθ
arcsin(c/⟨V⟩) < 75°
Eve
nts
FIG. 4. Distribution of the mean ground speed of the signalfor events with θrec > 75◦ acquired between 1 January 2004and 31 October 2007.
• the detector simulation may not account for all pos-sible detector defects or fluctuations that may con-tribute to the background to ultra-high energy neu-trinos, while the real data contain all of them, in-cluding those which are not well known, or evennot yet diagnosed.
Note that, since we apply a statistical method for the dis-crimination, the use of real data as a background sampledoes not imply that we assume it contains no neutrinos,but just that, if any, they constitute a small fraction ofthe total recorded events.
After training the Fisher method, a good discrimi-
FIG. 5. Upper panel : sketch of an inclined shower inducedby a hadron interacting high in the atmosphere. The EMcomponent is absorbed and only the muons reach the detector.Lower panel : deep inclined shower. Its early region has asignificant EM component at the detector level.
nation is found when using the following ten variables[14]: the AoP of the four earliest triggered stations ineach event, their squares, their product, and a globalearly-late asymmetry parameter of the event. We in-clude the square of the AoP because when the distribu-tion of the input variables is not gaussian the additionof a non-linear combination of them improves the dis-crimination power [36]. The product of the AoP of theearliest four stations in the event aims at minimizing therelative weight of an accidentally large AoP produced,
To select neutrinos event candidates: compute the apparent speed of propagation of the trigger between every pair of stations (Vij) and the average speed of the event (⟨V ⟩),
A.A. 2021-2022 Prof. Antonio Capone - Particle and AstroParcle Physics 28
The Pierre Auger Observatory can identify UHE neutrinos
8
FIG. 3. Left panel: Event produced by a nearly horizontal shower (θrec = 80◦). The footprint (ellipse) is elongated along thereconstructed direction of arrival (arrow). Right panel: a non-inclined event with θrec = 79◦. The major axis of the footprintand the reconstructed direction of arrival do not point in the same direction. Close inspection of the event suggests that stations3 and 5 are accidental and corrupt the reconstruction. The numbers indicate the triggering order of the stations.
mean ground speed ⟨V⟩ [m ns
⟨V⟩ compat.with
]-1 0.29 0.3 0.31 0.32 0.33 0.34 0.350
100200300400500600700800900
1000
°>75recθ
arcsin(c/⟨V⟩) < 75°
Eve
nts
FIG. 4. Distribution of the mean ground speed of the signalfor events with θrec > 75◦ acquired between 1 January 2004and 31 October 2007.
• the detector simulation may not account for all pos-sible detector defects or fluctuations that may con-tribute to the background to ultra-high energy neu-trinos, while the real data contain all of them, in-cluding those which are not well known, or evennot yet diagnosed.
Note that, since we apply a statistical method for the dis-crimination, the use of real data as a background sampledoes not imply that we assume it contains no neutrinos,but just that, if any, they constitute a small fraction ofthe total recorded events.
After training the Fisher method, a good discrimi-
FIG. 5. Upper panel : sketch of an inclined shower inducedby a hadron interacting high in the atmosphere. The EMcomponent is absorbed and only the muons reach the detector.Lower panel : deep inclined shower. Its early region has asignificant EM component at the detector level.
nation is found when using the following ten variables[14]: the AoP of the four earliest triggered stations ineach event, their squares, their product, and a globalearly-late asymmetry parameter of the event. We in-clude the square of the AoP because when the distribu-tion of the input variables is not gaussian the additionof a non-linear combination of them improves the dis-crimination power [36]. The product of the AoP of theearliest four stations in the event aims at minimizing therelative weight of an accidentally large AoP produced,
Stringent neutrino- and photon-flux limits at EeV energies
Bleve #1103
Observables to select neutrinos: shape of the footprint and time structure of signals in very inclined showers (θ>60˚)
EAS observables to select
photons: shape of the LDF and
time structure of signals in
showers with 30<θ<60˚
NEUTRINOS PHOTONS
Top-down models strongly disfavoredFirst limit from an EAS array below WB bound12
ICRC-2015
First limit from an EAS array below WB bound
Isotropy or anisotropy of the U.H.E. sky
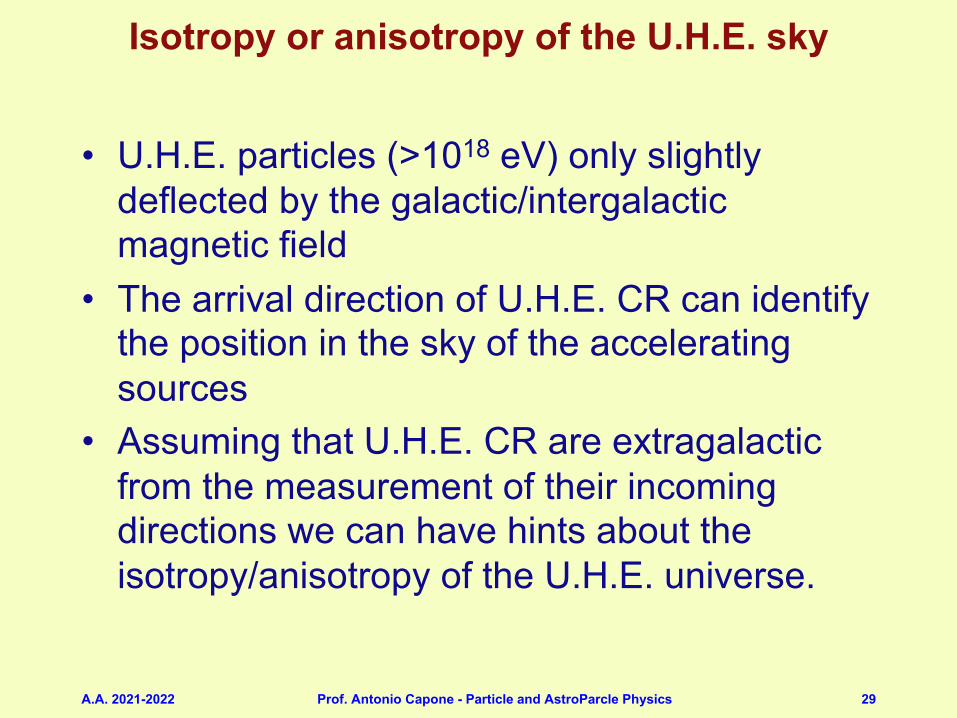
• U.H.E. particles (>1018 eV) only slightly deflected by the galactic/intergalactic magnetic field
• The arrival direction of U.H.E. CR can identify the position in the sky of the accelerating sources
• Assuming that U.H.E. CR are extragalactic from the measurement of their incoming directions we can have hints about the isotropy/anisotropy of the U.H.E. universe.
A.A. 2021-2022 Prof. Antonio Capone - Particle and AstroParcle Physics 29

A.A. 2021-2022 Prof. Antonio Capone - Particle and AstroParcle Physics 30
The coordinates of the fixed equatorial system are:- the time angle (H) (right ascension), which is the angular distance between the
mid-point ♈ and the intersection of the celestial meridian passing through the star with the celestial equator; it is measured in hours, minutes and seconds (0h, 24h) starting from point ♈ clockwise (or in degrees 0o, 360o );
- the declination, i.e. the angular distance between the intersection of the celestial meridian for the star and the celestial equator and the star itself, measured along the celestial meridian; it is measured in degrees, first and second (0o, 90o) starting from the equator celestial to the celestial poles; we speak of positive declination in the northern hemisphere and negative declination in the austral one.
Horizontal coordinates system. Equatorial coordinates system.
Representing the arrival C.R. directions, the sky
A.A. 2021-2022 Prof. Antonio Capone - Particle and AstroParcle Physics 31
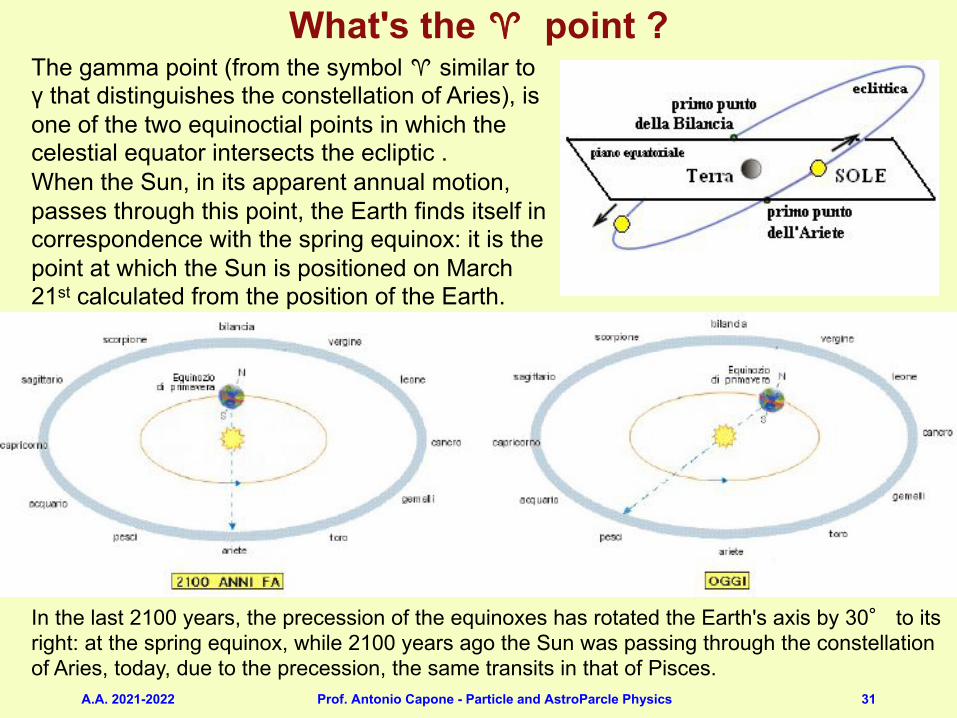
In the last 2100 years, the precession of the equinoxes has rotated the Earth's axis by 30° to its right: at the spring equinox, while 2100 years ago the Sun was passing through the constellation of Aries, today, due to the precession, the same transits in that of Pisces.
The gamma point (from the symbol ♈ similar to γ that distinguishes the constellation of Aries), is one of the two equinoctial points in which the celestial equator intersects the ecliptic .When the Sun, in its apparent annual motion, passes through this point, the Earth finds itself in correspondence with the spring equinox: it is the point at which the Sun is positioned on March 21st calculated from the position of the Earth.
What's the ♈ point ?
A.A. 2021-2022 Prof. Antonio Capone - Particle and AstroParcle Physics 32
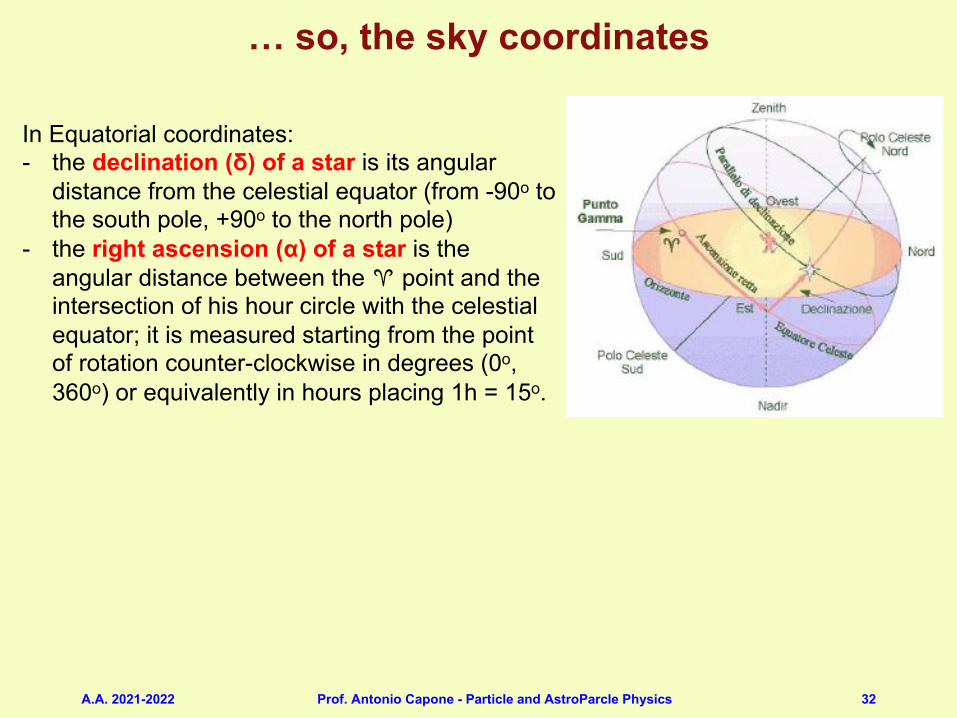
In Equatorial coordinates:- the declination (δ) of a star is its angular
distance from the celestial equator (from -90o to the south pole, +90o to the north pole)
- the right ascension (α) of a star is the angular distance between the ♈ point and the intersection of his hour circle with the celestial equator; it is measured starting from the point of rotation counter-clockwise in degrees (0o, 360o) or equivalently in hours placing 1h = 15o.
… so, the sky coordinates

A.A. 2021-2022 Prof. Antonio Capone - Particle and AstroParcle Physics 33
The density matter is supposed to be uniform into a narrow band, in "declination" (-90o,+90o) that spans on the full range in "right ascension" (-180o,+180o). If the C.R. sources are uniformly distributed in the sky the arrival directions of C.R. should be isotropic. In this case we can define the average of C.R. for an interval "i" in declination as
𝑛!"#$%"&$ =
∑!"#$ (%,!
'()*+,(-
)and in each "i,j" bin
(declination, right ascension) we expect to find
𝑛!,+$,-$./$0 = 𝑛!
"#$%"&$ ± 𝑛!"#$%"&$
Cosmic Rays isotropy/anisotropy
A.A. 2021-2022 Prof. Antonio Capone - Particle and AstroParcle Physics 34
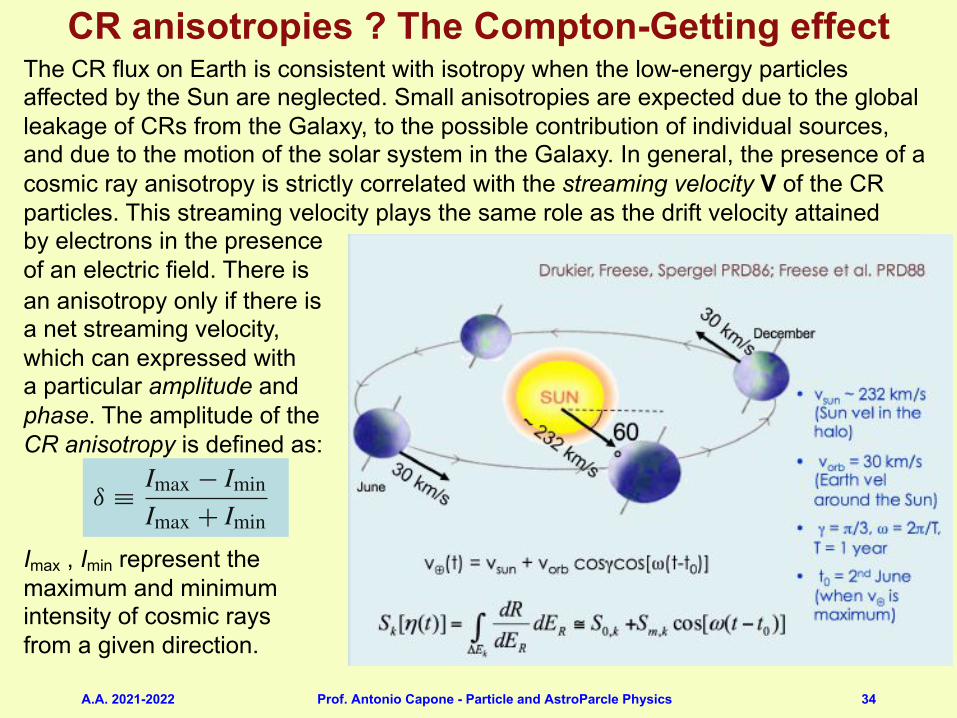
CR anisotropies ? The Compton-Getting effectThe CR flux on Earth is consistent with isotropy when the low-energy particles affected by the Sun are neglected. Small anisotropies are expected due to the global leakage of CRs from the Galaxy, to the possible contribution of individual sources, and due to the motion of the solar system in the Galaxy. In general, the presence of a cosmic ray anisotropy is strictly correlated with the streaming velocity V of the CR particles. This streaming velocity plays the same role as the drift velocity attained by electrons in the presence of an electric field. There isan anisotropy only if there is a net streaming velocity, which can expressed with a particular amplitude and phase. The amplitude of the CR anisotropy is defined as:
Imax , Imin represent the maximum and minimum intensity of cosmic rays from a given direction.
5.7 Anisotropies due to the Diffusion 153
is an anisotropy only if there is a net streaming velocity, which can expressed witha particular amplitude and phase. The amplitude of the CR anisotropy is defined as:
δ ≡ Imax − Imin
Imax + Imin(5.48)
where Imax, Imin represent the maximum andminimum intensity of cosmic rays froma given direction. Usually, the arrival direction of CRs is referred to the equatorialcoordinate system, see Extras # 2.
By simple dimensional arguments, the amplitude of the anisotropy depends on thestreaming velocity amplitude asV ∼ δc. It can be demonstrated using Lorentz invari-ance (Kachelriess 2008) that, for a flux of particles (such as the cosmic rays) withdifferential energy spectrum Φ(E) ∝ E−α , the streaming speed and the anisotropyamplitude are correlated through the spectral index α by:
V =[
δ
(α + 2)
]c (5.49)
Because the CR escape probability increases with energy, Eq. (5.40), the diffu-sion coefficient D is energy dependent as well. This corresponds to an increases ofthe streaming velocity V , according to Eq. (5.47). The expectation from our simpleconsiderations is that the amplitude δ of the anisotropy increases with energy. Thissimple prediction is confirmed by accurate calculations (Candia et al. 2003). Valuesas large as δ ∼ 10−1 can be obtained, depending on particle energy and on thestrength and structure of the galactic magnetic field.
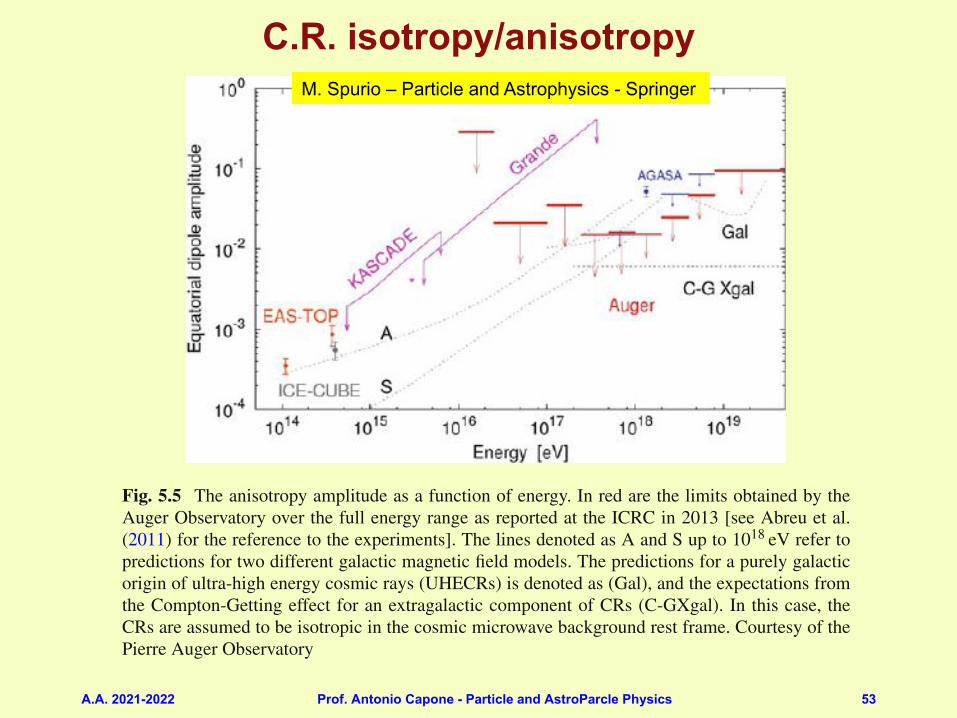
Different predictions for an anisotropy amplitude of a dipole type (when the arrivalCR directions are expressed in the equatorial coordinate system) as a function of theCR energies are reported in Fig. 5.5. A dipole anisotropy is a form of anisotropy dueto the difference in the arrival intensity of particles from opposite directions, usuallyattributed to the motion of the observer relative to the source. As the CR diffusiondepends on the modeling of the galactic magnetic fields, two predictions (labeledwith “A” and “S” in the figure) refer to two different configurations of the galacticmagnetic fields. In the region of Ultra High Energy Cosmic Rays, above∼ 1018 eV, apossible galactic origin of these particles (model labeled with “Gal”) would producean anisotropy of large amplitude, δ ∼ 0.1. A much smaller anisotropy amplitude isexpected if the sources of CR is of extragalactic origin, as indicated by the modellabeled with “C-G Xgal.” The level of different anisotropy amplitudes can be testedwith experiments measuring the arrival direction of CRs in the region around andabove the knee.
From the experimental point of view, because of the small amplitude of theexpected anisotropy, a large data sample is necessary in order to have a statisticallysignificant measurement of (5.48). Many experimental studies on dipole anisotropies(also called large-scale anisotropies) are based on the fact that the exposure of thedetectors is uniform in the right ascension coordinate RA. The uniformity in theexposure guarantees that there is not bias from any particular sky region due toexperimental effects.
A.A. 2021-2022 Prof. Antonio Capone - Particle and AstroParcle Physics 35
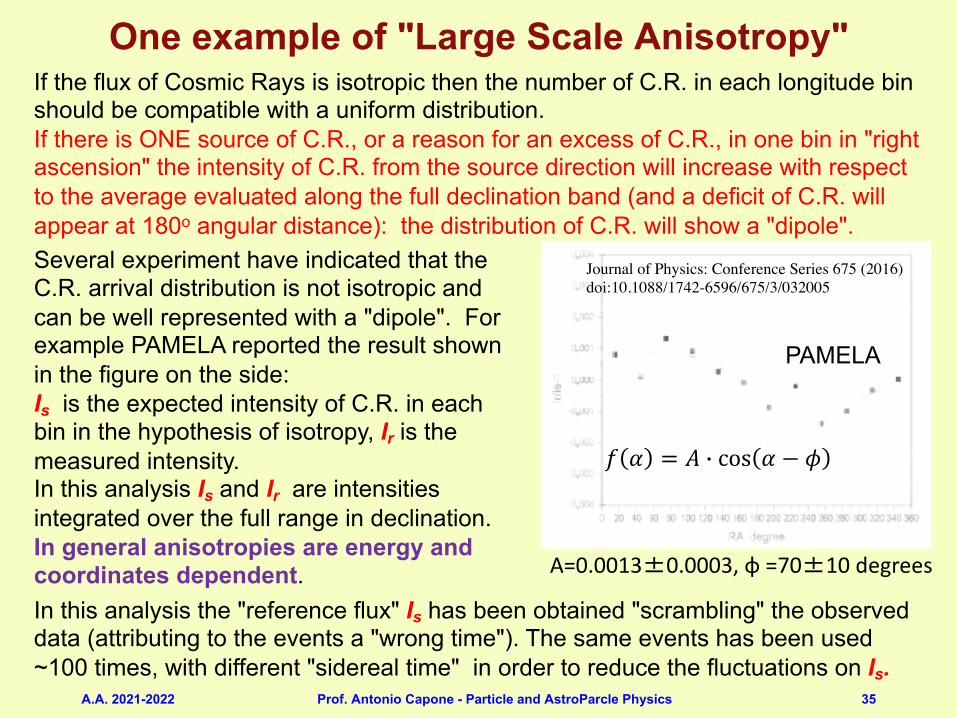
If the flux of Cosmic Rays is isotropic then the number of C.R. in each longitude bin should be compatible with a uniform distribution.If there is ONE source of C.R., or a reason for an excess of C.R., in one bin in "right ascension" the intensity of C.R. from the source direction will increase with respect to the average evaluated along the full declination band (and a deficit of C.R. will appear at 180o angular distance): the distribution of C.R. will show a "dipole".
100 times more events than the experimental one. These distributions were constructed in the
equatorial coordinate system. In our case, we consider a single coordinate only: a right ascension,
which varies from 0 to 360 degrees. All events distributed along a declination coordinate were
summarized.
Since the existence of the dipole anisotropy based on the ground-based observations is not
questioned, so far the task, as mentioned above, was to obtain its characteristics: the amplitude
and phase. We have approximately 600,000 coordinate values of right ascensions, reflecting the
direction of incidence of the particles in the experimental data.
The basis of the analysis is the hypothesis that there is the dipole in the experimental
distribution. For this reason the size of an integration bin equal to 180 degrees was chosen. In
our approach this bin reproduces an integration radius in HEALPIx method for the anisotropy
study in 3D map [16]. All events within this bin were integrated. The bin centre was shifting
through the entire range from 0 to 360 degrees with 5 degree step and the integration procedure
was repeated at each step. Then we took an average value for each 6 bins (we had 72 values in
total) and got 12 values which are shown in figure 1. The obtained dipole is demonstrated in
terms of relative intensities: Ir is the experimental one and Is is the reference one. The number
of events in the reference distribution was normalized to the experimental one.
Figure 1. The Ir/Is-1 depending on RA. Ir is the real intensity, Is is the simulated isotropic
intensity. The red line is a fit by the sine wave.
4. The results
The results were obtained by an approximation of the values in figure 1 by a sine function
with the Levenberg-Marquardt algorithm [17]. The amplitude A and phase � (a position of the
maximum) were obtained from this approximation: A=0.0013±0.0003, � =70±10 degree. For
the value of amplitude the factor k=2/⇡ (the di↵erence between amplitude of the real dipole and
the one obtained by the approximation) was taking into account. Uncertainties are the results
3
Several experiment have indicated that the C.R. arrival distribution is not isotropic and can be well represented with a "dipole". For example PAMELA reported the result shown in the figure on the side:Is is the expected intensity of C.R. in each bin in the hypothesis of isotropy, Ir is the measured intensity.In this analysis Is and Ir are intensities integrated over the full range in declination.In general anisotropies are energy and coordinates dependent.
Journal of Physics: Conference Series 675 (2016)doi:10.1088/1742-6596/675/3/032005
PAMELA
𝑓 𝛼 = 𝐴 ' cos 𝛼 − 𝜙
A=0.0013±0.0003, φ =70±10 degrees
One example of "Large Scale Anisotropy"
In this analysis the "reference flux" Is has been obtained "scrambling" the observed data (attributing to the events a "wrong time"). The same events has been used ~100 times, with different "sidereal time" in order to reduce the fluctuations on Is.

A.A. 2021-2022 Prof. Antonio Capone - Particle and AstroParcle Physics 36
CR flux anisotropy vs detector position and energy
A.A. 2021-2022 Prof. Antonio Capone - Particle and AstroParcle Physics 37
R. Iuppa RICAP 2013. Roma - May 23rd, 2013
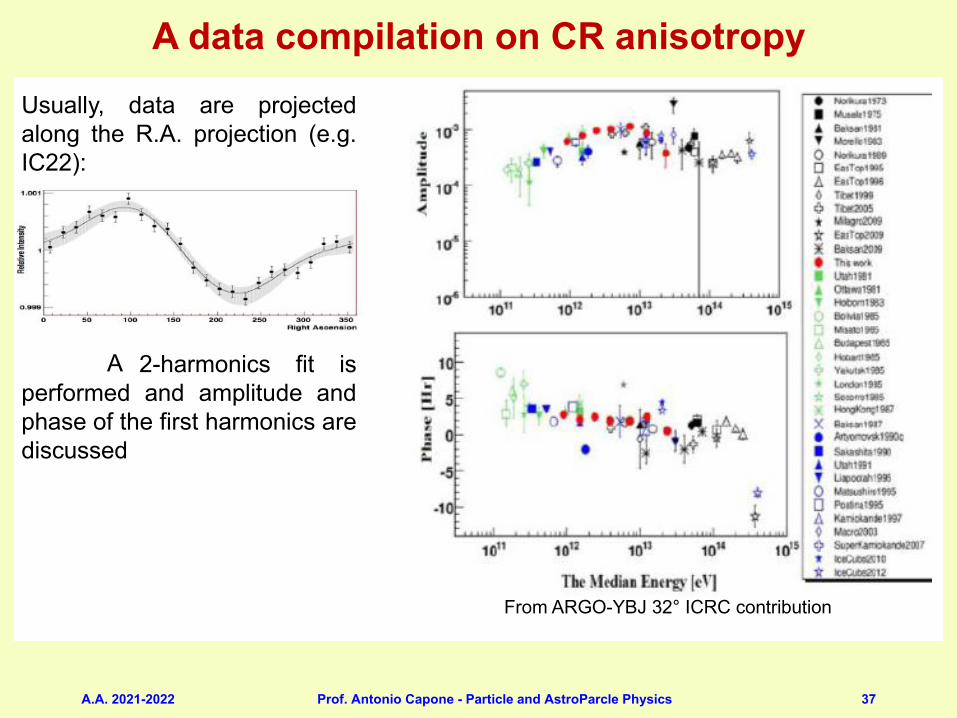
A data compilation
From ARGO-YBJ 32° ICRC contribution
Usually, data are projected along the R.A. projection (e.g. IC22):
Then a 2-harmonics fit is performed and amplitude and phase of the first harmonics are discussed (see the compilation for reference). They are generally interpreted as important signature, as the dipole is a trace of the source distribution. BUT…
A data compilation on CR anisotropy
A

A.A. 2021-2022 Prof. Antonio Capone - Particle and AstroParcle Physics 38
Other examples of measured C.R. anisotropy
A.A. 2021-2022 Prof. Antonio Capone - Particle and AstroParcle Physics 39
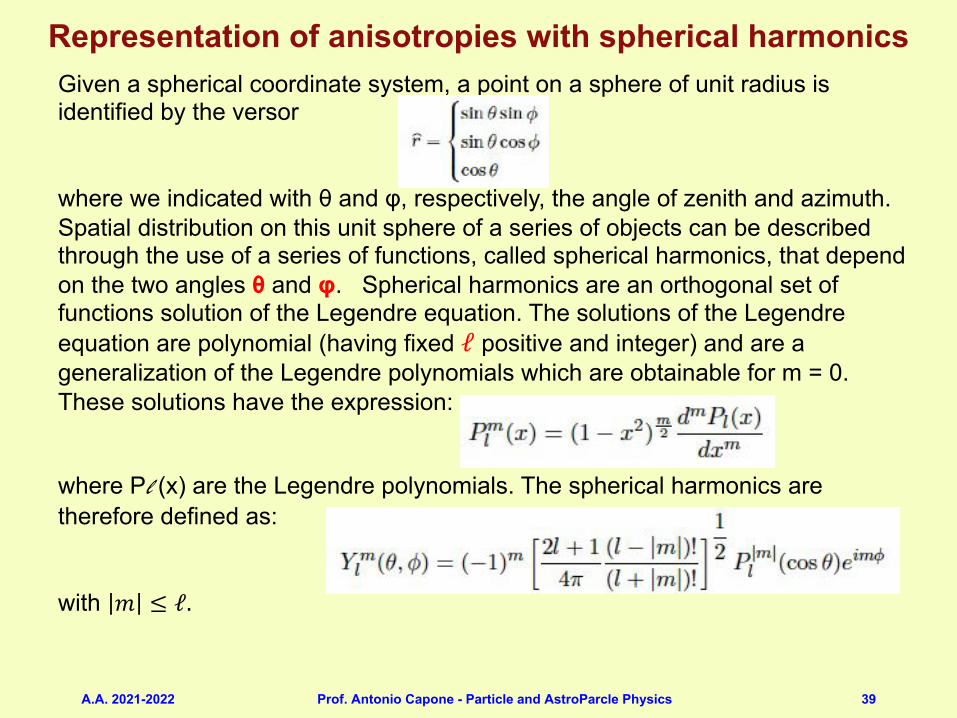
Representation of anisotropies with spherical harmonicsGiven a spherical coordinate system, a point on a sphere of unit radius isidentified by the versor
where we indicated with θ and φ, respectively, the angle of zenith and azimuth. Spatial distribution on this unit sphere of a series of objects can be described through the use of a series of functions, called spherical harmonics, that depend on the two angles θ and φ. Spherical harmonics are an orthogonal set of functions solution of the Legendre equation. The solutions of the Legendre equation are polynomial (having fixed ℓ positive and integer) and are a generalization of the Legendre polynomials which are obtainable for m = 0. These solutions have the expression:
where Pl (x) are the Legendre polynomials. The spherical harmonics are therefore defined as:
with 𝑚 ≤ ℓ.
A.A. 2021-2022 Prof. Antonio Capone - Particle and AstroParcle Physics 40
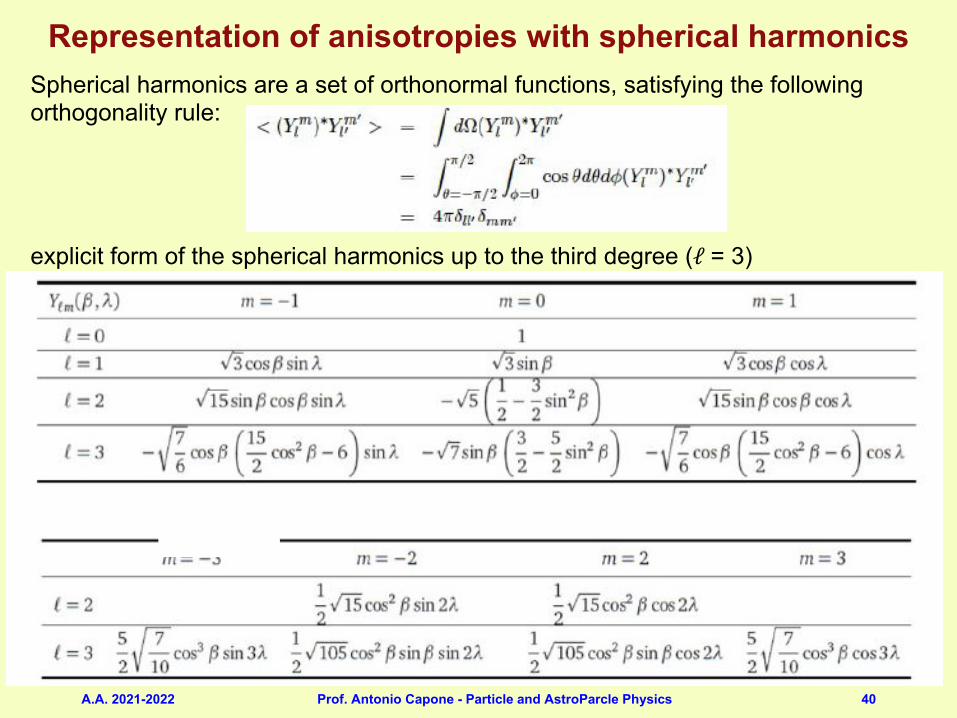
Representation of anisotropies with spherical harmonicsSpherical harmonics are a set of orthonormal functions, satisfying the following orthogonality rule:
explicit form of the spherical harmonics up to the third degree (ℓ = 3)
A.A. 2021-2022 Prof. Antonio Capone - Particle and AstroParcle Physics 41
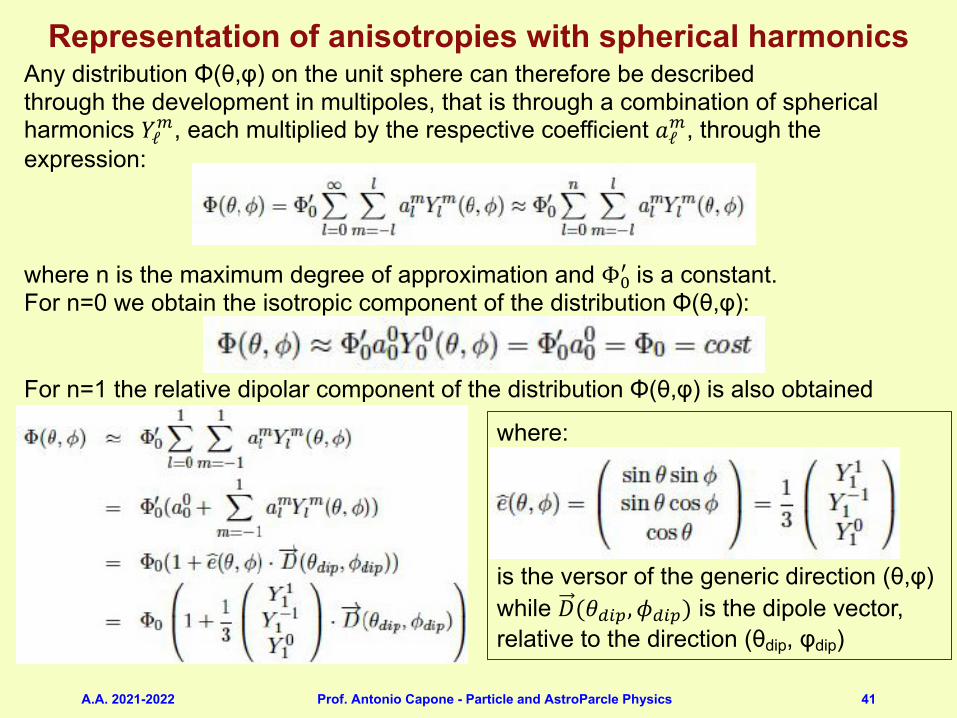
Representation of anisotropies with spherical harmonicsAny distribution Φ(θ,φ) on the unit sphere can therefore be describedthrough the development in multipoles, that is through a combination of spherical harmonics 𝑌ℓ2, each multiplied by the respective coefficient 𝑎ℓ2, through the expression:
where n is the maximum degree of approximation and Φ34 is a constant.
For n=0 we obtain the isotropic component of the distribution Φ(θ,φ):
For n=1 the relative dipolar component of the distribution Φ(θ,φ) is also obtained
where:
is the versor of the generic direction (θ,φ) while 𝐷(𝜃0!-, 𝜙0!-) is the dipole vector,relative to the direction (θdip, φdip)
A.A. 2021-2022 Prof. Antonio Capone - Particle and AstroParcle Physics 42
Representation of anisotropies with spherical harmonics
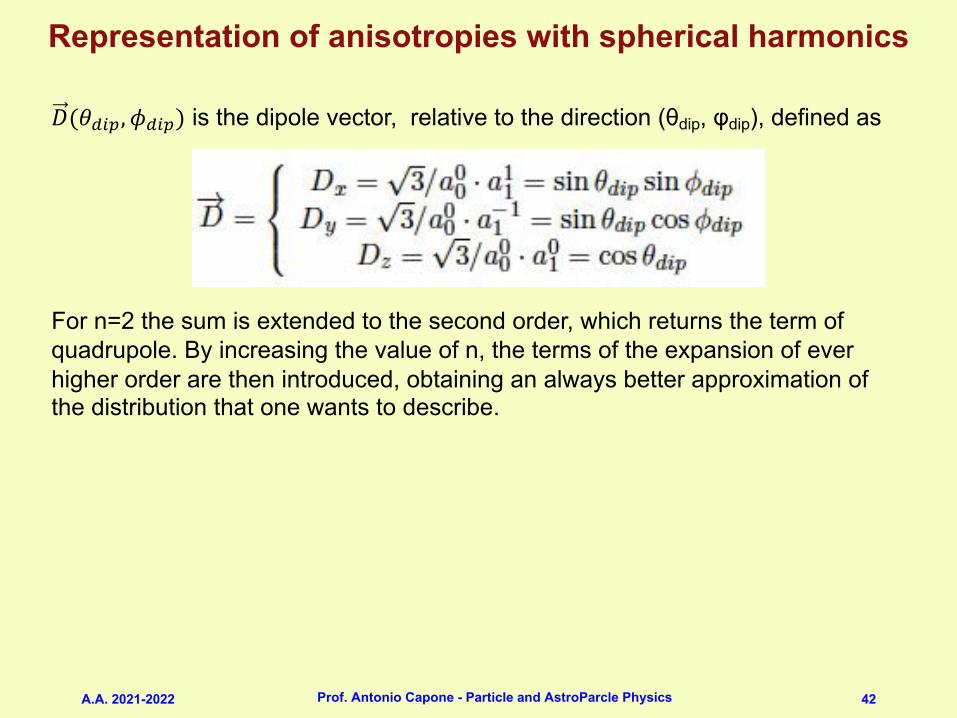
𝐷(𝜃0!-, 𝜙0!-) is the dipole vector, relative to the direction (θdip, φdip), defined as
For n=2 the sum is extended to the second order, which returns the term ofquadrupole. By increasing the value of n, the terms of the expansion of ever higher order are then introduced, obtaining an always better approximation of the distribution that one wants to describe.
A.A. 2021-2022 Prof. Antonio Capone - Particle and AstroParcle Physics 43
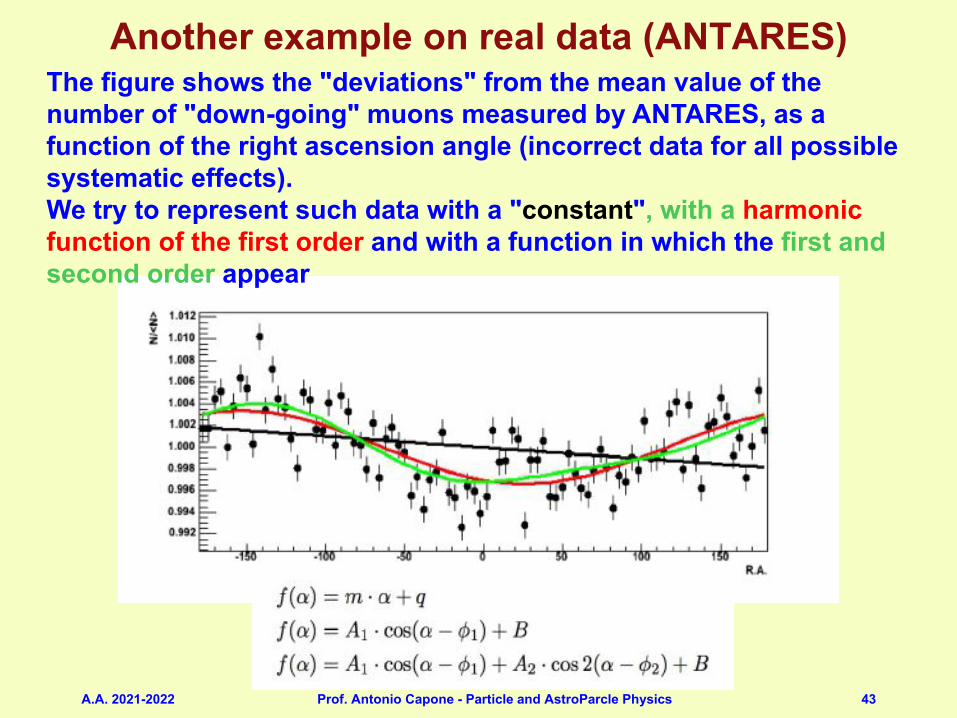
Another example on real data (ANTARES)The figure shows the "deviations" from the mean value of the number of "down-going" muons measured by ANTARES, as a function of the right ascension angle (incorrect data for all possible systematic effects).We try to represent such data with a "constant", with a harmonic function of the first order and with a function in which the first and second order appear
A.A. 2021-2022 Prof. Antonio Capone - Particle and AstroParcle Physics 44
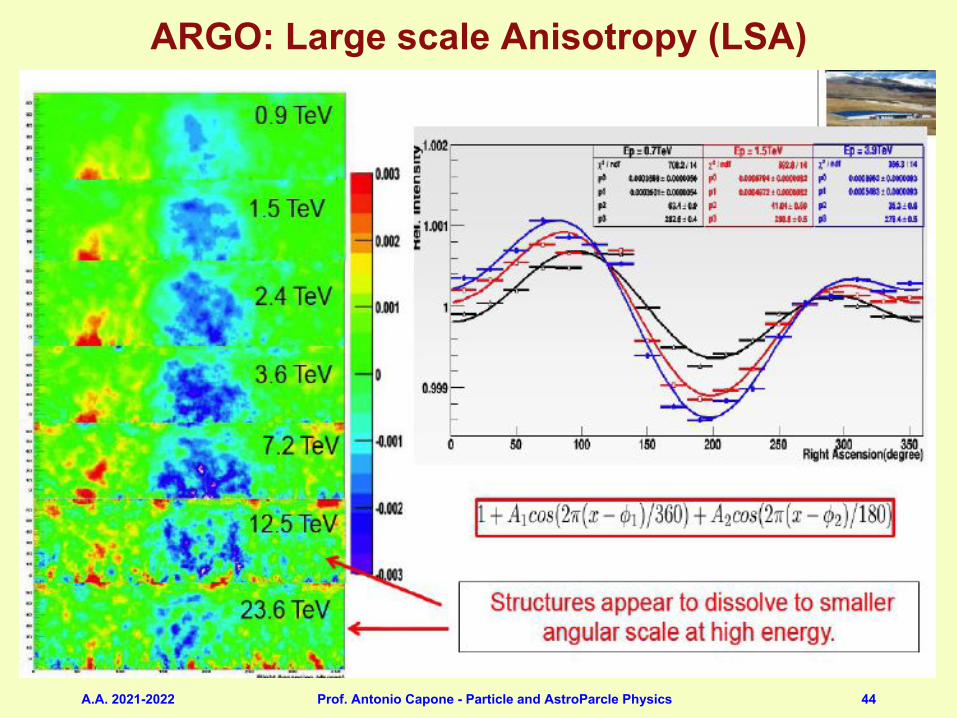
ARGO: Large scale Anisotropy (LSA)

A.A. 2021-2022 Prof. Antonio Capone - Particle and AstroParcle Physics 45
ARGO: Medium Scale Anisotropy (MSA)
A.A. 2021-2022 Prof. Antonio Capone - Particle and AstroParcle Physics 46
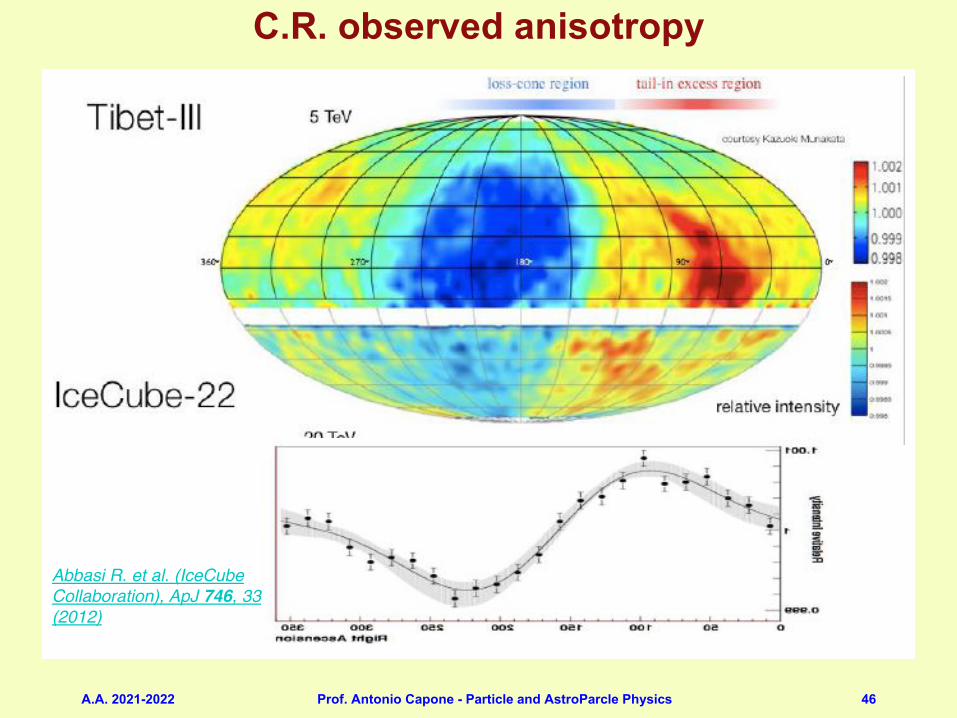
C.R. observed anisotropyR. Iuppa RICAP 2013. Roma - May 23rd, 2013
Cosmic ray anisotropy 5
Abbasi R. et al. (IceCube Collaboration), ApJ 746, 33 (2012)

A.A. 2021-2022 Prof. Antonio Capone - Particle and AstroParcle Physics 47
Recent observations of CR anisotropy
R. Iuppa RICAP 2013. Roma - May 23rd, 2013
Recent observations of the CR anisotropy
6
Tibet AS-γ - Science 20 October 2006: Vol. 314 no. 5798 pp. 439-443
MILAGRO - 2009 ApJ 698 2121
Super-Kamiokande – ICRC 2007 Proceedings
ICE-CUBE - 2010 ApJ 718 L194
ARGO-YBJ– ICRC 2011 Proceedings
10 TeV 5 TeV
2 TeV
4 TeV
20 TeV
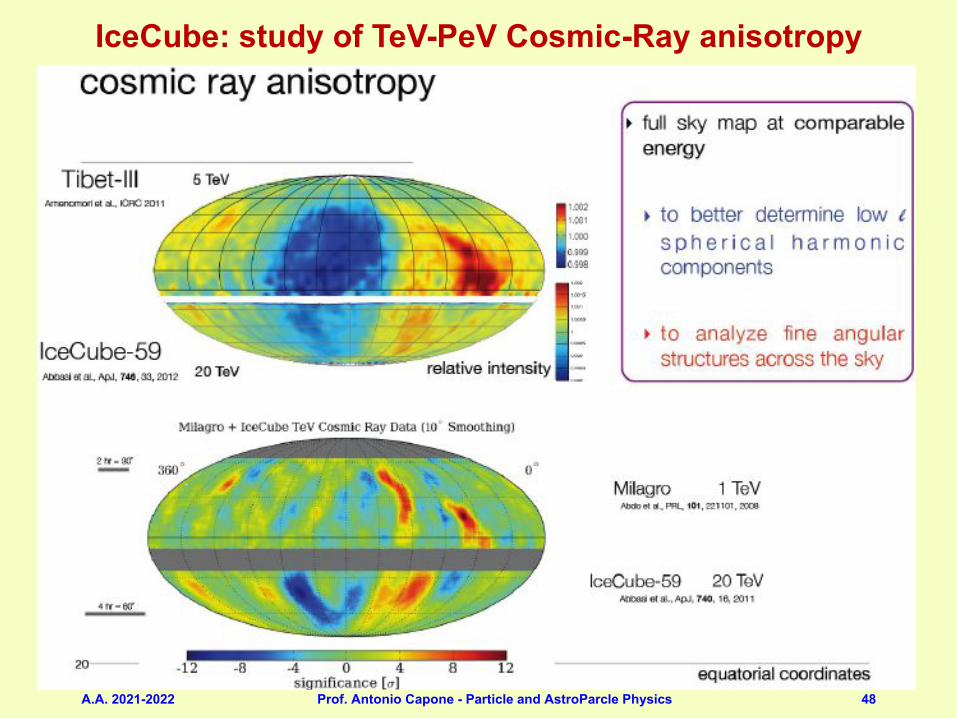
A.A. 2021-2022 Prof. Antonio Capone - Particle and AstroParcle Physics 48
IceCube: study of TeV-PeV Cosmic-Ray anisotropy

A.A. 2021-2022 Prof. Antonio Capone - Particle and AstroParcle Physics 49
Anisotropy as a function of CR Energy
R. Iuppa RICAP 2013. Roma - May 23rd, 2013
LSA as a function of the primary energy 7
0.9 TeV
1.5 TeV
2.4 TeV
3.6 TeV
7.2 TeV
12.5 TeV
23.6 TeV
Tibet ASγ
Anisotropy seems to disappear. From the absence of the CG effect they infer the corotation of GCR with the GMF environment
ARGO-YBJ
A.A. 2021-2022 Prof. Antonio Capone - Particle and AstroParcle Physics 50
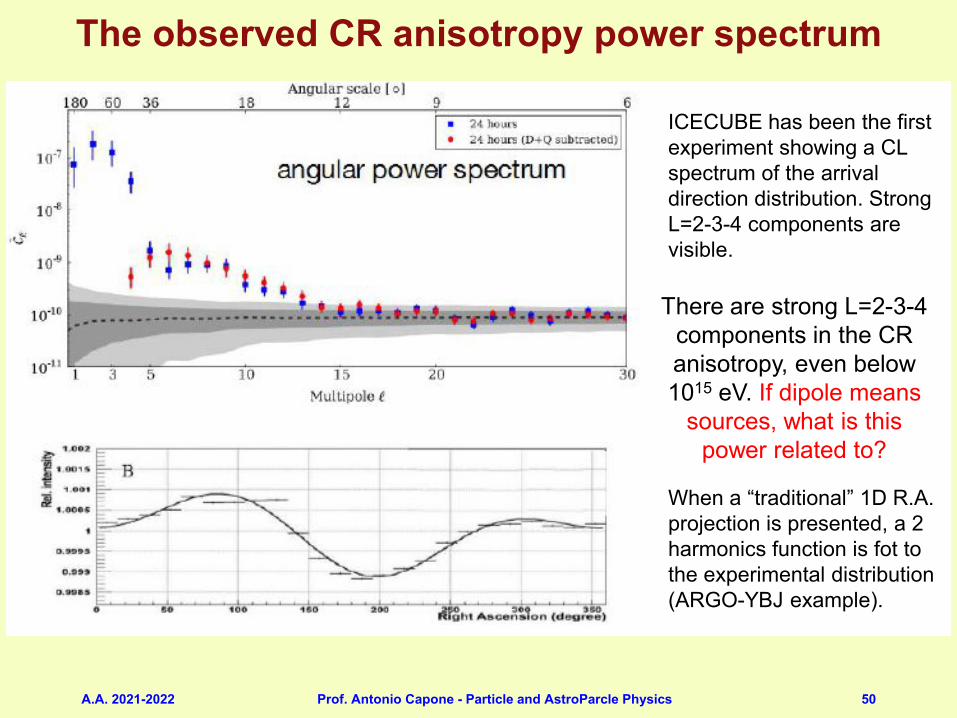
The observed CR anisotropy power spectrum
R. Iuppa RICAP 2013. Roma - May 23rd, 2013
4-pole, 6-pole and 8-pole (the old 2° harmonics…)
ICECUBE has been the first experiment showing a CL spectrum of the arrival direction distribution. Strong L=2-3-4 components are visible.
When a “traditional” 1D R.A. projection is presented, a 2 harmonics function is fot to the experimental distribution (ARGO-YBJ example).
There are strong L=2-3-4 components in the CR anisotropy, even below 1015 eV. If dipole means
sources, what is this power related to?

A.A. 2021-2022 Prof. Antonio Capone - Particle and AstroParcle Physics 51
R. Iuppa RICAP 2013. Roma - May 23rd, 2013
What is behind the intermediate scale anisotropies? Stochastic MHD approach
Giacinti& Sigl Phys. Rev. Lett. 109, 071101 (2012)
Energy-dependent small scale anisotropies naturally arise from the local concrete realization of the turbulent magnetic field within the cosmic ray scattering length.
The CR arrival distribution at Earth contains multipoles:
a
Dipole amplitude
Dipole direction
Direction after the propagation of the particle with initial direction n. It depends
on the magnetic field turbulence spectrum!
There is a connection between the observed angular power spectrum and the magnetic field turbulence spectrum.
What can we learn from the observed anisotropies ?
A.A. 2021-2022 Prof. Antonio Capone - Particle and AstroParcle Physics 52
R. Iuppa RICAP 2013. Roma - May 23rd, 2013
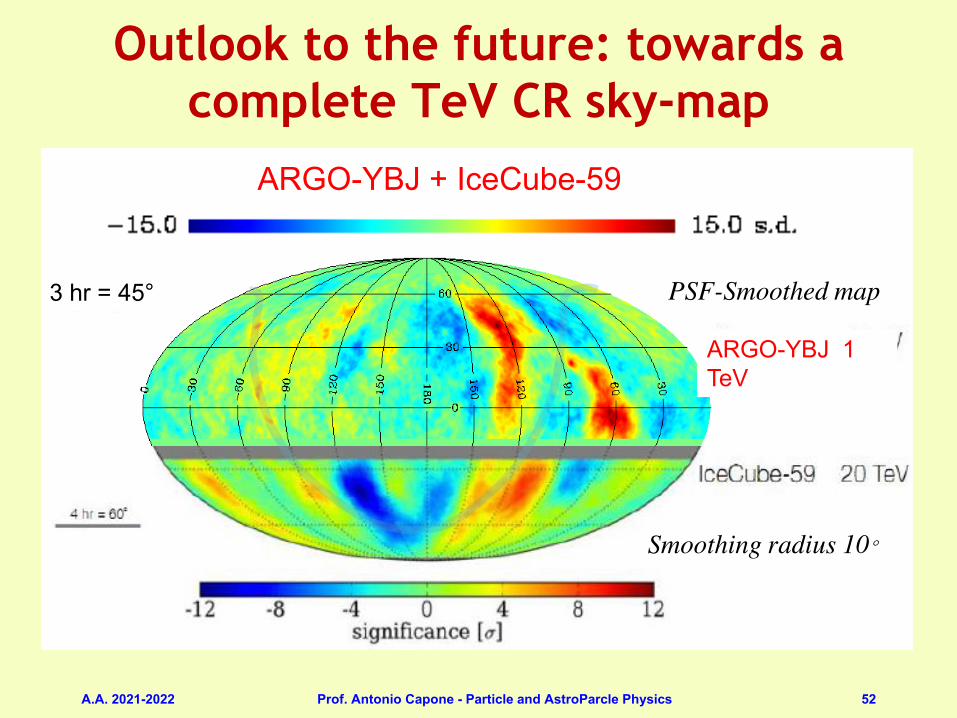
Outlook to the future: towards a complete TeV CR sky-map
19
ARGO-YBJ + IceCube-59
ARGO-YBJ 1 TeV
3 hr = 45°
Smoothing radius 10°
PSF-Smoothed map
Outlook to the future: towards a complete TeV CR sky-map
A.A. 2021-2022 Prof. Antonio Capone - Particle and AstroParcle Physics 53
154 5 Diffusion of Cosmic Rays in the Galaxy
As an example, let us consider the n events that a particular experimental apparatushas classified as CRs in the energy range between E and E + ∆E. The n events arethen analyzed in terms of the so-called Rayleigh formalism of harmonic analysis.The Rayleigh formalism gives the amplitudeA (that can be identified with the δ givenin Eq.5.48) and phase φ of the first harmonic, and additionally the probability P fordetecting a spurious amplitude due to fluctuations from a sample of n events whichare drawn from a uniform distribution (Mardia and Jupp 1999). Two quantities canbe obtained from the dataset, with the sum includes n right ascension values RAi:
S = 2n
n∑
i=1
sin(RAi), C = 2n
n∑
i=1
cos(RAi). (5.50)
If the CR arrival directions are completely random, clearly S = C = 0. In thepresence of anisotropy, the amplitude A and the phase Φ of the first harmonic aregiven by:
A =√C2 + S2; φ = arctan
SC. (5.51)
The results of some experiments measuring CRs at different energies are reportedin Fig. 5.5. Few evidences on large-scale anisotropies were reported from extensive
Fig. 5.5 The anisotropy amplitude as a function of energy. In red are the limits obtained by theAuger Observatory over the full energy range as reported at the ICRC in 2013 [see Abreu et al.(2011) for the reference to the experiments]. The lines denoted as A and S up to 1018 eV refer topredictions for two different galactic magnetic field models. The predictions for a purely galacticorigin of ultra-high energy cosmic rays (UHECRs) is denoted as (Gal), and the expectations fromthe Compton-Getting effect for an extragalactic component of CRs (C-GXgal). In this case, theCRs are assumed to be isotropic in the cosmic microwave background rest frame. Courtesy of thePierre Auger Observatory
C.R. isotropy/anisotropyM. Spurio – Particle and Astrophysics - Springer
A.A. 2021-2022 Prof. Antonio Capone - Particle and AstroParcle Physics 54
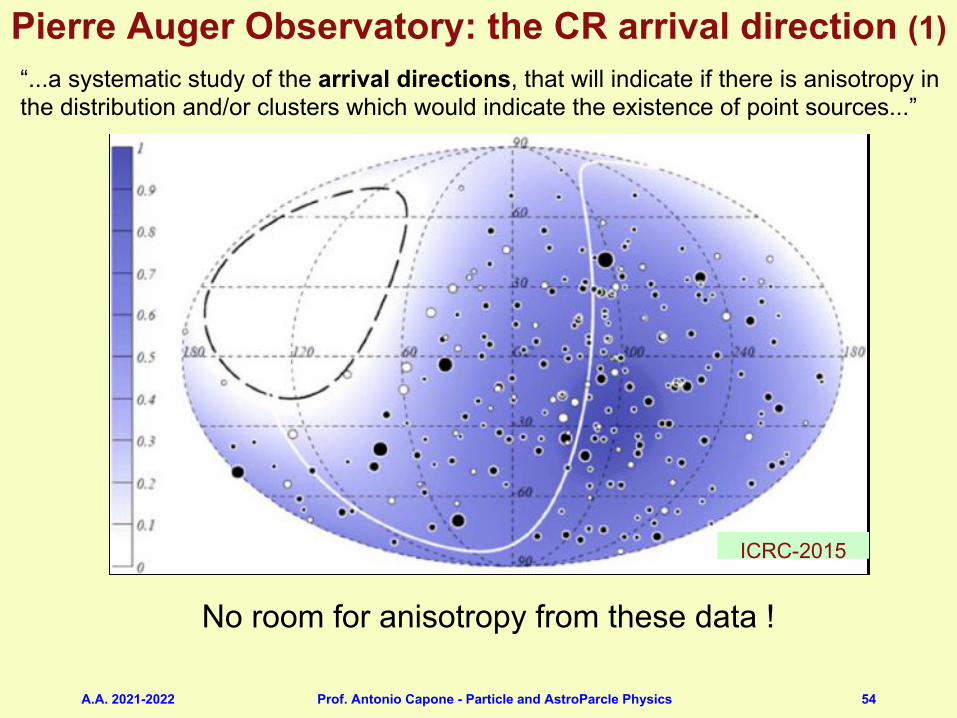
Pierre Auger Observatory: the CR arrival direction (1)2.3 “...a systematic study of the arrival directions, that will indicate if there is anisotropy in the distribution and/or clusters which would indicate the existence of point sources...”
17
ICRC-2015
“...a systematic study of the arrival directions, that will indicate if there is anisotropy in the distribution and/or clusters which would indicate the existence of point sources...”
No room for anisotropy from these data !
A.A. 2021-2022 Prof. Antonio Capone - Particle and AstroParcle Physics 55
Pierre Auger Observatory, the CR arrival direction (2)Sept. 2017: new result !!COSMIC RAYS
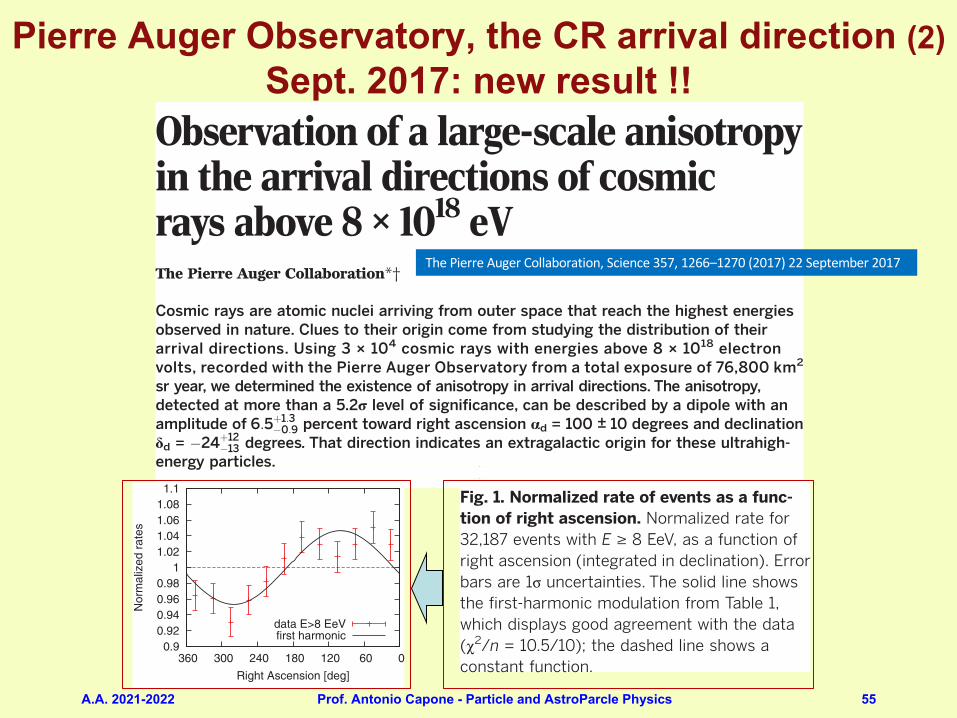
Observation of a large-scale anisotropyin the arrival directions of cosmicrays above 8 × 10¹⁸ eVThe Pierre Auger Collaboration*†
Cosmic rays are atomic nuclei arriving from outer space that reach the highest energiesobserved in nature. Clues to their origin come from studying the distribution of theirarrival directions. Using 3 × 10⁴ cosmic rays with energies above 8 × 10¹⁸ electronvolts, recorded with the Pierre Auger Observatory from a total exposure of 76,800 km2
sr year, we determined the existence of anisotropy in arrival directions. The anisotropy,detected at more than a 5.2s level of significance, can be described by a dipole with anamplitude of 6:5þ1:3
"0:9 percent toward right ascension ad = 100 ± 10 degrees and declinationdd = "24þ12
"13 degrees. That direction indicates an extragalactic origin for these ultrahigh-energy particles.
Particles with energies ranging from below109 eV up to beyond 1020 eV, known as cos-mic rays, constantly hit Earth’s atmosphere.The flux of these particles steeply decreasesas their energy increases; for energies above
10 EeV (1 EeV ≡ 1018 eV), the flux is about oneparticle per km2 per year. The existence of cosmicrayswith suchultrahigh energies has been knownfor more than 50 years (1, 2), but the sites andmechanisms of their production remain a mys-tery. Information about their origin can be ob-tained from the study of the energy spectrumand the mass composition of cosmic rays. How-ever, the most direct evidence of the location ofthe progenitors is expected to come from studiesof the distribution of their arrival directions. In-dications of possible hot spots in arrival direc-tions for cosmic rays with energies above 50 EeVhave been reported by the Pierre Auger and Tel-escope Array Collaborations (3, 4), but the statis-tical significance of these results is low.We reportthe observation, significant at a level ofmore than5.2s, of a large-scale anisotropy in arrival direc-tions of cosmic rays above 8 EeV.Above 1014 eV, cosmic rays entering the atmo-
sphere create cascades of particles (called exten-sive air-showers) that are sufficiently large to reachthe ground. At 10 EeV, an extensive air-shower(hereafter shower) contains ~1010 particles spreadover an area of ~20 km2 in a thin disc movingclose to the speed of light. The showers contain anelectromagnetic component (electrons, positrons,and photons) and a muonic component that canbe sampled using arrays of particle detectors.Charged particles in the shower also excite ni-trogen molecules in the air, producing fluores-cence light that can be observed with telescopesduring clear nights.The Pierre AugerObservatory, located near the
city of Malargüe, Argentina, at latitude 35.2°S, isdesigned to detect showers produced by primary
cosmic rays above 0.1 EeV. It is a hybrid system, acombination of an array of particle detectors anda set of telescopes used to detect the fluorescencelight. Our analysis is based on data gathered from1600 water-Cherenkov detectors deployed overan area of 3000 km2 on a hexagonal grid with1500-m spacing. Each detector contains 12metrictons of ultrapure water in a cylindrical container,1.2mdeepand 10m2 inarea, viewedby three9-inchphotomultipliers. A full description of the obser-vatory, together with details of the methods usedto reconstruct the arrival directions and energiesof events, has been published (5).It is difficult to locate the sources of cosmic
rays, as they are charged particles and thus in-teract with themagnetic fields in our Galaxy andthe intergalactic medium that lies between thesources and Earth. They undergo angular deflec-tionswith amplitude proportional to their atomicnumber Z, to the integral along the trajectory ofthemagnetic field (orthogonal to the direction ofpropagation), and to the inverse of their energyE. At E ≈ 10 EeV, the best estimates for the massof the particles (6) lead to a mean value for Z be-tween 1.7 and 5. The exact number derived isdependent on extrapolations of hadronic physics,which are poorly understood because they liewell beyond the observations made at the LargeHadron Collider. Magnetic fields are not wellconstrained bydata, but if we adopt recentmodelsof the galactic magnetic field (7, 8), typical valuesof the deflections of particles crossing the galaxyare a few tens of degrees forE/Z= 10 EeV, depend-ing on the direction considered (9). Extragalacticmagnetic fields may also be relevant for cosmicrays propagating through intergalactic space (10).However, even if particles from individual sourcesare strongly deflected, it remains possible that an-isotropies in the distribution of their arrival di-rectionswill be detectable on large angular scales,provided the sources have a nonuniform spatialdistribution or, in the case of a single dominantsource, if the cosmic-ray propagation is diffusive(11–14).
Searches for large-scale anisotropies are con-ventionally made by looking for nonuniformitiesin the distribution of events in right ascension(15, 16) because, for arrays of detectors that op-erate with close to 100% efficiency, the total expo-sure as a function of this angle is almost constant.The nonuniformity of the detected cosmic-ray fluxin declination (fig. S1) imprints a characteristicnonuniformity in the distribution of azimuthangles in the local coordinate systemof the array.From this distribution it becomes possible to ob-tain information on the three components of adipolar model.
Event observations, selection,and calibration
We analyzed data recorded at the Pierre AugerObservatory between 1 January 2004 and 31August 2016, from a total exposure of about76,800 km2 sr year. The 1.2-m depth of the water-Cherenkov detectors enabled us to record eventsat a useful rate out to large values of the zenithangle, q.We selected eventswith q <80° enablingthe declination range −90° < d < 45° to be ex-plored, thus covering 85% of the sky.We adopted4 EeV as the threshold for selection; above thatenergy, showers falling anywhere on the arrayare detectedwith 100% efficiency (17). The arrivaldirections of cosmic rays were determined fromthe relative arrival times of the shower front ateach of the triggered detectors; the angular res-olution was better than 1° at the energies con-sidered here (5).Twomethods of reconstruction have beenused
for showers with zenith angles above and below60° (17, 18). These have to account for the effectsof the geomagnetic field (17, 19) and, in the caseof showers with q < 60°, also for atmospheric ef-fects (20) because systematic modulations to therates could otherwise be induced (see supple-mentary materials). The energy estimators forboth data sets were calibrated using events de-tected simultaneously by the water-Cherenkovdetectors and the fluorescence telescopes, witha quasi-calorimetric determination of the energycoming from the fluorescencemeasurements. Thestatistical uncertainty in the energy determina-tion is <16% above 4EeV and <12%above 10 EeV,whereas the systematic uncertainty on the abso-lute energy scale, common to both data sets, is14% (21). Evidence that the analyses of the eventswith q < 60° and of those with 60° < q < 80° areconsistentwith each other comes from the energyspectra determined for the two angular bands.The spectra agree within the statistical uncer-tainties over the energy range of interest (22).We consider events in twoenergy ranges, 4EeV<
E < 8 EeV and E ≥ 8 EeV, as adopted in previousanalyses [e.g., (23–25)]. The bin limits follow thosechosenpreviously in (26, 27). Themedian energiesfor these bins are 5.0EeVand 11.5EeV, respectively.In earlier work (23–25), the event selection re-quired that the station with the highest signalbe surrounded by six operational detectors—ademanding condition. The number of triggeredstations is greater than four for 99.2%of all eventsabove 4 EeV and for 99.9% of events above 8 EeV,
RESEARCH
The Pierre Auger Collaboration, Science 357, 1266–1270 (2017) 22 September 2017 1 of 5
*Author names and affiliations appear at the end of this paper.†Email: [email protected]
on October 31, 2017
http://science.sciencem
ag.org/Downloaded from
making it possible to use events with only fiveactive detectors around the one with the largestsignal. With this more relaxed condition, the ef-fective exposure is increased by 18.5%, and thetotal number of events increases correspond-ingly from 95,917 to 113,888. The reconstructionaccuracy for the additional events is sufficientfor our analysis (see supplementary materialsand fig. S4).
Rayleigh analysis in right ascension
A standard approach for studying the large-scaleanisotropies in the arrival directions of cosmicrays is to perform a harmonic analysis in rightascension, a. The first-harmonic Fourier compo-nents are given by
aa ¼ 2N
XN
i¼1
wi cos ai
ba ¼ 2N
XN
i¼1
wi sin ai ð1Þ
The sums run over all N detected events, eachwith right ascension ai, with the normalizationfactor N ¼
XN
i¼1wi. The weights, wi , are intro-
duced to account for small nonuniformities inthe exposure of the array in right ascension andfor the effects of a tilt of the array toward thesoutheast (see supplementarymaterials). Theaver-age tilt between the vertical and the normal tothe plane onwhich the detectors are deployed is0.2°, so that the effective area of the array is slight-ly larger for showers arriving from the downhilldirection. This introduces aharmonic dependencein azimuth of amplitude 0.3% × tan q to the ex-posure. The effective aperture of the array is de-termined everyminute. Because the exposure hasbeen accumulated over more than 12 years, thetotal aperture is modulated by less than ~0.6%as the zenith of the observatory moves in rightascension. Events are weighted by the inverse
of the relative exposure to correct these effects(fig. S2).The amplitude ra and phase ϕa of the first
harmonic of the modulation are obtained from
ra ¼ffiffiffiffiffiffiffiffiffiffiffiffiffiffiffiffia2a þ b2a
q
tanϕa ¼ baaa
ð2Þ
Table 1 shows theharmonic amplitudes andphasesfor both energy ranges. The statistical uncertain-ties in the Fourier amplitudes are
ffiffiffiffiffiffiffiffiffiffi2=N
p; the un-
certainties in the amplitude andphase correspondto the 68% confidence level of the marginalizedprobability distribution functions. The rightmostcolumn shows the probabilities that amplitudes
larger than those observed could arise by chancefrom fluctuations in an isotropic distribution.These probabilities are calculated as PðraÞ ¼expð–N r2a=4Þ (28). For the lower-energy bin (4EeV < E < 8 EeV), the result is consistent withisotropy, with a bound on the harmonic ampli-tude of <1.2% at the 95% confidence level. For theevents with E ≥ 8 EeV, the amplitude of the firstharmonic is 4:7þ0:8
%0:7%, which has a probability ofarising by chance of 2.6 × 10⁻⁸, equivalent to atwo-sided Gaussian significance of 5.6s. The evo-lution of the significance of this signal with timeis shown in fig. S3; the dipole became more sig-nificant as the exposure increased. Allowing for apenalization factor of 2 to account for the factthat two energy bins were explored, the signifi-cance is reduced to 5.4s. Further penalization forthe four additional lower-energy bins examinedin (23) has a similarly mild impact on the signif-icance, which falls to 5.2s. The maximum of the
The Pierre Auger Collaboration, Science 357, 1266–1270 (2017) 22 September 2017 2 of 5
0.9 0.92 0.94 0.96 0.98
1 1.02 1.04 1.06 1.08
1.1
0 60 120 180 240 300 360
Nor
mal
ized
rat
es
Right Ascension [deg]
data E>8 EeVfirst harmonic
Fig. 1. Normalized rate of events as a func-tion of right ascension. Normalized rate for32,187 events with E ≥ 8 EeV, as a function ofright ascension (integrated in declination). Errorbars are 1s uncertainties. The solid line showsthe first-harmonic modulation from Table 1,which displays good agreement with the data(c2/n = 10.5/10); the dashed line shows aconstant function.
0.38
0.42
0.46
km-2 sr
-1 yr-1
-90
90
360 0
Fig. 2. Map showing the fluxes of particles in equatorial coordinates. Sky map in equatorialcoordinates, using a Hammer projection, showing the cosmic-ray flux above 8 EeV smoothed with a45° top-hat function. The galactic center is marked with an asterisk; the galactic plane is shownby a dashed line.
0.38
0.42
0.46
km-2 sr
-1 yr-1
-90
90
180 -180
2MRS
5 EeV
2 EeV
Fig. 3. Map showing the fluxes of particles in galactic coordinates. Sky map in galacticcoordinates showing the cosmic-ray flux for E ≥ 8 EeV smoothed with a 45° top-hat function. Thegalactic center is at the origin. The cross indicates the measured dipole direction; the contoursdenote the 68% and 95% confidence level regions. The dipole in the 2MRS galaxy distribution isindicated. Arrows show the deflections expected for a particular model of the galactic magneticfield (8) on particles with E/Z = 5 or 2 EeV.
RESEARCH | RESEARCH ARTICLE
on October 31, 2017
http://science.sciencem
ag.org/Downloaded from
making it possible to use events with only fiveactive detectors around the one with the largestsignal. With this more relaxed condition, the ef-fective exposure is increased by 18.5%, and thetotal number of events increases correspond-ingly from 95,917 to 113,888. The reconstructionaccuracy for the additional events is sufficientfor our analysis (see supplementary materialsand fig. S4).
Rayleigh analysis in right ascension
A standard approach for studying the large-scaleanisotropies in the arrival directions of cosmicrays is to perform a harmonic analysis in rightascension, a. The first-harmonic Fourier compo-nents are given by
aa ¼ 2N
XN
i¼1
wi cos ai
ba ¼ 2N
XN
i¼1
wi sin ai ð1Þ
The sums run over all N detected events, eachwith right ascension ai, with the normalizationfactor N ¼
XN
i¼1wi. The weights, wi , are intro-
duced to account for small nonuniformities inthe exposure of the array in right ascension andfor the effects of a tilt of the array toward thesoutheast (see supplementarymaterials). Theaver-age tilt between the vertical and the normal tothe plane onwhich the detectors are deployed is0.2°, so that the effective area of the array is slight-ly larger for showers arriving from the downhilldirection. This introduces aharmonic dependencein azimuth of amplitude 0.3% × tan q to the ex-posure. The effective aperture of the array is de-termined everyminute. Because the exposure hasbeen accumulated over more than 12 years, thetotal aperture is modulated by less than ~0.6%as the zenith of the observatory moves in rightascension. Events are weighted by the inverse
of the relative exposure to correct these effects(fig. S2).The amplitude ra and phase ϕa of the first
harmonic of the modulation are obtained from
ra ¼ffiffiffiffiffiffiffiffiffiffiffiffiffiffiffiffia2a þ b2a
q
tanϕa ¼ baaa
ð2Þ
Table 1 shows theharmonic amplitudes andphasesfor both energy ranges. The statistical uncertain-ties in the Fourier amplitudes are
ffiffiffiffiffiffiffiffiffiffi2=N
p; the un-
certainties in the amplitude andphase correspondto the 68% confidence level of the marginalizedprobability distribution functions. The rightmostcolumn shows the probabilities that amplitudes
larger than those observed could arise by chancefrom fluctuations in an isotropic distribution.These probabilities are calculated as PðraÞ ¼expð–N r2a=4Þ (28). For the lower-energy bin (4EeV < E < 8 EeV), the result is consistent withisotropy, with a bound on the harmonic ampli-tude of <1.2% at the 95% confidence level. For theevents with E ≥ 8 EeV, the amplitude of the firstharmonic is 4:7þ0:8
%0:7%, which has a probability ofarising by chance of 2.6 × 10⁻⁸, equivalent to atwo-sided Gaussian significance of 5.6s. The evo-lution of the significance of this signal with timeis shown in fig. S3; the dipole became more sig-nificant as the exposure increased. Allowing for apenalization factor of 2 to account for the factthat two energy bins were explored, the signifi-cance is reduced to 5.4s. Further penalization forthe four additional lower-energy bins examinedin (23) has a similarly mild impact on the signif-icance, which falls to 5.2s. The maximum of the
The Pierre Auger Collaboration, Science 357, 1266–1270 (2017) 22 September 2017 2 of 5
0.9 0.92 0.94 0.96 0.98
1 1.02 1.04 1.06 1.08
1.1
0 60 120 180 240 300 360
Nor
mal
ized
rate
sRight Ascension [deg]
data E>8 EeVfirst harmonic
Fig. 1. Normalized rate of events as a func-tion of right ascension. Normalized rate for32,187 events with E ≥ 8 EeV, as a function ofright ascension (integrated in declination). Errorbars are 1s uncertainties. The solid line showsthe first-harmonic modulation from Table 1,which displays good agreement with the data(c2/n = 10.5/10); the dashed line shows aconstant function.
0.38
0.42
0.46
km-2 sr
-1 yr-1
-90
90
360 0
Fig. 2. Map showing the fluxes of particles in equatorial coordinates. Sky map in equatorialcoordinates, using a Hammer projection, showing the cosmic-ray flux above 8 EeV smoothed with a45° top-hat function. The galactic center is marked with an asterisk; the galactic plane is shownby a dashed line.
0.38
0.42
0.46
km-2 sr
-1 yr-1
-90
90
180 -180
2MRS
5 EeV
2 EeV
Fig. 3. Map showing the fluxes of particles in galactic coordinates. Sky map in galacticcoordinates showing the cosmic-ray flux for E ≥ 8 EeV smoothed with a 45° top-hat function. Thegalactic center is at the origin. The cross indicates the measured dipole direction; the contoursdenote the 68% and 95% confidence level regions. The dipole in the 2MRS galaxy distribution isindicated. Arrows show the deflections expected for a particular model of the galactic magneticfield (8) on particles with E/Z = 5 or 2 EeV.
RESEARCH | RESEARCH ARTICLE
on October 31, 2017
http://science.sciencem
ag.org/Downloaded from
The Pierre Auger Collaboration, Science 357, 1266–1270 (2017) 22 September 2017
A.A. 2021-2022 Prof. Antonio Capone - Particle and AstroParcle Physics 56
0.38
0.42
0.46
km
-2 sr
-1 y
r-1
-90
90
360 0
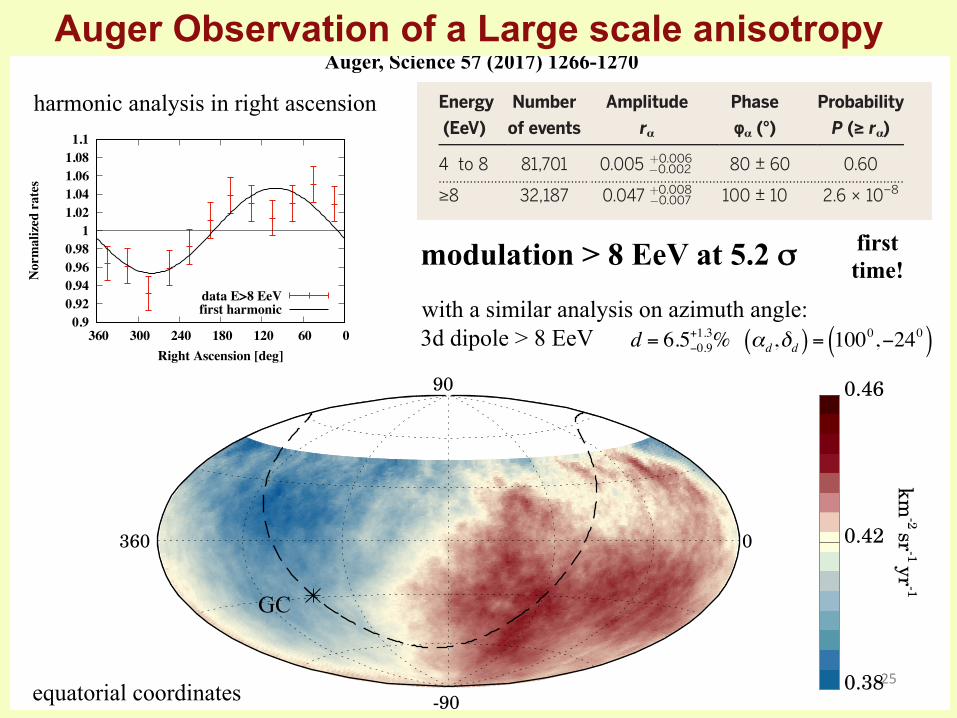
OBSERVATION OF A LARGE SCALE ANISOTROPY Auger, Science 57 (2017) 1266-1270
0.9 0.92 0.94 0.96 0.98
1 1.02 1.04 1.06 1.08 1.1
0 60 120 180 240 300 360
Nor
mal
ized
rat
es
Right Ascension [deg]
data E>8 EeVfirst harmonic
harmonic analysis in right ascension
modulation is at right ascension of 100° ± 10°.Themaximum of the modulation for the 4 EeV <E < 8 EeV bin, at 80° ± 60°, is compatible withthe one determined in the higher-energy bin,although it has high uncertainty and the ampli-tude is not statistically significant. Table S1 showsthat results obtained under the stricter triggercondition and for the additional events gainedafter relaxing the trigger are entirely consistentwith each other.Figure 1 shows the distribution of the normal-
ized rate of events above 8 EeV as a function ofright ascension. The sinusoidal function corre-sponds to the first harmonic; the distribution iscompatible with a dipolar modulation: c2/n =10.5/10 for the first-harmonic curve and c2/n =45/12 for a constant function (where n is thenumber of degrees of freedom, equal to the num-ber of points in the plot minus the number ofparameters of the fit).The distribution of events in equatorial coor-
dinates, smoothedwith a 45° radius top-hat func-tion to better display the large-scale features, isshown in Fig. 2.
Reconstruction of thethree-dimensional dipole
In the presence of a three-dimensional dipole,the Rayleigh analysis in right ascension is sen-sitive only to its component orthogonal to therotation axis of Earth, d⊥. A dipole component inthe direction of the rotation axis of Earth, dz,induces no modulation of the flux in right ascen-sion, but does so in the azimuthal distribution ofthe directions of arrival at the array. A non-vanishing value of dz leads to a sinusoidal modu-lation in azimuth with a maximum toward thenorthern or the southern direction.To recover the three-dimensional dipole, we
combine the first-harmonic analysis in right as-cension with a similar one in the azimuthal angleϕ, measured counterclockwise from the east.The relevant component, bϕ, is given by an ex-pression analogous to that in Eq. 1, but in terms
of the azimuth of the arrival direction of theshower rather than in terms of the right as-cension. The results are bϕ = −0.013 ± 0.005 inthe 4 EeV < E < 8 EeV bin and bϕ = −0.014 ±0.008 in the E ≥ 8 EeV bin. The probabilitiesthat larger or equal absolute values for bϕ arisefrom an isotropic distribution are 0.8% and8%, respectively.Under the assumption that the dominant
cosmic-ray anisotropy is dipolar, basedonpreviousstudies that found that the effects of higher-ordermultipoles are not significant in this energy range(25, 29, 30), the dipole components and its direc-tion in equatorial coordinates (ad, dd) can beestimated from
d⊥ ≈ rahcos di
dz ≈ bϕcos ‘obshsin qi
ad ¼ ϕa
tan dd ¼ dz
d⊥ð3Þ
(25), where hcos di is the mean cosine of the dec-linations of the events, hsin qi is the mean sineof the zenith angles of the events, and ‘obs ≈−35.2° is the average latitude of the observa-tory. For our data set, we find hcos di = 0.78 andhsin qi = 0.65.The parameters describing the direction of
the three-dimensional dipole are summarizedin Table 2. For 4 EeV < E < 8 EeV, the dipoleamplitude is d = 2:5þ1:0
%0:7%, pointing close to thecelestial south pole, at (ad, dd) = (80°, −75°),although the amplitude is not statistically sig-nificant. For energies above 8 EeV, the total di-pole amplitude is d = 6:5þ1:3
%0:9%, pointing toward
(ad, dd) = (100°, −24°). In galactic coordinates,the direction of this dipole is (‘, b) = (233°,−13°). This dipolar pattern is clearly seen inthe flux map in Fig. 2. To establish whether thedepartures from a perfect dipole are merelystatistical fluctuations or indicate the pres-ence of additional structures at smaller angularscales would require at least twice as manyevents.
Implications for the origin ofhigh-energy cosmic rays
The anisotropy we have found should be seen inthe context of related results at lower energies.Above a fewPeV, the steepening of the cosmic-rayenergy spectrum has been interpreted as beingdue to efficient escape of particles from the gal-axy and/or because of the inability of the sourcesto accelerate cosmic rays beyond a maximumvalue of E/Z. The origin of the particles remainsunknown.Although supernova remnants are oftendiscussed as sources, evidence has been reportedfor a source in the galactic center capable ofaccelerating particles to PeV energies (31). Diffu-sive escape from the galaxy is expected to lead toa dipolar component with a maximum near thegalactic center direction (32). This is compatiblewith results obtained in the 1015 to 1018 eV range(15, 16, 23, 24, 33), which provide values for thephase in right ascension close to that of thegalactic center, aGC = 266°.Models proposing a galactic origin up to the
highest observed energies (34,35) are in increasingtension with observations. If the galactic sourcespostulated to accelerate cosmic rays above EeVenergies, such as short gamma-ray bursts orhypernovae, were distributed in the disk of thegalaxy, a dipolar component of anisotropy ispredicted with an amplitude that exceeds existingbounds at EeV energies (24, 33). In this sense, theconstraint obtained here on the dipole amplitude(Table 2) for 4 EeV < E < 8 EeV further disfavors apredominantly galactic origin. This tension couldbe alleviated if cosmic rays at a few EeV weredominated by heavy nuclei such as iron, butthis would be in disagreement with the lightercomposition inferred observationally at theseenergies (6). Themaximum of the flux might beexpected to lie close to the galactic center region,whereas the direction of the three-dimensionaldipole determined above 8 EeV lies ~125° fromthe galactic center. This suggests that the an-isotropy observed above 8 EeV is better explainedin terms of an extragalactic origin. Above 40 EeV,where the propagation should become less dif-fusive, there are no indications of anisotropiesassociated with either the galactic center or thegalactic plane (36).There have been many efforts to interpret the
properties of ultrahigh-energy cosmic rays in termsof extragalactic sources. Because of Liouville’stheorem, the distribution of cosmic rays mustbe anisotropic outside of the galaxy for an an-isotropy to be observed at Earth. An anisotropycannot arise through deflections of an originallyisotropic flux by a magnetic field. One predictionof anisotropy comes from the Compton-Getting
The Pierre Auger Collaboration, Science 357, 1266–1270 (2017) 22 September 2017 3 of 5
Table 2. Three-dimensional dipole reconstruction. Directions of dipole components are shown inequatorial coordinates.
Energy(EeV)
Dipolecomponent dz
Dipolecomponent d⊥
Dipoleamplitude d
Dipoledeclination dd (°)
Dipole rightascension ad (°)
4 to 8 −0.024 ± 0.009 0.006%0.003þ0.007 0.025%0.007
þ0.010 −75%8þ17 80 ± 60
.. .. ... ... .. ... .. ... ... .. ... ... .. ... .. ... ... .. ... ... .. ... ... .. ... .. ... ... .. ... ... .. ... .. ... ... .. ... ... .. ... ... .. ... .. ... ... .. ... ... .. ... .. ... ... .. ... ... .. ... ... .. ... .. ... ... .. ... ... .. ... .. ... ... .. ... ... .. ... ... .. .
≥8 −0.026 ± 0.015 0.060%0.010þ0.011 0.065%0.009
þ0.013 −24%13þ12 100 ± 10
.. .. ... ... .. ... .. ... ... .. ... ... .. ... .. ... ... .. ... ... .. ... ... .. ... .. ... ... .. ... ... .. ... .. ... ... .. ... ... .. ... ... .. ... .. ... ... .. ... ... .. ... .. ... ... .. ... ... .. ... ... .. ... .. ... ... .. ... ... .. ... .. ... ... .. ... ... .. ... ... .. .
Table 1. First harmonic in right ascension. Data are from the Rayleigh analysis of the firstharmonic in right ascension for the two energy bins.
Energy(EeV)
Numberof events
Fouriercoefficient aa
Fouriercoefficient ba
Amplitudera
Phaseϕa (°)
ProbabilityP (≥ ra)
4 to 8 81,701 0.001 ± 0.005 0.005 ± 0.005 0.005 %0.002þ0.006 80 ± 60 0.60
.. .. ... ... .. ... .. ... ... .. ... ... .. ... .. ... ... .. ... ... .. ... ... .. ... .. ... ... .. ... ... .. ... .. ... ... .. ... ... .. ... ... .. ... .. ... ... .. ... ... .. ... .. ... ... .. ... ... .. ... ... .. ... .. ... ... .. ... ... .. ... .. ... ... .. ... ... .. ... ... .. .
≥8 32,187 −0.008 ± 0.008 0.046 ± 0.008 0.047 %0.007þ0.008 100 ± 10 2.6 × 10⁻⁸
.. .. ... ... .. ... .. ... ... .. ... ... .. ... .. ... ... .. ... ... .. ... ... .. ... .. ... ... .. ... ... .. ... .. ... ... .. ... ... .. ... ... .. ... .. ... ... .. ... ... .. ... .. ... ... .. ... ... .. ... ... .. ... .. ... ... .. ... ... .. ... .. ... ... .. ... ... .. ... ... .. .
RESEARCH | RESEARCH ARTICLE
on Septem
ber 22, 2017
http://science.sciencemag.org/
Dow
nloaded from
equatorial coordinates
GC
modulation > 8 EeV at 5.2 σ
d = 6.5−0.9+1.3% αd,δd( ) = 1000,−240( )3d dipole > 8 EeV
0.38
0.42
0.46
km
-2 sr
-1 y
r-1
-90
90
180 -180
2MRS
5 EeV
2 EeV
with a similar analysis on azimuth angle:
first time!
25
Auger Observation of a Large scale anisotropy
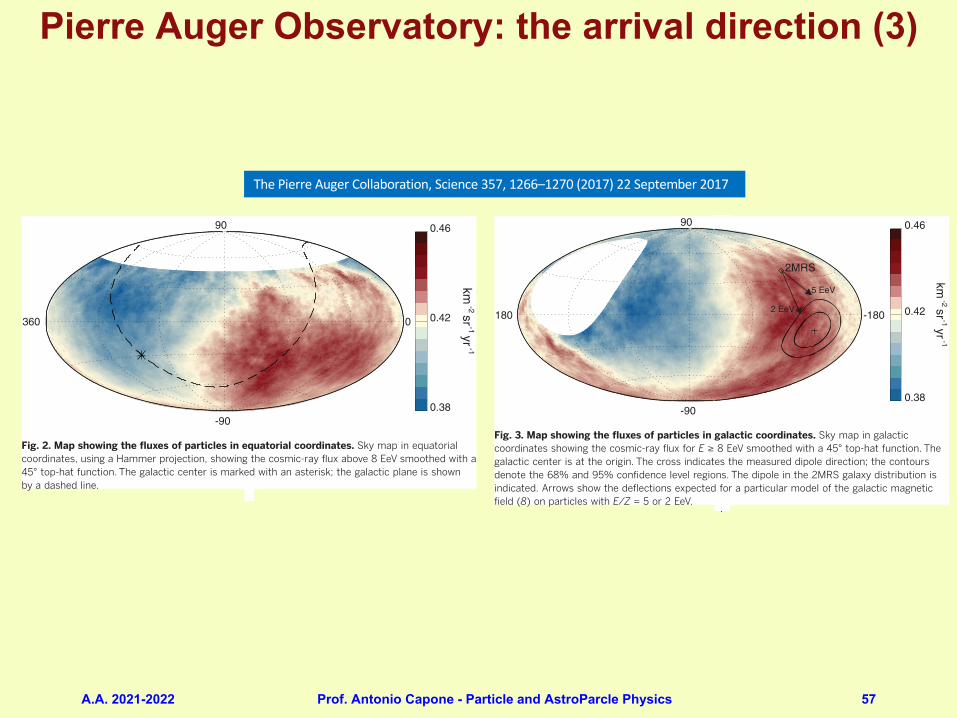
A.A. 2021-2022 Prof. Antonio Capone - Particle and AstroParcle Physics 57
Pierre Auger Observatory: the arrival direction (3)
making it possible to use events with only fiveactive detectors around the one with the largestsignal. With this more relaxed condition, the ef-fective exposure is increased by 18.5%, and thetotal number of events increases correspond-ingly from 95,917 to 113,888. The reconstructionaccuracy for the additional events is sufficientfor our analysis (see supplementary materialsand fig. S4).
Rayleigh analysis in right ascension
A standard approach for studying the large-scaleanisotropies in the arrival directions of cosmicrays is to perform a harmonic analysis in rightascension, a. The first-harmonic Fourier compo-nents are given by
aa ¼ 2N
XN
i¼1
wi cos ai
ba ¼ 2N
XN
i¼1
wi sin ai ð1Þ
The sums run over all N detected events, eachwith right ascension ai, with the normalizationfactor N ¼
XN
i¼1wi. The weights, wi , are intro-
duced to account for small nonuniformities inthe exposure of the array in right ascension andfor the effects of a tilt of the array toward thesoutheast (see supplementarymaterials). Theaver-age tilt between the vertical and the normal tothe plane onwhich the detectors are deployed is0.2°, so that the effective area of the array is slight-ly larger for showers arriving from the downhilldirection. This introduces aharmonic dependencein azimuth of amplitude 0.3% × tan q to the ex-posure. The effective aperture of the array is de-termined everyminute. Because the exposure hasbeen accumulated over more than 12 years, thetotal aperture is modulated by less than ~0.6%as the zenith of the observatory moves in rightascension. Events are weighted by the inverse
of the relative exposure to correct these effects(fig. S2).The amplitude ra and phase ϕa of the first
harmonic of the modulation are obtained from
ra ¼ffiffiffiffiffiffiffiffiffiffiffiffiffiffiffiffia2a þ b2a
q
tanϕa ¼ baaa
ð2Þ
Table 1 shows theharmonic amplitudes andphasesfor both energy ranges. The statistical uncertain-ties in the Fourier amplitudes are
ffiffiffiffiffiffiffiffiffiffi2=N
p; the un-
certainties in the amplitude andphase correspondto the 68% confidence level of the marginalizedprobability distribution functions. The rightmostcolumn shows the probabilities that amplitudes
larger than those observed could arise by chancefrom fluctuations in an isotropic distribution.These probabilities are calculated as PðraÞ ¼expð–N r2a=4Þ (28). For the lower-energy bin (4EeV < E < 8 EeV), the result is consistent withisotropy, with a bound on the harmonic ampli-tude of <1.2% at the 95% confidence level. For theevents with E ≥ 8 EeV, the amplitude of the firstharmonic is 4:7þ0:8
%0:7%, which has a probability ofarising by chance of 2.6 × 10⁻⁸, equivalent to atwo-sided Gaussian significance of 5.6s. The evo-lution of the significance of this signal with timeis shown in fig. S3; the dipole became more sig-nificant as the exposure increased. Allowing for apenalization factor of 2 to account for the factthat two energy bins were explored, the signifi-cance is reduced to 5.4s. Further penalization forthe four additional lower-energy bins examinedin (23) has a similarly mild impact on the signif-icance, which falls to 5.2s. The maximum of the
The Pierre Auger Collaboration, Science 357, 1266–1270 (2017) 22 September 2017 2 of 5
0.9 0.92 0.94 0.96 0.98
1 1.02 1.04 1.06 1.08
1.1
0 60 120 180 240 300 360
Nor
mal
ized
rat
es
Right Ascension [deg]
data E>8 EeVfirst harmonic
Fig. 1. Normalized rate of events as a func-tion of right ascension. Normalized rate for32,187 events with E ≥ 8 EeV, as a function ofright ascension (integrated in declination). Errorbars are 1s uncertainties. The solid line showsthe first-harmonic modulation from Table 1,which displays good agreement with the data(c2/n = 10.5/10); the dashed line shows aconstant function.
0.38
0.42
0.46
km-2 sr
-1 yr-1
-90
90
360 0
Fig. 2. Map showing the fluxes of particles in equatorial coordinates. Sky map in equatorialcoordinates, using a Hammer projection, showing the cosmic-ray flux above 8 EeV smoothed with a45° top-hat function. The galactic center is marked with an asterisk; the galactic plane is shownby a dashed line.
0.38
0.42
0.46
km-2 sr
-1 yr-1
-90
90
180 -180
2MRS
5 EeV
2 EeV
Fig. 3. Map showing the fluxes of particles in galactic coordinates. Sky map in galacticcoordinates showing the cosmic-ray flux for E ≥ 8 EeV smoothed with a 45° top-hat function. Thegalactic center is at the origin. The cross indicates the measured dipole direction; the contoursdenote the 68% and 95% confidence level regions. The dipole in the 2MRS galaxy distribution isindicated. Arrows show the deflections expected for a particular model of the galactic magneticfield (8) on particles with E/Z = 5 or 2 EeV.
RESEARCH | RESEARCH ARTICLE
on October 31, 2017
http://science.sciencem
ag.org/Downloaded from
The Pierre Auger Collaboration, Science 357, 1266–1270 (2017) 22 September 2017

Large scale anisotropies in the arrival directions of CRs arecharacterized by harmonic analysis in right ascension, a.The first-harmonic Fourier components are given by
where N = detected events= weight introduced to account for small
non-uniformities in the exposure of the array in right ascension.
The amplitude ra and phase φa of the first harmonic of the modulation are:
The dominant cosmic-ray anisotropy is dipolar, the dipole components and its direction in equatorial coordinates (ad, dd) can be estimated from
A.A. 2021-2022 Prof. Antonio Capone - Particle and AstroParcle Physics 58
Pierre Auger Observatory: the arrival direction (4)The Pierre Auger Collaboration, Science 357, 1266–1270 (2017) 22 September 2017
modulation is at right ascension of 100° ± 10°.Themaximum of the modulation for the 4 EeV <E < 8 EeV bin, at 80° ± 60°, is compatible withthe one determined in the higher-energy bin,although it has high uncertainty and the ampli-tude is not statistically significant. Table S1 showsthat results obtained under the stricter triggercondition and for the additional events gainedafter relaxing the trigger are entirely consistentwith each other.Figure 1 shows the distribution of the normal-
ized rate of events above 8 EeV as a function ofright ascension. The sinusoidal function corre-sponds to the first harmonic; the distribution iscompatible with a dipolar modulation: c2/n =10.5/10 for the first-harmonic curve and c2/n =45/12 for a constant function (where n is thenumber of degrees of freedom, equal to the num-ber of points in the plot minus the number ofparameters of the fit).The distribution of events in equatorial coor-
dinates, smoothedwith a 45° radius top-hat func-tion to better display the large-scale features, isshown in Fig. 2.
Reconstruction of thethree-dimensional dipole
In the presence of a three-dimensional dipole,the Rayleigh analysis in right ascension is sen-sitive only to its component orthogonal to therotation axis of Earth, d⊥. A dipole component inthe direction of the rotation axis of Earth, dz,induces no modulation of the flux in right ascen-sion, but does so in the azimuthal distribution ofthe directions of arrival at the array. A non-vanishing value of dz leads to a sinusoidal modu-lation in azimuth with a maximum toward thenorthern or the southern direction.To recover the three-dimensional dipole, we
combine the first-harmonic analysis in right as-cension with a similar one in the azimuthal angleϕ, measured counterclockwise from the east.The relevant component, bϕ, is given by an ex-pression analogous to that in Eq. 1, but in terms
of the azimuth of the arrival direction of theshower rather than in terms of the right as-cension. The results are bϕ = −0.013 ± 0.005 inthe 4 EeV < E < 8 EeV bin and bϕ = −0.014 ±0.008 in the E ≥ 8 EeV bin. The probabilitiesthat larger or equal absolute values for bϕ arisefrom an isotropic distribution are 0.8% and8%, respectively.Under the assumption that the dominant
cosmic-ray anisotropy is dipolar, basedonpreviousstudies that found that the effects of higher-ordermultipoles are not significant in this energy range(25, 29, 30), the dipole components and its direc-tion in equatorial coordinates (ad, dd) can beestimated from
d⊥ ≈ rahcos di
dz ≈ bϕcos ‘obshsin qi
ad ¼ ϕa
tan dd ¼ dz
d⊥ð3Þ
(25), where hcos di is the mean cosine of the dec-linations of the events, hsin qi is the mean sineof the zenith angles of the events, and ‘obs ≈−35.2° is the average latitude of the observa-tory. For our data set, we find hcos di = 0.78 andhsin qi = 0.65.The parameters describing the direction of
the three-dimensional dipole are summarizedin Table 2. For 4 EeV < E < 8 EeV, the dipoleamplitude is d = 2:5þ1:0
%0:7%, pointing close to thecelestial south pole, at (ad, dd) = (80°, −75°),although the amplitude is not statistically sig-nificant. For energies above 8 EeV, the total di-pole amplitude is d = 6:5þ1:3
%0:9%, pointing toward
(ad, dd) = (100°, −24°). In galactic coordinates,the direction of this dipole is (‘, b) = (233°,−13°). This dipolar pattern is clearly seen inthe flux map in Fig. 2. To establish whether thedepartures from a perfect dipole are merelystatistical fluctuations or indicate the pres-ence of additional structures at smaller angularscales would require at least twice as manyevents.
Implications for the origin ofhigh-energy cosmic rays
The anisotropy we have found should be seen inthe context of related results at lower energies.Above a fewPeV, the steepening of the cosmic-rayenergy spectrum has been interpreted as beingdue to efficient escape of particles from the gal-axy and/or because of the inability of the sourcesto accelerate cosmic rays beyond a maximumvalue of E/Z. The origin of the particles remainsunknown.Although supernova remnants are oftendiscussed as sources, evidence has been reportedfor a source in the galactic center capable ofaccelerating particles to PeV energies (31). Diffu-sive escape from the galaxy is expected to lead toa dipolar component with a maximum near thegalactic center direction (32). This is compatiblewith results obtained in the 1015 to 1018 eV range(15, 16, 23, 24, 33), which provide values for thephase in right ascension close to that of thegalactic center, aGC = 266°.Models proposing a galactic origin up to the
highest observed energies (34,35) are in increasingtension with observations. If the galactic sourcespostulated to accelerate cosmic rays above EeVenergies, such as short gamma-ray bursts orhypernovae, were distributed in the disk of thegalaxy, a dipolar component of anisotropy ispredicted with an amplitude that exceeds existingbounds at EeV energies (24, 33). In this sense, theconstraint obtained here on the dipole amplitude(Table 2) for 4 EeV < E < 8 EeV further disfavors apredominantly galactic origin. This tension couldbe alleviated if cosmic rays at a few EeV weredominated by heavy nuclei such as iron, butthis would be in disagreement with the lightercomposition inferred observationally at theseenergies (6). Themaximum of the flux might beexpected to lie close to the galactic center region,whereas the direction of the three-dimensionaldipole determined above 8 EeV lies ~125° fromthe galactic center. This suggests that the an-isotropy observed above 8 EeV is better explainedin terms of an extragalactic origin. Above 40 EeV,where the propagation should become less dif-fusive, there are no indications of anisotropiesassociated with either the galactic center or thegalactic plane (36).There have been many efforts to interpret the
properties of ultrahigh-energy cosmic rays in termsof extragalactic sources. Because of Liouville’stheorem, the distribution of cosmic rays mustbe anisotropic outside of the galaxy for an an-isotropy to be observed at Earth. An anisotropycannot arise through deflections of an originallyisotropic flux by a magnetic field. One predictionof anisotropy comes from the Compton-Getting
The Pierre Auger Collaboration, Science 357, 1266–1270 (2017) 22 September 2017 3 of 5
Table 2. Three-dimensional dipole reconstruction. Directions of dipole components are shown inequatorial coordinates.
Energy(EeV)
Dipolecomponent dz
Dipolecomponent d⊥
Dipoleamplitude d
Dipoledeclination dd (°)
Dipole rightascension ad (°)
4 to 8 −0.024 ± 0.009 0.006%0.003þ0.007 0.025%0.007
þ0.010 −75%8þ17 80 ± 60
.. .. ... ... .. ... .. ... ... .. ... ... .. ... .. ... ... .. ... ... .. ... ... .. ... .. ... ... .. ... ... .. ... .. ... ... .. ... ... .. ... ... .. ... .. ... ... .. ... ... .. ... .. ... ... .. ... ... .. ... ... .. ... .. ... ... .. ... ... .. ... .. ... ... .. ... ... .. ... ... .. .
≥8 −0.026 ± 0.015 0.060%0.010þ0.011 0.065%0.009
þ0.013 −24%13þ12 100 ± 10
.. .. ... ... .. ... .. ... ... .. ... ... .. ... .. ... ... .. ... ... .. ... ... .. ... .. ... ... .. ... ... .. ... .. ... ... .. ... ... .. ... ... .. ... .. ... ... .. ... ... .. ... .. ... ... .. ... ... .. ... ... .. ... .. ... ... .. ... ... .. ... .. ... ... .. ... ... .. ... ... .. .
Table 1. First harmonic in right ascension. Data are from the Rayleigh analysis of the firstharmonic in right ascension for the two energy bins.
Energy(EeV)
Numberof events
Fouriercoefficient aa
Fouriercoefficient ba
Amplitudera
Phaseϕa (°)
ProbabilityP (≥ ra)
4 to 8 81,701 0.001 ± 0.005 0.005 ± 0.005 0.005 %0.002þ0.006 80 ± 60 0.60
.. .. ... ... .. ... .. ... ... .. ... ... .. ... .. ... ... .. ... ... .. ... ... .. ... .. ... ... .. ... ... .. ... .. ... ... .. ... ... .. ... ... .. ... .. ... ... .. ... ... .. ... .. ... ... .. ... ... .. ... ... .. ... .. ... ... .. ... ... .. ... .. ... ... .. ... ... .. ... ... .. .
≥8 32,187 −0.008 ± 0.008 0.046 ± 0.008 0.047 %0.007þ0.008 100 ± 10 2.6 × 10⁻⁸
.. .. ... ... .. ... .. ... ... .. ... ... .. ... .. ... ... .. ... ... .. ... ... .. ... .. ... ... .. ... ... .. ... .. ... ... .. ... ... .. ... ... .. ... .. ... ... .. ... ... .. ... .. ... ... .. ... ... .. ... ... .. ... .. ... ... .. ... ... .. ... .. ... ... .. ... ... .. ... ... .. .
RESEARCH | RESEARCH ARTICLE
on October 31, 2017
http://science.sciencem
ag.org/Downloaded from
making it possible to use events with only fiveactive detectors around the one with the largestsignal. With this more relaxed condition, the ef-fective exposure is increased by 18.5%, and thetotal number of events increases correspond-ingly from 95,917 to 113,888. The reconstructionaccuracy for the additional events is sufficientfor our analysis (see supplementary materialsand fig. S4).
Rayleigh analysis in right ascension
A standard approach for studying the large-scaleanisotropies in the arrival directions of cosmicrays is to perform a harmonic analysis in rightascension, a. The first-harmonic Fourier compo-nents are given by
aa ¼ 2N
XN
i¼1
wi cos ai
ba ¼ 2N
XN
i¼1
wi sin ai ð1Þ
The sums run over all N detected events, eachwith right ascension ai, with the normalizationfactor N ¼
XN
i¼1wi. The weights, wi , are intro-
duced to account for small nonuniformities inthe exposure of the array in right ascension andfor the effects of a tilt of the array toward thesoutheast (see supplementarymaterials). Theaver-age tilt between the vertical and the normal tothe plane onwhich the detectors are deployed is0.2°, so that the effective area of the array is slight-ly larger for showers arriving from the downhilldirection. This introduces aharmonic dependencein azimuth of amplitude 0.3% × tan q to the ex-posure. The effective aperture of the array is de-termined everyminute. Because the exposure hasbeen accumulated over more than 12 years, thetotal aperture is modulated by less than ~0.6%as the zenith of the observatory moves in rightascension. Events are weighted by the inverse
of the relative exposure to correct these effects(fig. S2).The amplitude ra and phase ϕa of the first
harmonic of the modulation are obtained from
ra ¼ffiffiffiffiffiffiffiffiffiffiffiffiffiffiffiffia2a þ b2a
q
tanϕa ¼ baaa
ð2Þ
Table 1 shows theharmonic amplitudes andphasesfor both energy ranges. The statistical uncertain-ties in the Fourier amplitudes are
ffiffiffiffiffiffiffiffiffiffi2=N
p; the un-
certainties in the amplitude andphase correspondto the 68% confidence level of the marginalizedprobability distribution functions. The rightmostcolumn shows the probabilities that amplitudes
larger than those observed could arise by chancefrom fluctuations in an isotropic distribution.These probabilities are calculated as PðraÞ ¼expð–N r2a=4Þ (28). For the lower-energy bin (4EeV < E < 8 EeV), the result is consistent withisotropy, with a bound on the harmonic ampli-tude of <1.2% at the 95% confidence level. For theevents with E ≥ 8 EeV, the amplitude of the firstharmonic is 4:7þ0:8
%0:7%, which has a probability ofarising by chance of 2.6 × 10⁻⁸, equivalent to atwo-sided Gaussian significance of 5.6s. The evo-lution of the significance of this signal with timeis shown in fig. S3; the dipole became more sig-nificant as the exposure increased. Allowing for apenalization factor of 2 to account for the factthat two energy bins were explored, the signifi-cance is reduced to 5.4s. Further penalization forthe four additional lower-energy bins examinedin (23) has a similarly mild impact on the signif-icance, which falls to 5.2s. The maximum of the
The Pierre Auger Collaboration, Science 357, 1266–1270 (2017) 22 September 2017 2 of 5
0.9 0.92 0.94 0.96 0.98
1 1.02 1.04 1.06 1.08
1.1
0 60 120 180 240 300 360
Nor
mal
ized
rat
es
Right Ascension [deg]
data E>8 EeVfirst harmonic
Fig. 1. Normalized rate of events as a func-tion of right ascension. Normalized rate for32,187 events with E ≥ 8 EeV, as a function ofright ascension (integrated in declination). Errorbars are 1s uncertainties. The solid line showsthe first-harmonic modulation from Table 1,which displays good agreement with the data(c2/n = 10.5/10); the dashed line shows aconstant function.
0.38
0.42
0.46
km-2 sr
-1 yr-1
-90
90
360 0
Fig. 2. Map showing the fluxes of particles in equatorial coordinates. Sky map in equatorialcoordinates, using a Hammer projection, showing the cosmic-ray flux above 8 EeV smoothed with a45° top-hat function. The galactic center is marked with an asterisk; the galactic plane is shownby a dashed line.
0.38
0.42
0.46
km-2 sr
-1 yr-1
-90
90
180 -180
2MRS
5 EeV
2 EeV
Fig. 3. Map showing the fluxes of particles in galactic coordinates. Sky map in galacticcoordinates showing the cosmic-ray flux for E ≥ 8 EeV smoothed with a 45° top-hat function. Thegalactic center is at the origin. The cross indicates the measured dipole direction; the contoursdenote the 68% and 95% confidence level regions. The dipole in the 2MRS galaxy distribution isindicated. Arrows show the deflections expected for a particular model of the galactic magneticfield (8) on particles with E/Z = 5 or 2 EeV.
RESEARCH | RESEARCH ARTICLE
on October 31, 2017
http://science.sciencem
ag.org/Downloaded from
aα =2N
ωi cos(αi ) i=1
N
∑ bα =2N
ωi sin(αi ) i=1
N
∑ ωi
rα = aα2 + bα
2 tan(ϕα ) =bαaα
d⊥ =rα
< cosδ > ; dz = bϕ
cos(ℓobs )< sinθ > ; αd =ϕα ; tan(δd ) = dzd⊥

The dominant cosmic-ray anisotropy is dipolar, the dipole components and its direction in equatorial coordinates (ad, dd) can be estimated from
where z= the Earth axis<cos d> is the mean cosine of the declinations of the events <sin q> is the mean sine of the zenith angles of the events, lobs ≈ −35.2° is the average latitude of the observatory
A.A. 2021-2022 Prof. Antonio Capone - Particle and AstroParcle Physics 59
Pierre Auger Observatory: the arrival direction (5)The Pierre Auger Collaboration, Science 357, 1266–1270 (2017) 22 September 2017
d⊥ =rα
< cosδ > ; dz = bϕ
cos(ℓobs )< sinθ > ; αd =ϕα ; tan(δd ) = dzd⊥
making it possible to use events with only fiveactive detectors around the one with the largestsignal. With this more relaxed condition, the ef-fective exposure is increased by 18.5%, and thetotal number of events increases correspond-ingly from 95,917 to 113,888. The reconstructionaccuracy for the additional events is sufficientfor our analysis (see supplementary materialsand fig. S4).
Rayleigh analysis in right ascension
A standard approach for studying the large-scaleanisotropies in the arrival directions of cosmicrays is to perform a harmonic analysis in rightascension, a. The first-harmonic Fourier compo-nents are given by
aa ¼ 2N
XN
i¼1
wi cos ai
ba ¼ 2N
XN
i¼1
wi sin ai ð1Þ
The sums run over all N detected events, eachwith right ascension ai, with the normalizationfactor N ¼
XN
i¼1wi. The weights, wi , are intro-
duced to account for small nonuniformities inthe exposure of the array in right ascension andfor the effects of a tilt of the array toward thesoutheast (see supplementarymaterials). Theaver-age tilt between the vertical and the normal tothe plane onwhich the detectors are deployed is0.2°, so that the effective area of the array is slight-ly larger for showers arriving from the downhilldirection. This introduces aharmonic dependencein azimuth of amplitude 0.3% × tan q to the ex-posure. The effective aperture of the array is de-termined everyminute. Because the exposure hasbeen accumulated over more than 12 years, thetotal aperture is modulated by less than ~0.6%as the zenith of the observatory moves in rightascension. Events are weighted by the inverse
of the relative exposure to correct these effects(fig. S2).The amplitude ra and phase ϕa of the first
harmonic of the modulation are obtained from
ra ¼ffiffiffiffiffiffiffiffiffiffiffiffiffiffiffiffia2a þ b2a
q
tanϕa ¼ baaa
ð2Þ
Table 1 shows theharmonic amplitudes andphasesfor both energy ranges. The statistical uncertain-ties in the Fourier amplitudes are
ffiffiffiffiffiffiffiffiffiffi2=N
p; the un-
certainties in the amplitude andphase correspondto the 68% confidence level of the marginalizedprobability distribution functions. The rightmostcolumn shows the probabilities that amplitudes
larger than those observed could arise by chancefrom fluctuations in an isotropic distribution.These probabilities are calculated as PðraÞ ¼expð–N r2a=4Þ (28). For the lower-energy bin (4EeV < E < 8 EeV), the result is consistent withisotropy, with a bound on the harmonic ampli-tude of <1.2% at the 95% confidence level. For theevents with E ≥ 8 EeV, the amplitude of the firstharmonic is 4:7þ0:8
%0:7%, which has a probability ofarising by chance of 2.6 × 10⁻⁸, equivalent to atwo-sided Gaussian significance of 5.6s. The evo-lution of the significance of this signal with timeis shown in fig. S3; the dipole became more sig-nificant as the exposure increased. Allowing for apenalization factor of 2 to account for the factthat two energy bins were explored, the signifi-cance is reduced to 5.4s. Further penalization forthe four additional lower-energy bins examinedin (23) has a similarly mild impact on the signif-icance, which falls to 5.2s. The maximum of the
The Pierre Auger Collaboration, Science 357, 1266–1270 (2017) 22 September 2017 2 of 5
0.9 0.92 0.94 0.96 0.98
1 1.02 1.04 1.06 1.08
1.1
0 60 120 180 240 300 360
Nor
mal
ized
rat
es
Right Ascension [deg]
data E>8 EeVfirst harmonic
Fig. 1. Normalized rate of events as a func-tion of right ascension. Normalized rate for32,187 events with E ≥ 8 EeV, as a function ofright ascension (integrated in declination). Errorbars are 1s uncertainties. The solid line showsthe first-harmonic modulation from Table 1,which displays good agreement with the data(c2/n = 10.5/10); the dashed line shows aconstant function.
0.38
0.42
0.46
km-2 sr
-1 yr-1
-90
90
360 0
Fig. 2. Map showing the fluxes of particles in equatorial coordinates. Sky map in equatorialcoordinates, using a Hammer projection, showing the cosmic-ray flux above 8 EeV smoothed with a45° top-hat function. The galactic center is marked with an asterisk; the galactic plane is shownby a dashed line.
0.38
0.42
0.46
km-2 sr
-1 yr-1
-90
90
180 -180
2MRS
5 EeV
2 EeV
Fig. 3. Map showing the fluxes of particles in galactic coordinates. Sky map in galacticcoordinates showing the cosmic-ray flux for E ≥ 8 EeV smoothed with a 45° top-hat function. Thegalactic center is at the origin. The cross indicates the measured dipole direction; the contoursdenote the 68% and 95% confidence level regions. The dipole in the 2MRS galaxy distribution isindicated. Arrows show the deflections expected for a particular model of the galactic magneticfield (8) on particles with E/Z = 5 or 2 EeV.
RESEARCH | RESEARCH ARTICLE
on October 31, 2017
http://science.sciencem
ag.org/Downloaded from
modulation is at right ascension of 100° ± 10°.Themaximum of the modulation for the 4 EeV <E < 8 EeV bin, at 80° ± 60°, is compatible withthe one determined in the higher-energy bin,although it has high uncertainty and the ampli-tude is not statistically significant. Table S1 showsthat results obtained under the stricter triggercondition and for the additional events gainedafter relaxing the trigger are entirely consistentwith each other.Figure 1 shows the distribution of the normal-
ized rate of events above 8 EeV as a function ofright ascension. The sinusoidal function corre-sponds to the first harmonic; the distribution iscompatible with a dipolar modulation: c2/n =10.5/10 for the first-harmonic curve and c2/n =45/12 for a constant function (where n is thenumber of degrees of freedom, equal to the num-ber of points in the plot minus the number ofparameters of the fit).The distribution of events in equatorial coor-
dinates, smoothedwith a 45° radius top-hat func-tion to better display the large-scale features, isshown in Fig. 2.
Reconstruction of thethree-dimensional dipole
In the presence of a three-dimensional dipole,the Rayleigh analysis in right ascension is sen-sitive only to its component orthogonal to therotation axis of Earth, d⊥. A dipole component inthe direction of the rotation axis of Earth, dz,induces no modulation of the flux in right ascen-sion, but does so in the azimuthal distribution ofthe directions of arrival at the array. A non-vanishing value of dz leads to a sinusoidal modu-lation in azimuth with a maximum toward thenorthern or the southern direction.To recover the three-dimensional dipole, we
combine the first-harmonic analysis in right as-cension with a similar one in the azimuthal angleϕ, measured counterclockwise from the east.The relevant component, bϕ, is given by an ex-pression analogous to that in Eq. 1, but in terms
of the azimuth of the arrival direction of theshower rather than in terms of the right as-cension. The results are bϕ = −0.013 ± 0.005 inthe 4 EeV < E < 8 EeV bin and bϕ = −0.014 ±0.008 in the E ≥ 8 EeV bin. The probabilitiesthat larger or equal absolute values for bϕ arisefrom an isotropic distribution are 0.8% and8%, respectively.Under the assumption that the dominant
cosmic-ray anisotropy is dipolar, basedonpreviousstudies that found that the effects of higher-ordermultipoles are not significant in this energy range(25, 29, 30), the dipole components and its direc-tion in equatorial coordinates (ad, dd) can beestimated from
d⊥ ≈ rahcos di
dz ≈ bϕcos ‘obshsin qi
ad ¼ ϕa
tan dd ¼ dz
d⊥ð3Þ
(25), where hcos di is the mean cosine of the dec-linations of the events, hsin qi is the mean sineof the zenith angles of the events, and ‘obs ≈−35.2° is the average latitude of the observa-tory. For our data set, we find hcos di = 0.78 andhsin qi = 0.65.The parameters describing the direction of
the three-dimensional dipole are summarizedin Table 2. For 4 EeV < E < 8 EeV, the dipoleamplitude is d = 2:5þ1:0
%0:7%, pointing close to thecelestial south pole, at (ad, dd) = (80°, −75°),although the amplitude is not statistically sig-nificant. For energies above 8 EeV, the total di-pole amplitude is d = 6:5þ1:3
%0:9%, pointing toward
(ad, dd) = (100°, −24°). In galactic coordinates,the direction of this dipole is (‘, b) = (233°,−13°). This dipolar pattern is clearly seen inthe flux map in Fig. 2. To establish whether thedepartures from a perfect dipole are merelystatistical fluctuations or indicate the pres-ence of additional structures at smaller angularscales would require at least twice as manyevents.
Implications for the origin ofhigh-energy cosmic rays
The anisotropy we have found should be seen inthe context of related results at lower energies.Above a fewPeV, the steepening of the cosmic-rayenergy spectrum has been interpreted as beingdue to efficient escape of particles from the gal-axy and/or because of the inability of the sourcesto accelerate cosmic rays beyond a maximumvalue of E/Z. The origin of the particles remainsunknown.Although supernova remnants are oftendiscussed as sources, evidence has been reportedfor a source in the galactic center capable ofaccelerating particles to PeV energies (31). Diffu-sive escape from the galaxy is expected to lead toa dipolar component with a maximum near thegalactic center direction (32). This is compatiblewith results obtained in the 1015 to 1018 eV range(15, 16, 23, 24, 33), which provide values for thephase in right ascension close to that of thegalactic center, aGC = 266°.Models proposing a galactic origin up to the
highest observed energies (34,35) are in increasingtension with observations. If the galactic sourcespostulated to accelerate cosmic rays above EeVenergies, such as short gamma-ray bursts orhypernovae, were distributed in the disk of thegalaxy, a dipolar component of anisotropy ispredicted with an amplitude that exceeds existingbounds at EeV energies (24, 33). In this sense, theconstraint obtained here on the dipole amplitude(Table 2) for 4 EeV < E < 8 EeV further disfavors apredominantly galactic origin. This tension couldbe alleviated if cosmic rays at a few EeV weredominated by heavy nuclei such as iron, butthis would be in disagreement with the lightercomposition inferred observationally at theseenergies (6). Themaximum of the flux might beexpected to lie close to the galactic center region,whereas the direction of the three-dimensionaldipole determined above 8 EeV lies ~125° fromthe galactic center. This suggests that the an-isotropy observed above 8 EeV is better explainedin terms of an extragalactic origin. Above 40 EeV,where the propagation should become less dif-fusive, there are no indications of anisotropiesassociated with either the galactic center or thegalactic plane (36).There have been many efforts to interpret the
properties of ultrahigh-energy cosmic rays in termsof extragalactic sources. Because of Liouville’stheorem, the distribution of cosmic rays mustbe anisotropic outside of the galaxy for an an-isotropy to be observed at Earth. An anisotropycannot arise through deflections of an originallyisotropic flux by a magnetic field. One predictionof anisotropy comes from the Compton-Getting
The Pierre Auger Collaboration, Science 357, 1266–1270 (2017) 22 September 2017 3 of 5
Table 2. Three-dimensional dipole reconstruction. Directions of dipole components are shown inequatorial coordinates.
Energy(EeV)
Dipolecomponent dz
Dipolecomponent d⊥
Dipoleamplitude d
Dipoledeclination dd (°)
Dipole rightascension ad (°)
4 to 8 −0.024 ± 0.009 0.006%0.003þ0.007 0.025%0.007
þ0.010 −75%8þ17 80 ± 60
.. .. ... ... .. ... .. ... ... .. ... ... .. ... .. ... ... .. ... ... .. ... ... .. ... .. ... ... .. ... ... .. ... .. ... ... .. ... ... .. ... ... .. ... .. ... ... .. ... ... .. ... .. ... ... .. ... ... .. ... ... .. ... .. ... ... .. ... ... .. ... .. ... ... .. ... ... .. ... ... .. .
≥8 −0.026 ± 0.015 0.060%0.010þ0.011 0.065%0.009
þ0.013 −24%13þ12 100 ± 10
.. .. ... ... .. ... .. ... ... .. ... ... .. ... .. ... ... .. ... ... .. ... ... .. ... .. ... ... .. ... ... .. ... .. ... ... .. ... ... .. ... ... .. ... .. ... ... .. ... ... .. ... .. ... ... .. ... ... .. ... ... .. ... .. ... ... .. ... ... .. ... .. ... ... .. ... ... .. ... ... .. .
Table 1. First harmonic in right ascension. Data are from the Rayleigh analysis of the firstharmonic in right ascension for the two energy bins.
Energy(EeV)
Numberof events
Fouriercoefficient aa
Fouriercoefficient ba
Amplitudera
Phaseϕa (°)
ProbabilityP (≥ ra)
4 to 8 81,701 0.001 ± 0.005 0.005 ± 0.005 0.005 %0.002þ0.006 80 ± 60 0.60
.. .. ... ... .. ... .. ... ... .. ... ... .. ... .. ... ... .. ... ... .. ... ... .. ... .. ... ... .. ... ... .. ... .. ... ... .. ... ... .. ... ... .. ... .. ... ... .. ... ... .. ... .. ... ... .. ... ... .. ... ... .. ... .. ... ... .. ... ... .. ... .. ... ... .. ... ... .. ... ... .. .
≥8 32,187 −0.008 ± 0.008 0.046 ± 0.008 0.047 %0.007þ0.008 100 ± 10 2.6 × 10⁻⁸
.. .. ... ... .. ... .. ... ... .. ... ... .. ... .. ... ... .. ... ... .. ... ... .. ... .. ... ... .. ... ... .. ... .. ... ... .. ... ... .. ... ... .. ... .. ... ... .. ... ... .. ... .. ... ... .. ... ... .. ... ... .. ... .. ... ... .. ... ... .. ... .. ... ... .. ... ... .. ... ... .. .
RESEARCH | RESEARCH ARTICLE
on October 31, 2017
http://science.sciencem
ag.org/Downloaded from
The anisotropy observed above 8 EeV is better explained in terms of an extragalactic origin. Above 40 EeV, where the propagation should become less diffusive, there are no indications of anisotropies associated with either the galactic centre or the galactic plane.