lessons from a hospital business intelligence implementationceur-ws.org/vol-1381/paper2.pdf ·...
TRANSCRIPT

Lessons from a Hospital Business Intelligence
Implementation
Thodoros Topaloglou and Daniele Barone
Rouge Valley Health System
2867 Ellesmere Road
Toronto, Ontario, Canada
[ttopaloglou,dbarone]@rougevalley.ca
Abstract. Organizations turn to technology as a possible solution to improve
efficiency and reduce waste in their operating processes. Most of their ineffi-
ciencies and opportunities for improvement are hiding in their process level da-
ta. This experience paper describes the information needs in a hospital setting
and the journey of delivering a business intelligence program that was designed
to address those needs. The core focus in our business intelligence work was to
deliver relevant and actionable information to the front line staff to assist them
in their work. There are two story lines in this experience paper. One is about
the value of information and evidence in solving business problems. The second
is about the information systems methods toolbox we utilized in establishing an
effective business intelligence program in an operating organization.
1 Introduction
As budgets in the not-for-profit sector are under continuous pressure, organizations
and governments turn to technology as a possible solution to drive efficiencies, reduce
waste in their operating processes, and ultimately lower their costs. At the same time
big public sector technology projects have the tendency of high cost and poor out-
comes for reasons that include the choice of architecture and implementation ap-
proach, complexity of stakeholder environment, and onerous regulatory requirements
that must be followed. Methodologies such as lean six-sigma supported by infor-
mation technology are sought as means to address process inefficiencies. Here we
present an information-based approach to enable organizations improve efficiencies in
a fiscally responsible manner.
This experience paper discusses business problems that we encountered in our
practice in a Canadian hospital setting and the business intelligence program that we
developed in order to support the organization’s strategic goals. Application of tech-
nology alone cannot solve tough business problems. A solution to a business problem
is a multidisciplinary and collaborative one. It involves understanding of goals, busi-
ness processes, data sources and business domain and user workflows. The technical
solution is not as simple as using a vendor product but it calls for methods and tools in
organization modeling, collaboration, data integration, and human factors that are
19
Proceeding from CAiSE 2015 Industry Track Copyright © 2015 held by the author(s) Krogstie, Juel-Skielse, Kabilan (Eds.)

drawn from a body of knowledge in advanced information systems engineering re-
search of the last three decades.
Most of the inefficiencies and the opportunities for improvement in an organization
are hiding in its data about its processes. Liberating these data from the esoteric sys-
tems and bringing them into a context that matches the concept model of the infor-
mation consumers and enables business problem solving, is the first step towards
bringing relevant and actionable information to front line business users. Another
enabler is to give users a self-service service environment with advanced usability and
visualization features to get the answers they need. This thinking shapes our approach
to delivering a Business Intelligence (BI) program that aims to bring information to
the front line staff to assist them in their work.
The rest of this paper is organized as follows: Section 2 introduces the business and
clinical motivation for our work, including the economic and technological challeng-
es, the need for information assisted problem solving and three example business
problems. Section 3 defines a business modeling based framework employed by our
BI implementation. Sections 4 and 5, provide information on the implementation and
results, respectively. Lastly, Section 6 sunmarizes the messages and contributions of
this work.
2 Problem Description
As demand for healthcare increases due to the ageing of the population, govern-
ments face financial pressures and cannot sustain annual increases in healthcare budg-
ets. A recent report projects that by year 2030 [1] the healthcare spent in Ontario will
rise from 42% to 70% of the provincial budget in order to care for its citizens, if noth-
ing changes in the way the healthcare system operates and spends. Studies suggest
that there is a 30% improvement opportunity in the system to be realized through
waste reduction and process improvements [2]. Information technology is one of the
enabling engines, among others such as changing health attitudes, which are called to
task for driving efficiencies in healthcare delivery [3].
The information system landscape in a hospital is a maze of enterprise, depart-
mental and personal information systems that grew organically until we realized that
we have a large integration and poor interoperability problem to solve. These systems
capture data related to operating and clinical processes. The best describing ‘organiza-
tional’ principle of hospital information systems is “not by design heterogeneity”. All
types of heterogeneity including system, data (both syntactic and semantic), and pro-
cess heterogeneity are present. To information management professionals, heteroge-
neity is not a bad thing but an inevitability that a technical architecture must handle.
However, lack of interoperability or the way that interoperability is handled can con-
tribute to information silos and process inefficiency.
In 2010 we initiated an effort to organize the hospital data and deliver relevant, ac-
tionable and timely information to clinicians, managers and front-line workers to help
them do better whatever they do, that is to deliver better patient care, or improve the
performance of the business processes they are responsible for. The foundations of
20
Proceeding from CAiSE 2015 Industry Track Copyright © 2015 held by the author(s) Krogstie, Juel-Skielse, Kabilan (Eds.)

our information strategy are to organize the hospital data around its business process-
es, and integrate data across different information silos and systems. The aims of the
strategy are to deliver a business intelligence platform that feeds the front-lines with
actionable and relevant business intelligence related to process and system perfor-
mance, assemble a knowledge base of the business processes and associated docu-
ments that capture the working memory of the organization, and provide a suite of
applications that facilitate the collection and use of clinical data in patient care which
further generates the evidence to improve clinical practice performance. Additional
goals of the strategy include easy access for users, and low maintenance and devel-
opment costs which led to a design decision to communicating information to users
through the browser thus eliminating access and deployment barriers.
The information needs in a hospital differ by stakeholder group. Senior manage-
ment needs access to clinical and financial performance and planning information
such as patient volumes, patient wait times, rate of nosocomial infections etc., in order
to create and monitor implementation of the overall strategy and management initia-
tives. Front-line staff and managers need access to process level data and performance
such as number of patients waiting for bed, turnaround time of laboratory orders etc.,
in order to make resource allocation decisions. Clinicians require up to date, patient
specific information as well as analytical data related to quality of care such as rela-
tionships between certain treatments and patient outcomes. Not all information needs
of the various groups can be answered by a query against a single source, and most
often the data that we collect are at different level of abstraction than the information
requested by the business users.
These requirements relate to many aspects of information system engineering in-
cluding business modeling, requirements engineering, data semantics, data integra-
tion, data quality, business process management and software engineering. The work
described here draws from the body of knowledge in those fields in order to create a
principled and repeatable framework to bring information to the front lines. Our con-
tributions include a system engineering framework, a reference business model of a
hospital and a business modeling notation that links people, processes and data, called
AGIO [6].
The following example business problems are used to illustrate our business re-
quirements, motivate our technical decisions, and assist the creation of an abstract
framework for a hospital business intelligence platform. They are variations of the
same pattern. It involves an actor who has a business objective or an information
need. The achievement of the objective depends on a process or resource and it is
monitored by evidence in the form of metrics (also referred to as indicators). The
calculation of a metric requires data from operational systems that are retrieved by a
business query. A business query is data request expressed in terms that are familiar
to a business user.
Corporate scorecard. The corporate scorecard is the tool used by hospital manage-
ment to track execution of the hospital’s strategy, annual operating and quality im-
provement plan, and the hospital accountability to its funder. The Rouge Valley
21
Proceeding from CAiSE 2015 Industry Track Copyright © 2015 held by the author(s) Krogstie, Juel-Skielse, Kabilan (Eds.)

Health System (RVHS) strategic plan, quality improvement plan and scorecard are
available through the its website (www.rougevalley.ca)
The RVHS corporate scorecard has four perspectives (access to care, service excel-
lence, fiscal responsibility, team engagement) and 20 indicators. The data for these
indicators come for a variety of sources. Many indicators are rollups of indicators at
the department and division level. The users of the corporate scorecard monitor the
indicators on a monthly basis in order to detect potential issues that need to be miti-
gated.
Patient flow. Patient flow is defined as the set of hospital processes that move the
patient through the system while receiving care. The typical patient journey in a hos-
pital starts with the arrival of the patient at the emergency department or for a sched-
uled surgical appointment. While the majority of patients arriving to the emergency
department are discharged to home, some with an acute illness are admitted for treat-
ment often followed by some post-acute rehabilitation and when their care is com-
pleted discharged to home or long-term care facilities. The goal of the hospital is to
provide good medical care in an efficient manner, which means to minimize the
length of stay (LOS), which is good both for the patient and the system, as the bed
occupied by this patient can be used sooner for the next patient who needs it.
The hospital patient flow problem can be abstracted as a chain of supply-demand
relationships between departments depending on bed capacity and turnover. There is a
lot of waiting happens between and within the stages of care which impact LOS and
slows down flow. In order to create flow, we have to minimize the various type of
wasteful wait. The information systems solution to patient flow is to provide the right
information to the various actors across the value chain, i.e., create process visibility
through data.
Hospital reports delivery. Healthcare delivery is a distributed process. A patient
receives primary care by a family doctors in a community setting, acute care in hospi-
tals and sees many specialists in a hospital or in the community. For the most part, the
various actors communicate with written notes. One of the hospital processes to facili-
tate continuity of care is to send hospital reports (such as discharge notes, and test
results) to the community-based providers after each patient encounter. One of our
hospital’s strategic objectives is to improve hospital access to family doctors, which
among other things translates to delivering to them hospital reports of their patients
within set time targets. Operationalization of this strategy involves two information
systems that support parts of the reports delivery process, and the need for a system to
monitor process performance. A performance metric based on this process is also
present in the corporate scorecard.
22
Proceeding from CAiSE 2015 Industry Track Copyright © 2015 held by the author(s) Krogstie, Juel-Skielse, Kabilan (Eds.)

3 Framework
In the previous section we presented three business situations that require access to
data at a level that meets management needs. All three situations describe a need in
the language and context of the business. We call this the business level. Integral in
the descriptions of the three business situations above, are the concepts of actors and
processes. Less explicit in these situations is the technology and data world that are
required to respond to the business problems. We introduce the term business query to
refer to, and represent a data need, at the business level. Business queries are stated at
a level where there is no or limited knowledge of the ability of an organization to
answer them. Here we present a structured process for bridging the business level
with the process level and the data level. In order for these worlds to interoperate
effectively, it is important to establish a framework that defines a set of common con-
cepts and uses a series of linked models expressed in existing conceptual modeling
notations to bridge business, process and data levels. These models form the building
blocks of our BI platform and they are used as scaffolds for problem specific applica-
tions that are realized through the platform.
Figure 1 outlines the framework and describes the modeling methods leveraged by
it. The key mechanism that ‘links’ the three levels is the AGIO mechanism that con-
stitutes one of contributions of our work. A technology stack assembled in the portal
complements the conceptual framework. The portal is the actual environment that
delivers the BI platform and it is discussed in Section 4.
Business Level: The key concepts encountered at this level include strategies, ac-
tions, risks and indicators.
There is a plethora of strategy modeling notations coming both from business man-
agement and conceptual modeling fields [4],[5]. We found social modeling using goal
models [12] to be an effective model to express a decomposition of a high level stra-
tegic objective to actionable ones. For example one of our IT strategy objectives is to
“bring relevant, actionable and timely information to front-line staff” which is de-
composed to “create a business intelligence program”, “develop expertise in hospital
data”, and “create a strategy to enterprise data integration”. These strategies are fur-
ther decomposed until they become actionable. An actionable strategy is assigned to
an Actor who has a specific objective, an indicator to measure achievement of the
objective, and finally a resource (process or data) where we source the data for calcu-
lating the indicator. The mechanism that does the linking is the AGIO diagram [6].
At the business level, it is essential to maintain a map of business actors, also
known as stakeholders. We found that two types of actor maps that work well in prac-
tice are organization (org) charts and stakeholder lists. Org charts show the flow of
accountability. A stakeholder list captures the objectives and responsibilities (pro-
cesses and metrics) for each stakeholder group. A stakeholder list is a reusable re-
source that is customized and included in project documents.
There is a robust literature on the use of indicators, also called metrics, to measure
the success of a goal or the performance of a process [7]. We adopted and adapted the
conceptual framework for indicators from [8]. The two main adaptations are the con-
23
Proceeding from CAiSE 2015 Industry Track Copyright © 2015 held by the author(s) Krogstie, Juel-Skielse, Kabilan (Eds.)

cept of the indicator map, a graphical representation of a collection of indicators and
indicator relationships, and a standardized indicator metadata specification, called
AGIO sheet, that is used to specify the presentation of indicators in business intelli-
gence dashboards, including the formula or the query that calculates the indicator.
Choosing and designing indicators is delicate task. Outcome indicators are either
given to us, for instance hospitals have to report on several healthcare outcome indi-
cators mandated by public authorities, or created relative to goals they measure. Pro-
cess based indicators are discussed in the next section.
Risks are powerful drivers at the business level. A risk is a statement that describes
the possibility of an unwanted future event to happen. The modeling construct that we
routinely use is that of risk catalog, where next to each risk we record a series of miti-
gating actions that will prevent the unwanted event to happen. Mitigations are action-
able strategies similar to those discussed above in strategy models. For example, one
risk documented in our IT strategies risk catalog is the “information risk” which is
decomposed to “front-line staff does not have information to make patient flow deci-
sions” and “patient information is separated from the patient at care transition points”.
The mitigation to the first is to “develop a patient flow specific business intelligence
application”.
Fig. 1. Business Intelligence Framework Overview
In summary, the business level captures business requirements. Technically it
drives the creation of a series of linked models following conceptual modeling para-
digms and notations originating from computer science and enterprise modeling. Sev-
eral adaptations, mostly simplifications, were made to those models in order to in-
crease their usability by less technical business stakeholder. The collection of con-
cepts and models employed, forms a business level ontology with strong similarities
to the Business Intelligence Model (BIM) proposed in [9].
Business Level
Process Level
Data Level
Strategy model Indicator maps AGIO sheets Risk catalogs
Process maps BPMN diagrams Process hierarchies
Schemas, ER Diagrams Schema mappings ETL models
AG
IO
Po
rtal
Methods
24
Proceeding from CAiSE 2015 Industry Track Copyright © 2015 held by the author(s) Krogstie, Juel-Skielse, Kabilan (Eds.)

Process Level. This level documents a collection of operational processes organized
in a specialization hierarchy. The key concepts encountered at this level are process,
sub-process, activity, role, IT system and document.
We document business process knowledge using the de-facto modeling notation
for business process modeling, BPMN (www.bpmn.org). In addition we link process-
es to data systems, documents, roles and physical environment, thus creating a spider
web of knowledge. Given that most of the interdisciplinary collaboration within an
organization is done at the process level, it is of paramount importance that there is a
common understanding and a single source of truth around processes, and processes
are communicated using an intuitive graphical representations. The added value is
also the ability to reason and decide on meaningful process level indicators that are
used to measure process performance.
Processes are operationalized by one or more information systems that facilitate
execution and collection of process data, but it is also common that many processes
are manually executed and process data are collected manually. The documentation of
the link between processes and data is critical to business problem solving.
Data Level. This level refers to the data assets in an organization from databases,
datasets, data collections, processed data, excel files, personal data etc. The problem
and challenges of data heterogeneity at the physical, syntactic and semantic level in
organizations is well documented [13]. The toughest of all problems is the multiple
definition and names for every concept that are used by the different stakeholder
groups. A common solution to this problem is the creation of an enterprise data ware-
house that harmonizes the semantics of the same concept from multiple systems and
sources, and keeps up-to-date instance data for those concepts that we can program-
matically harvest in it.
The supporting metadata of the data warehouse include schemas, ER diagrams,
schema mappings, ETL scripts, data cleansing and data quality scripts and sample
data. This knowledge may often be buried inside data management platform, some-
times even inside proprietary platforms, but here we make the point that it needs to be
Actor Emergency Dept. Manager
Goal Reduce the % of patients
leaving without being seen
Indicator % patients left without being
seen
Object Physician initial assessment
process
AGIO instantiation
Fig. 2. AGIO Diagram
AGIO
Strategy (Goal)
Process
(Object)
Measure (Indicator)
Accountability (Actor)
Responsible for Supported by
measures informs
25
Proceeding from CAiSE 2015 Industry Track Copyright © 2015 held by the author(s) Krogstie, Juel-Skielse, Kabilan (Eds.)

documented, organized and versioned in the source code control system of the organi-
zation, and under proper data governance practices.
AGIO. The rationale for AGIO is to facilitate the linking of different perspectives as
mentioned earlier (see Fig 2). The second use case for AGIO is to facilitate the design
and documentation of indicators, the concept that we earlier referenced as AGIO
sheet. An AGIO diagram represents graphically the link of a goal that an actor has to
the object (process or resource) that the actor uses to achieve this goal, and to the
metric that the actor evaluates in order to assess progress or achievement of the goal.
Ultimately, an AGIO tells the story of the actor who wishes to achieve a goal, the way
it goes about achieving it, and the way to know if it is achieved. A corporate strategy,
or one’s endeavors towards a goal can be broken down, as demonstrated in the eval-
uation section, in linked network of AGIO diagrams. These diagrams communicate
how to establish relevant business requirements and monitoring tools.
AGIO is a design time concept that we use to link goal, processes and data. The
operational concept that links business process management with business intelli-
gence is the Define-Measure-Access-Improve-Control (DMAIC) cycle. DMAIC is
widely used in the process improvement and lean six sigma practices [10]. The core
premise is that a process improvement is informed by measurement of process per-
formance in a continuous cycle. The Define and Improve steps that map to the Pro-
cess Level, Measure, Access and Control are responsibilities of the Data Level.
DMAIC is an embedded method in our framework. The integration of the modeling
tools with business intelligence reporting enabled the rapid execution of DMAIC
cycles and an engine to support lean improvements.
4 Implementation
An enterprise BI implementation aims to deliver a storefront for generic and prob-
lem specific data access that is backed by a data warehouse, and series of data marts.
In [6] we discuss the methodology of a business model driven data warehouse design.
In addition to business relevance a data warehouse must be trusted from a content
perspective. We have performed significant amount of data quality work in the back-
end in order to assure the quality of the data in the warehouse. Here we will mostly
talk about the front-end that is the component our front-line users experience.
The portal is a web application that acts as the canvas to publish the various func-
tionalities of the BI platform. The portal contains a shared by all applications user
authentication module and role based access control such that only authorized to cer-
tain content users receive access to it. The front page is divided in four sections each
supporting a different need. These include an application hosting area, the corporate
BI front page, access to the document world and intranet resources, and an area for
patient care specific content. The idea is to offer to our front-line staff a one stop shop
for all the information needs.
The core BI application involves a series of dashboards, where a dashboard is a
page with information specific to a situation including indicators and aggregated di-
26
Proceeding from CAiSE 2015 Industry Track Copyright © 2015 held by the author(s) Krogstie, Juel-Skielse, Kabilan (Eds.)
mensional data that a business user is able to navigate through in order to solve a
problem, or receive process specific statistics. A common type of dashboard that our
users are interested in is a scorecard. Scorecards are a type of dashboards good for a
big picture view of a business situation. Real time views are best suited for front-line
staff. Next section describes a few sample dashboards of our implementation.
Dashboards are based on ‘canned’ business queries and target/support specific
business situations. Regardless on how well one can anticipate the user information
needs, there are always situations where ad-hoc information is needed that are not
delivered by a dashboard. For this reason our platform provides an ad-hoc query tool.
Dashboard themes also tend to be reused. For this reason we created a set a configu-
rable dashboard objects that are easily deployable (in matter of hours) and configured
based on metadata extracted from business queries while consuming data results of
the corresponding data queries.
It is important to mention that the technology stack that is behind our BI platform
is primarily based on open source components and libraries, and as the result is low
cost from a license perspective.
5 Evaluation
In Section 2 we described three business situations describing business information
needs that can be formulated as business queries. In this section we show how these
business queries are handled in the BI framework and implementation described in
Sections 3 and 4, respectively. We also share the lessons learned from our experience
of creating a BI program in an operating organization.
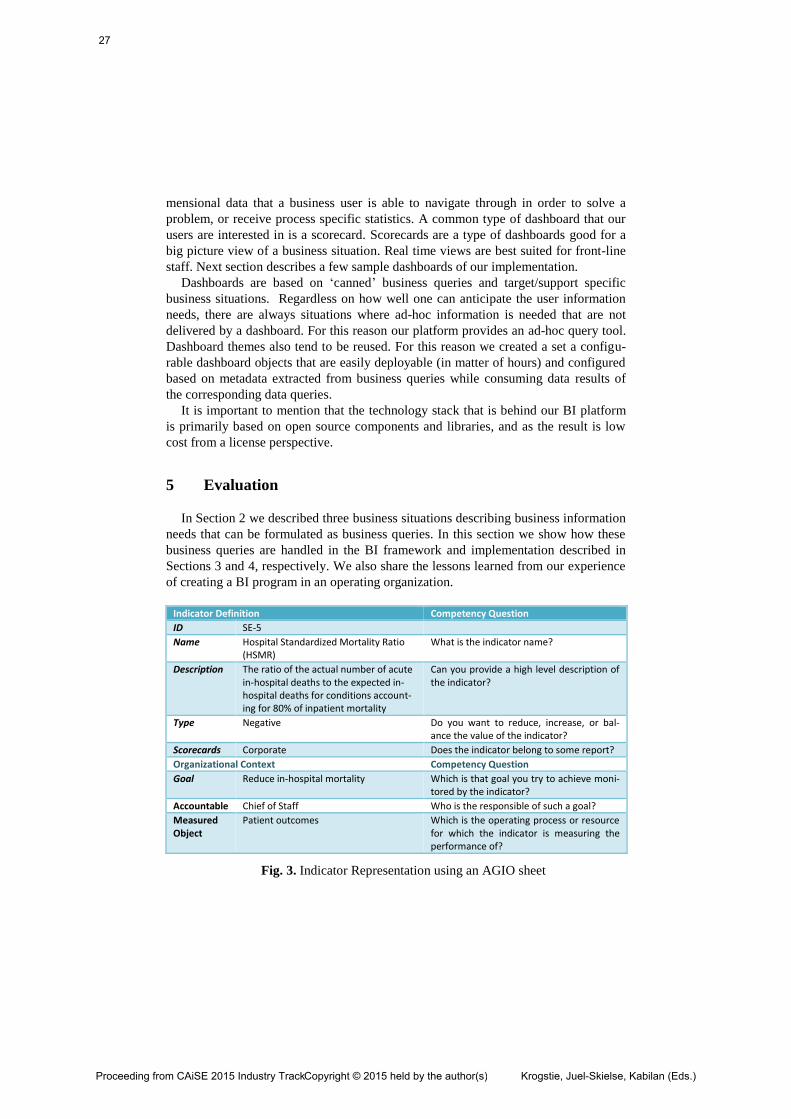
Indicator Definition Competency Question
ID SE-5
Name Hospital Standardized Mortality Ratio (HSMR)
What is the indicator name?
Description The ratio of the actual number of acute in-hospital deaths to the expected in-hospital deaths for conditions account-ing for 80% of inpatient mortality
Can you provide a high level description of the indicator?
Type Negative Do you want to reduce, increase, or bal-ance the value of the indicator?
Scorecards Corporate Does the indicator belong to some report?
Organizational Context Competency Question
Goal Reduce in-hospital mortality Which is that goal you try to achieve moni-tored by the indicator?
Accountable Chief of Staff Who is the responsible of such a goal?
Measured Object
Patient outcomes Which is the operating process or resource for which the indicator is measuring the performance of?
Fig. 3. Indicator Representation using an AGIO sheet
27
Proceeding from CAiSE 2015 Industry Track Copyright © 2015 held by the author(s) Krogstie, Juel-Skielse, Kabilan (Eds.)

Fig. 4. (a) Corporate Scorecard View, (b) Zoom-in to indicator level
28
Proceeding from CAiSE 2015 Industry Track Copyright © 2015 held by the author(s) Krogstie, Juel-Skielse, Kabilan (Eds.)

5.1 Business Situations
Corporate Scorecard. Given that the indicators in the corporate scorecard are prede-
termined the construction of a strategy model was not necessary. Each indicator was
described using an AGIO sheet as shown in Fig. 3 (partial view). AGIO sheets are
translated to indicator pages in the implementation in a straight forward, but yet man-
ual fashion. Given the high level nature of the corporate level indicators the process
level was skipped. The values were pre-calculated and loaded to a generic scorecard
data schema. The dashboard implementation is based on a generic, reusable template
that groups indicators under the four corporate priority areas (access to care, service
excellence, team engagement, and fiscal responsibility) with the ability to zoom in/out
to data details and comment history (Figs 4a-4b). This dashboard has public visibility
and enables every member of the staff and governors to be up-to-date about the hospi-
tal’s operating performance.
Patient Flow. At the highest level patient flow is a process that is linked to the goal
of improving access to hospital services for patients which is measured by the length
of stay (LOS). This goal is divided into two sub-goals one for the emergency depart-
ment and one for the impatient stay based in knowledge of the process structure. The
goal analysis can continue and a strategy and indicators map is constructed (details on
construction of strategy and indicator maps are described in [6]). The process maps in
Figs. 6a-6b illustrate process details still at a high level. These processes are further
refined (not show here) to sub-process and tasks performed by stakeholders. This
process knowledge informs us on ‘what’ to measure. The strategy map defines ‘why’.
A further elaboration of each process level indicator using AGIO indicator sheets
elicits the ‘how’. The complete bundle of the models that we create defines the BI
application design document. The use of the structured, model based methodology to
BI design ensures that the end product is relevant and meaningful for a business per-
spective; the indicators are actionable as they are connected to goals and strategies,
and we end up measuring things that matter based on actual process knowledge.
One of the first patient flow dashboards that was created, called ED Now, intended
to give a bird’s eye of the ED process in the two RVHS hospital sites, showing arri-
vals and departures on hourly basis, compared to traffic of same day of the week over
the last twelve periods, in order to detect high/low activity (Fig. 6). The dashboard
was modeled after the process in Fig.5b, and it also shows the number of patient wait-
ing at the various steps of the process in order to create awareness to front line about
approaching bottlenecks and signal need for action.
Hospital Reports Delivery. This example explains how business queries are derived
starting from a strategy. We defined business query as a request for information to
solve a business problem expressed in business terminology. The high level strategy
is to ‘improve access to hospital for community physicians’ which is broken down to
sub-strategies that are documented in a goal model. In practice we use a mind map
program (www.xmind.net) the represent goal decomposition and refinement. The
stepwise decomposition continues until the response strategy is actionable. For exam-
29
Proceeding from CAiSE 2015 Industry Track Copyright © 2015 held by the author(s) Krogstie, Juel-Skielse, Kabilan (Eds.)
ple the second level strategy is ‘reduce time of discharge summary to physicians’, and
a next level one is ‘reduce transmission errors’ which followed by ‘maintain accurate
physician dictionary’ that is an actionable strategy. An AGIO is used to link the parts:
Actor: Informatics, Goal: ‘achieve 100% accurate physician data’, Indicator:’# dic-
tionary corrections per month’, Object: Providers dictionary.
Another goal is to deliver hospital reports within a set time target from the time of
discharge. The business questions are ‘am I meeting my target’ or ‘are there any is-
sues that might prevent me from meeting my target’. An indicator that calculates the
90th percentile of the time from patient discharge to report delivery answers the first
query. This indicator is published in several dashboards. The second query starts with
an analysis of the process to find process control metrics that can be predictors of
success, in this case the length of the report transcription work queue. This leads to
data query. These data queries are made available through the portal as custom re-
ports, and they are created after an analysis like the one described here.
5.2 Summary and Lessons Learned
We described an approach to solve business problems using information that in-
volves business modeling and it is incorporated in, and empowered by a business
intelligence platform. The platform is implemented and it is in use in a real organiza-
tion, producing results. The framework used in the creation of the platform is general-
izable. The core principle in the framework is to deliver a relevant and actionable BI,
and it achieves that through the collection and documentation of a range of useful
metadata that explain the business situation, the responding strategies, control indica-
tors and linkages to data. Users of the BI implementation have commented the ease by
which they can understand process performance at a glance.
We learned many lessons in the course of our BI journey, and not all of them were
related to technology. In fact the most fascinating observation is how the BI platform
affected change in the organization, altered attitudes towards use of information, and
fundamentally transformed our BI team from system developers to data problem solv-
ers [11].
Our end-users are used to expect regular data reports and process surveillance data
in order to contact their business. We measure the users dependency on data by the
helpdesk calls that we receive anytime there is a system glitch or data delay. We also
notice that users take actions and make strategic and operational decisions based on
the data evidence they receive. This is reflected in the performance metrics of the
processes that are managed with the help of the BI tools we provide. Effectively, BI
has become the engine that drives continuous improvement and business perfor-
mance. We believe that there are several reasons why this is happening. First is the
business relevance of our BI platform because it is derived through an extensive busi-
ness, organization and process modeling. Second is data immediacy, as process level
data are communicated to end-user promptly to enable the cycle of assessing and
responding. When we first provided visibility of processes through data, the initial
reaction was to verify if the data were correct, or reflected real phenomena.
30
Proceeding from CAiSE 2015 Industry Track Copyright © 2015 held by the author(s) Krogstie, Juel-Skielse, Kabilan (Eds.)

Fig. 5. (a) High level patient flow process, (b) ED flow process
Fig. 6. ED Now Patient Flow Dashboard
This sparked both investigations on data quality and data semantics. For example,
multiple names for the same entity or multiple definitions of similar concept such as a
clinic visit had to be reconciled and accurate reference models were created. The ben-
efit of such improvements goes beyond having better data. It contributes to better
31
Proceeding from CAiSE 2015 Industry Track Copyright © 2015 held by the author(s) Krogstie, Juel-Skielse, Kabilan (Eds.)

communications. Moreover, our end-users ask for additional data evidence and ex-
pansion of the BI system to cover more processes and data domains.
As system developers we often focus on the delivery of a solution that meets the
requirements, but we are not necessarily responsible in realizing business value and
move performance indicators through the operation of the system. In this project this
was not the case, mainly because the BI project was a partnership of corporate, clini-
cal and technology departments with a clear objective to address business problems
such as the patient flow problem. Also the quest to assess and validate the quality of
data became a joint accountability as business and technology experts had help each
other. The result was a shift in mentality and focus of our technical team, from tool
smiths to problem solvers within the organization.
On the technical level, we had to remove a few barriers too. One is the absence of a
good development lifecycle model for a BI project. BI is not software development
where we enjoy an abundance of methods and tools to support the development pro-
cess. We desired to have a similar way to design and implement BI solutions by creat-
ing models. As such, we adopted the approach from strategic business modeling [8]
and extended it with the development framework that was presented in Section 3, and
[6]. The end result is a principled approach to design BI solutions as was demonstrat-
ed with the running examples in this paper. Another dilemma was the buy vs. build
decision. After weighing the pros and cons we end up creating a technology stack to
allow us to follow the above described conceptual modeling driven framework. Our
technology stack combines standard commercial data management technologies, e.g.,
DMBS, dimensional modeling and integration services, with open source components
and libraries for dashboard development and data visualization, and as the result is
low cost from a license perspective. Cost was not the only deciding factor. After the
framework abstractions were developed, it was easier and faster to implement those
using basic principles and components than mapping them to a different framework
model of a COTS BI system. Another deciding factor was access to expertise. COTS
BI platforms are proprietary systems that require specialized expertise which is chal-
lenging to acquire and in the long term restrictive of being able to grow our BI system
capabilities.
6 Conclusions
There are two story lines in this experience paper. One is about the value of infor-
mation in solving business problems. The second is about the information systems
methods and tools that were assembled in a framework that led to the creation of a
business intelligence platform that delivers information to the front line staff and
management.
Having data and process visibility benefits an organization to improve its operating
efficiency. During the development of our BI program we have seen an increased
awareness in information quality and use of evidence in decision making. One of the
several lessons that we learned in our BI journey is that through business modeling
the information technology team converted from implementers to business problem
solvers. A big enabler of delivering useful information was to fit data into a concept
32
Proceeding from CAiSE 2015 Industry Track Copyright © 2015 held by the author(s) Krogstie, Juel-Skielse, Kabilan (Eds.)

model that matches that of the information consumer using methods form business
modeling, data semantics, data integration and data quality.
The creation of the hospital BI program was a result of a partnership with other
disciplines such as finance, decision support, and clinical operations, and it was a
tremendously educational experience to all.
The lessons from the BI journey presented in this paper are drawn from a specific
experience in healthcare but in our opinion they are broadly applicable to organiza-
tions that rely on evidence based decision making in resource constrained environ-
ments.
References
1. Ontario’s Action Plan for Healthcare (http://health.gov.on.ca/en/ms/ecfa/healthy_
change/docs/rep_healthychange.pdf). 2013.
2. Institute of Medicine. Best Care at Lower Cost: The Path to Continuously Learn-
ing Health Care in America (www.nap.edu/openbook.php?record_id=13444).
2012.
3. Colin Jervis. Stop saving NHS, start reinventing it. Kinetic Consulting. 2013
4. Samavi R., Yu E., Topaloglou T. Strategic Reasoning about Business Models: A
Conceptual Modeling Approach. Journal of Information Systems and e-Business
Management. Vol 6, 2008.
5. Kaplan, R.S., Norton, D.P.: Strategy Maps: Converting Intangible Assets into
Tangible Outcomes. Harvard Business School Press (2004)
6. Barone D., Topaloglou T., Mylopoulos J. Business Intelligence Modeling in Ac-
tion: A Hospital Case Study. In Proceedings of the 24th international conference
on Advanced Information Systems Engineering (CAiSE'12), Springer-Verlag. pg.
502-517. 2012 ( http://dx.doi.org/10.1007/978-3-642-31095-9_33).
7. Robert D Austin, "Measuring and Managing Performance in Organizations".
Dorset House. 1996.
8. Horkoff J., Barone D., Jiang L., Yu E., Amyot D., Borgida A., Mylopoulos J.,
“Strategic Business Modeling: Representation and Reasoning”, Software and Sys-
tem Modeling (SoSyM), Springer-Verlag, October 2012.
9. Jiang L., Barone D., Amyot D., Mylopoulos J.: Strategic Models for Business In-
telligence. In Proceedings of ER 2011.
10. Hans Skalle, Bill Hahn. Applying Lean, Six Sigma, BPM, and SOA to Drive
Business Results. IBM Redbooks Series. 2013.
11. T.H. Davenport, D.J. Patil. Data Scientist: The Sexiest Job of the 21st Century.
Harvard Business Review 90, no. 10 (October 2012): 70–76.
12. Eric Yu. "Social Modeling and i*." Book chapter in: Conceptual Modeling:
Foundations and Applications - Essays in Honor of John Mylopoulos. A. T. Bor-
gida, V. Chaudhri, P. Giorgini, E. S. Yu (eds). LNCS volume 5600. Springer,
2009. pp. 99-121
13. T. Topaloglou, S. Davidson, H.V. Jagadish, V.M. Markowitz, E. Steeg, M. Tyers.
Biological Data Management: Research, Practice and Opportunities, VLDB 2004,
1233-1236.
33
Proceeding from CAiSE 2015 Industry Track Copyright © 2015 held by the author(s) Krogstie, Juel-Skielse, Kabilan (Eds.)