lessons from the dramatic achievement gains of the 1990s ......ewer children left behind lessons rom...
TRANSCRIPT
FEWER CHILDREN LEFT BEHINDLessons From the Dramatic Achievement
Gains of the 1990s and 2000sBY MICHAEL J. PETRILLI
OCTOBER 2019

Fewer Children Left Behind: Lessons From the Dramatic Achievement Gains of the 1990s and 2000s
2 of 30
The Thomas B. Fordham Institute promotes educational excellence for every child in America via quality research, analysis,
and commentary, as well as advocacy and exemplary charter school authorizing in Ohio. It is affiliated with the Thomas B.
Fordham Foundation, and this publication is a joint project of the Foundation and the Institute. For further information, please visit our website at www.fordhaminstitute.org. The Institute is neither
connected with nor sponsored by Fordham University.
3 of 30
CONTENTS
4 RISING STUDENT OUTCOMES IN THE NO CHILD LEFT BEHIND ERA
10 THE ROLE OF IMPROVING ECONOMIC CONDITIONS FOR FAMILIES IN THE 1990s AND 2000s
21 STATES THAT BEAT THE SOCIOECONOMIC CURVE
28 LESSONS FOR REFORM TODAY—AND TOMORROW
INTRODUCTIONEarlier this year, speaking in front of the Education Writers Association, Secretary Betsy DeVos said that decades of reform efforts and increased social spending, both inside and outside of schools, “hasn’t ultimately improved anything for any students, particularly not for the most vulnerable students.” It’s a standard refrain from DeVos, and many other reformers as well, when making the case that past efforts have failed and it’s time to try something different. Even my friend Rick Hess, after acknowledging big gains in math achievement, has argued that “a fair assessment” of the past two decades of reform “would admit that there has been a lot of action, but not much in the way of demonstrated improvement.”
In this white paper, I’m going to dig into these claims, all in pursuit of determining whether America’s schools have improved over the past quarter-century of reform. That’s a big, daunting question, because it requires looking not just at outcomes—test scores, graduation rates, college completion, and the like—but also at changing social conditions. As we will see, the untold story of the past several decades—at least until the Great Recession—is that poor kids in America are doing much better than before, and that has served as a welcome tailwind for efforts to improve America’s schools.

4 of 30
RISING STUDENT OUTCOMES IN THE NO CHILD LEFT BEHIND ERAA straightforward question is whether outcomes have improved. And here the answer is easy and encouraging: Yes, absolutely—until the Lost Decade of Academic Achievement.
This is how my colleague Nicholas Munyan-Penney and I put it two years ago, as we were preparing for the release of the 2017 NAEP scores:
There have been gains almost across the board since the 1990s. But progress is generally much larger in math than in reading; in fourth grade than in eighth grade; in eighth grade than in twelfth grade; for African American and Hispanic students than for whites; and for low performers than for high performers.
Most of the gains happened in the 1990s and early 2000s. The exception is reading, for which the 1990s were often flat, or even down. And progress in most categories has been very meager since the mid-2000s. Somewhere around 2007 or 2009, promising momentum petered out.
Progress in math has been especially remarkable. Black eighth graders gained 23 points from 1990 to 2015, Hispanic students gained 24, and white students gained 22. That’s roughly equivalent to two grade levels, and means that students are coming into high school much better prepared than they were two decades ago. That may help to explain at least some of the increase in America’s graduation rate, though it hasn’t yet translated into much progress in twelfth grade math achievement.
Children of color are reading much better in the early grades than before. Hispanic and black fourth graders respectively gained 20 and 21 points from 1994 to 2015, while their white peers gained 8. As with the other trends, the most progress came in the late 1990s and early 2000s. Maybe it was because of improved reading instruction in the phonics/Reading First era, or maybe it reflected improved socioeconomic conditions for children of color in the 1990s. Either way, the gains for eighth graders were only half as large, and they all but evaporated by twelfth grade. In fact, there were marked declines for twelfth graders in the tenth percentile, perhaps because more low achievers were staying in school rather than dropping out.
That last point is critical, because it points to the clearest disappointment: Twelfth grade scores in reading and math are flat as a pancake. And it’s achievement at the high school level that DeVos and others use when making the case that our schools haven’t improved a lick.
To be sure, it’s extremely frustrating that twelfth grade achievement hasn’t improved, and could be an indictment of our high schools, which have been mostly impervious to reform pretty much forever. But there could be other explanations. It could be that the rapidly rising graduation rate (the black “four-year adjusted cohort graduation rates” is up 11 percentage points since 2010; for Hispanic students it’s 9 percentage points) means that

Fewer Children Left Behind: Lessons From the Dramatic Achievement Gains of the 1990s and 2000s
5 of 30
there are more low-performing students taking NAEP, students who in the past would have already left school. Or maybe there’s another socioeconomic explanation.
It definitely doesn’t mean our elementary and middle schools aren’t getting better outcomes, though, especially for their lowest performing students. Consider the trends seen in Figures 1–2.
Figure 1. Percentage of fourth graders scoring below basic in reading on NAEP
Figure 2. Percentage of eighth graders scoring below basic in math on NAEP
Source: The author calculated Figures 1–2 using the NAEP Data Explorer: https://www.nationsreportcard.gov/ndecore/landing.

Fewer Children Left Behind: Lessons From the Dramatic Achievement Gains of the 1990s and 2000s
6 of 30
Finally, it’s extremely encouraging that the four-year college completion rate (for all Americans between the ages of twenty-five and twenty-nine, not just those who graduated high school or even went to college) rose from 25 percent in 1995 to 37 percent in 2018 (see Figure 3). That’s a whopping 50 percent increase. And while racial completion gaps remain large, there’s been huge progress for African Americans and especially Hispanics, increasing their completion rates 47 percent and a remarkable 133 percent respectively over the past quarter century. (Though as my colleague Checker Finn points out, lower graduation standards may be part of the story here too.)
Figure 3. Percentage of 25–29 year olds with a four-year degree or higher
Source: National Center for Education Statistics, U.S. Department of Education, “Table 104.20. Percentage of persons 25 to 29 years old with selected levels of educational attainment, by race/ethnicity and sex: Selected years, 1920 through 2018” in Digest of Education Statistics 2018 (Washington, DC: 2018): https://nces.ed.gov/programs/digest/d18/tables/dt18_104.20.asp.
Student outcomes have improved in more than just reading and mathA fair question is whether student progress was limited to the two basic subjects of reading and math, especially since they were the focus of state and federal accountability systems over this period. So let’s take a look at results from the National Assessment of Educational Progress for most of the other academic subjects, too. As has been my practice, we’ll examine trends over time for the national sample, broken down by the major racial groups, as well as by percentiles. This will give us much better information than looking at averages alone.
You can peruse the NAEP charts (Figures 4–5) on pages 7–8 and come to your own conclusions, but here’s what I see:
Fewer Children Left Behind: Lessons From the Dramatic Achievement Gains of the 1990s and 2000s
7 of 30
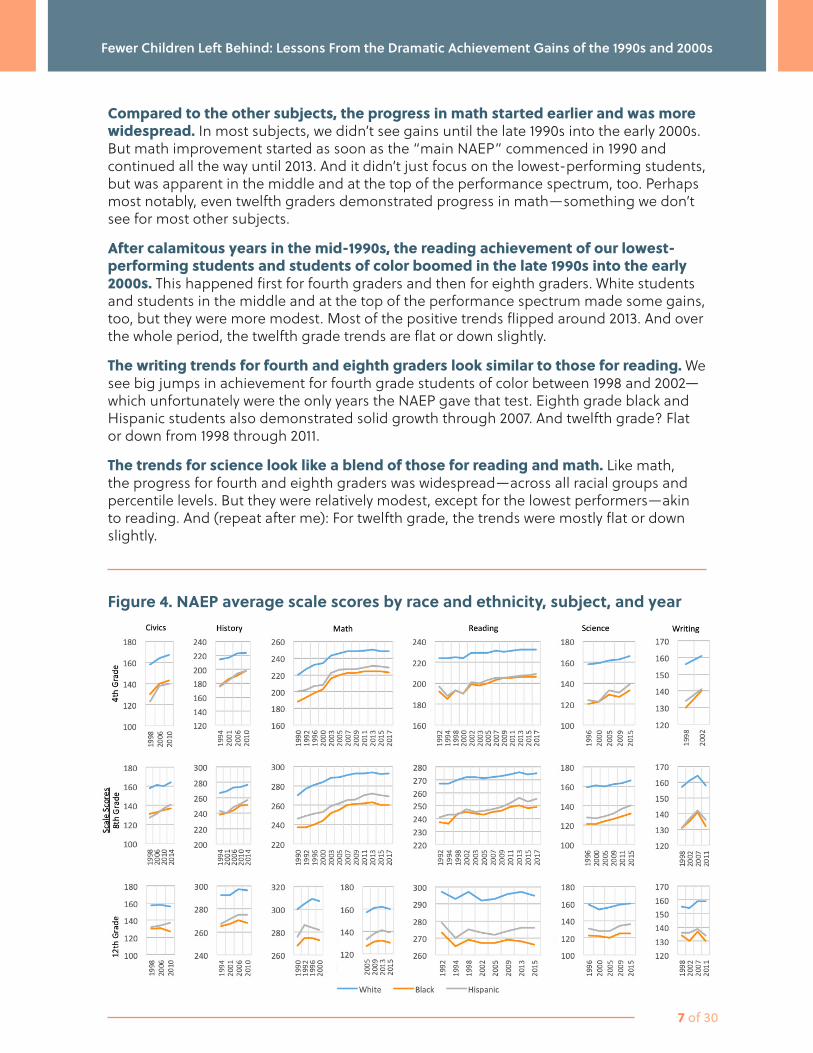
Compared to the other subjects, the progress in math started earlier and was more widespread. In most subjects, we didn’t see gains until the late 1990s into the early 2000s. But math improvement started as soon as the “main NAEP” commenced in 1990 and continued all the way until 2013. And it didn’t just focus on the lowest-performing students, but was apparent in the middle and at the top of the performance spectrum, too. Perhaps most notably, even twelfth graders demonstrated progress in math—something we don’t see for most other subjects.
After calamitous years in the mid-1990s, the reading achievement of our lowest-performing students and students of color boomed in the late 1990s into the early 2000s. This happened first for fourth graders and then for eighth graders. White students and students in the middle and at the top of the performance spectrum made some gains, too, but they were more modest. Most of the positive trends flipped around 2013. And over the whole period, the twelfth grade trends are flat or down slightly.
The writing trends for fourth and eighth graders look similar to those for reading. We see big jumps in achievement for fourth grade students of color between 1998 and 2002—which unfortunately were the only years the NAEP gave that test. Eighth grade black and Hispanic students also demonstrated solid growth through 2007. And twelfth grade? Flat or down from 1998 through 2011.
The trends for science look like a blend of those for reading and math. Like math, the progress for fourth and eighth graders was widespread—across all racial groups and percentile levels. But they were relatively modest, except for the lowest performers—akin to reading. And (repeat after me): For twelfth grade, the trends were mostly flat or down slightly.
Figure 4. NAEP average scale scores by race and ethnicity, subject, and year
Fewer Children Left Behind: Lessons From the Dramatic Achievement Gains of the 1990s and 2000s
8 of 30
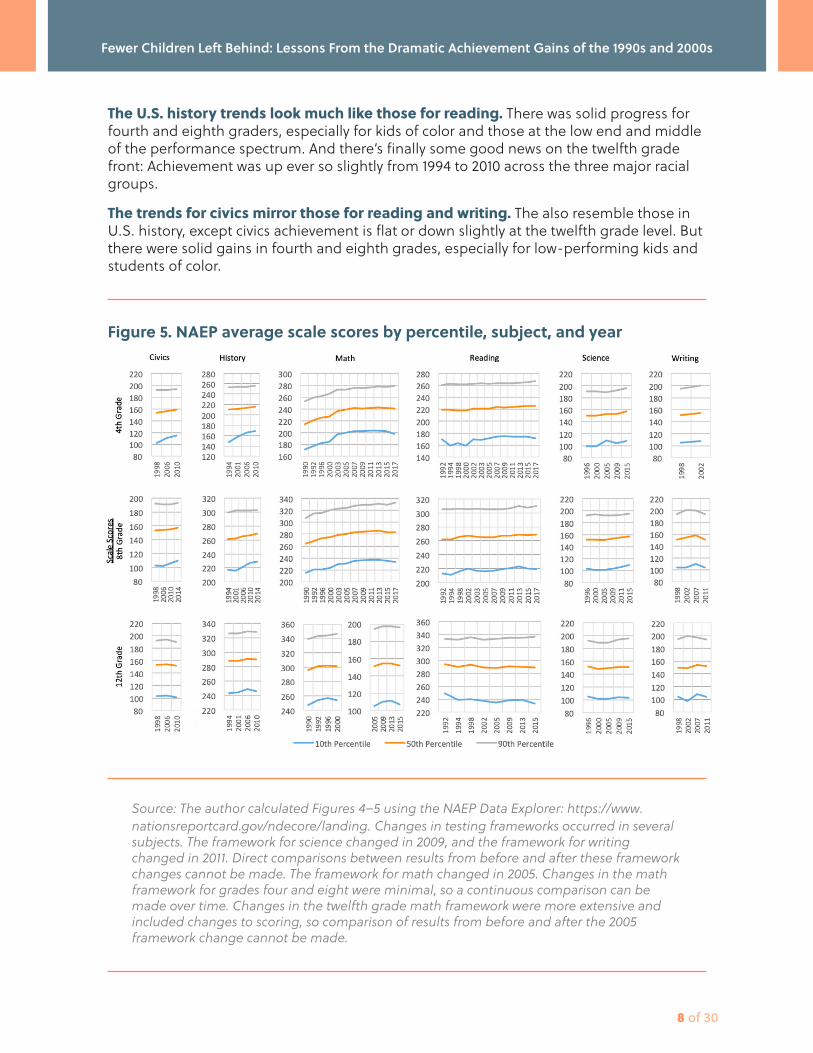
The U.S. history trends look much like those for reading. There was solid progress for fourth and eighth graders, especially for kids of color and those at the low end and middle of the performance spectrum. And there’s finally some good news on the twelfth grade front: Achievement was up ever so slightly from 1994 to 2010 across the three major racial groups.
The trends for civics mirror those for reading and writing. The also resemble those in U.S. history, except civics achievement is flat or down slightly at the twelfth grade level. But there were solid gains in fourth and eighth grades, especially for low-performing kids and students of color.
Figure 5. NAEP average scale scores by percentile, subject, and year
Source: The author calculated Figures 4–5 using the NAEP Data Explorer: https://www.nationsreportcard.gov/ndecore/landing. Changes in testing frameworks occurred in several subjects. The framework for science changed in 2009, and the framework for writing changed in 2011. Direct comparisons between results from before and after these framework changes cannot be made. The framework for math changed in 2005. Changes in the math framework for grades four and eight were minimal, so a continuous comparison can be made over time. Changes in the twelfth grade math framework were more extensive and included changes to scoring, so comparison of results from before and after the 2005 framework change cannot be made.

Fewer Children Left Behind: Lessons From the Dramatic Achievement Gains of the 1990s and 2000s
9 of 30
This is dense stuff. What does it all mean?
First, at the fourth and eighth grade levels, progress in student achievement went well beyond reading and math, especially for low-performing students and students of color, at least until 2007 or so (see Figure 4). For example, the writing achievement of Hispanic eighth graders rose by 11 points between 1998 and 2007. The science achievement of black fourth graders rose 13 points from 1996 to 2015. Black eighth graders boosted their U.S. history achievement by 13 points from 1994 to 2014. Hispanic fourth graders gained 17 points on the civics test from 1998 to 2010. This progress is not as dramatic as what we see for reading and especially math, but it’s not nothing, signifying gains of about a grade level or so in each case.
Second, there’s no escaping the conclusion that there’s been little to no improvement at the twelfth grade level.
Third, it’s hard to imagine that these various trends aren’t linked. It would stand to reason that as reading skills improve, students’ ability to understand other subjects like history and civics will improve as well. (It could also be, as E.D. Hirsch, Jr., has long argued, that students’ reading skills improve as they gain content knowledge.) Of course, it’s possible that our schools got better at teaching these other subjects, as well—a counterintuitive finding, if true, given all the talk about No Child Left Behind et al. “narrowing the curriculum.”
Fourth and eighth graders made progress across the entirety of the academic curriculum from the late 1990s until the Great Recession—especially our lowest performing students and students of color (see Figures 4–5). Next we’ll examine whether schools—and school reform—deserve credit for this encouraging progress, as well as the disappointing results over the last decade.
10 of 30
THE ROLE OF IMPROVING ECONOMIC CONDITIONS FOR FAMILIES IN THE 1990s AND 2000sSo far we’ve established that student outcomes in America improved significantly from the late 1990s until the onset of the Great Recession. The progress was greatest and most widespread in math, but also strong in reading, and pretty good in science, writing, U.S. history, and civics. In all of these cases, gains were greatest for the lowest-achieving students, for students of color, and at the fourth and eighth grade levels.
However, these positive trends don’t necessarily mean that America’s schools got better over this time. Something that changed outside of school could explain at least some of these gains. And there’s a likely candidate for that “something”: vastly improving economic conditions for the nation’s poorest families over this period.
If that statement caused you to do a double-take, you probably aren’t alone because this progress is one of the best-kept secrets in American life. Especially for those of us in education, since we’re used to equating poverty rates with free-and-reduced-priced-lunch rates, which are increasingly unreliable proxies.
So let’s state it clearly: America’s children are much less likely to be poor today than they were in the 1980s and 90s. In fact, poverty rates for white, black, and Latino children have each been cut by about 50 percent since A Nation at Risk.
This is a great achievement, one made possible by a growing economy and smart, compassionate policies embraced to some degree by leaders on both sides of the aisle. Let’s take a closer look at the numbers.
Child poverty rates over timeAs with educational outcomes, it’s important to disaggregate child poverty rates by race and ethnicity, both because averages might not tell the whole story, and because the rising Latino share and shrinking white share of the population might give us a distorted view of what’s happening, given that Latino children are, on average, more likely to be poor than white children.
So let’s start by looking at child poverty rates for the three major racial groups according to the standard poverty measure (see Figure 6).

Fewer Children Left Behind: Lessons From the Dramatic Achievement Gains of the 1990s and 2000s
11 of 30
Figure 6. Child poverty rates according to the standard poverty measure, by race and ethnicity and year
Source: Nolan, Laura; Garfinkel, Irwin; Kaushal, Neeraj; Nam, JaeHyun; Waldfogel, Jane; and Wimer, Christopher, “Trends in Child Poverty by Race/Ethnicity: New Evidence Using an Anchored Historical Supplemental Poverty Measure,” Journal of Applied Research on Children: Informing Policy for Children at Risk: Vol. 7: Iss. 1, Article 3. Available at: http://digitalcommons.library.tmc.edu/childrenatrisk/vol7/iss1/3.
What we see is a spike in child poverty right around the time of A Nation at Risk in 1983, then declines through the 1980s until the 1989 recession, huge progress in the booming 1990s—especially for black and Latino children—and then rising poverty in the 2000s and especially with the onset of the Great Recession. After all of that, i.e., when we look across the whole period from 1970 to the present, the poverty rates of black children are down sharply, Latino rates are down modestly, and white rates are up modestly.
Yet the standard child poverty rate has many flaws, as virtually everyone who studies the topic will tell you. The poverty line was set back in the 1960s as an estimate of what a family of a given size would need for food, clothing, and shelter. Every year since, the U.S. Census Bureau has simply adjusted the line based on inflation.

Fewer Children Left Behind: Lessons From the Dramatic Achievement Gains of the 1990s and 2000s
12 of 30
That leaves a lot to be desired. For one, it doesn’t take into account differences in cost of living, so the line is the same if a family lives in pricey San Francisco or low-cost West Virginia. Second, it’s not clear whether the overall inflation rate is the right one to use, or whether something more targeted to what poor families actually consume might be better. Most importantly, it doesn’t account for money from government programs and policies—like SNAP benefits (food stamps) and the earned-income tax credit. These have grown significantly in recent years, so ignoring them warps the picture dramatically.
Thankfully, in 2011, the Census Bureau and Bureau of Labor Statistics developed the “supplemental poverty rate,” which corrects these and other flaws. (A comprehensive overview of the measure is available here.) And a group of scholars has estimated the historic child poverty rate, by race, according to this new measure. Here’s what it looks like:
Figure 7. Child poverty rates according to the supplemental poverty measure, by race and year
Source: Nolan, Laura; Garfinkel, Irwin; Kaushal, Neeraj; Nam, JaeHyun; Waldfogel, Jane; and Wimer, Christopher, “Trends in Child Poverty by Race/Ethnicity: New Evidence Using an Anchored Historical Supplemental Poverty Measure,” Journal of Applied Research on Children: Informing Policy for Children at Risk: Vol. 7: Iss. 1, Article 3. Available at: http://digitalcommons.library.tmc.edu/childrenatrisk/vol7/iss1/3.
Fewer Children Left Behind: Lessons From the Dramatic Achievement Gains of the 1990s and 2000s
13 of 30
Now we see a more impressive story about change over time. Child poverty was much higher than we thought when the data series began back in 1970, but fell sharply for black and Latino children in the 1980s until the 1989 recession. Starting again around 1993, we see a long and steep decline in poverty rates for black and Latino children—one that continues all the way until the aftermath of the Great Recession, when it flat-lines. White children do better over this time period, as well.
According to the supplemental poverty measure, child poverty rates were at or near their all-time highs around the time A Nation at Risk was released in 1983, and since then have declined 48 percent for black children, 46 percent for Latino children, and 54 percent for white children. That is remarkable progress!
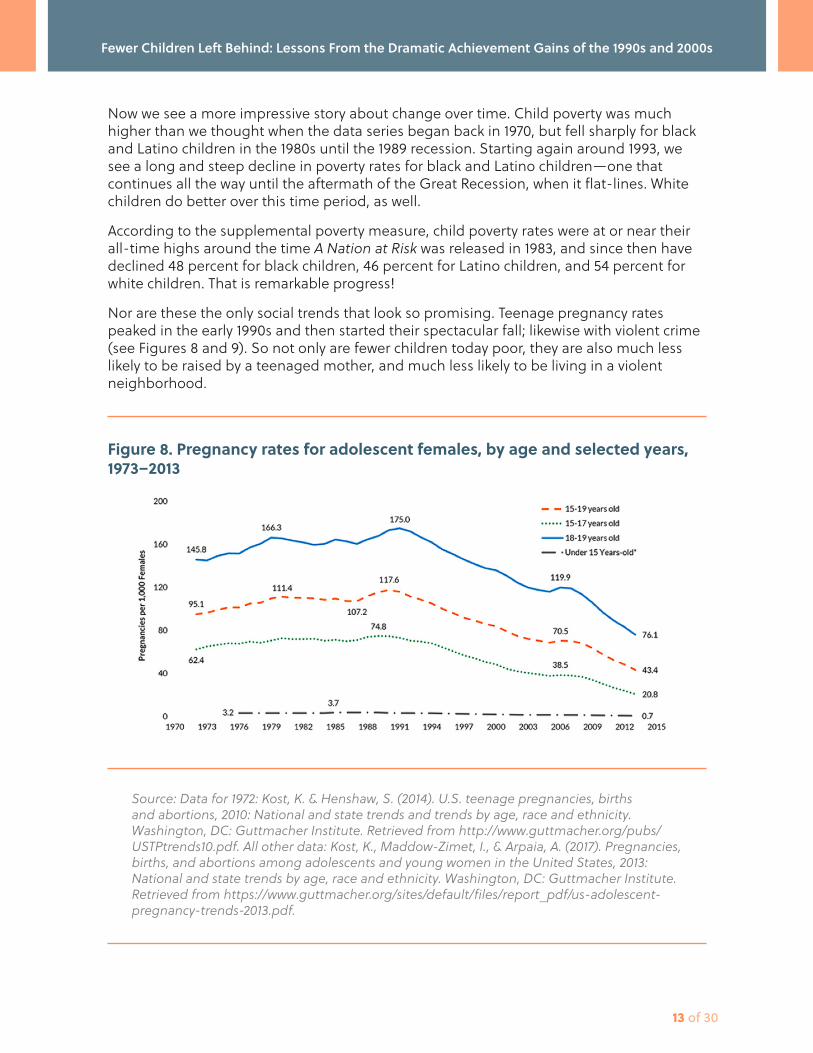
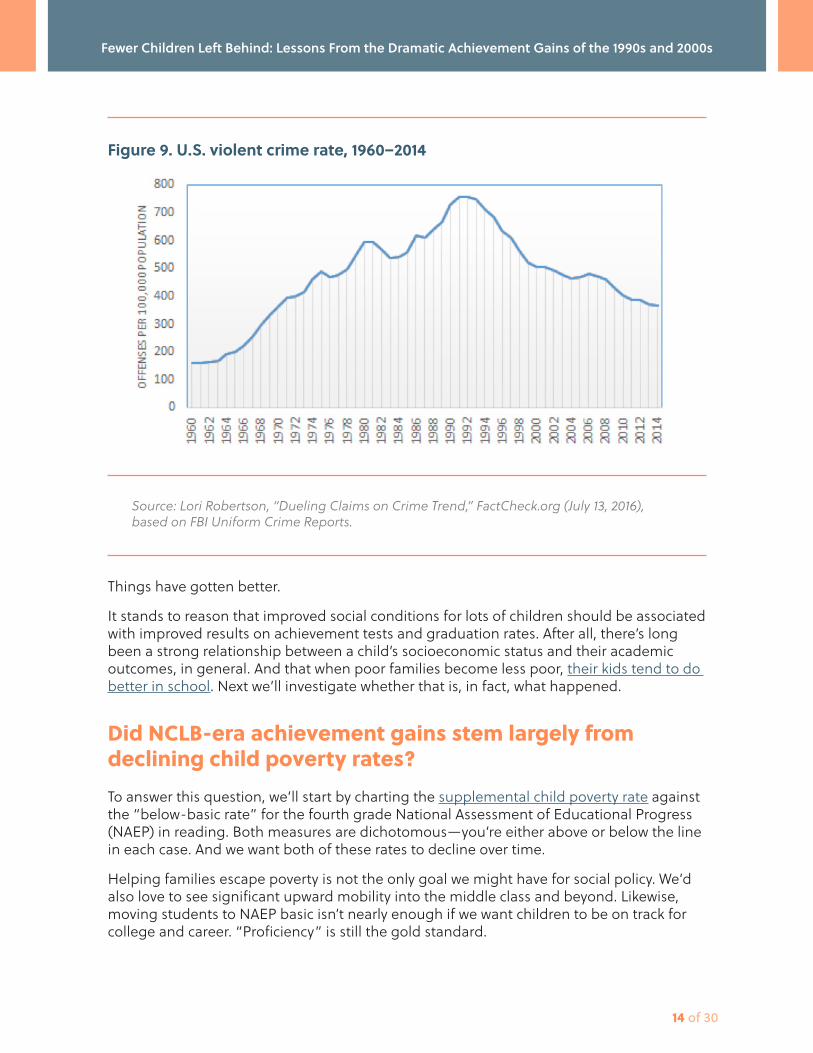
Nor are these the only social trends that look so promising. Teenage pregnancy rates peaked in the early 1990s and then started their spectacular fall; likewise with violent crime (see Figures 8 and 9). So not only are fewer children today poor, they are also much less likely to be raised by a teenaged mother, and much less likely to be living in a violent neighborhood.
Figure 8. Pregnancy rates for adolescent females, by age and selected years, 1973–2013
Source: Data for 1972: Kost, K. & Henshaw, S. (2014). U.S. teenage pregnancies, births and abortions, 2010: National and state trends and trends by age, race and ethnicity. Washington, DC: Guttmacher Institute. Retrieved from http://www.guttmacher.org/pubs/USTPtrends10.pdf. All other data: Kost, K., Maddow-Zimet, I., & Arpaia, A. (2017). Pregnancies, births, and abortions among adolescents and young women in the United States, 2013: National and state trends by age, race and ethnicity. Washington, DC: Guttmacher Institute. Retrieved from https://www.guttmacher.org/sites/default/files/report_pdf/us-adolescent-pregnancy-trends-2013.pdf.
Fewer Children Left Behind: Lessons From the Dramatic Achievement Gains of the 1990s and 2000s
14 of 30
Figure 9. U.S. violent crime rate, 1960–2014
Source: Lori Robertson, “Dueling Claims on Crime Trend,” FactCheck.org (July 13, 2016), based on FBI Uniform Crime Reports.
Things have gotten better.
It stands to reason that improved social conditions for lots of children should be associated with improved results on achievement tests and graduation rates. After all, there’s long been a strong relationship between a child’s socioeconomic status and their academic outcomes, in general. And that when poor families become less poor, their kids tend to do better in school. Next we’ll investigate whether that is, in fact, what happened.
Did NCLB-era achievement gains stem largely from declining child poverty rates?To answer this question, we’ll start by charting the supplemental child poverty rate against the “below-basic rate” for the fourth grade National Assessment of Educational Progress (NAEP) in reading. Both measures are dichotomous—you’re either above or below the line in each case. And we want both of these rates to decline over time.
Helping families escape poverty is not the only goal we might have for social policy. We’d also love to see significant upward mobility into the middle class and beyond. Likewise, moving students to NAEP basic isn’t nearly enough if we want children to be on track for college and career. “Proficiency” is still the gold standard.

Fewer Children Left Behind: Lessons From the Dramatic Achievement Gains of the 1990s and 2000s
15 of 30
But let’s not allow our desire for the gold to blind us to some worthy bronze. Reducing the child poverty and below-basic rates is an important milestone on the way to bigger and bolder goals.
Without further ado, let’s take a look (see Figure 10).
Figure 10. The rate of fourth graders reading below basic versus the supplemental child poverty rate
Source: Figures 10–13, data without calculation from the NAEP Data Explorer: https://www.nationsreportcard.gov/ndecore/landing; and Nolan, Laura; Garfinkel, Irwin; Kaushal, Neeraj; Nam, JaeHyun; Waldfogel, Jane; and Wimer, Christopher, “Trends in Child Poverty by Race/Ethnicity: New Evidence Using an Anchored Historical Supplemental Poverty Measure,” Journal of Applied Research on Children: Informing Policy for Children at Risk: Vol. 7: Iss. 1, Article 3. Available at: http://digitalcommons.library.tmc.edu/childrenatrisk/vol7/iss1/3.
What immediately jumps out from this picture are the similar inflection points in both lines—with changes in the “below basic” rate lagging changes in the child poverty rate by about seven years. From 1993 until 2000, the supplemental child poverty rate declined from 28 percent to 18 percent—a 10-point drop, or 36 percent reduction. From 2000 until 2007, the percentage of fourth graders reading below basic on NAEP declined from 41 percent to 33 percent—an 8-point fall, or 20 percent reduction. The supplemental child poverty rate hit an all-time low in 2009, before ticking up in 2010. And the below-basic rate hit an all-time low in 2015, before ticking up in 2017.
Interesting.

Fewer Children Left Behind: Lessons From the Dramatic Achievement Gains of the 1990s and 2000s
16 of 30
To be sure, the pattern isn’t perfect. Most notably, child poverty declined in the 1980s, and yet reading performance in the early 1990s got worse. (Perhaps because of the whole-language craze?) But over the past twenty years, the two lines appear to be moving generally in the same direction.
Now let’s see how it looks for eighth graders (see Figure 11).
Figure 11. Percentage of eighth graders below basic on NAEP reading, supplemental child poverty rate
This time, changes in the below-basic rate lags changes in the child poverty rate by about thirteen years.
After declining for most of the 1980s, the supplemental child poverty rate started to rise in 1989 with the onset of a recession, and hit a peak in 1993 before plummeting throughout the remainder of the 1990s. A similar pattern is seen with the rate of eighth graders reading at a below-basic level—but thirteen years later. This rate declined throughout the 1990s. Then in 2002 it started to rise, thirteen years after 1989. Three years later, in 2005, it started declining again, twelve years after 1994.
The same pattern can be seen in later years, as child poverty rose slightly with the weakening economy in 2000. Thirteen years later, the below-basic rate rose, too.

Fewer Children Left Behind: Lessons From the Dramatic Achievement Gains of the 1990s and 2000s
17 of 30
And it’s not just in reading. We can glimpse similar patterns in math (see Figures 12 and 13).
Figure 12. Percentage of fourth graders scoring below basic on NAEP math, supplemental child poverty rate
Figure 13. Percentage of eighth graders below basic on NAEP math, supplemental child poverty rate
Fewer Children Left Behind: Lessons From the Dramatic Achievement Gains of the 1990s and 2000s
18 of 30
***
Now is a good time for me to issue a disclaimer: I may just be a policy wonk instead of a trained social scientist, but even I know that correlations between a few lines don’t count as solid evidence that the falling child poverty rate drove improvements in student achievement. But it sure seems that there might be a relationship at work—namely that the prevailing economic conditions at the time of a cohort of children’s birth (or shortly thereafter) appear to be related to the cohort’s later achievement—at least at NAEP’s below-basic level.
Again, this is speculative. I would love for a scholar with econometric chops to dig into the question of how much of the progress in student achievement can be explained by the improving economic conditions for poor kids and their families, and how much credit should go to schools and various efforts to reform them. My hunch is that the declining child poverty rate deserves some, perhaps much, of the praise. It would surely vary by subject, grade, and time period—and might help us understand when and how our schools outperformed what we’d expect given socioeconomic conditions. To my friends in academia: Please help!
A rising economic tide + reform + resources = better results for kids
So it is my contention that much of the progress of the NCLB era may have stemmed from the dramatically declining child poverty rates of the 1990s.
But much does not mean all.
Other things were happening back then, too, things that deserve at least some of the credit—namely more education reform and more education resources. Let’s look at the evidence for both.
***
Though No Child Left Behind gets all the attention, 1994’s Improving America’s Schools Act (IASA) put most of the key pieces in place for the “consequential accountability” policies that we now associate with NCLB. It required states to set uniform standards in reading and math; to develop statewide tests to assess students against those standards; and to report the results for all schools. While annual testing, disaggregated data, and a federally-mandated cascade of sanctions came later, they came as enhancements, as an evolution. The real revolution began with IASA.
By the mid- to late 1990s, some states had the building blocks in place and were starting to put schools on so-called “failing schools” lists. Others jurisdictions, however, didn’t get serious about the standards, testing, and accountability tripod until NCLB burst onto the scene in 2002. This time lag provided researchers with an opportunity to study a natural experiment. Namely, they could compare the early-adopter states to the laggards, and check to see if the former saw greater progress in student achievement than the latter.
It was Eric Hanushek and Macke Raymond who first conducted such an analysis, and their answer was yes: States that embraced accountability in the 1990s made more progress than those that didn’t. Later, Tom Dee and Brian Jacob checked to see what happened once the laggards finally starting doing testing and accountability, too, and found that they also got a bump from accountability—and it bumped them to a new, higher plateau.

Fewer Children Left Behind: Lessons From the Dramatic Achievement Gains of the 1990s and 2000s
19 of 30
We accountability hawks tend to hang our hats on these findings when we argue that standards, tests, and school ratings can raise achievement. But it’s important that we acknowledge some important limitations.
First, both studies found impacts on math but not on reading. This is not unusual in education research. Math achievement appears to be much more amenable to school interventions, perhaps because reading is more connected to family background (e.g., being read to, or not, and the vocabulary you hear in the home), or perhaps because our schools haven’t gotten any better at teaching it.
Second, the size of the accountability impacts, though fairly large, wasn’t nearly enough to explain the huge gains made by the lowest-performing students in the late 1990s and early 2000s.
Third, the progress petered out. Some, like Sandy Kress, believe that’s because we essentially gave up on consequential accountability in the late 2000s, as NCLB grew long in the tooth and Arne Duncan issued waivers that let failing schools slip the law’s chokehold. Others contend that this type of education reform can only carry you so far; in time it plateaus. But then, of course, there was also the Great Recession. (More on that below.)
Fourth, and perhaps most importantly, even if accountability did raise achievement (in math, especially for low-performing students), we don’t really know why. The optimistic story is that the new standards and assessments helped clarify what schools were expected to teach, and they aligned their curricula and pedagogy to these new expectations in ways that helped students learn more. Perhaps schools and districts also responded to NCLB’s subgroup data by doing politically difficult but necessary things to improve outcomes, like assigning the best teachers to the kids who needed the most help or driving additional dollars to schools serving lots of children of color.
The pessimistic—you might say cynical—story is that schools and districts just played games to make their test scores go up. They reassigned their best teachers to the tested grades. They engaged in endless test-prep. They encouraged low-performing kids to stay home on test day. They reallocated time from social studies and science to reading and math (which is true, though the changes were modest).
It’s probably a mix of all these things, with some schools responding in ways that policymakers hoped while others finagled and cheated in various ways. But something real did happen, for achievement went up, and not just on the state tests that were used for accountability purposes, but also on the no-stakes National Assessment of Educational Progress.
So let’s give accountability some credit—some, but not all.
Fewer Children Left Behind: Lessons From the Dramatic Achievement Gains of the 1990s and 2000s
20 of 30
Did we invest our way to better achievement?While the policy crowd was busy designing and implementing an array of standards-based reforms, a mostly separate group of advocates was winning school-finance lawsuits from coast to coast, wins that yielded a big increase in spending in the 1990s and especially into the 2000s. (No Child Left Behind actually led to some increased spending, too.)
In today’s dollars, average per-pupil spending went from $9,731 in 1990 to $10,837 in 2000, and all the way to $13,082 by 2010. That means spending went up by 11 percent in the 1990s and an astounding 21 percent in the 2000s.
Several studies show that the increased spending did indeed raise achievement. A recent review of the school finance literature by Kirabo Jackson—some of which focused on the time of this spending surge—led Jackson to conclude that “the question of whether money matters is essentially settled.”
Once again, however, there are limitations to consider, many of which parallel the ones related to accountability. The progress mostly came in math but not reading. The impacts were small, and eventually hit a plateau (possibly because spending itself hit a wall called the Great Recession). And we don’t know much about what schools spent their extra money on that explained their improved results, though higher teacher salaries—which were not the norm in that period—may have helped if and when they were adopted.
***
As I mentioned above, I’d love for some bona fide card-carrying methodologists to dig into the question of how to explain the achievement gains of the late 1990s and 2000s, and the disappointing results since the onset of the Great Recession. How much of the credit or fault goes to changing socioeconomic conditions (especially child poverty), and how much may be connected to reform (especially standards based reform) and spending? Are there other factors that deserve attention, too (the growth in charter schools, the decline in lead poisoning, etc.)? Is the answer different for math versus reading?
Until that time, it appears to me that a rising economic tide, plus reform, plus resources is a winning combination. The good news is that we’re living in the midst of an economic boom today, and states are opening their wallets again. If policymakers stick with the reform part of this new trifecta, it may work as well now as it did twenty years ago.

21 of 30
STATES THAT BEAT THE SOCIOECONOMIC CURVENow it’s time to turn our attention to the laboratories of democracy, and the key decision makers in our education system: the states. Let’s investigate whether the relationship we see at the national level—between declining child poverty rates and improving student outcomes—can also be glimpsed at the state level. Were the states where child poverty declined the most the same states where the “below basic” rate dropped the most?
In a word, no.
Figure 14. Percentage change in the supplemental poverty rate (1991–2000) vs. percentage change in the below-basic rate in fourth grade reading (1998–2007)
Source: The author calculated Figure 14 using the NAEP Data Explorer: https://www.nationsreportcard.gov/ndecore/landing.
As seen in Figure 14, there’s no clear relationship between the change in poverty rates and the change in below-basic rates. One explanation is that my hypothesis doesn’t hold water. Another is that other factors were at work that led to very different results for various states—that the declining poverty rate pushed down the below-basic rate everywhere, but some states went farther faster than we’d predict based on their poverty rates alone.

Fewer Children Left Behind: Lessons From the Dramatic Achievement Gains of the 1990s and 2000s
22 of 30
Let’s see which states went farther and try to understand what else might explain their impressive results.
We’ll start by looking at the change in supplemental child poverty rates in the 1990s versus the change in below-basic NAEP rates in the late 90s into the early 2000s (see Table 1). Think of this as the core of the No Child Left Behind era. Here are the states that did the best.
Table 1. Top ten states for percentage change over time in the child poverty/below-basic ratio, fourth grade reading, 1998–2007
StateChildren in
Poverty, 1991 (%)
Children in Poverty, 2000
(%)
Below Basic, 1998 (%)
Below Basic, 2007 (%)
Change in Child Poverty / Below-Basic Ratio (%)
DE 18.9 14.7 47 27 35.4
MA 24.7 19.4 30 19 24.0
HI 25.6 23.3 55 41 22.1
FL 30.3 21.8 47 30 12.7
NY 30.1 26.8 38 31 9.1
WA 16.2 14.4 36 30 6.7
GA 27.5 20.2 46 34 -0.6
TX 28.5 22.1 41 34 -6.5
NC 23.5 17.9 42 36 -11.1
VA 19.3 11.7 38 26 -11.4
Source: The author calculated Tables 1–4 using the NAEP Data Explorer: https://www.nationsreportcard.gov/ndecore/landing. We found the ratio between the supplemental child poverty rate at the time of a cohort’s birth and the NAEP below-basic rate when the cohort was assessed—the poverty/below-basic ratio—for the 1991 and 1998 birth cohorts. We then found the percentage change in the poverty/below-basic ratio between the 1991 cohort and 1998 cohorts, as displayed in the last column in the table. States with larger percentage changes were able to narrow the gap between the child poverty rate and the NAEP below-basic rate over time. States with positive percentage changes saw improvements in student test scores at a rate that outpaced the state’s decrease in childhood poverty.
The names on this list should look familiar, given that most of them were the poster children of the early education reform movement. Delaware would later win one of the first Race to the Top grants; Massachusetts is famously the highest achieving state in the nation thanks to the “Massachusetts Miracle” reforms of the 1990s and 2000s; Jeb Bush’s Florida policies have become a model for states nationwide; and North Carolina and Texas in many ways inspired the early standards-based reform era. Several of these states also led on scientifically-based reading instruction—notable given these results are for fourth grade reading.
Fewer Children Left Behind: Lessons From the Dramatic Achievement Gains of the 1990s and 2000s
23 of 30
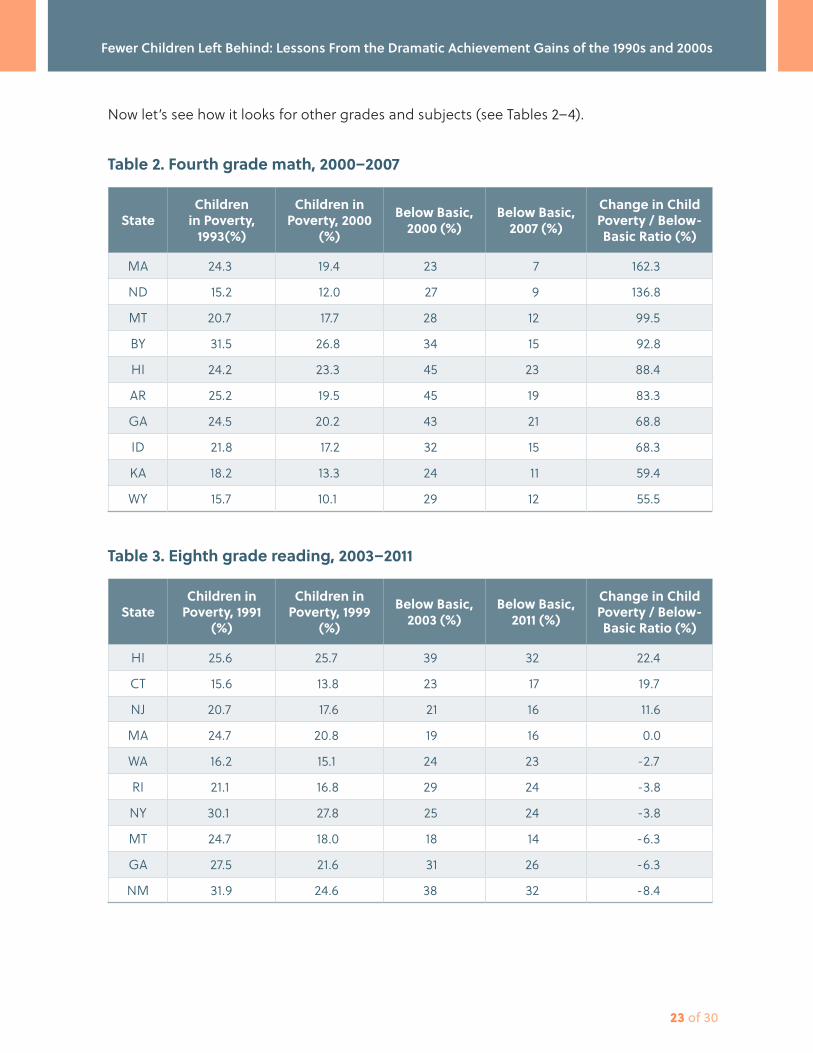
Now let’s see how it looks for other grades and subjects (see Tables 2–4).
Table 2. Fourth grade math, 2000–2007
StateChildren
in Poverty, 1993(%)
Children in Poverty, 2000
(%)
Below Basic, 2000 (%)
Below Basic, 2007 (%)
Change in Child Poverty / Below-Basic Ratio (%)
MA 24.3 19.4 23 7 162.3
ND 15.2 12.0 27 9 136.8
MT 20.7 17.7 28 12 99.5
BY 31.5 26.8 34 15 92.8
HI 24.2 23.3 45 23 88.4
AR 25.2 19.5 45 19 83.3
GA 24.5 20.2 43 21 68.8
ID 21.8 17.2 32 15 68.3
KA 18.2 13.3 24 11 59.4
WY 15.7 10.1 29 12 55.5
Table 3. Eighth grade reading, 2003–2011
StateChildren in
Poverty, 1991 (%)
Children in Poverty, 1999
(%)
Below Basic, 2003 (%)
Below Basic, 2011 (%)
Change in Child Poverty / Below-Basic Ratio (%)
HI 25.6 25.7 39 32 22.4
CT 15.6 13.8 23 17 19.7
NJ 20.7 17.6 21 16 11.6
MA 24.7 20.8 19 16 0.0
WA 16.2 15.1 24 23 -2.7
RI 21.1 16.8 29 24 -3.8
NY 30.1 27.8 25 24 -3.8
MT 24.7 18.0 18 14 -6.3
GA 27.5 21.6 31 26 -6.3
NM 31.9 24.6 38 32 -8.4

Fewer Children Left Behind: Lessons From the Dramatic Achievement Gains of the 1990s and 2000s
24 of 30
Table 4. Eighth grade math, 2003–2011
StateChildren in
Poverty, 1991 (%)
Children in Poverty, 1999
(%)
Below Basic, 2003 (%)
Below Basic, 2011 (%)
Change in Child Poverty / Below-Basic Ratio (%)
MA 24.7 20.8 24 14 44.4
HI 25.6 25.7 44 32 38.0
NJ 20.7 17.6 28 18 32.3
TX 28.5 22.7 31 19 30.0
WA 16.2 15.1 28 23 13.5
RI 21.1 16.8 37 27 9.1
NM 31.9 24.6 48 36 2.8
GA 27.5 21.6 41 32 0.6
DE 18.9 15.1 32 26 -1.7
CT 15.6 13.8 27 25 -4.5
Some states did well across the board or close to it—namely Delaware, Georgia, Hawaii, Massachusetts, New York, and Washington. Several of these states displayed impressive reform credentials during that time period. A few of the other states that did well too leave me scratching my head, given that they aren’t known for reform-minded policies, or really much of anything: Montana, New Mexico, and North Dakota (in the pre-Hanna Skandera era) to be exact.
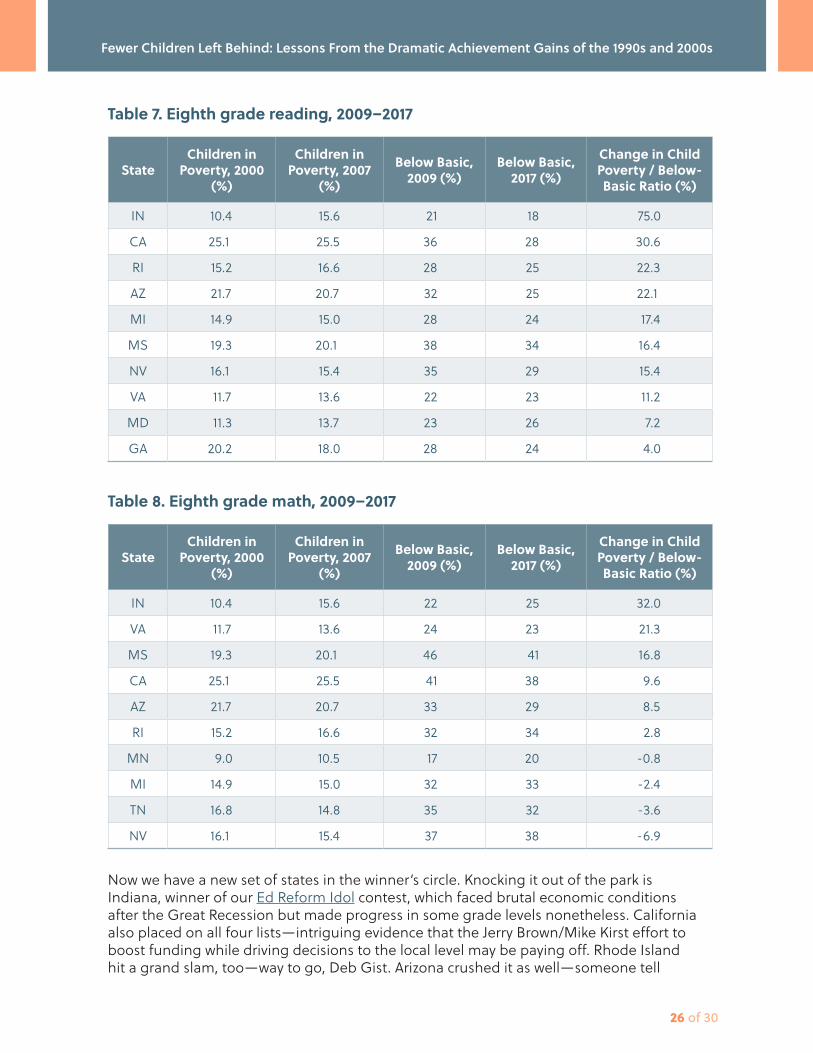
That all feels a bit like ancient history, however. Now let’s look at the more recent results—during a time period when the Great Recession created challenging economic conditions and most states struggled to keep their teachers paid and their achievement scores from declining (see Tables 5–8).

Fewer Children Left Behind: Lessons From the Dramatic Achievement Gains of the 1990s and 2000s
25 of 30
Table 5. Fourth grade reading, 2009–2017
StateChildren in
Poverty, 2000 (%)
Children in Poverty, 2007
(%)
Below Basic, 2009 (%)
Below Basic, 2017 (%)
Change in Child Poverty / Below-Basic Ratio (%)
IN 10.4 15.6 30 27 66.7
MN 9.0 10.5 30 29 20.7
CA 25.1 25.5 46 39 19.8
MD 11.3 13.7 30 31 17.3
MS 19.3 20.1 45 40 17.2
VA 11.7 13.6 26 26 16.2
RI 15.2 16.6 31 31 9.2
UT 11.8 10.8 33 28 7.9
SD 9.6 10.7 30 31 7.9
AZ 21.7 20.7 44 39 7.6
Source: The author calculated Tables 5–8 using the NAEP Data Explorer: https://www.nationsreportcard.gov/ndecore/landing.
Table 6. Fourth grade math, 2009–2017
StateChildren in
Poverty, 2000 (%)
Children in Poverty, 2007
(%)
Below Basic, 2009 (%)
Below Basic, 2017 (%)
Change in Child Poverty / Below-Basic Ratio (%)
MS 19.3 20.1 31 23 40.4
IN 10.4 15.6 13 14 39.3
VA 11.7 13.6 15 13 34.1
AZ 21.7 20.7 29 27 2.5
AL 18.1 16.6 30 27 1.9
TN 16.8 14.8 26 23 -0.4
RI 15.2 16.6 19 21 -1.2
NE 11.6 9.5 18 15 -1.7
CA 25.1 25.5 28 29 -1.9
FL 21.8 18.3 14 12 -2.1
Fewer Children Left Behind: Lessons From the Dramatic Achievement Gains of the 1990s and 2000s
26 of 30
Table 7. Eighth grade reading, 2009–2017
StateChildren in
Poverty, 2000 (%)
Children in Poverty, 2007
(%)
Below Basic, 2009 (%)
Below Basic, 2017 (%)
Change in Child Poverty / Below-Basic Ratio (%)
IN 10.4 15.6 21 18 75.0
CA 25.1 25.5 36 28 30.6
RI 15.2 16.6 28 25 22.3
AZ 21.7 20.7 32 25 22.1
MI 14.9 15.0 28 24 17.4
MS 19.3 20.1 38 34 16.4
NV 16.1 15.4 35 29 15.4
VA 11.7 13.6 22 23 11.2
MD 11.3 13.7 23 26 7.2
GA 20.2 18.0 28 24 4.0
Table 8. Eighth grade math, 2009–2017
StateChildren in
Poverty, 2000 (%)
Children in Poverty, 2007
(%)
Below Basic, 2009 (%)
Below Basic, 2017 (%)
Change in Child Poverty / Below-Basic Ratio (%)
IN 10.4 15.6 22 25 32.0
VA 11.7 13.6 24 23 21.3
MS 19.3 20.1 46 41 16.8
CA 25.1 25.5 41 38 9.6
AZ 21.7 20.7 33 29 8.5
RI 15.2 16.6 32 34 2.8
MN 9.0 10.5 17 20 -0.8
MI 14.9 15.0 32 33 -2.4
TN 16.8 14.8 35 32 -3.6
NV 16.1 15.4 37 38 -6.9
Now we have a new set of states in the winner’s circle. Knocking it out of the park is Indiana, winner of our Ed Reform Idol contest, which faced brutal economic conditions after the Great Recession but made progress in some grade levels nonetheless. California also placed on all four lists—intriguing evidence that the Jerry Brown/Mike Kirst effort to boost funding while driving decisions to the local level may be paying off. Rhode Island hit a grand slam, too—way to go, Deb Gist. Arizona crushed it as well—someone tell
Fewer Children Left Behind: Lessons From the Dramatic Achievement Gains of the 1990s and 2000s
27 of 30
Matt Ladner—perhaps because of its combination of widespread choice and thoughtful standards-based reform. Race to the Top favorite Tennessee scored in two categories. Florida is back on the list, this time for math instead of reading. And don’t overlook Mississippi, which has been making sure and steady progress even as its neighbor to the west, Louisiana, gets all of the national attention.
Several of these states are the same ones that look impressive according to “America’s Gradebook,” an analysis from Matt Chingos and his team at the Urban Institute—even though theirs is a snapshot in time, and mine examines progress over almost a decade.
To be sure, some states present a puzzle—they haven’t been particularly bold on reform, or generous on spending, yet got impressive results over the past decade. Virginia is at the top of that list. Michigan (yes, Michigan!), too.
Still, during both the NCLB era and more recent years, the lists have a clear reformy slant.
***
To repeat myself, I understand that the simple analyses I’ve presented here don’t count as rigorous evidence. I would love to see proper methodologists dig into these questions, too, and try to “decompose” the national and state-level NAEP results to determine what might explain them, and how much credit (or blame) goes to socioeconomic conditions, reform efforts, additional spending, or other factors.
From what I’ve seen, though, I’m ready to offer this tentative conclusion: Big national trends, such as we see on the National Assessment of Educational Progress, or high school graduation or college completion rates, are driven mostly, though not entirely, by big national socioeconomic trends. The booming 1990s had a bigger impact on NCLB-era gains than we understood at the time, and the Great Recession created a fiercer headwind than we understood, as well. Given that we’re now experiencing another historic boom—one that is finally lifting the wages of the lowest-income workers—we should expect child poverty rates to continue to fall and student achievement—after some delay—to start to rise. That is, if past is prologue.
Yet demography is not destiny. As we know for individual children, as well as individual schools, great effort can allow people or institutions to beat the odds. So it is with states. All jurisdictions should benefit from today’s economic conditions, but some will see their students go further faster depending on the policies their leaders put in place.

28 of 30
LESSONS FOR REFORM TODAY—AND TOMORROWSo to recap: From the mid- to late 1990s, and generally until 2010 or so, National Assessment of Educational Progress (NAEP) scores at the fourth and eighth grades for the lowest-achieving children, and for students of color, shot up in reading, math, and most other academic subjects. The gains were greatest at the low end of the spectrum—as seen in trends at the tenth percentile of achievement and a big drop in the percentage of students scoring at the “below-basic” level.
By 2010 or so, our black, Hispanic, and low-achieving students were reading and doing math two and sometimes three grade levels above their counterparts in the early 1990s. That’s historic, life-changing progress. And it surely contributed to more recent gains in the high school graduation rate for these groups, as many more kids came into ninth grade closer to being on track.
That’s the good news. The bad news is that there was less progress at the middle and top of the performance spectrum; essentially no achievement gains at the twelfth grade level; and most of the progress hit a wall around the time of the Great Recession.
Those are the facts. The interpretive challenge is to understand why. Why did we see so much progress for the kids who had previously been “left behind”? My conclusion is that our schools can take only partial credit. Yes, it was a time of frenetic reform activity, and yes, it was also a period of significantly increased investment in our public schools. And those factors mattered. But what likely mattered more were the vastly improving social and economic conditions for our poorest children. Our cities in particular were transformed over the course of the 1990s, with child poverty rates plummeting and the incidence of violence falling dramatically. These trends—as much as anything schools or policymakers or “reformers” did—likely explain much of why our students started to learn so much more.
But back to the schools. Rigorous evidence indicates that accountability policies and increased spending both helped to boost achievement. That much is clear. What’s less clear is how. How did schools respond to accountability pressure to increase student learning? Was it in ways that policymakers had hoped, such as by moving the best teachers to the neediest schools and classrooms, or embracing evidence-based practices and high quality curricula, or shifting resources to the kids who need them most? Or were these improvements in math and reading made at the expense of other important pursuits? Were other academic subjects squeezed out of the curriculum? Did schools stop doing so much on the whole-child front, such as sacrificing recess and P.E.? And if so, were these choices good ones? And how did the increased spending lead to better results? What did they spend the money on?

Fewer Children Left Behind: Lessons From the Dramatic Achievement Gains of the 1990s and 2000s
29 of 30
These aren’t meant to be rhetorical questions—they are empirical. Unfortunately, we don’t have much data by which to answer them effectively. The sad fact is that analysts have very little insight into what’s actually happening in our schools today, much less over the past quarter-century. But working toward answers to these questions would still be worthwhile (I’m talking to you, young academics looking for research projects!), as they would help us understand what worked and what we might learn for our efforts going forward.
***
So to restate, one last time: The achievement of low-performing kids and children of color rose dramatically from the late 1990s until the Great Recession. That was mostly because of improving social and economic conditions for these children, but accountability reforms and increased spending played a role, as well. Over the last decade, that progress has mostly petered out. And the gains we made were, of course, not nearly enough, as they mostly meant getting more kids to a basic level of literacy and numeracy and walking across the high school graduation stage—nowhere near the goal of readiness for college, career, and citizenship that is the proper objective of our K–12 system.
Here are a few personal reflections about these conclusions.
First, we reformers and policy wonks need to be much more humble about putting ourselves at the center of the story. It’s a great human temptation. We all want to be the hero in our personal narrative. But we need to bring some maturity and wisdom to the decades-long work of educational improvement, and be willing to acknowledge that the ups and downs of NAEP scores, college completion rates, and all the rest are more likely to be driven by what’s happening outside of schools than within.
I’m chagrined to admit that I really believed, back in the heady No Child Left Behind days, that it was policy that was leading to those test score gains among the neediest kids. And to be sure, solid research indicates that NCLB and similar state policies do deserve some credit. But only some. Somehow I—we?—missed what was happening in society at large—the declining poverty rates, the increasing supports for needy families, the plummeting crime rate. Of course those things would affect student learning.
And we did it again when the progress stalled around 2010. Some of us claimed that happened because we took the foot off the gas of accountability reform. Others said it was Common Core’s fault, or the flaws in new teacher evaluation systems. Those are all reasonable hypotheses, deserving of analysis. But what if it was mostly about the Great Recession, the spike in the unemployment rate, the increase in child poverty, and the decline in school spending? In other words, fellow reformers, it’s not all about us!
That doesn’t mean education policy or reforms like charter schools or Teach For America and the like don’t matter. Some states have consistently beaten the socioeconomic curve. And I don’t think it’s a coincidence that the states that made more gains than one would predict over this past quarter-century—like Florida, Indiana, and Massachusetts—are the ones that embraced education reform. They weren’t immune to the larger social and economic trends. But thanks to strong leaders and smart policies, they did better than expected.
So we should be humble about what policy can achieve, but we shouldn’t be despairing. It still matters.

Fewer Children Left Behind: Lessons From the Dramatic Achievement Gains of the 1990s and 2000s
30 of 30
Finally, this look at a quarter-century of student outcomes has reminded me of the importance of patience. Yes, that one’s tough for reformers, since the moral authority of our work comes from its urgency. Kids are in bad schools right now. Children don’t have a second chance to get a great education. And despite the gains we’ve made in basic literacy and numeracy, many kids are going to get crushed by the real world if we don’t help them achieve at much higher levels than that.
So a sense of urgency is critical in this work.
Yet we’ve seen time and again that we can make big mistakes by declaring something a failure too early. That was famously the case with the early Gates Foundation initiative on smaller high schools—which was thought to have flopped until rigorous studies finally emerged that showed significant gains, at least in some cities. Such was the case with No Child Left Behind, too. Jay Greene and Mike McShane are right that we need to learn from failure—but we also need to learn not to declare something a failure too soon.
I worry we might be doing that again today. Though the backlash to testing and accountability has subsided somewhat, there are still plenty of policymakers—and even some reformers—who would be happy to leave all of that behind. To which I would say: Hold your horses! We have spent the past decade overhauling standards, tests, and accountability systems, and finally committing real resources to capacity-building, especially in the form of curriculum implementation. These pieces have only come together in the last year or two, with the release of the first school ratings under the Every Student Succeeds Act. Now that Accountability 2.0 is finally in place—and we have a booming economy once more—let’s see if we can drive real improvements in achievement once again, and not just at the low end of the distribution this time.
What we need, then, is balance. We need to combine patience and urgency, humility and optimism, the passion of youth and the wisdom of experience. Let’s try to remember that in the school year ahead.
ABOUT THE AUTHORMike Petrilli is president of the Thomas B. Fordham Institute, research fellow at Stanford University’s Hoover Institution, executive editor of Education Next, and a Distinguished Senior Fellow for Education Commission of the States. An award-winning writer, he is the author of The Diverse Schools Dilemma, and editor of Education for Upward Mobility. Petrilli has published opinion pieces in the New York Times, Washington Post, Wall Street Journal, Bloomberg View, and Slate, and appears frequently on television and radio. Petrilli helped to create the U.S. Department of Education’s Office of Innovation and Improvement, the Policy Innovators in Education Network, and, long, long ago, Young Education Professionals. He serves on the advisory boards of the Association of American Educators, MDRC, and National Association of Charter School Authorizers. He lives with his family in Bethesda, Maryland.