lessons from the history of independent system operators
TRANSCRIPT
www.eprg.group.cam.ac.uk
EP
RG
WO
RK
ING
PA
PE
R
Abstract
Lessons from the History of Independent System Operators in the Energy Sector, with applications to the Water Sector
EPRG Working Paper 1125 Cambridge Working Paper in Economics 1153
Michael G. Pollitt
This paper examines the lessons from independent transmission system operators in energy in the context of the potential introduction of an independent system operator in the water sector. A key lesson from the energy sector is that there is a basic choice between having an independent system operator (ISO) and an independent transmission system operator (ITSO) covering two or more existing company areas. ISOs do not own any wires or pipes, ITSOs do own wires or pipes. We begin by examining the nature of system operation arrangements in different countries, focussing on different ways that non-discriminatory access to monopoly transmission assets can be facilitated. We go on to discuss the particular functions of the ISO, focussing on the US, with regard to controlling the system and operating the power markets. We also detail the costs of system operation. Next, we focus on incentive issues and the governance of ISOs around the world. We outline an ideal model for an electricity system operator and examine the extent to which systems in the US and UK conform to the ideal. We also explore the issue of pricing access to the system and how system operation costs are paid for. Then, we look at the evolving role of system operators and how they might be evaluated. Finally we apply the learning from system operation in energy across to the UK water sector and offer some interim conclusions.>
Keywords independent system operator, electricity transmission, gas transmission, water supply
www.eprg.group.cam.ac.uk
EP
RG
WO
RK
ING
PA
PE
R
JEL Classification L23, L51, L94
Contact [email protected] Publication August 2011 Financial Support Ofwat

EPRG No. 1125
1
Lessons from the History of Independent System Operators
in the Energy Sector, with applications to the Water Sector
Michael G. Pollitt1
ESRC Electricity Policy Research Group
Judge Business School
University of Cambridge
August 2011
Section 1: Energy Market Liberalisation and System Operation
The electricity sector in many countries was, until the early 1990s, dominated by relatively large integrated utilities that operated along the different stages of the value chain. In the US and the UK in particular, there was widespread integration between electricity generation and electricity transmission and an absence of competition within the generation sector. Across the US and in Scotland and Northern Ireland there was often further integration between generation and transmission with distribution and retailing within particular geographic areas. In England and Wales regional monopoly distribution and retail companies (RECs) bought bulk power from the state owned monopoly generation and transmission company (the CEGB). The integration of electricity generation and high voltage transmission wires was a common feature of electricity industries across the world. The liberalisation of the electricity sector changed the traditional vertically integrated pattern of the electricity industry. Two key elements of this liberalisation process were the creation of multiple competing generation companies and the separation of the control of the operation (and often the ownership) of the transmission system from the control of the operation of generation plants. This was necessary to ensure fair competition between generation companies requiring access to the monopoly transmission system. The US has generally followed one model for achieving this – the creation of a stand-alone independent system operator (or ISO), later also known as a regional transmission organisation (or RTO). The ISO has responsibility for controlling the access to and use of the transmission grid by competing generators and retailers. Transmission assets may still be owned by a single generation company or retailer, but real time control of their operation is vested in the ISO, to ensure that the ownership of transmission assets does not facilitate market foreclosure or other anti-competitive behaviour by integrated generators or retailers. In England and Wales a different model for facilitating competition was followed, with the creation of the National Grid Company (NGC). NGC is an independent transmission system operator (ITSO) which
1 The author wishes to thank Ofwat for its support for this paper. The author acknowledges the excellent research assistance of Laura Platchkov. He wishes to thank Chris Bolt, John Stern, Jon Ashley, Cathryn Ross and Tim Keyworth for stimulating discussions as part of Ofwat’s Future Regulation project.

EPRG No. 1125
2
owns the transmission wires as well as controls their operation. NGC was initially a separate company, whose ownership was split between the RECs. It is now part of a stand-alone company, which is not permitted to invest in electricity generation or retailing in the UK. The natural gas supply industry has exhibited many of the same trends as the electricity sector, though to a less marked extent. Fully independent system operators who control the operation of the high pressure gas network are relatively rare. They do notionally exist in a small number of countries, including Ireland, the Netherlands, Belgium and Denmark.2 Independent gas transmission system operators who own the high pressure pipes, but are not involved in the supply, retailing or production of gas also exist: e.g. in Great Britain (where the National Grid Company now also owns the gas ITSO). However gas system operators remain integrated into competitive parts of the gas supply chain in many countries, raising competition concerns. A common objective of both the ISO and the ITSO model is that they seek to facilitate increased trading within the area over which they have control. In particular they can operate over a wide area which spans multiple traditional monopoly franchise areas which existed before liberalisation. There is now some considerable experience with these system operator models and there has also been significant learning. In this paper we seek to summarise this learning and to provide lessons for the water sector. What we have in mind is that water could be competitively traded across traditional water and sewerage company boundaries by both existing companies and new entrants, but that no mechanisms currently exist to ensure that this could happen in a non-discriminatory way3. An ISO that controlled the use of existing pipe infrastructure (while ownership of the pipe assets remained with their traditional companies); or an ITSO that separated the high pressure – high diameter pipe infrastructure ownership from the rest of the system and combined assets from existing regional companies would be two ways of facilitating competition. A further, and very successful, model exists in the US. Interstate gas companies (who can be integrated into production but not into distribution or retailing) can compete with one another to transmit gas over long distances. Each interstate gas company owns and operates its own transmission system and does not have a regional monopoly. This is interesting but is perhaps not an obvious model for the water sector as it would involve the contestable entry into water transmission. In what follows we mostly focus on ISOs, which we contrast to ITSOs, in the electricity sector, as there is much more analysis and evidence on these models of system operation, we do however make reference to the gas sector where appropriate. The paper is organised into eight sections. The second section examines the nature of system operation arrangements in different countries, focussing on different ways that non-discriminatory access to monopoly transmission assets can be facilitated. The third section discusses the particular functions of the ISO, focussing on the US, with regard to
2 Often ‘independent’ system operators in gas are still owned by the state holding company or the former incumbent (see Table 2). This is not the case in electricity. 3 The potential benefits of water trading in Great Britain are discussed in Ofwat (2010). This document discusses the wide variation in water resources between regional water monopolies (p.10) and the value of potential trades (p.19).
EPRG No. 1125
3
controlling the system and operating the power markets. It also details the costs of system operation. Section four discusses the incentive issues and governance of ISOs around the world. Section five outlines the ideal model for an electricity system operator and examines the extent to which systems in the US and UK conform to the ideal. Section six explores the issue of pricing access to the system and how system operation costs are paid for. Section seven looks at the evolving role of system operators and how they might be evaluated. The final section applies the learning from system operation in energy across to the water sector and offers some interim conclusions.
Section 2: The nature of energy system operation across the world
The degree of independence of system operation in the energy sector is closely related to the extent of transmission system unbundling. Transmission assets can be owned and maintained separately from system operation. If transmission assets are themselves unbundled from the competitive parts of the energy system, then the separation of transmission ownership and system operation may be unnecessary. Pollitt (2008) identifies five models of transmission system operation.
1. The independent transmission system operator - TSO, eg. National Grid in the UK. [ITSO] The system operation function is integrated with the transmission system ownership and maintenance. This has the advantage of fully integrating the investment, long run planning and short run dispatch of the system. The ITSO usually has an incentive to increase transmission capacity in order to facilitate more trading and competition.
2. The legally unbundled TSO, e.g. RTE the French electricity transmission company with remains owned by EdF the former monopoly utility. [LTSO] This is legally unbundled from the rest of system and owns and operates transmission assets. This can involve effective separation transmission operation from the rest of the sector while transmission assets remain under the same ownership as generation/production or retail. This is an increasingly common model.
3. The independent system operator – [ISO] - model, e.g. PJM in the US, Scottish
electricity within the UK where the NGC now is the system operator but does not own the transmission assets. This is an ‘asset-lite’ SO model where the system operator does not own the transmission assets but is ownership unbundled from the rest of the system. Such an ISO arrangement can operate at a multi-jurisdictional level (though Nord Pool is an example of regional electricity market which does not have a common ISO).
4. There is a hybrid model where both the ISO and the TO are ownership
unbundled from the rest of the system. [ISO/ITO] The ISO is asset-lite, while the TO has no system operation function. This is the case in electricity in Chile and Argentina, where it was observed in the context of rapidly expanding systems.
5. The vertically integrated utility, e.g. traditional utilities in Europe. [VI] This is the
model that energy market reforms have tried to move away from, however it is
EPRG No. 1125
4
still in de facto or de jure operation in many gas markets and electricity markets around the world.
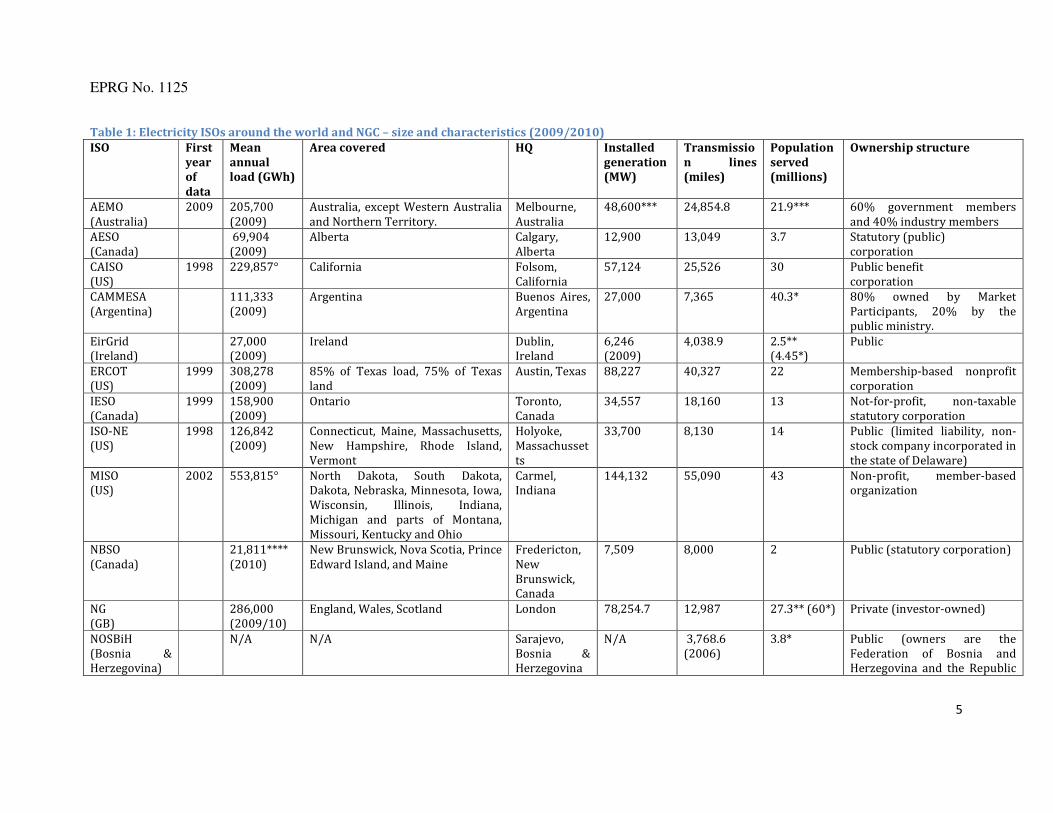
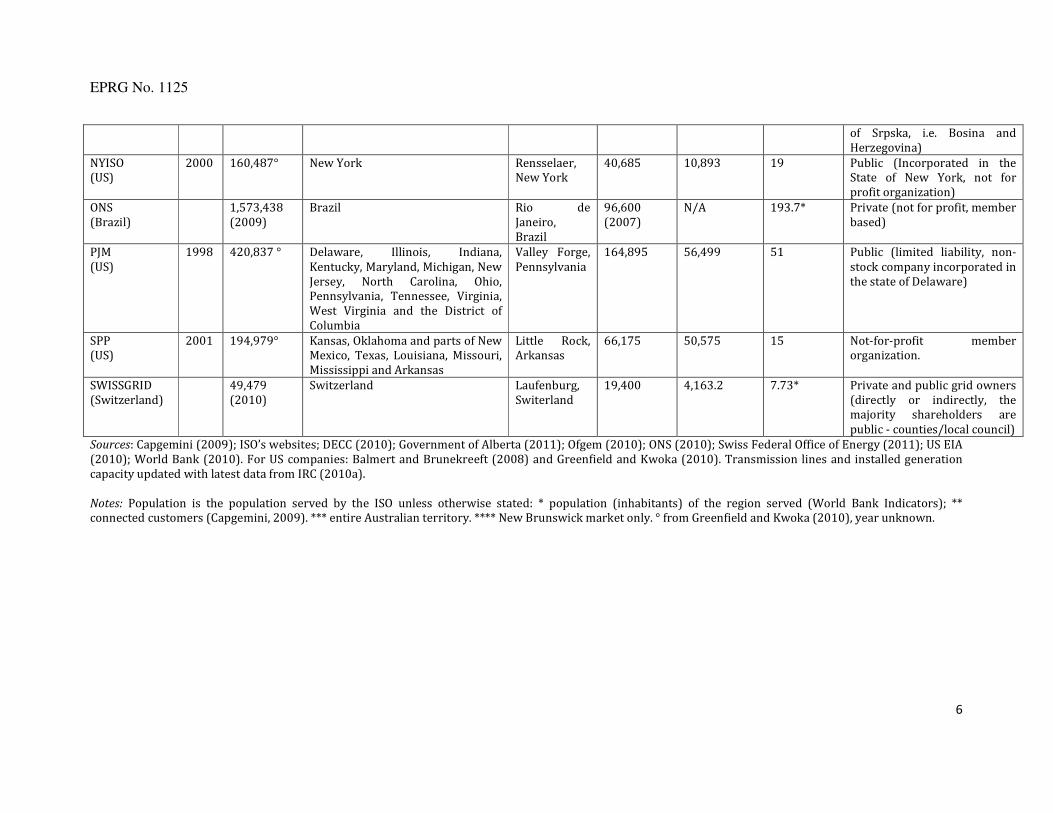
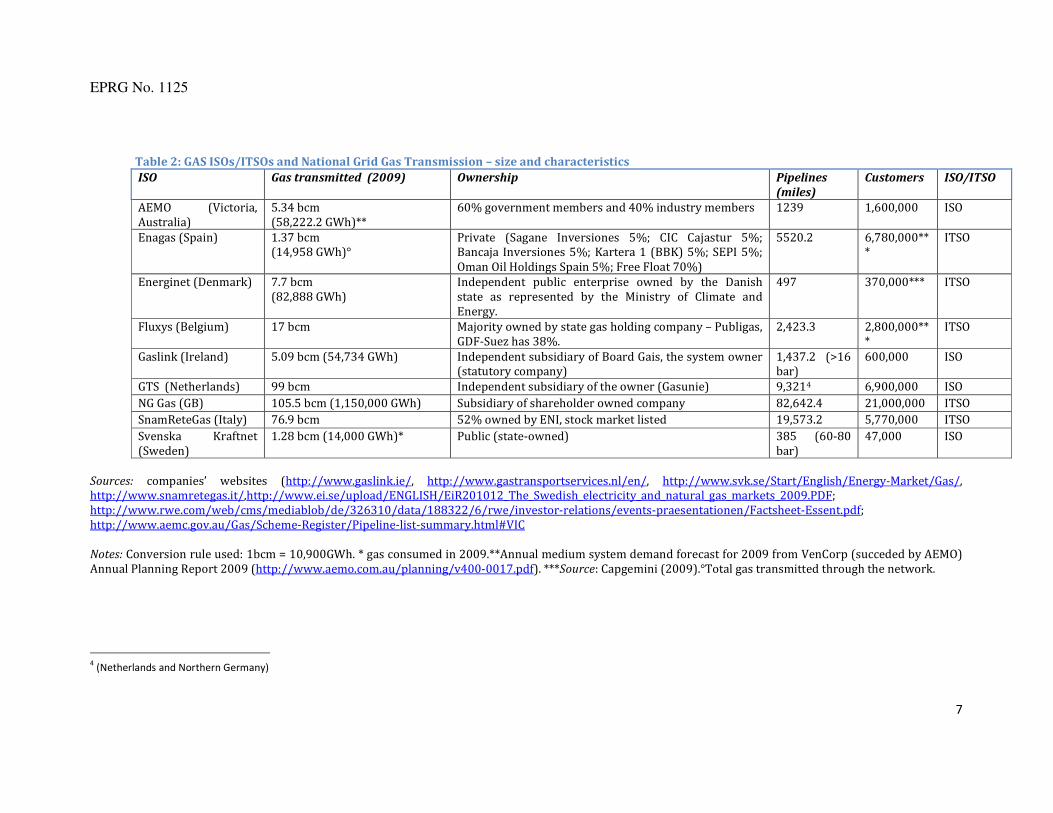
The European Union’s liberalisation of electricity and gas assets has focussed considerable attention on the issue of how to ensure the independence of system operation. As part of its third package of energy reforms in 2009 system operators were required to be legally separated and independently governed from the competitive parts of the supply chain, even if they were owned by incumbent electricity generators or gas shippers. However much of the debate focussed around the desirability of separating both transmission ownership and system operation into companies which did not share ownership with companies in other parts of the supply chain (so called ‘ownership unbundling’). The 2009 Energy Liberalisation objective discusses the desirability of ownership unbundling, while permitting the LTSO model. Table 1 gives some details on characteristics of ISOs around the world, together with NGC (an ITSO). What Table 1 reveals is that ISOs are found in a large number of countries traditionally associated with being at the forefront of electricity market reform, as well as in certain other jurisdictions where they may provide a particularly useful political role in ensuring (or signalling) non-discriminatory access to combined grids (e.g. in Bosnia and Ireland). A key benefit of the ISO is that it does not require the combination and concentration of ownership of transmission assets which might result from the move to an ITSO model. Thus it avoids politically difficult asset sales by shareholders in one geographic area to another (especially where one of the shareholders is a state government). This certainly lies behind the Bosnian ISO and is a factor in the Irish case. Even in the US the issue is that asset reorganisations (to create an interstate ITSO) require state regulatory approval which may be more difficult to gain relative to the approval of the relocation of system operation functions (to a multistate ISO). Table 1 also shows that ISOs exist in both small and large jurisdictions (in terms of population and size of energy market) and in developed and developing countries. Table 2 gives details on a number of ISOs and ITOs in gas. ISOs are far less common in natural gas supply industries than in electricity. This is partly because gas markets are non-existent or underdeveloped in many countries (particularly in the developing world) and partly because of the particular situation of the US, mentioned above. The size of the US (and Canada) and the much lower population density has allowed it to develop a much more competitive gas transmission market than currently seems possible in Europe. In Europe ISOs in gas are emerging, but usually reflect the residual power of the incumbent who retains control of transmission and high market shares in production/shipping. Thus in the Netherlands GTS is an independent operating subsidiary of the incumbent Gasunie. In Italy SnamReteGas owns and operates all of the gas transmission system but is 50% owned by the incumbent ENI which has 84% of domestic production, 62% of gas imports and 44% of retail sales. ENI is obliged by legislation to reduce its share to 20%, suggesting that an ITSO is emerging. ISOs in gas are still significantly owned by the state in Belgium, in Ireland and in Sweden, where they remain part of state holding companies. In Sweden the gas ISO is part of the electricity ITSO, but the gas transmission network is owned by a separate company (Swedegas).
EPRG No. 1125
5
Table 1: Electricity ISOs around the world and NGC – size and characteristics (2009/2010)
ISO First
year
of
data
Mean
annual
load (GWh)
Area covered HQ Installed
generation
(MW)
Transmissio
n lines
(miles)
Population
served
(millions)
Ownership structure
AEMO (Australia)
2009 205,700 (2009)
Australia, except Western Australia and Northern Territory.
Melbourne, Australia
48,600*** 24,854.8 21.9*** 60% government members and 40% industry members
AESO (Canada)
69,904 (2009)
Alberta Calgary, Alberta
12,900 13,049 3.7 Statutory (public) corporation
CAISO (US)
1998 229,857° California Folsom, California
57,124 25,526 30 Public benefit corporation
CAMMESA (Argentina)
111,333 (2009)
Argentina Buenos Aires, Argentina
27,000 7,365 40.3* 80% owned by Market Participants, 20% by the public ministry.
EirGrid (Ireland)
27,000 (2009)
Ireland Dublin, Ireland
6,246 (2009)
4,038.9 2.5** (4.45*)
Public
ERCOT (US)
1999 308,278 (2009)
85% of Texas load, 75% of Texas land
Austin, Texas 88,227 40,327 22 Membership-based nonprofit corporation
IESO (Canada)
1999 158,900 (2009)
Ontario Toronto, Canada
34,557 18,160 13 Not-for-profit, non-taxable statutory corporation
ISO-NE (US)
1998 126,842 (2009)
Connecticut, Maine, Massachusetts, New Hampshire, Rhode Island, Vermont
Holyoke, Massachussetts
33,700 8,130 14 Public (limited liability, non-stock company incorporated in the state of Delaware)
MISO (US)
2002 553,815° North Dakota, South Dakota, Dakota, Nebraska, Minnesota, Iowa, Wisconsin, Illinois, Indiana, Michigan and parts of Montana, Missouri, Kentucky and Ohio
Carmel, Indiana
144,132 55,090 43 Non-profit, member-based organization
NBSO (Canada)
21,811**** (2010)
New Brunswick, Nova Scotia, Prince Edward Island, and Maine
Fredericton, New Brunswick, Canada
7,509 8,000 2 Public (statutory corporation)
NG (GB)
286,000 (2009/10)
England, Wales, Scotland London 78,254.7 12,987 27.3** (60*)
Private (investor-owned)
NOSBiH (Bosnia & Herzegovina)
N/A N/A Sarajevo, Bosnia & Herzegovina
N/A 3,768.6 (2006)
3.8* Public (owners are the Federation of Bosnia and Herzegovina and the Republic
EPRG No. 1125
6
of Srpska, i.e. Bosina and Herzegovina)
NYISO (US)
2000 160,487° New York Rensselaer, New York
40,685 10,893 19 Public (Incorporated in the State of New York, not for profit organization)
ONS (Brazil)
1,573,438 (2009)
Brazil Rio de Janeiro, Brazil
96,600 (2007)
N/A 193.7* Private (not for profit, member based)
PJM (US)
1998 420,837 ° Delaware, Illinois, Indiana, Kentucky, Maryland, Michigan, New Jersey, North Carolina, Ohio, Pennsylvania, Tennessee, Virginia, West Virginia and the District of Columbia
Valley Forge, Pennsylvania
164,895 56,499 51 Public (limited liability, non-stock company incorporated in the state of Delaware)
SPP (US)
2001 194,979° Kansas, Oklahoma and parts of New Mexico, Texas, Louisiana, Missouri, Mississippi and Arkansas
Little Rock, Arkansas
66,175 50,575 15 Not-for-profit member organization.
SWISSGRID (Switzerland)
49,479 (2010)
Switzerland Laufenburg, Switerland
19,400 4,163.2 7.73* Private and public grid owners (directly or indirectly, the majority shareholders are public - counties/local council)
Sources: Capgemini (2009); ISO’s websites; DECC (2010); Government of Alberta (2011); Ofgem (2010); ONS (2010); Swiss Federal Office of Energy (2011); US EIA (2010); World Bank (2010). For US companies: Balmert and Brunekreeft (2008) and Greenfield and Kwoka (2010). Transmission lines and installed generation capacity updated with latest data from IRC (2010a). Notes: Population is the population served by the ISO unless otherwise stated: * population (inhabitants) of the region served (World Bank Indicators); ** connected customers (Capgemini, 2009). *** entire Australian territory. **** New Brunswick market only. ° from Greenfield and Kwoka (2010), year unknown.
EPRG No. 1125
7
Table 2: GAS ISOs/ITSOs and National Grid Gas Transmission – size and characteristics
ISO Gas transmitted (2009) Ownership Pipelines
(miles)
Customers ISO/ITSO
AEMO (Victoria, Australia)
5.34 bcm (58,222.2 GWh)**
60% government members and 40% industry members 1239 1,600,000 ISO
Enagas (Spain) 1.37 bcm (14,958 GWh)°
Private (Sagane Inversiones 5%; CIC Cajastur 5%; Bancaja Inversiones 5%; Kartera 1 (BBK) 5%; SEPI 5%; Oman Oil Holdings Spain 5%; Free Float 70%)
5520.2 6,780,000***
ITSO
Energinet (Denmark) 7.7 bcm (82,888 GWh)
Independent public enterprise owned by the Danish state as represented by the Ministry of Climate and Energy.
497 370,000*** ITSO
Fluxys (Belgium) 17 bcm Majority owned by state gas holding company – Publigas, GDF-Suez has 38%.
2,423.3 2,800,000***
ITSO
Gaslink (Ireland) 5.09 bcm (54,734 GWh) Independent subsidiary of Board Gais, the system owner (statutory company)
1,437.2 (>16 bar)
600,000 ISO
GTS (Netherlands) 99 bcm Independent subsidiary of the owner (Gasunie) 9,3214 6,900,000 ISO
NG Gas (GB) 105.5 bcm (1,150,000 GWh) Subsidiary of shareholder owned company 82,642.4 21,000,000 ITSO
SnamReteGas (Italy) 76.9 bcm 52% owned by ENI, stock market listed 19,573.2 5,770,000 ITSO
Svenska Kraftnet (Sweden)
1.28 bcm (14,000 GWh)* Public (state-owned) 385 (60-80 bar)
47,000 ISO
Sources: companies’ websites (http://www.gaslink.ie/, http://www.gastransportservices.nl/en/, http://www.svk.se/Start/English/Energy-Market/Gas/, http://www.snamretegas.it/,http://www.ei.se/upload/ENGLISH/EiR201012_The_Swedish_electricity_and_natural_gas_markets_2009.PDF; http://www.rwe.com/web/cms/mediablob/de/326310/data/188322/6/rwe/investor-relations/events-praesentationen/Factsheet-Essent.pdf; http://www.aemc.gov.au/Gas/Scheme-Register/Pipeline-list-summary.html#VIC Notes: Conversion rule used: 1bcm = 10,900GWh. * gas consumed in 2009.**Annual medium system demand forecast for 2009 from VenCorp (succeded by AEMO) Annual Planning Report 2009 (http://www.aemo.com.au/planning/v400-0017.pdf). ***Source: Capgemini (2009).°Total gas transmitted through the network.
4 (Netherlands and Northern Germany)
EPRG No. 1125
8
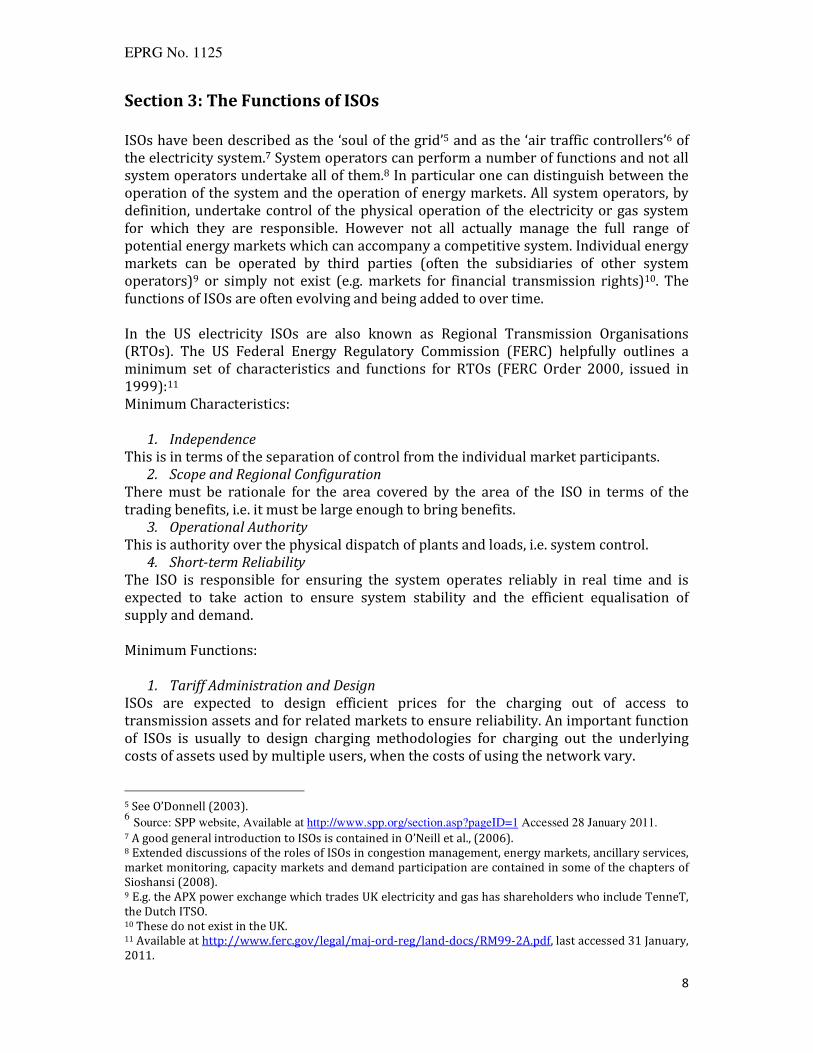
Section 3: The Functions of ISOs
ISOs have been described as the ‘soul of the grid’5 and as the ‘air traffic controllers’6 of the electricity system.7 System operators can perform a number of functions and not all system operators undertake all of them.8 In particular one can distinguish between the operation of the system and the operation of energy markets. All system operators, by definition, undertake control of the physical operation of the electricity or gas system for which they are responsible. However not all actually manage the full range of potential energy markets which can accompany a competitive system. Individual energy markets can be operated by third parties (often the subsidiaries of other system operators)9 or simply not exist (e.g. markets for financial transmission rights)10. The functions of ISOs are often evolving and being added to over time. In the US electricity ISOs are also known as Regional Transmission Organisations (RTOs). The US Federal Energy Regulatory Commission (FERC) helpfully outlines a minimum set of characteristics and functions for RTOs (FERC Order 2000, issued in 1999):11 Minimum Characteristics:
1. Independence
This is in terms of the separation of control from the individual market participants. 2. Scope and Regional Configuration
There must be rationale for the area covered by the area of the ISO in terms of the trading benefits, i.e. it must be large enough to bring benefits.
3. Operational Authority
This is authority over the physical dispatch of plants and loads, i.e. system control. 4. Short-term Reliability
The ISO is responsible for ensuring the system operates reliably in real time and is expected to take action to ensure system stability and the efficient equalisation of supply and demand. Minimum Functions:
1. Tariff Administration and Design
ISOs are expected to design efficient prices for the charging out of access to transmission assets and for related markets to ensure reliability. An important function of ISOs is usually to design charging methodologies for charging out the underlying costs of assets used by multiple users, when the costs of using the network vary.
5 See O’Donnell (2003). 6 Source: SPP website, Available at http://www.spp.org/section.asp?pageID=1 Accessed 28 January 2011.
7 A good general introduction to ISOs is contained in O’Neill et al., (2006). 8 Extended discussions of the roles of ISOs in congestion management, energy markets, ancillary services, market monitoring, capacity markets and demand participation are contained in some of the chapters of Sioshansi (2008). 9 E.g. the APX power exchange which trades UK electricity and gas has shareholders who include TenneT, the Dutch ITSO. 10 These do not exist in the UK. 11 Available at http://www.ferc.gov/legal/maj-ord-reg/land-docs/RM99-2A.pdf, last accessed 31 January, 2011.

EPRG No. 1125
9
2. Congestion Management
At certain times of the day particular electricity transmission wires can be congested. ISOs have to price congestion and ensure that congestion costs to the system are minimised by making best use of the network and monitoring abuse of local monopoly power by generators operating in import constrained areas (i.e. where competition is limited by the congestion on the transmission lines).
3. Parallel Path Flow
Transmission systems in electricity usually involve electricity arriving at a single node on the network by more than one route. This is for two reasons. First, because of Kirchoff’s Laws of network resistance, whereby if parallel paths exist in an AC electricity network the total flow between A and B will be distributed among the parallel paths from A to B in inverse proportion to the resistance along those paths. Second, network security considerations usually involve n-1 or n-2 security criteria, whereby electricity transmission networks are designed to cope with normal outages on 1 or 2 routes without interruption of supply to any node. ISOs need to manage parallel path flows.
4. Ancillary Services
Electricity networks do not just transmit raw electrical energy. They require additional services to be purchased in addition to quantities of energy measured in MegaWatt hours (MWh). These include generation reserves to follow the load, provide reliability and supplement the operating reserves, markets for energy imbalances, real power loss replacement and voltage control services for generators and transmission assets (Hirst and Kirby, 1996). These can be provided by third parties in most cases but they require co-ordination by the system operator.
5. OASIS and Total Transmission Capability (TTC) and Available Transmission
Capability (ATC)
OASIS is the internet based system which allows market participants to gain access to the transmission system in a non-discriminatory way. All generators wanting to book access to a particular transmission line have to use it, even if they are owned by the same company. ISOs have responsibility for operating the OASIS software and for calculating the amount of transmission that exists and is actually available (TTC and ATC). The difference between TTC and ATC is amount required to maintain reliability.
6. Market Monitoring
ISOs cover wide areas with many nodes. There is the potential for market abuse (i.e. market price manipulation) at particular nodes. These abuses may be individually small in absolute terms of their financial impact but could be collectively large. The ISO needs to monitor the geographic sub-markets which emerge due to local congestion in order to limit the aggregate cost of such market abuse, where normal competition policy would simply be too cumbersome to be used to investigate abuses.
7. Planning and Expansion
While ISOs do focus on short term system management, they are in an extremely privileged position with respect to information about where the system could benefit from new investment to reduce existing constraints and also how the existing system should respond to future demands and loads coming on to it. Given rising demand for electricity and initially under-sized transmission systems (due to a history of regional monopolies with weak transmission links between them), ISOs clearly have a role in coordinating and evaluating future investments in the transmission network.
8. Interregional Coordination
ISOs are connected to one-another at the boundaries of their control areas. Clearly they need to collaborate with one another to manage cross border flows of electricity,
EPRG No. 1125
10
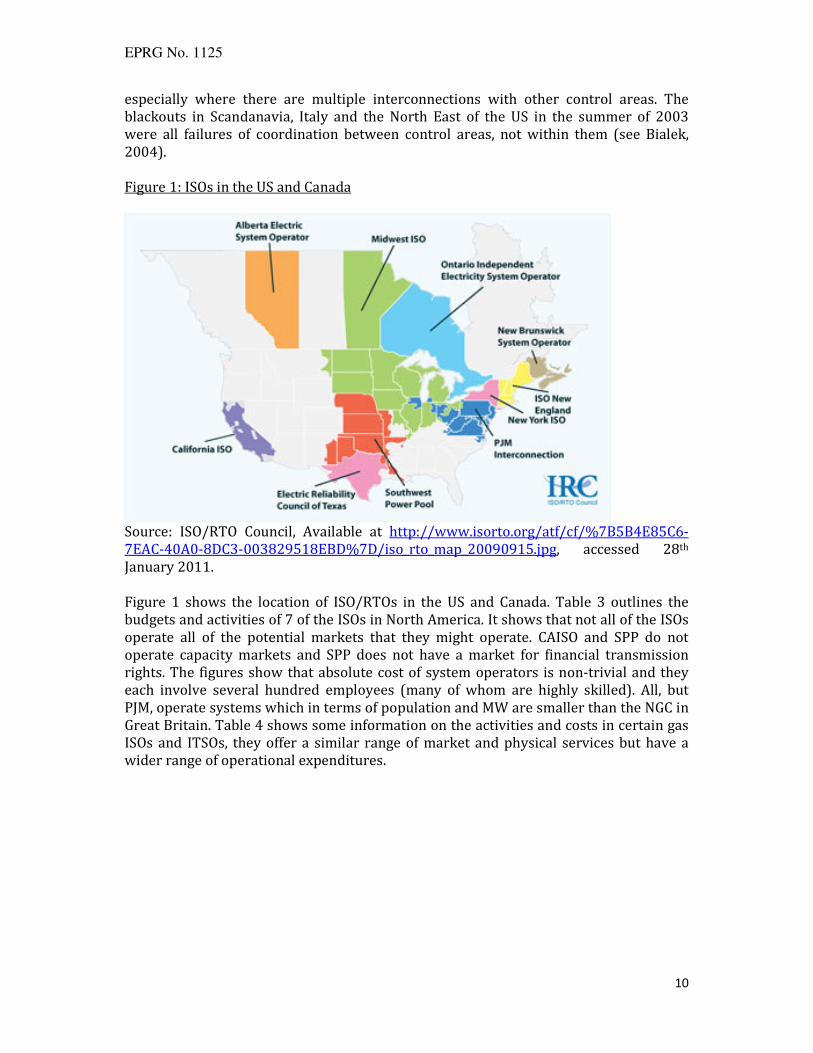
especially where there are multiple interconnections with other control areas. The blackouts in Scandanavia, Italy and the North East of the US in the summer of 2003 were all failures of coordination between control areas, not within them (see Bialek, 2004). Figure 1: ISOs in the US and Canada
Source: ISO/RTO Council, Available at http://www.isorto.org/atf/cf/%7B5B4E85C6-7EAC-40A0-8DC3-003829518EBD%7D/iso_rto_map_20090915.jpg, accessed 28th January 2011. Figure 1 shows the location of ISO/RTOs in the US and Canada. Table 3 outlines the budgets and activities of 7 of the ISOs in North America. It shows that not all of the ISOs operate all of the potential markets that they might operate. CAISO and SPP do not operate capacity markets and SPP does not have a market for financial transmission rights. The figures show that absolute cost of system operators is non-trivial and they each involve several hundred employees (many of whom are highly skilled). All, but PJM, operate systems which in terms of population and MW are smaller than the NGC in Great Britain. Table 4 shows some information on the activities and costs in certain gas ISOs and ITSOs, they offer a similar range of market and physical services but have a wider range of operational expenditures.

EPRG No. 1125
11
Table 3: Budgets and Activities of certain electricity ISOs in North America RTO/
ISO
Annual
Budget and
Debt Service
($ millions)
Employees Historical
Peak (MW)
Services Offered
CAISO (US) 195.1 572 57,000 • Energy market: day ahead, hour ahead, and real time.
• Spot market with locational marginal pricing.
• Ancillary services, and Financial Transmission Rights (FTR) market
ERCOT (US) 176.1 670 65,700 • ERCOT schedules and centrally dispatches the grid within a single control area, ensures transmission reliability and wholesale open
access, and manages financial settlement in the wholesale power market. It also administers the Texas competitive retail market,
including customer switching. ERCOT operates wholesale markets for:
* Balancing energy
* Ancillary service markets with zonal congestion management.
• Market participants trade electricity bilaterally directly, through brokers and through the Intercontinental Exchange (ICE). Physical
products predominantly use the ERCOT hub pricing point, but physical and financial products priced at the four ERCOT zones are also
traded.
MISO (US) 273.0 782 137,000 • Midwest ISO administers a two-settlement (day ahead and real-time) energy market known as the Day-2 market. It produces hourly
locational marginal prices (LMP).
• Midwest ISO administers an ancillary services market (Day 3) as well.
• Midwest ISO also administers a monthly financial transmission rights (FTR) allocation and auction. Midwest ISO is developing a capacity
market proposal for early 2011.
ISO-NE (US) 137.2 483 36,000 • Energy market: two-settlement (day ahead and real-time) spot market with LMP
• Capacity market
• Forward reserves market,
• Regulation market
• Financial transmission rights market.
NYISO (US) 119.5 452 33,000 • Energy market: two-settlement (day ahead and real-time) spot market with LMP
• Regional and locational capacity market
• Financial transmission rights market.
PJM (US) 252.0 725 167,000 • Energy market: two-settlement (day ahead and real-time) spot market with LMP (prices calculated at each bus every five minutes)
• Capacity markets (RPM)
• Ancillary services markets
• Financial transmission rights (FTR) market
SPP (US) 76.2 476 50,000 • Transmission service on the transmission facilities owned by its members and operates the region's real-time energy imbalance service
(EIS) market. Market participants trade physical electricity bilaterally, either directly or through brokers, and through the EIS market.
• Balancing Function
Sources: Own correspondence with FERC, November 2010; http://www.ferc.gov/market-oversight/mkt-electric/texas.asp; http://www.ercot.com/news/press_releases/2010/nr-10-05-10.

EPRG No. 1125
12
Table 4: Roles, services and operational expenditures of certain Gas ISOs/ITSOs
ISO Key role and responsibilities Services offered Operational
Expenditures
(Euros)
AEMO (Victoria, Australia)
Key roles (Victorian gas market):
• Operator of the Victorian wholesale and retail gas market
• Gas transmission planning Responsibilities (in general):
• Oversees system security of the Victorian gas transmission network (Declared Transmission System).
• National transmission planning for gas Responsibilities with respect to the Victorian wholesale gas
market in particular:
• Operation of the Declared Transmission System (DTS)
• Operation and administration of the gas market in accordance with the Gas Industry Act and the National Gas Rules (NGR)
• Establishment and update of system security guidelines for the DTS (in a way to minimise the threats to system security)
• Monitoring of trading activity in the market
• Identification and report significant price variations in the market.
• Operator of Victorian wholesale and retail gas market
• Operator of Victorian gas transmission system
• National transmission planning
442,693,536*
(Note: operating
expenses from all
AEMO’s business
segments; 2010)
Enagas (Spain) Key roles:
• Gas transmission system operator
• Operator of storage facilities Responsibilities:
• ensure continuity and security of supply
• encourage competition
• maintain and develop the network
• Regasification plants
• Transmission of domestic and international gas:
• Operator of storage facilities
• Development of gas pipeline and physical connections
• Laboratory certification services for quality and quantity of natural gas
• Development of a balancing platform (OTC, named MS-ATR). Gas trade is performed by bilateral agreements. Clearing service is not included.
200,180,000
Energinet (Denmark)
Key roles:
• Gas Transmission System Operator
• Operator of the storage facilities
Responsibilities:
• maintain the overall short-term and long-term security of (electricity and) gas supply
• Operator of gas transmission system and storage facilities
• National transmission planning
88,770,111 (661,000,000 DKK)***

EPRG No. 1125
13
• develop the main (electricity and) gas transmission infrastructure
• create objective and transparent conditions for competition on the energy markets and
monitor that competition works
• carry out coherent and holistic planning, taking account of future transmission capacity
requirements and long-term security of supply
• support eco-friendly power generation and the development and demonstration of green
energy production technologies
• calculate the environmental impact of the energy system as a whole.
Fluxys (Belgium)
Key roles:
• System Operator of national transmission grid, storage facilities and LNG terminal facilities
Responsibilities:
• Operating the domestic and border to border transmission
• Operating storage facilities
• LNG Zeebrugge terminal facilities
• Domestic Transmission of natural gas and Border to Border transmission
• Storage – Buffer capacity to cover peak demand on the Belgian heating market.
• LNG terminaling
• End users services
• Ancillary services on the Zeebrugge Hub, one of the largest spot markets for natural gas in Europe)
• Operational support services
314,023,000* (2009)
Gaslink (Ireland)
Key roles:
• System Operator
• Licence Holder
• Regulatory/Market Arrangements. Responsibilities:
• operating, maintaining and developing, the transmission and distribution systems;
• supplying information to any other system operators and users;
• ensuring equal access to the networks;
• ensuring reliability and quality;
• adopting rules for the purposes of balancing the gas system
• End-User Services
• Shipper/Supplier Services
• Contractual Framework
• Gas Market Arrangements
3,680,000 (2009)
GTS (Netherlands)
Key roles & responsibilities:
• National transmission system operator Responsibilities:
• Operating, developing transmission system
• Network management and monitoring (local transport, import, export, transit)
• Planning and advice to Gasunie (TO)
• Monitoring and intervention in case of supplier’s defaults to
61,397,000** (2009)

EPRG No. 1125
14
• Ensuring sufficient capacity
• Balancing the grid
• Creating and maintaining connection with other grid
• Quality conversion
• Flexibility services (under certain condition)
• Monitoring reliability, quality and safety
• Ensuring security of supply (peak delivery and supplier of last resort)
small-scale users
National Grid Gas (GB)
Key roles:
• National transmission system and LNG storage operator Responsibilities:
• Operating the national transmission system, including:
• Daily balancing of supply and demand
• Maintenance of satisfactory system pressures and ensuring gas quality standards
• Ensuring secure delivery and reliability
• Maintenance levels of short-term gas reserves
• Operation of 3 LNG storage facilities
• Development and maintenance of gas pipeline system
• National gas transport
• Development and maintenance of pipeline system for the conveyance of gas, including demand forecasting
35,617,977.5 (2009) [£31,700,000]
SnamReteGas (Italy)
Key roles:
• National transmission system and storage operator Responsibilities:
• Transport and dispatching
• Planning, building and development of the gas system
• Regasification of (LNG)
• Storage (8 storage fields)
• (Principal gas distributor)
• Transports and dispatches
• Regasification of LNG
• Storage
• Gas distribution
581,000,000* (2009)°
Svenska Kraftnet (Sweden)
Key role:
• Swedish natural gas system responsibility Responsibilities:
• Securing the short-term balance
• Provision of information on a continuous basis to BRP (balance responsible parties)
• Executions balance settlements
• BRP’s counterparty in purchase and sale of gas
• Weekly trading and system balancing 5,085,176.7 (2009)
Sources: companies’ websites; http://www.ei.se/upload/ENGLISH/EiR201012_The_Swedish_electricity_and_natural_gas_markets_2009.PDF; http://www.aemc.gov.au/Gas/National-Gas-Rules/Current-Rules.html; http://www.aemo.com.au/corporate/0000-0264.pdf.

EPRG No. 1125
15
Notes: *consolidated statements. **”Other operating costs” are mainly service costs as agreed between GTS and N.V. Nederlandse Gasunie in the network Management Agreement, Service Level Agreement or other agreements relating to the provision of employees and business assets. ***This amount can be further divided as follows: 620,000,000 DKK for gas transmission costs [that includes 537,000,000 for payment for reserve/storage capacity; inspection by Danish Energy Regulatory Authority and Danish Energy Agency, other external operating expenses and staff costs (83,000,000 DKK)]; as well as 41,000,000 for gas storage (that includes 31,000,000 DKKK for other external operating expenses).° Includes: 399,000,000 (transportation costs); 27,000,000 (regasification); 147,000,000 (distribution); 38,000,000 (storage) less 30,000,000 (consolidation adjustments). Amounts converted from local currency into Euros with the annual sport exchange rate from the European Central Bank or from the Bank of England.

EPRG No. 1125
16
Table 5: Costs breakdown for a typical US ISO (US $) – Electric O&M expenses (FERC Form 1, p.320-323) Account CAISO (US)
(2009)
PJM (US)
(2008)
NYISO (US)
(2008)
Source
1. Total Power Production Expenses . . . p.321, line 80
2. Total Transmission Expenses 48,697,922 38,657,854 19,603,226 p.321, line 112
(560) Operation Supervision and Engineering 1,846,438 7,312,254 1,845,944 p.321, line 83
(561) Load Dispatching 1,796,456 28,135,635 13,740,392 p.321, line 84
(562) Station Expenses . . . p.321, line 93
(563) Overhead Lines Expenses . . . p.321, line 94
(564) Underground Lines Expenses . . . p.321, line 95
(565) Transmission of Electricity by Others . . . p.321, line 96
(566) Miscellaneous Transmission Expenses . . . p.321, line 97
(567) Rents . . . p.321, line 98
TOTAL Operation 40,031,734 35,447,889 15,586,336 p.321, line 99
(568) Maintenance Supervision and Engineering 8,666,188 . p.321, line 101
(569) Maintenance of Structures . 3,209,965 4,016,890 p.321, line 102
(570) Maintenance of Station Equipment . . . p.321, line 107
(571) Maintenance of Overhead Lines . . . p.321, line 108
(572) Maintenance of Underground Lines . . . p.321, line 109
(573) Maintenance of Miscellaneous Transmission
Plant
. . . p.321, line 110
TOTAL Maintenance 8,666,188 3,209,965 4,016,890 p.321, line 111
(Total of lines 101 thru 110)
3. TOTAL Regional Transmission and Market Op
Expns
30,193,256 21,018,707 20,710,816 p.322, line 131
(Total 123 and 130)
(575.1) Operation Supervision 6,390,563 4,218,118 449,860 p.322, line 115
(575.2) Day-Ahead and Real-Time Market
Facilitation
9,407,976 3,983,003 5,976,131 p.322, line 116
(575.3) Transmission Rights Market Facilitation. 2,672,576 1,581,491 2,648,599 p.322, line 117
(575.4) Capacity Market Facilitation . 3,499,869 2,412,101 p.322, line 118
(575.5) Ancillary Services Market Facilitation 2,894,536 763,196 1,424,267 p.322, line 119
(575.6) Market Monitoring and Compliance 5,940,585 5,404,742 4,602,859 p.322, line 120
(575.7) Market Facilitation, Monitoring and
Compliance Services
. . . p.322, line 121
(575.8) Rents 1,230,490 . . p.322, line 122
Total Operation (Lines 115 thru 122) 28,536,726 19,450,419 17,513,817 p.322, line 123
Total Maintenance (Lines 125 thru 129) 1,656,530 1,568,288 3,196,999 p.322, line 130
4. TOTAL Distribution Expenses . . . p.322, line 156
(Total of lines 144 and 155)
5. TOTAL Customer Accounts Expenses 5,939,455 3,704,275 11,179,509 p.322, line 164, (Total of lines 159 thru
163)
6. TOTAL Customer Service and Information
Expenses
6,660,653 12,990,108 525,077 p.323, line 171,
(Total 167 thru 170)
7. TOTAL Sales Expenses . . . p.323, line 178,
(Total of lines 174 thru 177)
8. TOTAL Administrative & General Expenses 71,573,791 125,743,697 61,694,263 p.323, line 197
(Total of lines 194 and 196)
TOTAL Elec Op and Maint Expns 163,065,077 202,114,641 113,712,891 p.323, line 198
(Total80,112,131,156,164,171,178,197)
Elec Op and Maint Epns/population 5.44 3.96 5.98
National Grid - TOTAL Elec Op and Maint Expns $93,050,100 [£ 59,400,000 (SO)]
Cash controllable OPEX, 2008-09;
(Ofgem 2010, p.42)
Elec Op and Maint Epns/population $1.55 (£ 0.99)
Sources: US companies’ FERC FORM 1, available at http://elibrary.ferc.gov/idmws/search/results.asp; National Grid: Ofgem (2010); Exchange
rate (annual average spot market for 2008): Bank of England.
Table 5 shows a breakdown of the operation and maintenance (O+M) costs of three of the US ISOs in terms of activity as provided in their annual submission to FERC. The O+M costs are 80%+ of the total costs of the ISO because ISOs are asset-lite (compare the figures in Table 5 with those in Table 3). This detailed breakdown is interesting because it allows the costs of some of the sub-activities of an ISO to be identified. Around half the O+M cost in each of the ISOs is in administration and general (i.e. shared overhead costs, which includes pensions and benefits). Of the rest about half is in the actual system operation of the physical transmission assets (Total Transmission Expenses), while a substantial portion is spent in running the various markets associated with the provision of transmission and

EPRG No. 1125
17
ancillary services. Individual markets are expensive: capacity markets cost $3.5m in PJM and $2.4m in NYISO. Some costs vary substantially with size, e.g. PJM has customer service and information expenses that are much higher than CAISO and NYISO, while other costs do not, e.g. market monitoring and compliance (see line 575.6). Yet other costs which you might expect to be lower for larger systems are not, e.g. NYISO has much higher customer accounts expenses than PJM. Overall PJM does have lower costs per member of the population of its control area, while NYISO has the highest unit cost and is the smallest of the three. However, CAISO is the most expensive to operate in several categories of expenditure, indicating a possibility of cost inefficiency within ISOs. As a point of comparison the NGC has costs of around half that of PJM, but operates far fewer of PJM’s markets (NGC does not operate a day-ahead market, a transmission rights market or a capacity market). Overall Table 5 suggests that system operation costs will vary with the functions of the system operator; additional functions may come at non-trivial cost; there may be substantial economies of scale; but there may be also scope for inefficiency relative to the best possible outcome. It is important to note that ISOs have reasonably long history in the US which has brought them to their current stage of development. The recent history of transmission arrangements in the US is well discussed in Joskow (2004), who traces FERC’s attempts to liberalise the electricity sector by promoting ISOs (in FERC Order 888) and then RTOs (in FERC Order 2000) and specifically the ISO-RTO model of PJM (in Standard Market Design proposals: SMD 2002). While the FERC was unsuccessful in forcing all utilities to participate in RTOs, there has been substantial voluntary expansion of RTOs to the point illustrated in Figure 1. The California electricity crisis of 2000-2001, in one of the leading reform states, made it politically impossible for FERC to force the RTO model which was designed to promote competitive electricity markets to all states. PJM, ISO-NE and NYISO are based on pre-existing regional power pools among vertically integrated utilities. CAISO and ERCOT were created by the legislation facilitating liberalisation of state electricity markets. MISO has emerged voluntarily in 1998 beginning with coordinating transmission, extending in 2005 to also operate a wholesale power market and in 2009 (it began an ancillary services market12. PJM’s three initial utilities began cooperating in 1927 to form the world’s first power pool in order to save costs. It expanded over time becoming an independent organisation in 1997.13 SPP began operating in 1941 as a power pool of 11 utilities aiming to keep an Arkansas aluminium factory operational.14 The history of ISOs in the US highlights the role of computing power in facilitating both the existence and functions of independent system operators (see Isemonger, 2009), who notes that the emergence of software to manage the grid and run ancillary services markets is crucial to their development. The evolution of MISO illustrates how ISOs learn from each other and seem to be gradually standardising many of their service offerings to their members. In terms of the activities of ISOs which are not directly related to system operation and market facilitation, we can look at the example of SPP. SPP offers additional services.15 It works with member companies to ensure compliance with wider market rules imposed by the regulator; it trains market and system operators in member companies; and it offers contract services to non-member companies on reliability, tariff setting and scheduling. Thus ISOs may provide other services to the market which facilitate competition.
12 This three stage process of extending ISO services is described further in section 7. 13
Source: PJM website, http://www.pjm.com/about-pjm/who-we-are/pjm-heritage.aspx, Accessed 28th January 2011. 14
Source: SPP website, http://www.spp.org/section.asp?pageID=1, Accessed 28th January 2011. 15
Source: SPP website, http://www.spp.org/section.asp?pageID=1, Accessed 28th January 2011.
EPRG No. 1125
18
It is important to note that the US model is not the only one and that the most successful regional market – Nordpool – is in fact a power pool operated by a number of national transmission system operators. Other European power pools e.g. the APX and the BELPEX (France-Belgium-Netherlands pool) have greatly facilitated cross-border trading by allowing the emergence of multi-area single price zones via voluntary markets not run by the area’s physical system operator. These models suggest that it might be possible to separate market and system operation, but the system operators themselves still benefit from separation from the other actors in the system.
4: The Governance of System Operators and Incentives
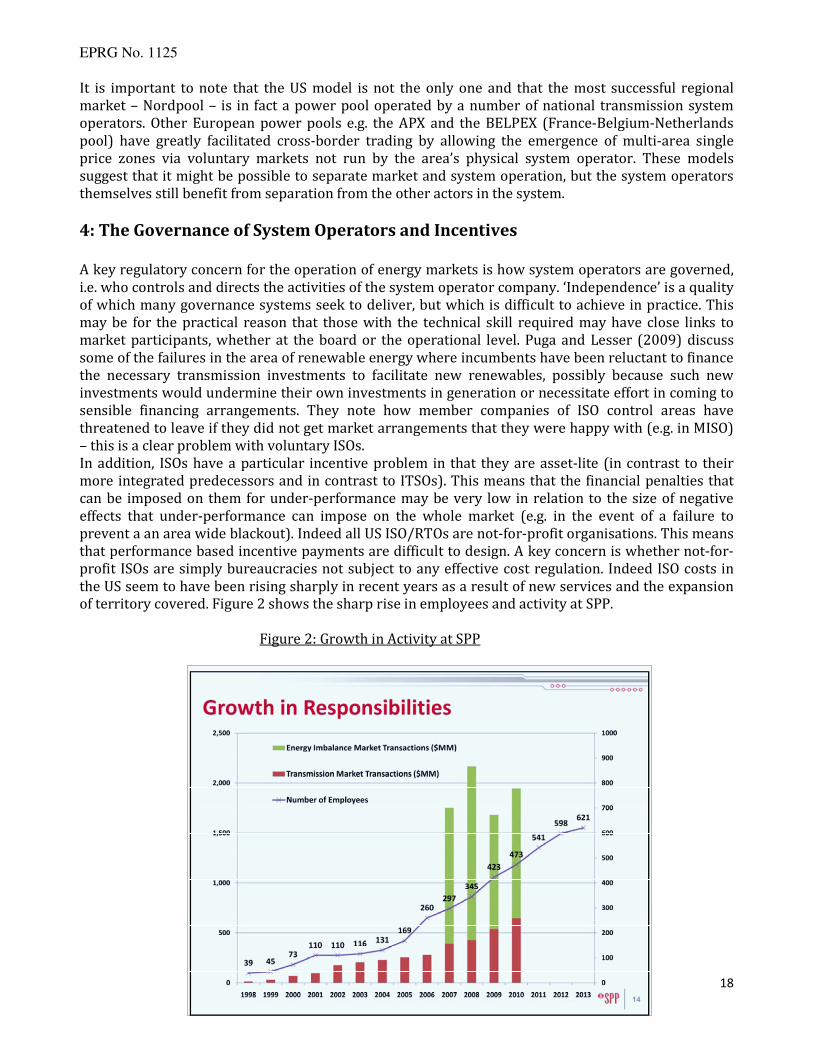
A key regulatory concern for the operation of energy markets is how system operators are governed, i.e. who controls and directs the activities of the system operator company. ‘Independence’ is a quality of which many governance systems seek to deliver, but which is difficult to achieve in practice. This may be for the practical reason that those with the technical skill required may have close links to market participants, whether at the board or the operational level. Puga and Lesser (2009) discuss some of the failures in the area of renewable energy where incumbents have been reluctant to finance the necessary transmission investments to facilitate new renewables, possibly because such new investments would undermine their own investments in generation or necessitate effort in coming to sensible financing arrangements. They note how member companies of ISO control areas have threatened to leave if they did not get market arrangements that they were happy with (e.g. in MISO) – this is a clear problem with voluntary ISOs. In addition, ISOs have a particular incentive problem in that they are asset-lite (in contrast to their more integrated predecessors and in contrast to ITSOs). This means that the financial penalties that can be imposed on them for under-performance may be very low in relation to the size of negative effects that under-performance can impose on the whole market (e.g. in the event of a failure to prevent a an area wide blackout). Indeed all US ISO/RTOs are not-for-profit organisations. This means that performance based incentive payments are difficult to design. A key concern is whether not-for-profit ISOs are simply bureaucracies not subject to any effective cost regulation. Indeed ISO costs in the US seem to have been rising sharply in recent years as a result of new services and the expansion of territory covered. Figure 2 shows the sharp rise in employees and activity at SPP.
Figure 2: Growth in Activity at SPP

EPRG No. 1125
19
Source: http://www.spp.org/publications/Intro_to_SPP_presentation.pdf, Accessed 28th January 2011. The independence issue has focussed on the board of directors of the ISO given its separate legal status and its not-for-profit nature. An early paper by Barker et al. (1996) noted that a two tier board seems to be a good way forward, with an advisory board representing the interests and expertise of participating companies, subservient to a managing board made up of independents. This model emerged early on in the Victoria power pool. However Barker et al. advised that the regulator would have to keep a close eye on the independence of the board and possibly be involved in some way in the governance of the ISO. Two tier boards are supported by Abdala (2008) in the context of developing countries subject to weak regulators (such as Argentina), as they may be sufficiently independent to reduce the ability of the government to interfere arbitrarily in the operation of the system, via the regulator. Arguably the growth of ISOs (encouraged in their voluntary form by FERC) in the US is a way of coordinating improvements in the regulation of the electricity system without recourse to national legislation. Hogan et al. (1996) discuss the governance issue in the context of what happens in other sectors such as financial services. They highlight the fact that it remains difficult to combine for-profit incentives with independence. The ITSO model does allow strong for profit incentives to be given to system operators, as in the UK with National Grid Electricity Transmission (NGET) and National Grid Gas Transmission (NGGT). For instance NGET was given very strong incentives to reduce congestion in the electricity network in the years following privatisation, with it did very successfully, by better utilisation of the existing network and modest investments in reducing transmission constraints. The incentive has been powerful with payments ranging from +£48m to -£15m16, on system operator revenue of around £83m17 of the annual revenue of the system operator. However this is only 1 to 4% of the total revenue of the combined system operator and transmission operator (ITSO)18. Such a powerful incentive would be costly to impose on a system operator that was not integrated with a transmission operator. Another model which has been attempted is a management contract for a system operator (see Boyce and Hollis, 2005). This was a route pursued by the Province of Alberta in 1998, who ran a tender for a for profit system operator to run their system for 5 years. ESB International, a subsidiary of the state owned Irish utility, won the contract. The contract was terminated because it was not flexible enough and Alberta now has a not-for-profit ISO established by the government.19 The particular issues cited in this change were the fact that the power pool was operated independently of the system operator under the sub-contracting regime and the for-profit ISO arrangement was costly (presumably because there had to considerable upside incentive to encourage serious bidding, which is then politically difficult to justify if it is realised). A further attempt to have a for-profit ISO is illustrated by the ill-fated Alliance RTO which was proposed in the US in 1999. This initially involved 10 utilities in the Mid-West. Eight of them wished to
16 Ofgem (2010d, p.8). 17 Ofgem (2006b, p.20). 18 Transmission operator allowed revenues have been around £1.1bn (see Ofgem, 2006a, p.6). 19 See ‘Alberta to merge power pool and transmission’, Calgary Herald, 11 May 2002, and ‘Alberta to Pull The Plug on Transmission Administrator’, Dow Jones Energy Service, 11 May 2002.

EPRG No. 1125
20
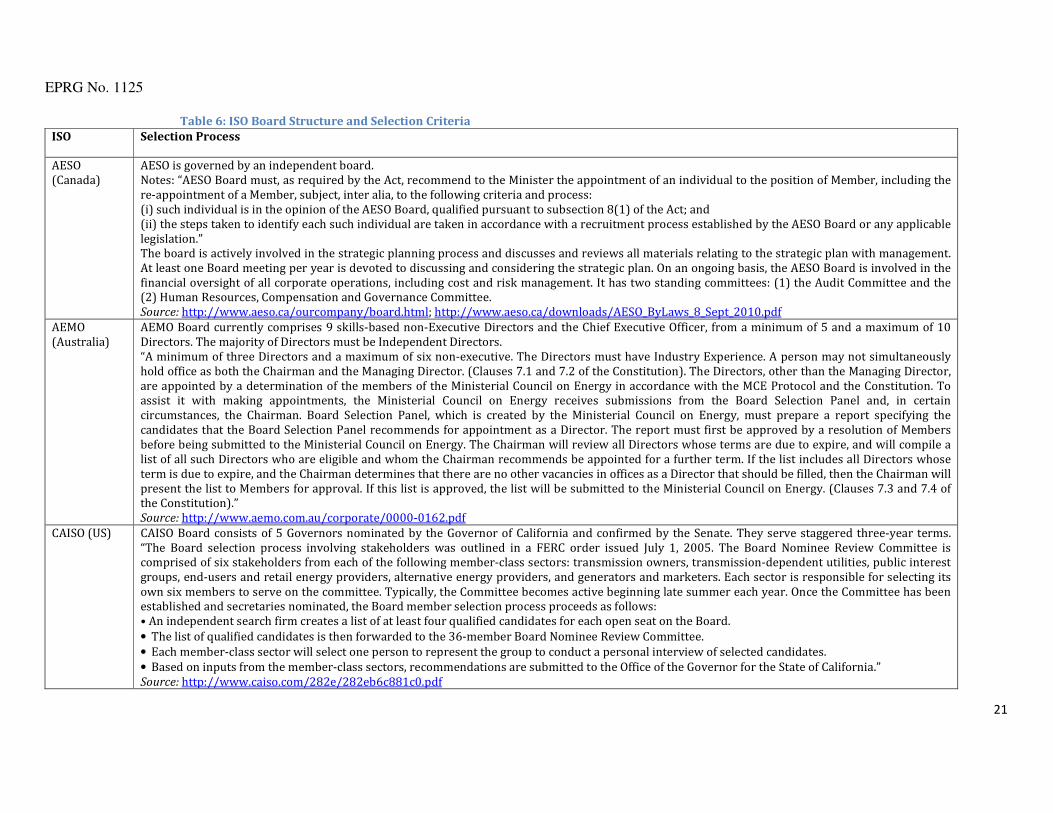
appoint the UK’s NGC to be the system operator. However the Alliance RTO failed to materialise when FERC deemed that the costs of RTO were likely to be too high and encouraged the members to join existing RTOs. Part of the issue was that the members proposed to pass the costs of system operation on to the customers via rises in regulated tariffs.20 This reveals a governance problem where private system operators appointed by market participants need to have their profits regulated or else they could simply be passed through to consumers by the market. Indeed the reason for rejecting the for-profit ISO model is related to the inability to move to an ITSO model: state level and Federal regulators don’t have sufficient experience with strong incentive regulation of monopoly elements of the electricity system. Thus if there is to be an ISO rather than ITSO, experience in electricity suggests that it should be a not-for-profit entity.21 Though there could be some form of salary based incentive scheme imposed on the senior employees (though this is more problematic in terms of risk sharing with well informed but risk averse employees). If the ISO is not-for-profit the ability of an economic regulator to incentivise efficient performance is reduced. The independence (and competence) of the board of directors would seem to be crucial. Table 6 details the board structure and characteristics of a number of electricity ISOs from around the world. An interesting feature of the governance structure is that several of the US ISOs have fully independent boards where individuals should have no ongoing relationship with market participants in the sector (e.g. NYISO, MISO and PJM). The appointment process sometimes involves member
20 See ‘FERC Chairman Cites Favorable Moves by US Grid Operators’, Dow Jones Energy Service, 18 January 2002. 21 This observation is based on the asset-lite nature of the ISO and the desirability of the organic growth of its services, rather than the US regulatory environment for ISOs. In the water sector, one could imagine there might be a more narrowly specified range of ISO activities, which might allow a tender process to be followed to choose a for-profit ISO. However this arrangement would suffer from contractual inflexibility and potential conflicts with other arrangements in the industry, as observed in Alberta.
EPRG No. 1125
21
Table 6: ISO Board Structure and Selection Criteria
ISO Selection Process
AESO (Canada)
AESO is governed by an independent board. Notes: “AESO Board must, as required by the Act, recommend to the Minister the appointment of an individual to the position of Member, including the re-appointment of a Member, subject, inter alia, to the following criteria and process: (i) such individual is in the opinion of the AESO Board, qualified pursuant to subsection 8(1) of the Act; and (ii) the steps taken to identify each such individual are taken in accordance with a recruitment process established by the AESO Board or any applicable legislation.” The board is actively involved in the strategic planning process and discusses and reviews all materials relating to the strategic plan with management. At least one Board meeting per year is devoted to discussing and considering the strategic plan. On an ongoing basis, the AESO Board is involved in the financial oversight of all corporate operations, including cost and risk management. It has two standing committees: (1) the Audit Committee and the (2) Human Resources, Compensation and Governance Committee. Source: http://www.aeso.ca/ourcompany/board.html; http://www.aeso.ca/downloads/AESO_ByLaws_8_Sept_2010.pdf
AEMO (Australia)
AEMO Board currently comprises 9 skills-based non-Executive Directors and the Chief Executive Officer, from a minimum of 5 and a maximum of 10 Directors. The majority of Directors must be Independent Directors. “A minimum of three Directors and a maximum of six non-executive. The Directors must have Industry Experience. A person may not simultaneously hold office as both the Chairman and the Managing Director. (Clauses 7.1 and 7.2 of the Constitution). The Directors, other than the Managing Director, are appointed by a determination of the members of the Ministerial Council on Energy in accordance with the MCE Protocol and the Constitution. To assist it with making appointments, the Ministerial Council on Energy receives submissions from the Board Selection Panel and, in certain circumstances, the Chairman. Board Selection Panel, which is created by the Ministerial Council on Energy, must prepare a report specifying the candidates that the Board Selection Panel recommends for appointment as a Director. The report must first be approved by a resolution of Members before being submitted to the Ministerial Council on Energy. The Chairman will review all Directors whose terms are due to expire, and will compile a list of all such Directors who are eligible and whom the Chairman recommends be appointed for a further term. If the list includes all Directors whose term is due to expire, and the Chairman determines that there are no other vacancies in offices as a Director that should be filled, then the Chairman will present the list to Members for approval. If this list is approved, the list will be submitted to the Ministerial Council on Energy. (Clauses 7.3 and 7.4 of the Constitution).” Source: http://www.aemo.com.au/corporate/0000-0162.pdf
CAISO (US) CAISO Board consists of 5 Governors nominated by the Governor of California and confirmed by the Senate. They serve staggered three-year terms. “The Board selection process involving stakeholders was outlined in a FERC order issued July 1, 2005. The Board Nominee Review Committee is comprised of six stakeholders from each of the following member-class sectors: transmission owners, transmission-dependent utilities, public interest groups, end-users and retail energy providers, alternative energy providers, and generators and marketers. Each sector is responsible for selecting its own six members to serve on the committee. Typically, the Committee becomes active beginning late summer each year. Once the Committee has been established and secretaries nominated, the Board member selection process proceeds as follows: • An independent search firm creates a list of at least four qualified candidates for each open seat on the Board.
• The list of qualified candidates is then forwarded to the 36-member Board Nominee Review Committee.
• Each member-class sector will select one person to represent the group to conduct a personal interview of selected candidates.
• Based on inputs from the member-class sectors, recommendations are submitted to the Office of the Governor for the State of California.” Source: http://www.caiso.com/282e/282eb6c881c0.pdf

EPRG No. 1125
22
EirGrid (Ireland)
EirGrid is governed by an independent 11-members Board, appoint by Government, and not subject to re-election.. Note: The Group is also compliant with the Revised Code issued by the Government on 15 June 2009. The Group also complies with the corporate governance and other obligations imposed by the Ethics in Public Office Act, 1995 and the Standards in Public Office Act, 2001, as well as, as far as possible, and on a voluntary basis, with the principles of the Combined Code of Corporate Governance (‘the Combined Code’). The Group has implemented as appropriate the relevant principles of the Combined Code with the following exceptions: it is accountable to the Minister for Communications, Energy and Natural Resources; appointments to the Board are a matter for Government and accordingly the Group does not have a Nomination Committee; Board members are appointed by Government and, therefore, are not subject to re-election to the Board; the Group’s policy in relation to the remuneration of the Chief Executive is in accordance with “Arrangements for determining the remuneration of Chief Executives of Commercial State Bodies under the aegis of the Department of Public Enterprise” issued in July 1999; and it is the opinion of the Board that the appointment of a Senior Independent Director would not be appropriate in the context of the membership of the Board. The Directors of the Board and Managers including all staff members are required to disclose any direct or indirect interest which could materially influence them in the performance of their EirGrid functions upon becoming aware of it. Source: http://www.eirgrid.com/media/EirGrid%27s%20Code%20of%20Business%20Conduct%20for%20Directors%20_CER%20Approved%2015%20Mar%202010_.pdf; http://www.eirgrid.com/media/Annual%20Report%202009.pdf
ERCOT (US) ERCOT Board of Directors is a 16-member "hybrid" group that includes: 6 market participants from each of the six electric utility market groups investor-owned utilities (or transmission owners), municipally owned utilities, cooperatives, generators, power marketers and retail electric providers; 3 consumer representatives; 5 independent (unaffiliated) members, the ERCOT CEO; Texas PUCT chair (non-voting). Notes: Two third majority vote is required to take action. “The Technical Advisory Committee (TAC) makes policy recommendations to the board of directors. TAC is assisted by five standing subcommittees, as well as numerous workgroups and task forces. The Board also oversees the affairs of the Texas Regional Entity (Texas RE), the independent division that the Federal Energy Regulatory Commission established in 2006 to serve as the regional entity for the ERCOT region. Under the Board’s oversight, ERCOT’s stakeholder process is responsible for developing policies, procedures, and guidelines for power grid coordination, reliability, and market operations.” “The Board (…) has general overall responsibility for managing the affairs of ERCOT, including approval of the budget and capital spending priorities, approval of revisions to ERCOT protocols and guides, and endorsement of major new transmission recommendations.” Source: http://www.ercot.com/content/news/presentations/2010/ERCOT%20Board%20Orientation.pdf http://www.ercot.com/content/news/presentations/2010/2009%20ERCOT%20Annual%20Report.pdf
IESO (Canada)
IESO is governed by an independent Board whose Chair and Directors are appointed by the Government of Ontario (the Minister of Energy) for a two-year term and may be reappointed for successive terms not exceeding five years. All of the Board members must be independent and are prohibited from having a material interest in any market participant in Ontario's electricity sector. Note: Its fees and licences to operate are set by the Ontario Energy Board and it operates independently of all other participants in the electricity market. The board oversees the management of the organization's business and affairs; approves the market rules, policies and guidelines that govern the IESO-administered markets; has full statute-based authority for establishing, monitoring and enforcing reliability standards in the province. Source: http://www.ieso.ca/imoweb/siteShared/whoweare.asp
ISO-NE (US) ISO-NE Board of Directors is 10-member independent group with expertise in financial markets, law, and electric power operations and regulation. Members have no financial interest in any company doing business in New England's electricity markets. Source: http://www.iso-ne.com/aboutiso/corp_gov/charters/nom_and_gov_charter.pdf

EPRG No. 1125
23
MISO (US) MISO Board of Directors is an independent member group that includes seven members, plus the President and Chief Executive Officer (“CEO”). Each member serves a rolling, three-year term, and must meet specific qualifications designed to ensure an independent and qualified Board. “The CEO is a permanent member of the Board, who may vote on any matter presented at a Board meeting except when the CEO’s vote would create a tied Board vote. In that circumstance, the CEO shall be barred from voting. The CEO is a non-voting, ex officio member of all standing committees of the Midwest ISO Board.” Four of the directors shall have expertise and experience in corporate leadership at the senior management or board of directors level, or in the professional disciplines of finance, accounting, engineering, or utility laws and regulation. Of the other three Directors, one shall have expertise and experience in the operation of electric transmission systems, one shall have expertise and experience in the planning of electric transmission systems, and one shall have expertise and experience in commercial markets and trading, and associated risk management. “The Board of Directors is responsible for nominating Directors, who will be elected by the Members (…) Directors are not and have not been at any time within two years prior to their election to the Board either a director, officer or employee of a member, user or an affiliate of a member or user. (…) have no material business relationship or other affiliation with any member, user or an affiliate of a member or user while serving on the Board. [and are] prevent[ed] from having a direct financial interest in or a conflict of interest with any member, user or an affiliate of any member or user.” (…) “A Director’s participation in a pension plan of a Member or User, or an affiliate thereof shall not be deemed to be a material business relationship as long as such pension plan is a defined benefit pension plan that does not involve ownership of the securities of the company sponsoring such plan.” Source:https://www.midwestiso.org/Library/Repository/Meeting%20Material/Company/Principles%20of%20Corporate%20Governance.pdf, http://www.midwestmarket.org/publish/Document/318dd6_119ce883271_-7ce00a48324a/Principles%20of%20Corporate%20Governance%20as%20adopted%2006-17-10.pdf?action=download&_property=Attachment
NBSO (CANADA)
NBSO is governed by an independent Board of directors. “46(1)The board of directors shall manage or supervise the management of the SO’s business and affairs. 46(2)The board of directors of the SO shall be composed of not less than 3 and not more than 5 directors appointed by the Lieutenant-Governor in Council, one of whom shall be appointed the chairperson and another who shall be appointed the vice-chairperson. 46(3)A director appointed under subsection (2) (a)shall meet the eligibility criteria prescribed by regulation, (b)shall hold office for a term not exceeding 5 years, and (c) may be reappointed in accordance with the regulations. 46(4) The Lieutenant-Governor in Council or the board of directors may remove a director from office for cause. 46(5) A director ceases to hold office in the circumstances specified in the by-laws. 46(6) Where a vacancy occurs among the members of the board of directors, the Lieutenant-Governor in Council may appoint a person to fill the vacancy for the balance of the term of the member replaced.(…).” Source: http://www.gnb.ca/0062/acts/acts/e-04-6.htm
NYISO (US) NYISO Board of Directors is a 10-member independent group, which includes the NYISO President & CEO and members with backgrounds in the electric power industry, finance, academics, technology, communications, and the law. Its members have no business, financial, operating or other direct relationship to any Market Participant or stakeholder. Source: http://www.nyiso.com/public/about_nyiso/nyisoataglance/board/index.jsp

EPRG No. 1125
24
ONS (Brazil) ONS Board is composed of a General Director and four Directors of recognized competence in their area, elected by the General Assembly, being three members appointed by the Ministers of Mines End energy and two by agents. Note: It is the Board’s responsibility to take whatever action necessary to run ONS, elaborate and propose Grid Procedures, perform all the duties of a technical character set in the Grid Procedures, prepare annual budget, prepare the Management Report and Financial Statements, among other duties. Source: http://www.ons.org.br/institucional/o_que_e_o_ons.aspx
PJM (US) PJM Board of Directors is a 10-members independent group. The members may have no personal affiliation or ongoing professional relationship with, or any financial stake in, any PJM market participant. Note: PJM Board are responsible “for maintaining PJM's independence and for ensuring that PJM maintains the reliability of the power grid and operates a robust, competitive and non-discriminatory electric power market, preventing any market participants from having undue influence over the operation of PJM. To establish PJM's neutrality, Board members must adhere to a code of conduct.” (…) “All communications received by the Board are handled in accordance with the rules relating to “ex parte” communications as outlined in the Code of Conduct. Written communication to members of the PJM Board are reviewed by an appointed staff liaison to the Board to ensure prompt disclosure of any “ex parte” communication in accordance with the Code of Conduct.” Source: http://www.pjm-miso.com/about/board-managers.html
SPP (US) “The Board of Directors shall consist of seven persons. The seven directors shall be independent of any Member; one director shall be the President of SPP. A Director shall not be limited in the number of terms he/she may serve. The President shall be excluded from voting on business related to the office of President or the incumbent of that office. No other Staff member shall be permitted to serve as a director.” (…) “Directors shall not be a director, officer, or employee of, and shall have no direct business relationship, financial interest in, or other affiliation with, a Member or customer of services provided by SPP. (…) “Except for the President, a director shall be elected at the meeting of Members to a three-year term commencing upon election and continuing until his/her duly elected successor takes office. The election process shall be as follows: (a) At least 90 calendar days prior (…) election (…), the Corporate Governance Committee shall commence the process to nominate persons equal in number to the directors to be elected; (b) At least 45 calendar days prior (…), the Corporate Governance Committee shall determine the persons it nominates (…); Source: http://www.spp.org/publications/Current%20Bylaws%20and%20Membership%20Agreement%20Tariff.pdf
Swissgrid (Switzerland)
The majority of the Board members and the Chairman must meet the independence requirements of the Electricity Supply Act (StromVG). Cantonal representatives and independent members sit on Swissgrid’s Board of Directors where, in line with legal requirements, they form the majority. It’s Chairman, Peter Grüschow, is independent from the electricity industry. Source: http://www.swissgrid.ch/knowledge/sgfaq/index.html/de/50120000000KXtSAAW?set_language=en&cl=en
Sources: companies’ websites and annual reports.
EPRG No. 1125
25
companies however (e.g. in CAISO and ERCOT). This seems to be an evolving area, in line with general trends in corporate governance to seek more independent directors. Vertical separation of electricity and gas systems to create either ISOs or ITSOs involves separation costs and inevitably leads to incentive problems which did not previously exist. This is not to say that these are not offset by the benefits of competition which is facilitated by the vertical separation, but simply to highlight the fact that vertical separation creates new entities with their own incentives and costs. Felzien et al. (2003) discusses the additional IT requirements that interacting with ISOs imposes on market participants in terms of bidding strategy tools, short term unit commitment tools and software to help final customers predict their power costs. ISOs and ITSOs can seek to impose costs on other parties in the industry if it reduces their own costs or increases their profits. ITSOs may want to argue for large amounts of new transmission investment to facilitate competition, which will be paid for under regulated transmission tariffs. ISOs may want to improve reliability and create new markets where the costs of which are borne by others, resulting in significant cost inflation in ISOs costs which are only a small percentage of total system costs (Greenfield and Kwoka, 2010). In the case of the ISO it is not clear that market participants have the incentive or ability to regulate it given the diverse nature of its ownership and governance. The ISO remains a complex entity producing a large number of outputs for which it would be difficult to design a comprehensive set of performance metrics which could form the basis of an external evaluation of its performance (see Drom, 2007).
5: The Ideal Model for an Electricity System Operator
In this section we focus on the activities of actual ISOs and ITSOs and how they compare with what might be considered to be a ‘first best’ or ideal missions of ISOs. Rious and Plumel (2006) helpfully outline three key theoretical missions of ISOs. These are the management of congestion and losses which vary at different points around the network; the allocation of network charges among the users; and the ensuring of coordination between neighbouring system operators. The management of congestion usually involves one of two approaches: the introduction of nodal pricing or management through redispatch and a single system marginal price (SMP) (Rious and Plumel, 2006). Nodal or locational marginal prices (LMP) reflect the marginal price of energy at every node. Export constrained nodes (where there is over supply) will have lower LMPs compared to import constrained nodes (where there is over demand). The difference in prices between nodes will reflect the cost of congestion. Energy losses also vary according to distance and degree of congestion and should ideally be incorporated into the LMPs. Re-dispatching involves managing demand and generation to cope with congestion constraints (involving paying demand or generation that is constrained off the system) and spreading the costs among all the market participants. This effectively socialises the congestion costs and provides poor signals to market participants to respond efficiently to transmission constraints. The allocation of network charges for capacity additions can be done in a large variety of ways (Rious and Plumel, 2006). Shallow connection charging involves charging users for the direct costs of connecting them to the network. Deep connection charging involves users being charged according to the full impact of their connection including both direct costs and the indirect costs created by the need to pay to relieve imposed constraints at other nodes. Zonal charging involves shallow connection charging but differentiated use of system costs by sub-areas of connection according to whether the area is generally supply constrained (which would imply an increased connection charge for generation and/or reduced for demand) or demand constrained (which would imply a reduced connection charge for generation and/or increased for demand). Accommodation capacities can be announced for each node which indicate the amount of extra demand or generation connection that

EPRG No. 1125
26
could be accommodated before import or export constraints were reached. Zonal tariffs with published accommodation capacities seem a good way to make best use of the existing network. Coordination with neighbouring system operators can be done in two ways: by standardisation of the management of externalities and the allocation of network charges or by ‘combination’ which is a weaker form of coordination simply allowing the systems to coexist (Rious and Plumel, 2006). Standardisation would seem to be best, if the systems standardise on first best ideal arrangements more generally, but co-ordination can be achieved on a case-by-case basis by other means under the ‘combination’approach.
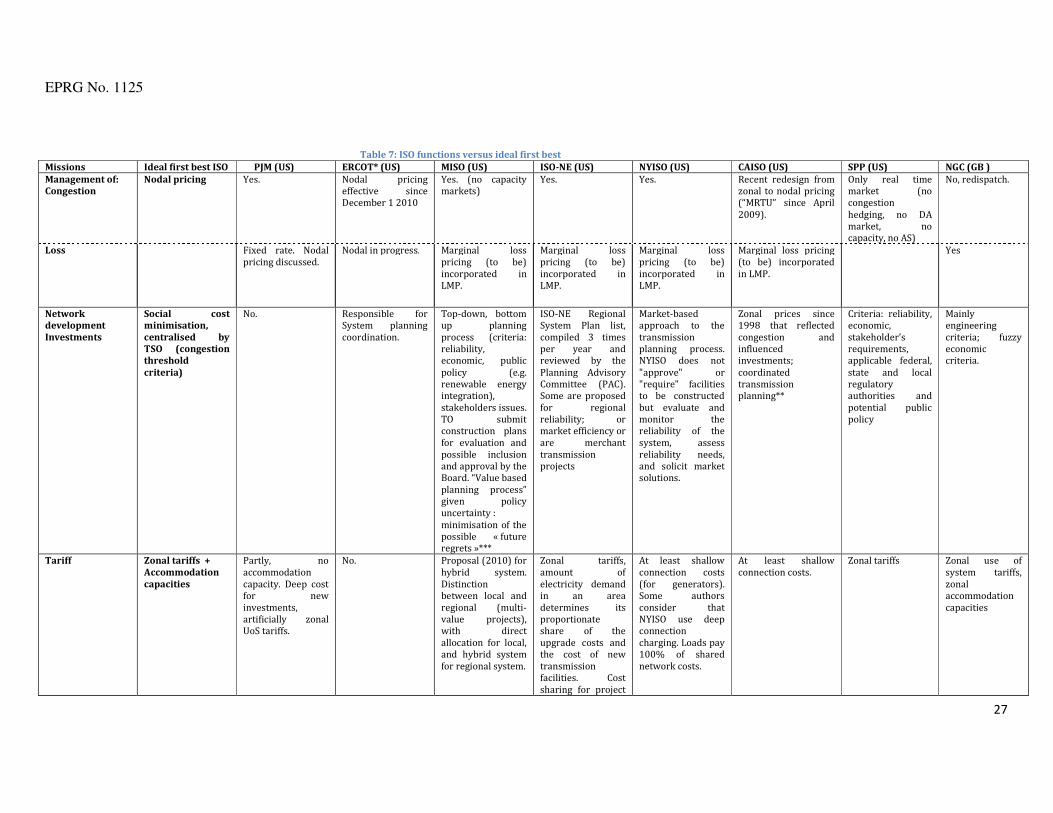
EPRG No. 1125
27
Table 7: ISO functions versus ideal first best
Missions Ideal first best ISO PJM (US) ERCOT* (US) MISO (US) ISO-NE (US) NYISO (US) CAISO (US) SPP (US) NGC (GB )
Management of:
Congestion
Nodal pricing Yes. Nodal pricing effective since December 1 2010
Yes. (no capacity markets)
Yes. Yes. Recent redesign from zonal to nodal pricing (“MRTU” since April 2009).
Only real time market (no congestion hedging, no DA market, no capacity, no AS)
No, redispatch.
Loss Fixed rate. Nodal pricing discussed.
Nodal in progress. Marginal loss pricing (to be) incorporated in LMP.
Marginal loss pricing (to be) incorporated in LMP.
Marginal loss pricing (to be) incorporated in LMP.
Marginal loss pricing (to be) incorporated in LMP.
Yes
Network
development
Investments
Social cost
minimisation,
centralised by
TSO (congestion
threshold
criteria)
No. Responsible for System planning coordination.
Top-down, bottom up planning process (criteria: reliability, economic, public policy (e.g. renewable energy integration), stakeholders issues. TO submit construction plans for evaluation and possible inclusion and approval by the Board. “Value based planning process” given policy uncertainty : minimisation of the possible « future regrets »***
ISO-NE Regional System Plan list, compiled 3 times per year and reviewed by the Planning Advisory Committee (PAC). Some are proposed for regional reliability; or market efficiency or are merchant transmission projects
Market-based approach to the transmission planning process. NYISO does not "approve" or "require" facilities to be constructed but evaluate and monitor the reliability of the system, assess reliability needs, and solicit market solutions.
Zonal prices since 1998 that reflected congestion and influenced investments; coordinated transmission planning**
Criteria: reliability, economic, stakeholder’s requirements, applicable federal, state and local regulatory authorities and potential public policy
Mainly engineering criteria; fuzzy economic criteria.
Tariff Zonal tariffs +
Accommodation
capacities
Partly, no accommodation capacity. Deep cost for new investments, artificially zonal UoS tariffs.
No. Proposal (2010) for hybrid system. Distinction between local and regional (multi-value projects), with direct allocation for local, and hybrid system for regional system.
Zonal tariffs, amount of electricity demand in an area determines its proportionate share of the upgrade costs and the cost of new transmission facilities. Cost sharing for project
At least shallow connection costs (for generators). Some authors consider that NYISO use deep connection charging. Loads pay 100% of shared network costs.
At least shallow connection costs.
Zonal tariffs Zonal use of system tariffs, zonal accommodation capacities
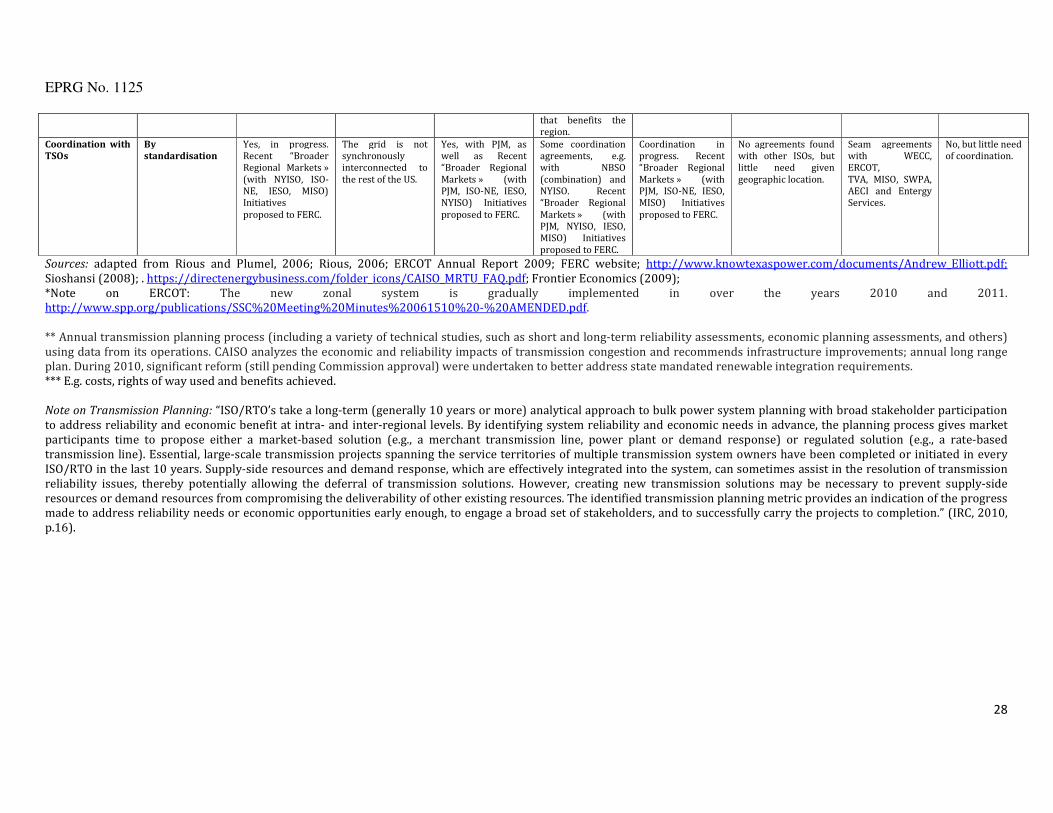
EPRG No. 1125
28
that benefits the region.
Coordination with
TSOs
By
standardisation
Yes, in progress. Recent “Broader Regional Markets » (with NYISO, ISO-NE, IESO, MISO) Initiatives proposed to FERC.
The grid is not synchronously interconnected to the rest of the US.
Yes, with PJM, as well as Recent “Broader Regional Markets » (with PJM, ISO-NE, IESO, NYISO) Initiatives proposed to FERC.
Some coordination agreements, e.g. with NBSO (combination) and NYISO. Recent “Broader Regional Markets » (with PJM, NYISO, IESO, MISO) Initiatives proposed to FERC.
Coordination in progress. Recent “Broader Regional Markets » (with PJM, ISO-NE, IESO, MISO) Initiatives proposed to FERC.
No agreements found with other ISOs, but little need given geographic location.
Seam agreements with WECC, ERCOT, TVA, MISO, SWPA, AECI and Entergy Services.
No, but little need of coordination.
Sources: adapted from Rious and Plumel, 2006; Rious, 2006; ERCOT Annual Report 2009; FERC website; http://www.knowtexaspower.com/documents/Andrew_Elliott.pdf; Sioshansi (2008); . https://directenergybusiness.com/folder_icons/CAISO_MRTU_FAQ.pdf; Frontier Economics (2009); *Note on ERCOT: The new zonal system is gradually implemented in over the years 2010 and 2011. http://www.spp.org/publications/SSC%20Meeting%20Minutes%20061510%20-%20AMENDED.pdf. ** Annual transmission planning process (including a variety of technical studies, such as short and long-term reliability assessments, economic planning assessments, and others) using data from its operations. CAISO analyzes the economic and reliability impacts of transmission congestion and recommends infrastructure improvements; annual long range plan. During 2010, significant reform (still pending Commission approval) were undertaken to better address state mandated renewable integration requirements. *** E.g. costs, rights of way used and benefits achieved. Note on Transmission Planning: “ISO/RTO’s take a long-term (generally 10 years or more) analytical approach to bulk power system planning with broad stakeholder participation to address reliability and economic benefit at intra- and inter-regional levels. By identifying system reliability and economic needs in advance, the planning process gives market participants time to propose either a market-based solution (e.g., a merchant transmission line, power plant or demand response) or regulated solution (e.g., a rate-based transmission line). Essential, large-scale transmission projects spanning the service territories of multiple transmission system owners have been completed or initiated in every ISO/RTO in the last 10 years. Supply-side resources and demand response, which are effectively integrated into the system, can sometimes assist in the resolution of transmission reliability issues, thereby potentially allowing the deferral of transmission solutions. However, creating new transmission solutions may be necessary to prevent supply-side resources or demand resources from compromising the deliverability of other existing resources. The identified transmission planning metric provides an indication of the progress made to address reliability needs or economic opportunities early enough, to engage a broad set of stakeholders, and to successfully carry the projects to completion.” (IRC, 2010, p.16).

EPRG No. 1125
29
Table 7 attempts a comparison of approaches between US ISOs and NGC (an ITSO). The table also examines the basis for new investment in transmission. This should occur when there are positive social benefits to the system as a whole from an individual new investment. This should involve a positive relationship between the costs of congestion at individual nodes with increased investment at those nodes to relieve the congestion costs. Table 7 shows that none of the systems are first best in all respects: NGC does well on tariffs for the allocation of network charges, but not on the management of congestion. An essential trade-off seems to be the fact that ISOs have a good record on short-term management of the network (with respect to congestion and losses) but are rather weaker on incentives for optimal long term investments. This is particularly true where there is dispersed ownership of transmission assets among companies regulated by different geographical regulators as in the US. The problem then is that individual regulators have little incentive to coordinate investments which optimise the ISO area social welfare but actually reduce the welfare of their citizens. Such problems might not exist if the ISO arrangements were transplanted to Great Britain (as they have been in Scotland) where a national regulator exists. A key issue is that most transmission investment cannot be left to short run congestion related signals. Allowing nodal price differentials to set congestion related transmission prices would only recover around 25% of the costs of the network, the rest has be levied from regulated transmission charges (Perez-Arriaga et al., 1995). Vogelsang (2001) demonstrated that a combination of nodal pricing with an independent transmission company (the ITSO model) was likely to lead to more optimal investment than an ISO with vertically integrated transmission owners. This basic result does pose challenges, however we will point out later that there may still be substantial investment (and possibly close to optimal investment) that is possible on the back of appropriate private contracts for transmission. This is in a situation where the current arrangements may lead to sub-optimal levels of investment or overly-costly individual investments undertaken by incumbents. There is little question that the separation of system operation from transmission operation creates interface issues which require careful management. These are discussed in Lieb-Doczy et al. (2008, p.139-40). They suggest a number of different issues:
1. Mismatched incentives. For example, the ISO has incentives to maximise flows, whereas the
transmission operators want to reduce the maintenance costs of their networks.
2. Efficient information transfer. There needs to a large amount of operational status information
flowing between the ISO and the transmission operators.
3. Coordination of planning, maintenance and expansion of the network. There is a need for
coordination and a potential for wasteful duplication of effort between the separate entities.
4. Effectiveness of emergency procedures. In the event of a system emergency there needs to be
clear allocation of roles, authority and communications.
5. Costly dispute resolution procedures. The creation of separate SO and TO entities gives rise to
the potential for costly disputes between them which will require efficient dispute resolution
procedures.
6. Financial liabilities and risk allocation issues. The creation of separate contracting entities
requires payment systems and risk management to be put in place to facilitate trading between
the two parties.
The creation of an ISO in Scotland (integrated with that in England and Wales) created its own problems (according to Lieb-Doczy et al., 2008, p.140):

EPRG No. 1125
30
7. Different classification of transmission voltages between England and Wales on one side and
Scotland on the other created problems for the ISO in defining what assets it had operational
control over.
8. Different price control settlements in Scotland and England lead to difficulties in creating
uniform transmission arrangements.
All the above problems are solvable in theory with appropriate incentives on both the ISOs and the TOs. However in practice it is challenging to calibrate sophisticated high-powered incentives which need to be rather precisely set to avoid perverse incentives being set up. These sorts of problems have led some commentators such as Joskow (1999, 2005, 2007) to suggest that ITSOs are better than ISOs. Joskow (1999) points out that ISOs do achieve horizontal integration of control areas, which might not be possible for ITSOs, noting however that PJM was not allowed to integrate with NYISO for political reasons. Joskow notes that PJM, as with other ISOs have a problem in economically expanding the network, which is not faced by ITSOs like NGC. This is because they don’t undertake the investment themselves. He also notes that merchant transmission – non-regulated for-profit investments which seek to exploit nodal price differentials -are very attractive in some places, but the experience is poor within meshed electricity networks. Joskow (2004) makes the further point that ISOs with multiple TOs requires a good understanding of how the transmission system ‘actually works’. This is because in order for an ISO to correctly price transmission and regulate transmission operators it needs to understand what efficient decentralised control of transmission assets actually looks like. ITSOs pose much less of a requirement on system operators to understand the role of individual network components. Michaels (2008) comments that in the US gas industry, interstate gas companies, which are a form of ITSOs (albeit competing), were central to the success of the development of competition in the industry. Competing ITSOs gets round the particular problem of how to monitor competition within an ISO area. Michaels (2008) suggests that the market monitoring function of ISOs in the US – often required by ISO members, including generators – is a poor substitute for regulation of competition that would be more appropriately undertaken by the Federal regulator (FERC). The problem he identifies is one of governance where ISO stakeholders may have pre-emptively agreed to be monitored by their ISO rather than risk FERC undertaking market monitoring itself.
6: Prices and payment allocation for system operation
It is important to understand how the services of energy system operators are paid for and what the charging structure for their services is. This varies by jurisdiction. In the UK there is a useful distinction between the external costs of the system operator function and the internal costs. External costs refer to the charges levied by the system operator for the services that they facilitate but which might actually provided by other market participants, e.g. ancillary services. Here the system operator oversees payments between third parties. In the US, where ISOs actually run many energy markets, these payments reflect many of the wholesale energy market transactions. Internal costs refer to the direct costs of the system operator, e.g. its own O+M costs. These costs are a small fraction of the external costs. In the UK all costs of transmission and system operation are shared 27% by generators and 73% by suppliers, but charges reflect connection charges, transmission use of system charges and balancing use of system charges (see Pollitt and Bialek, 2008) together these recover the direct costs of transmission and system operation, as well as the external costs of balancing and ancillary services. Similar arrangements exist for natural gas. ITSO total revenue is subject to a revenue cap with some additional incentives, which is set by the energy regulator Ofgem.
EPRG No. 1125
31
In the US ISOs recover their internal costs through a grid management charge which is approved by FERC. ISO internal and external costs are usually paid by loads (suppliers)22. Details of the charging arrangements at various ISOs are given in Table 8. This indicates how grid management charges are recovered. Interestingly this is sometimes by a simple per MWh charge, which can then transparently appear on a final customer’s bill (e.g. NYISO), or it is via a much more sophisticated schedule of fees for the different services of the ISO (e.g. CAISO). It is worth setting the cost of ISOs in context. Grid management charges are not particularly large in relation to the size of the energy market, but they are absolutely large as discussed in Section 3. The pricing literature around ISOs has focussed significant attention on the setting of transmission tariffs which are administered by the ISOs, in particular Financial Transmission Rights (FTRs) markets. These are the markets where market participants can hedge their exposure to potentially volatile real-time nodal prices via periodic (e.g. six monthly) auctions. They also offer the prospect of providing efficient long-run price signals for investment around the transmission network if the markets function efficiently. FTRs are the way that market participants actually manage nodal pricing and hence it is important to understand whether these markets can actually work in theory and whether they do work in practice to efficiently price the locational and real time elements of transmission charges (see Sun, 2005). If they do not actually allow efficient hedging of risk, then administered time and location varying prices for transmission may be the best practical option. An additional problem is that particular transmission rights (between two nodes on the network) may only have a small number of bidders and be prone to market abuse, which requires monitoring by the ISO. Key issues in efficient pricing identified in the literature include:
1. The lumpiness of transmission investments which means that FTRs for extra capacity would
not finance the initial investment (Rious et al., 2008). This could be overcome by transmission
tariffs which are charged on the basis of average participation (i.e. come down as more users
use the line and also spreads total system costs).23
2. The interlinking of nodal prices means that prices for FTRs between two nodes may not
accurately signal the value of new investment, because extra investment might create external
costs elsewhere in the network (Kristiansen and Rosellon, 2010, who discuss this in the
context of the Belgium-France-Netherlands market). Thus FTRs have to incorporate
adjustments for external costs.24
3. The combination of incentive regulation of the core transmission network and FTRs. This
provides signals for investment in transmission constraints while ensuring that costs of the
transmission system are fully recovered (Rosellon, 2003, and Hogan et al., 2010). FTRs can be
used to finance some new transmission investment.
4. The initial allocation of transmission rights may be important. For instance, Sauma and Oren
(2009) show that if FTRs are initially allocated to generators in exporting regions this leads to
a more efficient allocation than would otherwise occur.
22 Details of the allocation of transmission charges between generators and loads in various jurisdictions can be found in PJM (2010, p.31). 23 According to Rious et al., 2008, p. 4-5, ‘the average participation tariff allocates the cost of the network depending on the total use of the network by each generator. To calculate the network used by each generator, the power flows are traced from the generator to load to identify the lines and the share of their capacity used by each generator to supply load.’ 24 According to Kristiansen and Rosellon (2010, p.1) this can be dealt with by the ISO reserving a quantity of proxy FTRs to be allocated to deal with negative externalities arising from an expansion project. Thus investors in an expansion project may not receive 100% of the FTRs associated with the new line (so that they are forced to internalise any externalities created) and have to decide whether to go ahead on this basis.
EPRG No. 1125
32
5. There may be systematic inefficiency in FTR pricing even under perfect foresight. Deng et al.
(2010) demonstrate that average congestion rents may not converge to the correct level. The
problem is that the optimisation algorithm may not solve correctly and the auction prices
emerging from the price discovery process cannot be relied on to converge to the correct

EPRG No. 1125
33
Table 8: How are ISO services paid for?
ISO Description of system Source
AEMO (Australia)
AEMO fees are regulated market fees that are charged by AEMO to operate and administer the National Electricity Market (NEM). Charges for Renewable Energy Certificates (RECs) cover the retailer’s costs in purchasing mandatory RECs. Both AEMO fees and REC charges are paid by the retailers. AEMO fees are passed on to customers at cost; REC charges can be negotiated with your retailer.
http://www.power.tas.gov.au/domino/power.nsf/v-lu-factsheets/Understanding+the+Charges+on+your+Electricity+Bill/$file/Fact-sheet-11-Understanding-the-charges-on-your-Electricity-Bill.pdf
AESO (Canada)
The regulator determines the allocations of transmission system costs, and most are charged to distribution utilities and industrial customers, based on their use of system. Transmission facilities are owned by TFO (transmission facility owners), and TFO costs + planning and operating are recovered through transmission charges paid by electricity consumers. Generators’ pay for transmission system losses. Utilities and industrial customers pay for transmission system costs. Consumers pay for assets, planning and operating (transmission charge). Generators pay for system losses. “The AESO recovers the costs of operating the real-time energy market through an energy market trading charge on all megawatt hours traded. The energy market trading charge is set to recover the operating costs and the amortization of intangible and capital assets and the AUC administrative fee during the period. For 2009, the AESO’s component of the energy market trading charge is 23.2 cents per MWh to cover operating, intangible and capital costs (13.1 cents per MWh) and the AUC administrative fee (10.1 cents per MWh). For 2008, the AESO’s component of the energy market trading charge was 11.1 cents per MWh. There is also a component in the energy market trading charge that relates to the operations of the Market Surveillance Administrator (MSA), which is independent of AESO operations.”
http://www.aeso.ca/downloads/AESO_Final_LR.pdf, http://www.aeso.ca/downloads/AESO_2009_AR_For_Web.pdf
CAISO (US)
CAISO is funded through rates it charges users of the California transmission grid and CAISO services, via its Grid Management Charge (GMC). The GMC imposes different rates for various services. Currently, a revision of the GMC is being discussed, following a cost of service study, due to the redesign of the wholesale market, MRTU with the launch of the nodal market in 2009 and the implementation of convergence bidding, and the recent move toward charging uses based on their actual consumption of given products and services. “The ISO's existing GMC contains seven GMC components and 15 separate charge codes. It has been largely unchanged since 2004 and was based on a FERC-approved settlement agreement with stakeholders”
http://www.platts.com/RSSFeedDetailedNews/RSSFeed/ElectricPower/6512357; http://www.caiso.com/docs/2002/08/02/2002080216283419989.html
IESO (US)
Its fees are paid through the IESO Administration Service Charge, currently set at $0.822/MWh and approved by the Ontario Energy Board. This charge is just one component of the Wholesale Market Service Charge found on consumer bills.
http://www.isorto.org/atf/cf/%7B5B4E85C6-7EAC-40A0-8DC3-

EPRG No. 1125
34
003829518EBD%7D/IESO%20Fast%20Facts.pdf
EirGrid (Ireland)
Most of EirGrid revenue comes from regulated tariffs based on use of the transmission system. Group’s revenue (SEMO, single market operator, the joint venture between Eigrid and SONI) is primarily derived from regulated tariffs, specifically the Transmission Use of System (TUoS) tariff, a charge payable by all users of the transmission systems and its share of tariffs as Market Operator for SEM.
http://www.eirgrid.com/media/Annual%20Report%202009.pdf
ERCOT (US) Rolled into costs that all ratepayers pay, « Postage-stamp » transmission rate (same for everybody). Relative to electric bills, transmission and distribution represent around 17%; and ERCOT fee + nodal surcharge + NERC fee represents around 1%. ERCOT fee represents 98% of ERCOT’s total base operating revenue requirement. Nodal surcharge is an additional revenue collected by ERCOT to recover costs to implement a nodal market as mandated by the PUC. The fee is assessed on wholesale energy transactions and becomes part of the overall cost of electricity. The fee does not appear on residential customer bills; however, if it were passed directly through to the end-use customer, it would average about 42 cents per month, or $5 per year, based on 1,000 kilowatt-hour usage per month. ERCOT is changing the way that it manages how power is bought and sold in the wholesale electricity market to make it more efficient and transparent. These improvements, called the nodal wholesale market redesign, are also funded by an ERCOT fee and account for nearly half of the annual fee costing residential electric consumers approximately 38 cents per month, or $4.80 annually.
http://www.ercot.com/content/news/presentations/2010/ERCOT%20Board%20Orientation.pdf, p.50
ISO-NE (US) ISO-NE tariffs is made up of 2 tariffs: 1. Open Access Transmission Tariff (OATT) and 2.ISO Self Funding Tariff (ISO SFT). OATT recovers the expenses incurred for ancillary services and the use of the PTF (Pool Transmission Facility) and ISO SFT recovers the expenses of the ISO. - Scheduling, System Control, and Dispatch Service: Customers who are charged for RNS & Customers who receive TOUT (Through or Out) -Administration and management of the Energy Market: Customers participating in the Energy Markets -Administer and manage the Reliability Markets: both market and non-market participants
http://www.iso-ne.com/support/training/courses/wem101/oatt_and_iso_self-funding.pdf http://www.iso-ne.com/regulatory/tariff/sect_4/sect_iva.pdf
MISO (US) Actual costs to provide services are recovered pursuant to a FERC accepted tariff: Schedule 10 of the tariff recovers the cost of transmission service and reliability coordination. Schedule 16 recovers the cost of the FTR market. Schedule 17 recovers the cost of the day-ahead and real-time energy markets.
http://www.isorto.org/atf/cf/%7B5B4E85C6-7EAC-40A0-8DC3-003829518EBD%7D/CorporateFactSheet101110.pdf
NYISO (US) NYISO Cost of Operation is a flat per MW fee to cover the cost of operating the NYISO. http://www.nyiso.com/public/about_nyiso/understanding_the_markets/cost_of_electricity/index.jsp
PJM (US) “PJM recovers its administrative expenses through stated rates applicable to market participants’ transaction volumes, such as megawatt hours of load served, generation sold, and FTRs held. PJM is not authorized to charge its members rates higher than these stated rates without a FERC-approved rate filing. So, the stated rates act has long-term ceilings. (…) if PJM’s actual costs are less than the revenues resulting from the application of the stated rates, then PJM refunds the difference to
http://www.isorto.org/atf/cf/%7B5B4E85C6-7EAC-40A0-8DC3-003829518EBD%7D/2010
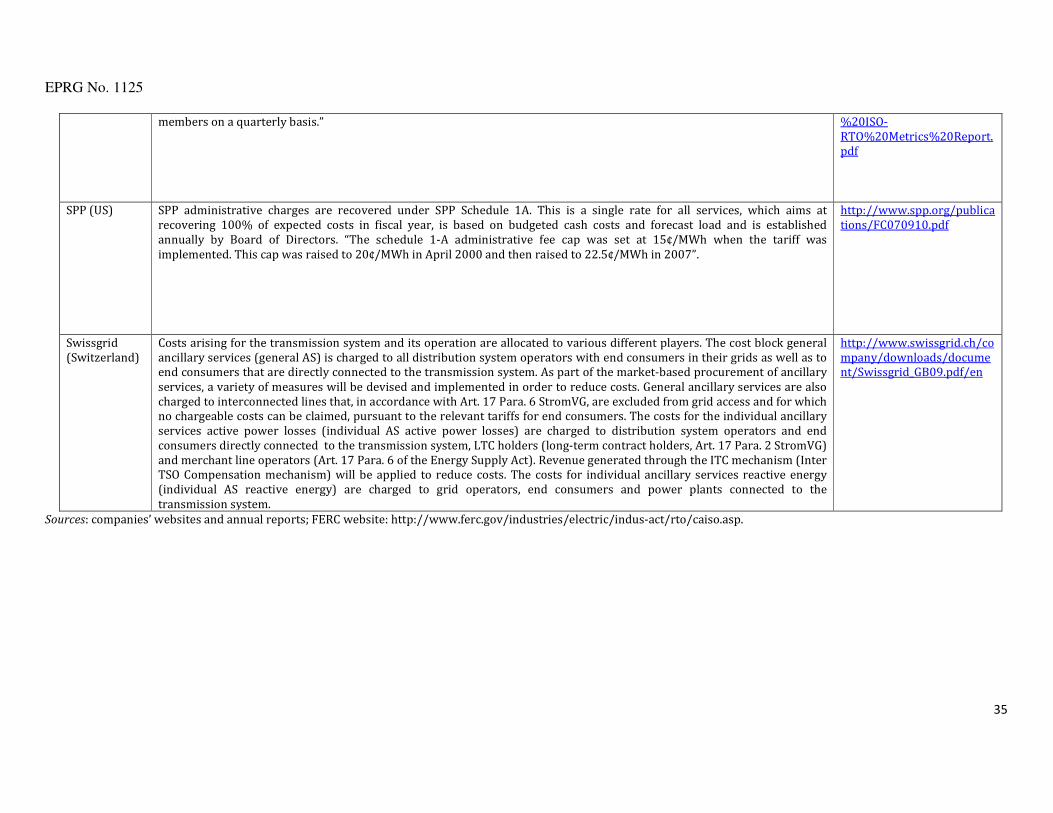
EPRG No. 1125
35
members on a quarterly basis.” %20ISO-RTO%20Metrics%20Report.pdf
SPP (US) SPP administrative charges are recovered under SPP Schedule 1A. This is a single rate for all services, which aims at recovering 100% of expected costs in fiscal year, is based on budgeted cash costs and forecast load and is established annually by Board of Directors. “The schedule 1-A administrative fee cap was set at 15¢/MWh when the tariff was implemented. This cap was raised to 20¢/MWh in April 2000 and then raised to 22.5¢/MWh in 2007”.
http://www.spp.org/publications/FC070910.pdf
Swissgrid (Switzerland)
Costs arising for the transmission system and its operation are allocated to various different players. The cost block general ancillary services (general AS) is charged to all distribution system operators with end consumers in their grids as well as to end consumers that are directly connected to the transmission system. As part of the market-based procurement of ancillary services, a variety of measures will be devised and implemented in order to reduce costs. General ancillary services are also charged to interconnected lines that, in accordance with Art. 17 Para. 6 StromVG, are excluded from grid access and for which no chargeable costs can be claimed, pursuant to the relevant tariffs for end consumers. The costs for the individual ancillary services active power losses (individual AS active power losses) are charged to distribution system operators and end consumers directly connected to the transmission system, LTC holders (long-term contract holders, Art. 17 Para. 2 StromVG) and merchant line operators (Art. 17 Para. 6 of the Energy Supply Act). Revenue generated through the ITC mechanism (Inter TSO Compensation mechanism) will be applied to reduce costs. The costs for individual ancillary services reactive energy (individual AS reactive energy) are charged to grid operators, end consumers and power plants connected to the transmission system.
http://www.swissgrid.ch/company/downloads/document/Swissgrid_GB09.pdf/en
Sources: companies’ websites and annual reports; FERC website: http://www.ferc.gov/industries/electric/indus-act/rto/caiso.asp.

EPRG No 1125
36
6. values. They suggest that this implies a need to administratively allocate rights first and then
allow trading.
Overall the theoretical literature suggests that there are significant problems with relying on FTR market prices to drive transmission investment because it is not clear how efficient the auction prices are likely to be. The evidence on the performance of FTR markets is mixed. Zhang examines the NYISO Transmission Congestion Contract (TCC, a form of FTR) market and shows that there was systematic underbidding for transmission rights (i.e. monopsony buying power) in auctions where there were less than two bidders on average. On the other hand Adamson et al. (2010) argued that the NY market was getting more efficient over time, except in the NY City – Long Island sub region where a series of shocks which were difficult to predict in advance meant that contract prices did not converge much towards spot prices. The pricing of electricity transmission is particularly complicated because of the meshed nature of the network and the requirement for instantaneous balancing of supply and demand at every node. The situation in gas markets is much less complicated because gas can be stored and loop flows are not an issue. In the UK there have been successful entry and exit point auctions for access to the transmission network. It is also the case that international electricity transmission links have successfully been financed on a merchant basis, exploiting nodal price differences and FTRs. Parail (2010) examines the extremely successful Norway-Netherlands interconnector. He shows that the investment was very profitable (and less than 20% of the socially optimal capacity) and that competing transmission investments up to 90% of the socially optimal level of interconnection were financeable simply on the basis of the differential in the prices between the two nodes in South Norway and the Netherlands. Thus LMP based pricing with an FTR auction for access to a merchant pipeline (overseen by an ISO) might facilitate much more trade than is currently the case between two water company regions.
7: Evidence on the Evolving Role of ISOs: Towards a Cost-Benefit Analysis
In this section we discuss what the evidence says about the costs and benefits about having an independent system operator in the light of experience. FERC (2004) provides an analysis of the cost of setting up a ‘Day One’ ISO in electricity based on the costs of existing US ISOs. A ‘Day One’ ISO follows the pattern of MISO and includes the following functions: tariff administration and design, congestion management by re-dispatch, parallel path flow management, provision of ancillary services, OASIS, market monitoring, transmission planning, and Interregional Coordination. A ‘Day Two’ ISO might also offer LMPs to manage congestion, and markets for energy day-ahead, energy same day, capacity and ancillary services. FERC points out that there is an upfront cost to setting up the ISO, before the ISO can take responsibility for the management of the system. This cost is the equivalent of around one year’s running cost for the ISO. FERC (2004) also provides an analysis of the headcounts attributable to different functions within some of the US ISOs. FERC (2004) points out that there are additional costs to the system of having an ISO which then have to be justified by the benefits produced by the ISO. FERC (2004) estimates the benefits of improved market integration facilitated by ISOs in the US is of the order $3.8-5.4bn per year. This attributes the benefits of increased generator competition to ISOs, the same of the savings attributable solely to better use of transmission assets and better sharing of reserves might be around $0.8bn per year (by 2010). These would need to be set against the increased costs imposed by ISOs over previous arrangements. In addition FERC (Exhibit 1, p.4) cites qualitative benefits from increased efficiency through elimination of regional transmission pricing and rate pancaking (i.e. total transmission costs being the sum of individual company costs and simply being a function of total distance), improved congestion management, more accurate estimates of available

EPRG No 1125
37
transmission capacity, effective management of parallel path flows, efficient planning for transmission and generation investments, increased coordination among states, reduced transaction costs, facilitation of state deregulation, development of environmentally preferred generation, improved grid reliability and less discrimination. Some of these ‘qualitative’ benefits could of course be quantified. One issue with much of the evidence on ISOs in the US is that it is tangled up with the general evidence on the impact of electricity restructuring. Kwoka (2008) discusses 10 studies of US electricity restructuring, 8 of which show positive results, and is highly critical of much of their analysis. In particular, he is cautious about the role of ISOs and their sharply rising costs, and extent to which the studies (some of which are sponsored by ISOs) attribute the benefits of reforms to the existence of ISOs/RTOs. He quotes APPA (2004, p.17) which cautions FERC to ‘view RTOs for what they are – regional monopolies that it must vigorously regulate, not extensions of the Commission itself’. Nonetheless studies do analyse specific functions of ISOs and identify savings. Douglas (2006) estimates that the regional dispatch of coal fired power plants, by ISOs, has led to average variable cost savings of 1.5-3%. Perekhodtsev and Lave (2006) also suggest that hydro power plants bidding into ancillary services markets in New York has brought benefits, given that NYISO has a highly sophisticated ancillary services market. Efficiencies in ancillary services are a non-trivial, with ancillary services accounting for around 10% of total generation plus transmission costs. ISOs may have a role in spotting market abuse at particular hubs, given their market monitoring function. Barmack et al. (2008) show how difficult this it to do with limited data for Western US. Any market integration produces some winners and losers, even if total welfare rises. The integration of higher price markets with lower priced markets produces aggregate welfare benefits, but the consumers in the lower price markets can expect to face higher prices. Giulietti et al. (2010) find this to be the case with the extension of NGC’s England and Wales electricity system control area to cover the whole of Great Britain (by including Scotland): prices rose in England and Wales, but fell in Scotland. The situation is complicated if the shareholders of the companies that benefit from market integration are foreign because the aggregate welfare benefit by citizens may be negative, even though the total benefit is positive. This is a concern (for national regulators) with interconnectors between low price and high price countries, where the low price country energy producers are foreign owned. We conclude with two short case studies of the California ISO and the recent Offshore Transmission Auctions in the UK. The history of the CAISO has been a turbulent one. California underwent an apparently successful and then subsequently disastrous electricity market reform. A key part of the reform was the creation of CAISO which ran a same day market and a separate California Power Exchange in 1997. When shortages of electricity materialised in 2000 the separation of the California PX and the CAISO same day market led to the collapse of the Power Exchange as generators arbitraged out of the power exchange market and waited to trade in the same day market run by the ISO. It appears that generators may have followed a complex gaming strategy which did not lead to price convergence between the two markets (Borenstein et al., 2001). Eventually the California PX (not CAISO) went bankrupt in March 2001 (have ceased operations in January 2001). O’Donnell (2003) has written a fascinating history of the CAISO. This charts how the ISO coped with the crisis and the characters involved. He notes the political pressure on the organisation and the mission creep to take on more functions, including the direct purchasing of power in the crisis. A key issue was who the ISO is answerable to and for what? And what was the trade-off between long and short term interests? The ISO did have a key role in market monitoring but this clearly brought it into conflict with state and Federal regulators, with whom it did not always agree and with whom it argued about jurisdiction. However the fascinating thing about the CAISO is that it did survive the crisis (though its governance
EPRG No 1125
38
structure was reformed) and that many of its employees were devoted to the organisation in spite of the external criticism. What emerges from this case is the resilience of an ISO in the face of extreme shocks to the system and the capacity for it to attract dedicated employees who see it as their job to maintain supplies and efficient operation of a disparately owned trading system. The UK has led the world in the development of the ITSO model in electricity and in gas. However that may be changing substantially in electricity. We have noted already how NGC is now an ISO in Scotland. Scottish transmission assets have a regulatory asset value of around 20% of those in England and Wales. However the advent of large numbers of offshore wind parks is necessitating massive new investment in offshore transmission. This is not being undertaken by NGC (or indeed the Scottish transmission companies). Instead it is being undertaken by wind park developers who then must auction their transmission assets to Offshore Transmission Operators (OFTOs) during the Round 1 and Round 2 tenders for offshore transmission (see Ofgem, 2010b). Under the enduring regime which will emerge in the longer term OFTOs would be allowed to bid to build, own, operate and finance new offshore transmission assets. OFTOs then form part of the system operator area of NGC. The value of new OFTO assets could be as high as twice that of the regulatory asset value of NGC’s transmission assets. To complicate matters NGC has been bidding in some of the OFTO tenders, but has not as yet been successful. This raises a clear issue of conflict of interests for NGC as an integrated transmission system operator in GB and suggests that the only long run solution is the creation of a GB wide ISO. The case for this is enhanced by the new provisions for competitive tendering for electricity transmission assets onshore, under certain circumstances, coming out of Ofgem’s RPI-X@20 review (see Ofgem, 2010c). An emerging learning from the OFTO auctions seems to be that individual transmission assets can be financed much more cheaply by financial players – who have won 7 of the 8 auctions for which preferred bidders have been announced (see Pollitt, 2011) - than by incumbent integrated transmission companies. The OFTO process and the evidence from the use of auctions within the transmission sector strongly suggests that the creation of ISOs (rather than ITSOs) may make sense, even in the UK. Finally, we highlight the issue of planning within the system operator function. What role should a system operator have in planning the future of the network and how is this best incentivised and regulated? US ISOs have been accused of being too focussed on short term optimisation of the network and lacking the ability to develop the network in the future. On the other hand ITSOs may have the ability to plan and develop the network but their incentives may be to over engineer the network and propose unnecessary transmission investments to the regulator. In the US, ISOs have been becoming more active in transmission planning and in implementing investment plans (e.g. PJM). Meanwhile in the UK, large transmission investments seem to be required, but NGC has clear incentives to inflate estimates of investment requirements, or to skew them towards the parts of the network where it is responsible for the investment (e.g. onshore transmission in England and Wales). In each case strong regulatory oversight is required to ensure that system operators are able to plan effectively and to be forced to make use of competitive market based investment signals wherever possible. Regulators have always heavily relied on industry analysis in order to come to a view about the future development of networks they regulate. It is interesting to consider the extent to which a not-for-profit ISO with weak financial incentives or, alternatively, a for-profit ITSO with strong but potentially perverse financial incentives (in conjunction with the regulator) is likely to give rise to better investment planning.

EPRG No 1125
39
8: Learning from System Operation in Energy: Lessons for the Water Sector Before drawing some lessons for the water sector from the electricity sector experience it is worth briefly discussing the background situation of the UK water industry. The UK, like many countries, has had a disaggregated water sector with limited trading between water supply areas, even though there are substantial variations in water resources across the country. In England and Wales there are 10 large regional water and sewerage companies and 14 water only companies (in mid-2011). In addition there is an incumbent Scottish company, whose regulator has recently introduced competition in the retailing of water to non-residential customers. Figure 3 shows the company boundaries (in black) and the variation in access to water resources. There is rising concern that climate change will worsen water shortages in drier regions of the country and lead to increasingly divergent marginal costs of water between water supply company areas. One obvious solution would be further consolidation of the ownership of water companies – this has already happened to a significant degree in the UK. However the regulator has resisted this due to the need to maintain the number of comparator companies to improve the accuracy of benchmarking of company performance. Figure 3: Average Incremental Social Cost (AISC) for Water (Source: Ofwat, 2010,
p.10):
EPRG No 1125
40
The key lesson from the energy sector is that there is a basic choice between having an ISO and an ITSO in water, covering two or more existing company areas. An ITSO for water in England and Wales would involve the creation of bulk water transmission system by unbundling the assets of the existing water companies and would probably require new investment. It would also not cover Scotland and the potential for transfers of water between England and Scotland. An ISO could be introduced alongside the existing asset ownership arrangements, and could easily be extended to include Scotland. As we seen in electricity, there have been experiments with a tender process for a for-profit ISO, but the track record on this is poor. If the creation of an ITSO is deemed to be too costly (as has been the case elsewhere); then a not-for-profit ISO is the obvious option for facilitating a multi-area competitive wholesale market. ISOs/ITSOs can run wholesale markets, in addition to their basic role in providing non-discriminatory access to a bulk water grid (or other large scale water assets). There would seem to be merit, as in US electricity ISOs, of allowing water sector ISOs to operate both the physical system and run the associated financial markets. ISOs involve non-trivial setup and running costs and are subject to potentially significant economies of scale. ISOs also impose significant IT related costs on market participants who have to interact with them. This implies that their introduction requires a careful cost benefit analysis. Given that volumes of traded water could initially be small there may be cheaper ways to facilitate trading other than through the costly creation of an ISO, e.g. via simple bilateral trading or pooling arrangements. Indeed ISOs often started as voluntary pools for sharing reserves and were operated out of one of the pool member’s companies. Achieving appropriately independent governance of an ISO or ITSO is difficult. Both ISOs and ITSOs give rise to incentive problems: one having weak financial incentives, the other having financial incentives that may be too strong. A not-for-profit water industry ISO with clear objectives to maximise social welfare from trading, with a genuinely independent board and regulatory oversight of its costs, via a management contract, might be an appropriate set of governance arrangements. Ideal models of system operation in the key mission areas can be formulated. Paralleling electricity these might include the implementation of appropriate area wide scarcity pricing at times of water stress, a set of charges for the use of the system which would provide efficient signals for investment and moves to standardise trading rules with adjacent control areas (should these exist). A particularly important interface might be with Scotland where moves to jointly standardise access terms to the water network might be mutually beneficial. There is a role for price arbitrage via merchant water interconnection between companies, but this alone may not maximise the benefits from trading. There is a case for sharing the costs of transmission and system operation between exporters and importers of water, in order to encourage efficient response to supply and demand by both sides of the market. Modelling may show whether arbitrage alone would finance any new interconnections. System operators should be important players in the planning process. An ISO in the water sector could be an important source of analysis of how the system should be developed over the coming decades. Clearly the regulator might be able to benefit substantially from the creation of new and more independent source of analysis of sector. Finally, there are important issues particular to water, which temper any enthusiasm to simply import models that have worked in energy. Water markets are likely to be substantially smaller and less ‘liquid’ than energy markets. This suggests that simpler pooling or market-making arrangements may be sufficient, rather than the creation of a
EPRG No 1125
41
full ISO. It is also questionable as to whether an ISO is required to cover all of the combined water company areas, rather than simply to manage the cross-border links.25 There are substantial distributional issues in the water industry. Water costs vary substantially across the country, with water surplus areas having lower prices. Integrating company areas and establishing area wide prices (as in energy) will lead to substantial redistributions between regions. Addressing this distributional question will require attention to any rents created in surplus regions and the extent to which traded prices are allowed to influence final customer bills. The benefits of trading may be lower initially than they will become in the long run, as differences in the
availability of water treatment grow between company areas. Thus the net benefits of ISO/ITSO models may be negative now but become positive in the future. However given the option value of having trading arrangements in place ahead of extreme weather events, there may be a case for establishing them earlier rather than later. While an England and Wales or GB wide water system operator may make sense in the long term. It
would be possible and indeed consistent with experience in energy to have an experiment consisting a
two or more companies that were willing to subject themselves to a system operator arrangement. It would make sense for this to involve water scarce and water rich companies with scope for significant trading between them e.g. Severn Trent and Anglia.
25 It would be possible to have cross-border links sitting within a separate transmission entity, rather as is the case with some international energy interconnectors (e.g. the gas interconnector between UK – Belgium, see http://www.interconnector.com/ (Last accessed February 18th 2011)). However where international interconnectors connect integrated energy companies there have been alleged market power problems (see Pollitt, 2008).

EPRG No 1125
42
Web Links of interest
ISO association website, list of publications: http://www.isorto.org/site/c.jhKQIZPBImE/b.2604461/k.6151/Documents_and_Issues.htm FERC legislation about ISO/RTO: http://www.ferc.gov/industries/electric/indus-act/rto/maj-ord.asp AEMO roles and responsibilities: http://apex2009conference.com/images/uploads/s1_p3_australian_energy_market.pdf ISO/RTO report includes more than 50 separate metrics providing information on electric system reliability, wholesale electricity market benefits and the organizational effectiveness of the six ISOs/RTOs: http://www.isorto.org/atf/cf/%7B5B4E85C6-7EAC-40A0-8DC3-003829518EBD%7D/2010%20ISO-RTO%20Metrics%20Report.pdf
References
ISO websites:
Alberta Electric System Operator (AESO): http://www.aeso.ca/ Argentina System Operator (CAMMESA): www.cammesa.com/ Australian Energy Market Operator (AEMO): http://www.aemo.com.au/index.html Brazil System Operator (ONS): http://www.ons.org.br/institucional/modelo_setorial.aspx?lang=en California Independent Transmission System Operator (CAISO): http://www.caiso.com/ Electric Reliability Council of Texas (ERCOT): http://www.ercot.com/ Independent Electricity System Operator (IESO): http://www.ieso.ca/ Ireland System Operator (EirGrid): http://www.eirgrid.com/ National Grid Plc (NG): http://www.nationalgrid.com/ New Brunswick System Operator (NBSO): http://www.nbso.ca/public/ New England Independent Transmission System Operator (ISO-NE): http://www.iso-ne.com/ New York Independent System Operator (NYISO): http://www.nyiso.com/public/index.jsp Independent System Operator in Bosnia and Herzegovina (NOSBIH): http://www.nosbih.ba/ Midwest Independent Transmission System Operator (MISO): http://www.midwestmarket.org/page/MisoPortalHome PJM interconnection (PJM): http://www.pjm.com/ Southwest Power Pool (SPP): http://www.spp.org/ SwissGrid: https://www.swissgrid.ch/swissgrid/de/home.html
EPRG No 1125
43
Bibliography:
Abdala, M. A. (2008). "Governance of competitive transmission investment in weak institutional systems." Energy Economics 30(4): 1306-1320. Adamson, S., T. Noe, et al. (2010). "Efficiency of financial transmission rights markets in centrally coordinated periodic auctions." Energy Economics 32(4): 771-778. APPA (2004). Restructuring at the crossroads, American Public Power Association: Washington, D.C. Bialek, J, (2004), Recent blackouts in US and continental Europe: Is liberalization to blame?, Working Paper CMI EP 34 Department of Applied Economics, University of Cambridge. Balmert, D. and G. Brunekreeft (2008). Independent System Operators - The Investment Issue. Proceedings of the First Annual CRNI Conference, Brussels, 28 November 2008, Brussels, Belgium, CRNI Barker, J., B. Tenenbaum, et al. (1997). Governance and Regulation of Power Pools and System Operators: An International Comparison. World Bank Technical Paper 382. Washington, DC, Wolrd Bank. Barmack, M., E. Kahn, et al. (2008). "Econometric models of power prices: An approach to market monitoring in the Western US." Utilities Policy 16(4): 307-320. Borenstein, S., J. Bushnell, et al. (2001). Trading Inefficiencies in California's Electricity Markets. NBER Working Paper Series. Cambridge, MA, National Bureau of Economic Research. Boyce, J. R. and A. Hollis (2005). "Governance of electricity transmission systems." Energy Economics 27(2): 237-255. Capgemini (2009). European Energy Markets Observatory. 2008 and Winter 2008/2009 Dataset. Eleventh Edition, November 2009. Available at: http://www.capgemini.com/eemo-23kd23-f48sss-l029bz/, last accessed 1st February 2010. DECC (2010). Energy statistics: Electricity (2010). Available at: http://www.decc.gov.uk/en/content/cms/statistics/source/electricity/electricity.aspx, last accessed 27 January 2011. Deng, S.-J., S. Oren, et al. (2010). "The inherent inefficiency of simultaneously feasible financial transmission rights auctions." Energy Economics 32(4): 779-785. Douglas, S. (2006). "Measuring Gains from Regional Dispatch: Coal-Fired Power Plant Utilization and Market Reforms." Energy Journal 27(1): 119-138. Drom, R. A. (2007). "New Metrics for Measuring the Success of a Non-Profit RTO." Energy Law Journal 28: 603-630. ERCOT (2009). Ercot Annual Report 2009. Available at: http://www.ercot.com/content/news/presentations/2010/2009%20ERCOT%20Annual%20Report.pdf, last accessed Friday 21 January 2011.

EPRG No 1125
44
Felzien, D., B. Fesmire, et al. (2003). "IT Requirements for Market Participant Interaction With ISOs/RTOs." IEEE Transactions on Power Systems 18(2): 517-519. FERC (2004). Staff Report on Cost Ranges for the Development and Operation of a Day One Regional Transmission Organization Docket No. PL04-16-000, FERC: Washington, D.C., available at: http://www.ferc.gov/EventCalendar/Files/20041006145934-rto-cost-report.pdf, last accessed 29 January 2011. FERC (2010). FERC Form 1 submissions, available at http://elibrary.ferc.gov/idmws/search/results.asp, last accessed 24 January 2011. Frontier Economics (2009). International transmission pricing review. A report prepared for the New Zealand Electricity Comission. July 2009. Giulietti, M., L. Grossi, et al. (2010). "Price transmission in the UK electricity market: Was NETA beneficial?" Energy Economics 32(5): 1165-1174. Government of Alberta (2011). Government of Alberta Electricity Statistics. Available at: http://www.energy.alberta.ca/Electricity/682.asp, last accessed 27 January 2011. Greenfield, D. and J. Kwoka (2010). The Cost Structure of Regional Transmission Organizations. Paper presented at the US Energy Policy in Transition Conference, Gainesville, FL., Northeastern University. Güler, T., G. Gross, et al. (2007). "Quantification of Market Performance as a Function of System Security." IEEE Transactions on Power Systems 22(4): 1602-1611.
Hirst, E. and Kirby, B. (1996), Ancillary Services, American Power Conference, Chicago, Illinois, February. Available at: http://www.ornl.gov/sci/engineering_science_technology/cooling_heating_power/Restructuring/Ancillary_Services.pdf, last accessed 28 January 2011.
Hogan, W. W., C. Cullen Hitt, et al. (1996). Governance Structures for an Independent System Operator (ISO). Harvard Electricity Policy Group Background Paper. Cambridge, MA, Center for Business and Government, Harvard University. Hogan, W. W., J. Rosellon, et al. (2010). Toward a Combined Marchant-Regulatory Mechanism for Electricity Transmission Expansion. DIW Berlin, Discussion Papers. Berlin, Germany, Deutsches Institut für Wirtschaftsforschung. IRC (2010a). 2010 ISO/RTO Metrics Report. IRC: US. Available at: http://www.isorto.org/atf/cf/%7B5B4E85C6-7EAC-40A0-8DC3-003829518EBD%7D/2010%20ISO-RTO%20Metrics%20Report.pdf, last accessed 27 January 2011. IRC (2010b). Various ISO/RTO Council documents. Available at http://www.isorto.org/site/c.jhKQIZPBImE/b.2603295/k.BEAD/Home.htm, last accessed 27 January 2011. Isemonger, A. G. (2009). "The evolving design of RTO ancillary service markets." Energy Policy 37(1): 150-157.
EPRG No 1125
45
Joskow, P. L. (1999). Comments in Response to FERC Rulemaking on Regional Transmission Organizations. Regulatory Analysis 99-4, regulation2point0.org. US, AEI-Brookings Joint Center for Regulatory Studies. Joskow, P. L. (2004). Transmission Policy in the United States. MIT Center for Energy and Environmental Policy Research Working Papers. Cambridge, MA, MIT, Center for Energy and Environmental Policy Research. Joskow, P. L. (2005). Patterns of Transmission Investment. MIT Center for Energy and Environmental Policy Research Working Papers. Cambridge, MA, Massachusetts Institute of Technology, Center for Energy and Environmental Policy Research. Joskow, P. L. (2007). Strengths and weaknesses of Independent System Operators without ownership unbundling. Presentation to EPRG-CEEPR London Conference, 28 September 2007, available at http://www.eprg.group.cam.ac.uk/wp-content/uploads/2008/12/agenda_070618.pdf. 3rd Joint Cambridge-MIT Electricity Policy Conference London, Electricity Policy Research Group-Centre for Energy and Environmental Policy Research. Kristiansen, T. and J. Rosellon (2010). Merchant Electricity Transmission Expansion: A European Case Study. DIW Berlin Discussion Paper. Berlin, Germany, Deutsches Institut für Wirtschaftsforschung. Kwoka, J. (2008). "Restructuring the U.S. Electric Power Sector: A Review of Recent Studies." Review of Industrial Organization 32(3): 165-196. Lieb-Doczy, E., I. McKenzie, et al. (2008). "Unbundling ownership and control: international experience of independent system operators." International Journal of Global Energy Issues 29(1/2): 133-141. Lin, Y., G. Jordan, et al. (2006). "Economic Analysis of Establishing Regional Transmission Organization and Standard market Design in the Southeast." IEEE Transactions on Power Systems 21(4): 1520-1527. Michaels, R. (2008). "Electricity Market Monitoring and the Economics of Regulation." Review of Industrial Organization 32(3/4): 197-216. O'Donnell, A. (2003). Soul of the Grid: A cultural biography of the California Independent System Operator. Lincoln, US, iUniverse. O’Neill, R., U.Helman, B.F.Hobbs and R.Baldick (2006). ‘Independent System Operators in the USA: History, Lessons Learned, and Prospects’, in F.P.Sioshansi and W.Pfaffenberger (eds.). Electricity Market Reform: An International Perspective, Oxford: Elsevier. Ofgem (2006a). Transmission Price Control Review: Final Proposals, Ref.206/06, London: Ofgem. Ofgem (2006b). National Grid Electricity Transmission and National Grid Gas System Operator Incentives from 1 April 2007, London: Ofgem. Ofgem (2010a). Transmission Annual Report for 2008-09. Annual Report, Ref: 48/10. Ofgem: London, UK.

EPRG No 1125
46
Ofgem (2010b). Offshore Transmission Connecting a Greener Future OFTO Round 2 Launch Event,
Available at: http://www.ofgem.gov.uk/Networks/offtrans/edc/Documents1/OFTO%20Launch%20Day%20Presentation.pdf
Ofgem (2010c). Regulating energy networks for the future: RPI-X@20 Recommendations Consultation, Ref.91/10, London: Ofgem. Ofgem (2010d). National Grid Electricity Transmission System Operator Incentives from 1 April 2010, Ref.33/10, London: Ofgem. Ofwat (2010). A study on potential benefits of upstream markets in the water sector in England and Wales, Birmingham: Ofwat. ONS (2010), ONS website, http://www.statistics.gov.uk/default.asp, last accessed 27 January 2011. Parail, V. (2010), The Economics of Interconnectors, Presentation at EPRG Spring Seminar, May 14th, Available at: http://www.eprg.group.cam.ac.uk/wp-content/uploads/2010/05/Parail.pdf Perekhodtsev, D. and L. Lave (2006). Efficient bidding for hydro power in markets for energy and ancillary services. MIT, Centre for Energy and Environmental Policy Research Working Papers. Cambridge, MA, Massachusetts Institute of Technology. Center for Energy and Environmental Policy Research.
Perez-Arriaga, Ignacio J., et al. "Marginal Pricing of Transmission Services: An Analysis of Cost Recovery." IEEE Transactions on Power Systems, 10, no. 1 (1995): 448-454.
PJM (2010). A Survey of Transmission Cost Allocation: Issues, Methods and Practices, PJM. Available at: http://ftp.pjm.com/~/media/documents/reports/20100310-transmission-allocation-cost-web.ashx, last accessed 18 February, 2011.
Pollitt, M. and Bailek, J. (2008) "Electricity network investment and regulation for a low carbon future." In Grubb, M., Jamasb, T. and Pollitt, M.G. (eds.): Delivering a low carbon electricity system. Cambridge: Cambridge University Press, pp.183-206.
Pollitt, M.(2008). ‘The arguments for and against ownership unbundling of energy networks’, Energy Policy 36(2):704-713.
Pollitt, M. (2011). Developing a Cost Effective Framework for Offshore Grids, Presentation to CIGRE, Imperial College, available at: http://www.eprg.group.cam.ac.uk/wp-content/uploads/OffshoreTransmission.pdf.
Puga, J. N. and J. A. Lesser (2009). "Public Policy and Private Interests: Why Transmission Planning and Cost-Allocation Methods Continue to Stifle Renewable Energy Policy Goals." The Electricity Journal 22(10): 7-19. Rious, V. (2006). An operational and institutional modular analysis of Transmission and System Operator. Author manuscript, Published in 5th Conference on Applied Infrastructure Research, Berlin, Germany, 2006, Paris, France, HAL - CCSD. Rious, V., P. Dessante, et al. (2008). The efficiency of short run and long run signals to coordinate generation location with lumpy transmission investments. Author manuscript, Published in "31st
EPRG No 1125
47
IAEE International Conference, Bridging Energy Supply and Demand: Logistics, Competition and Environment", Istanbul, Turkey. Rious, V. and S. Plumel (2006). An operational and institutional modular analysis framework of Transmission and System Operator Why Transmission and System Operators are not ideal ones. Author manuscript, published in 3rd International Conference "The European Electricity Market Challenge of the Unification EEM-06, Varsovie, Poland, 2006", Varsovie, Poland, HAL - CCSD. Rosellon, J. (2003). "Different Approaches Towards Electricity Transmission Expansion." Review of Network Economics 2(3): 238-268. Sauma, E. E. and S. S. Oren (2009). "Do generation firms in restructured electricity markets have incentives to support social-welfare-improving transmission investments?" Energy Economics 31(5): 676-689. Sioshansi, F.P. (2008) (ed.). Competitive Electricity Markets: Design, Implementation, Performance, Oxford: Elsevier. Sun, J. (2005). U.S. Financial Transmission Rights: Theory and Practice. Department of Econnomics Working Paper Series. Ames, Iowa, Iowa State University. Swiss Federal Office of Energy (2011). Available at: http://www.bfe.admin.ch/?lang=en, last accessed 27 January 2011. US EIA (2010). US Energy Information Administration, available at: http://www.eia.doe.gov/cabs/index.html, last accessed 24 January 2011. Vogelsang, I. (2001). "Price Regulation for Independent Transmission Companies." Journal of Regulatory Economics 20(2): 141-165. World Bank (2010). World Bank Indicators, available at http://data.worldbank.org/indicator, last accessed 24 January 2011. Zhang, N. (2009). "Market performance and bidders' bidding behavior in the New York Transmission Congestion Contract market." Energy Economics 31(1): 61-68.