lessons learned and paths to success with activated carbon...
TRANSCRIPT
Lessons Learned and Paths to Success with
Activated Carbon Injections
ASTSWMO Workshop, April 2016
Edward Winner
Kentucky DEP
Tom Fox
Colorado OPS

Acknowledgements
Dimin Fan, ORISE Fellow at OSRTI, USEPA
Scott Noland, RPI Group (CO)
AST Environmental (KY)
Jesse Taylor, Remington Technologies (CO)
Various sources as cited

Before we get started...
Thank you
Kentucky Geology Basics
• Low permeability clay and silty-clay soils.
• Karst regions (fractures holding contamination).
In situ remediation by conventional methods such as soil vapor extraction or biodegradation are often ineffective at low permeability media sites due to poor accessibility to the contaminants and severe mass transfer limitations. --Siegrist et al., 1999
Consistent with KY’s experience!
Success Reported for BOS-200 in KY
• High pressure injection required to cope with low permeability geology.
• Emphasizes the importance of building high resolution CSM for remedial design and implementation to be effective.
• Out of 72 UST sites in total: 41 NFA (10% 2nd injection selected), 7 requested NFA, 24 in monitoring stage (19/24 are less than 1 year post injection).

Colorado Geology Basics
• Low permeability clay and silty-clay soils common.
• Sedimentary bedrock, often poorly consolidated, weathered or fractured.
• Permeable (silty sand to gravel) regions have success with other methods.
• Metamorphic bedrock, fractured (remedial sites rare).
CBI in Colorado • Over 225 facilities treated since 2005.
• Usually tried when other methods unsuccessful / impractical.
• Significant reductions (>90%) in dissolved BTEX noted.
• Visible carbon usually in wells.
• Rebound and/or additional treatment often occurred.
• About 15% of sites treated with CBI reached NFA.
Small areas (<1000 ft2)
Low concentrations (<700 ug/L benzene (usually <200 ))
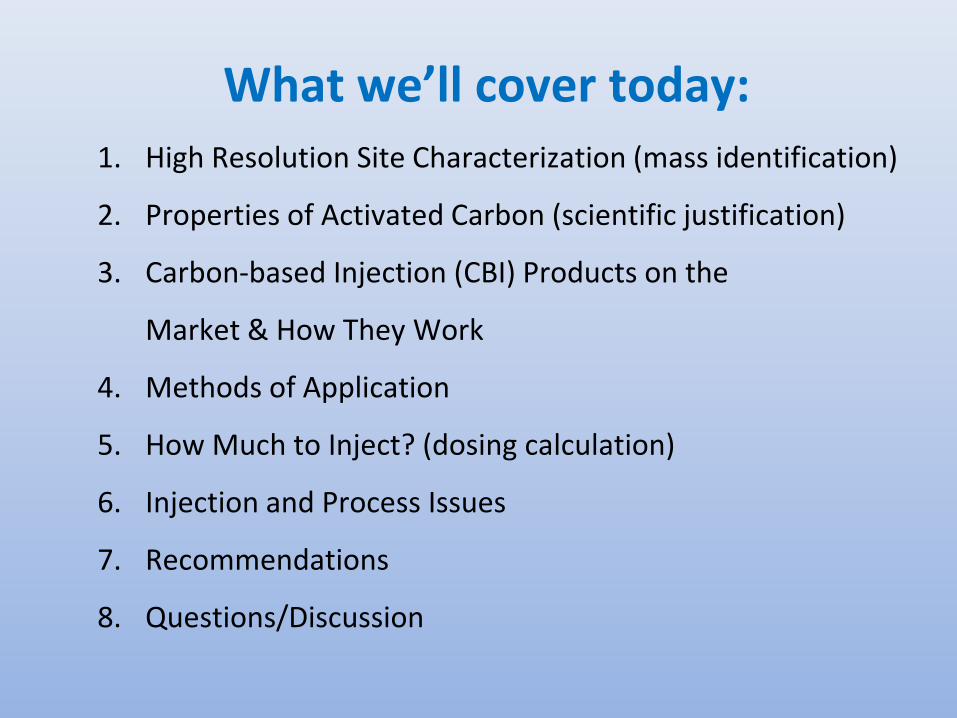
What we’ll cover today: 1. High Resolution Site Characterization (mass identification)
2. Properties of Activated Carbon (scientific justification)
3. Carbon-based Injection (CBI) Products on the
Market & How They Work
4. Methods of Application
5. How Much to Inject? (dosing calculation)
6. Injection and Process Issues
7. Recommendations
8. Questions/Discussion
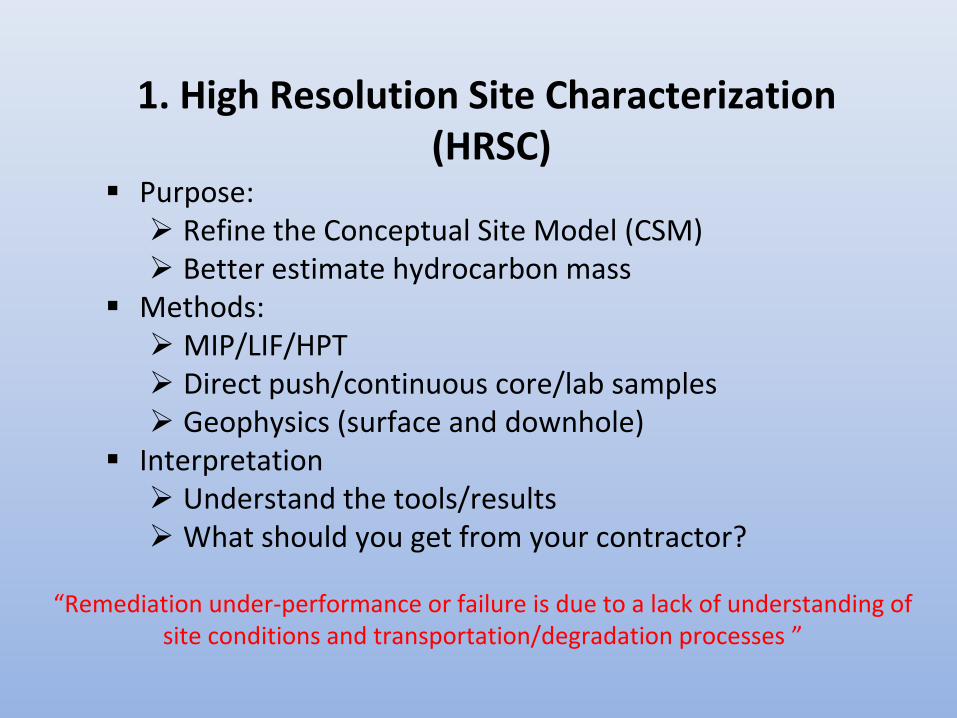
1. High Resolution Site Characterization (HRSC)
Purpose: Refine the Conceptual Site Model (CSM) Better estimate hydrocarbon mass
Methods: MIP/LIF/HPT Direct push/continuous core/lab samples Geophysics (surface and downhole)
Interpretation Understand the tools/results What should you get from your contractor?
“Remediation under-performance or failure is due to a lack of understanding of site conditions and transportation/degradation processes ”

Cascade Environmental
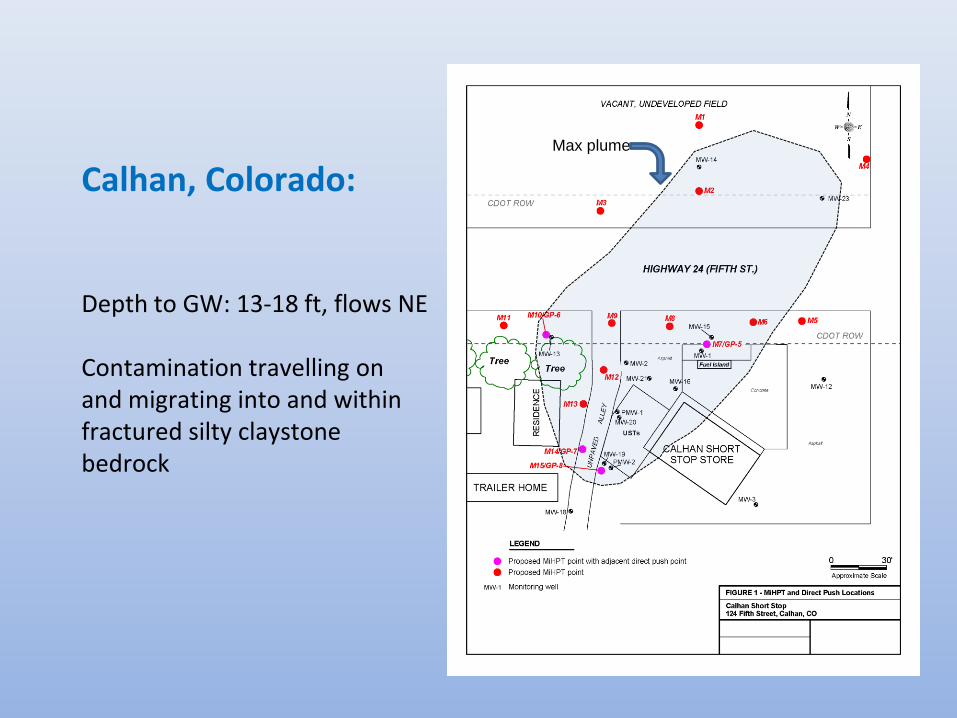
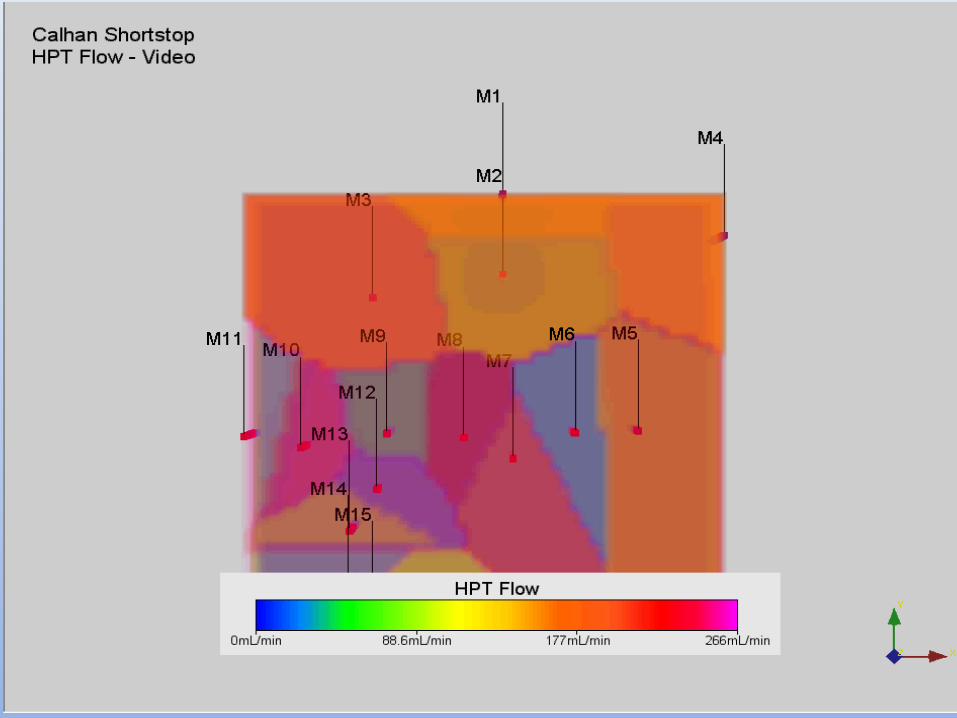
Calhan, Colorado:
Depth to GW: 13-18 ft, flows NE Contamination travelling on and migrating into and within fractured silty claystone bedrock
Max plume

Detailed logging and sampling for analysis is important!
CLAY
------------------
CLAYSTONE
“You can’t solve a problem that is not adequately and accurately characterized”

MIP output

USTs
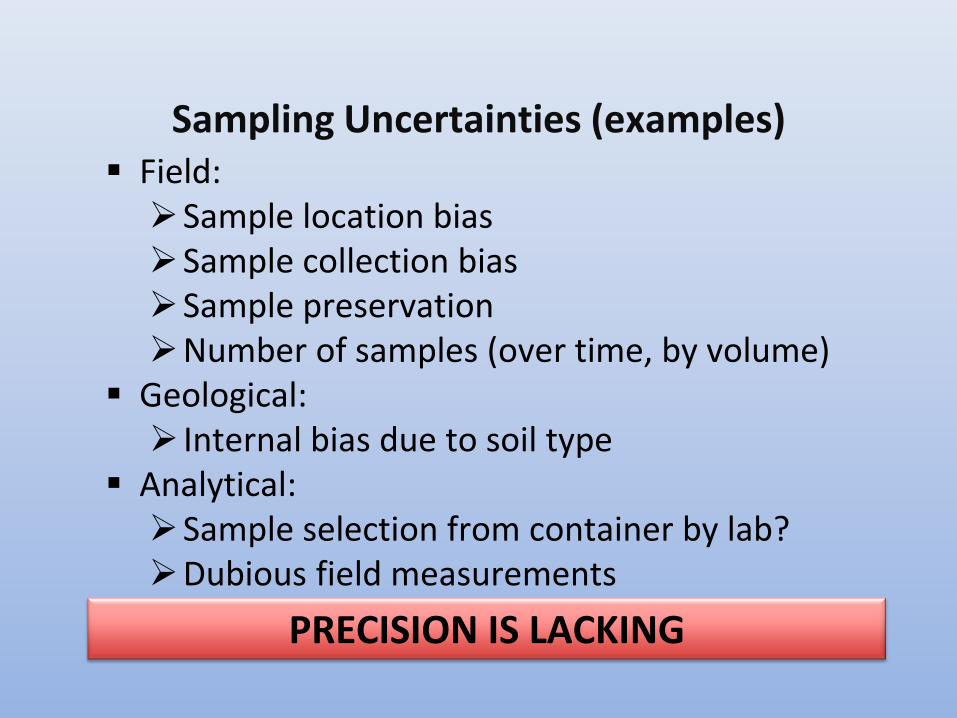
Sampling Uncertainties (examples) Field: Sample location bias Sample collection bias Sample preservation Number of samples (over time, by volume)
Geological: Internal bias due to soil type
Analytical: Sample selection from container by lab? Dubious field measurements
PRECISION IS LACKING
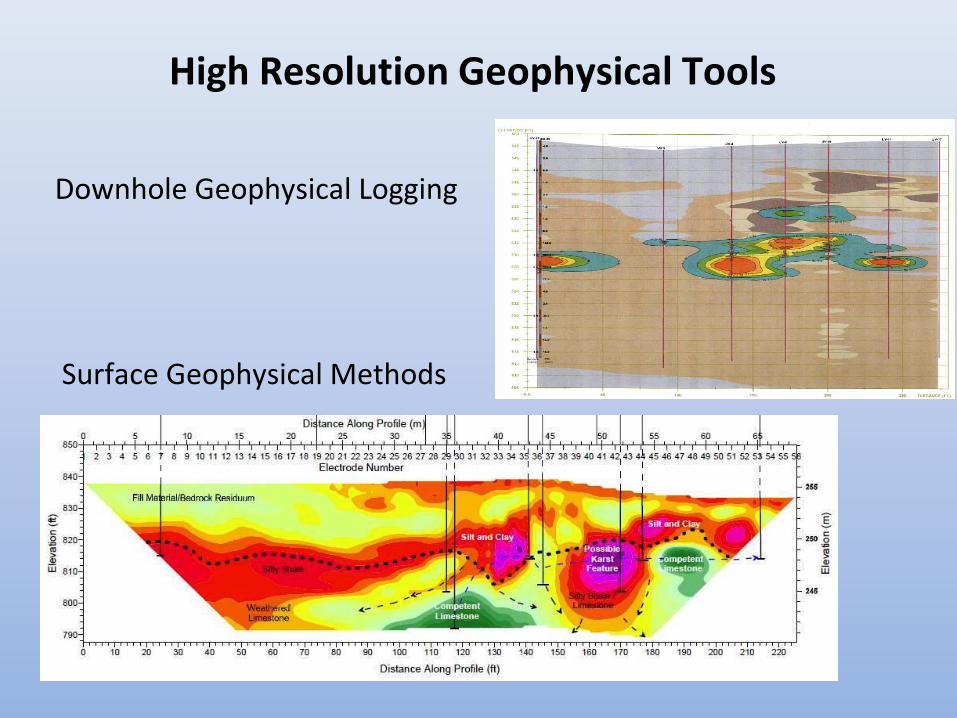
Downhole Geophysical Logging
Surface Geophysical Methods
High Resolution Geophysical Tools
2. Properties of Activated Carbon
History of use
Sources and activation process
Surface area/particle sizing
Pore sizes/structure

History of AC use
• Medicine in 1550 B.C. in Egypt and later by the Greeks
• Phoenicians (450 BC) stored water in charred wood barrels
• Hindus (450 BC) used sand/charcoal filters for water
purification
• 1700’s for medicinal uses (ingestion)
• 1800’s remove color from sugar
• Activation processes developed in 1870-1920
• First used 1910 for dechlorination of treated water (England)
• World War I for gas masks; industrial uses expanded
• 1965 for wastewater treatment (California)
Activated Carbon for Water and Wastewater Treatment: Integration of Adsorption and
Biological Treatment -Wiley (2010)
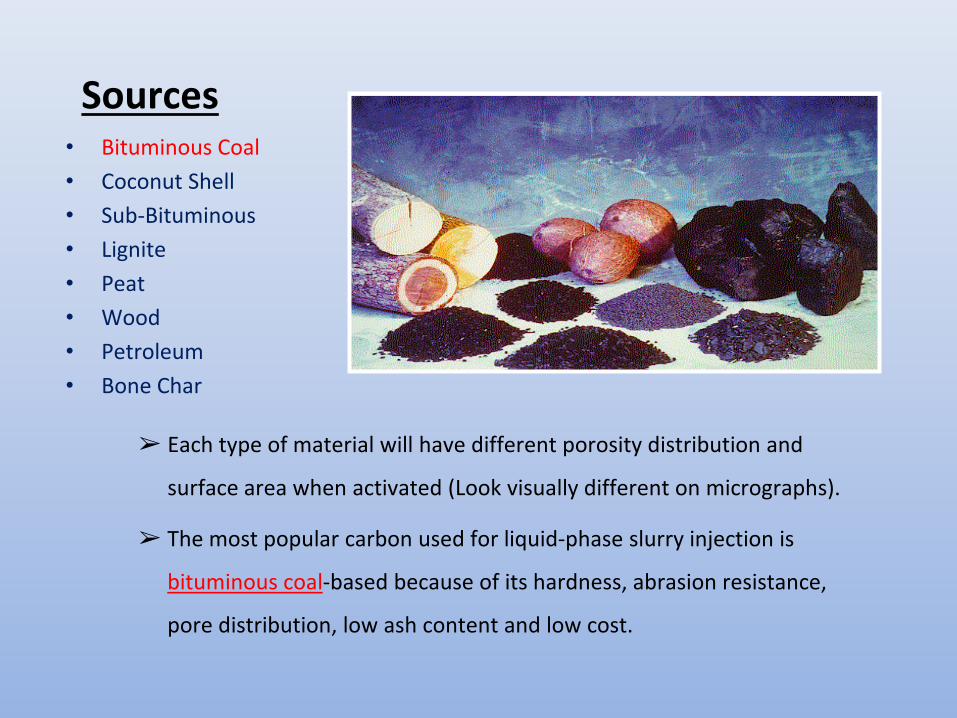
Sources • Bituminous Coal
• Coconut Shell
• Sub-Bituminous
• Lignite
• Peat
• Wood
• Petroleum
• Bone Char
➢ Each type of material will have different porosity distribution and
surface area when activated (Look visually different on micrographs).
➢ The most popular carbon used for liquid-phase slurry injection is
bituminous coal-based because of its hardness, abrasion resistance,
pore distribution, low ash content and low cost.

Activation Process
• Chemical (1900) - heating of the carbonaceous material in the presence of dehydrating chemicals such as zinc chloride or phosphoric acid
• Steam (1901) – heating with steam and carbon dioxide (anoxic)
➢ Longer activation times result in larger pore sizes.
➢ Preferable to use virgin and not regenerated carbon (latter may have residual impurities)
Envi
roca
rbo
n.c
om
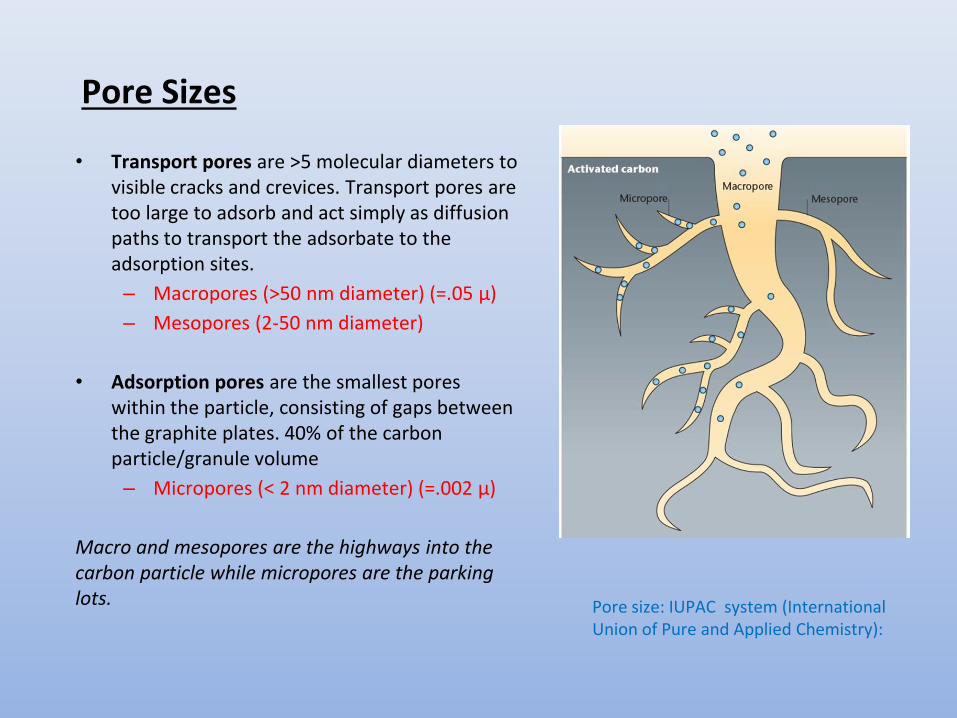
Pore Sizes
• Transport pores are >5 molecular diameters to visible cracks and crevices. Transport pores are too large to adsorb and act simply as diffusion paths to transport the adsorbate to the adsorption sites.
– Macropores (>50 nm diameter) (=.05 μ)
– Mesopores (2-50 nm diameter)
• Adsorption pores are the smallest pores within the particle, consisting of gaps between the graphite plates. 40% of the carbon particle/granule volume
– Micropores (< 2 nm diameter) (=.002 μ)
Macro and mesopores are the highways into the carbon particle while micropores are the parking lots. Pore size: IUPAC system (International
Union of Pure and Applied Chemistry):
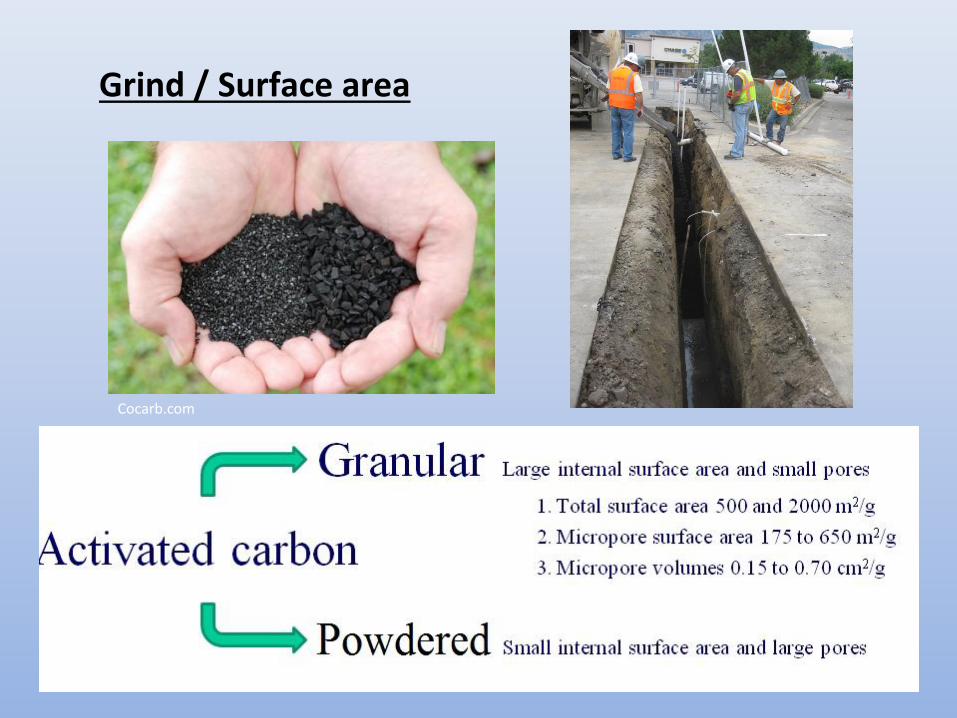
Grind / Surface area
Cocarb.com
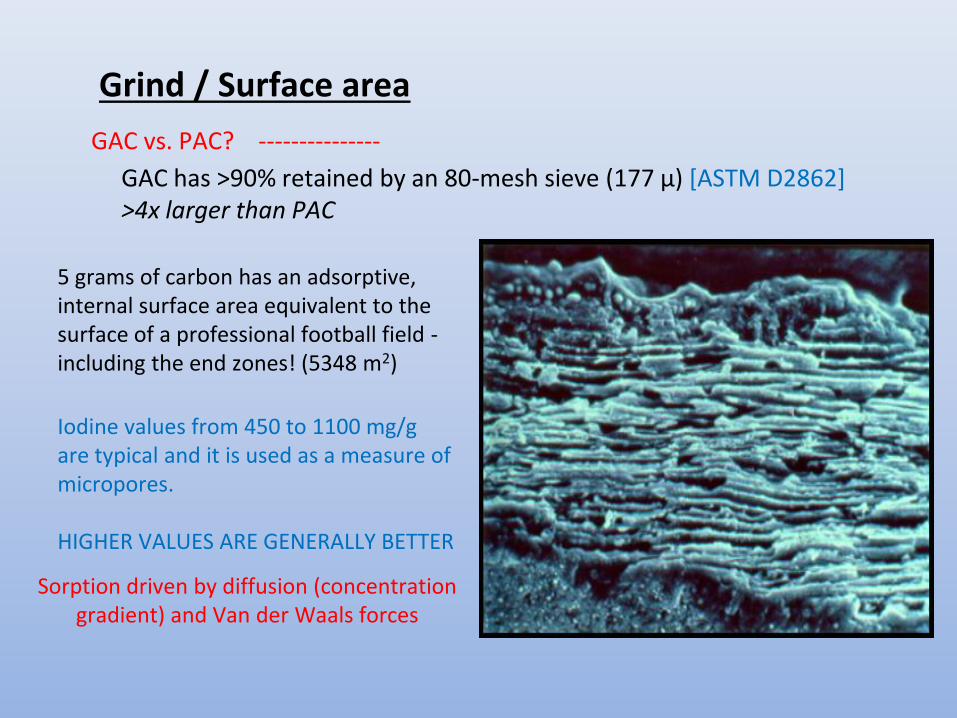
5 grams of carbon has an adsorptive, internal surface area equivalent to the surface of a professional football field - including the end zones! (5348 m2)
Iodine values from 450 to 1100 mg/g are typical and it is used as a measure of micropores. HIGHER VALUES ARE GENERALLY BETTER
GAC vs. PAC? ---------------
GAC has >90% retained by an 80-mesh sieve (177 μ) [ASTM D2862] >4x larger than PAC
Grind / Surface area
Sorption driven by diffusion (concentration gradient) and Van der Waals forces

Particle size <40 microns (µ)
➢10-slot screen = 256 µ
➢200-mesh sieve (clay) = 75 µ
➢Bacteria = 0.5 - 2 µ
➢Pore throats (Nelson, AAPG Bull., 3/09):
sand >2 µ silt 0.03 – 2 µ clay 0.005 – 0.1 µ
➢Mesopore = 0.05 μ; Micropore = 0.002 μ
➢BTEX molecules = 7 Angstroms (Å) = 0.0007 µ
➢Water molecule = 3 Angstroms (Å) = 0.0003 µ
Powdered Activated Carbon (PAC)
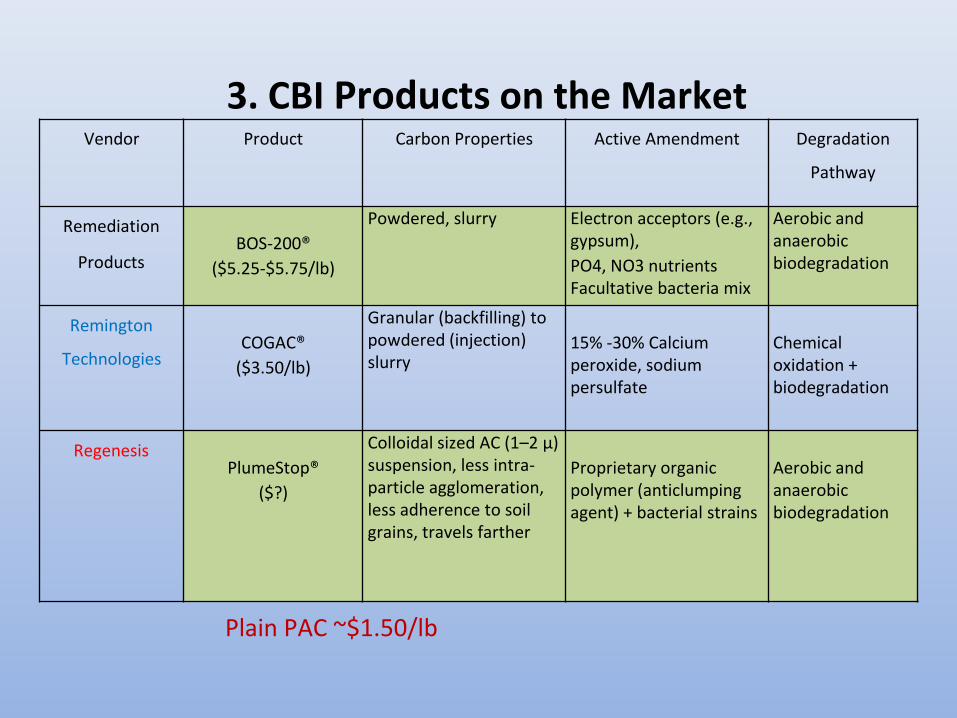
3. CBI Products on the Market Vendor Product Carbon Properties Active Amendment Degradation
Pathway
Remediation
Products
BOS-200®
($5.25-$5.75/lb)
Powdered, slurry Electron acceptors (e.g., gypsum),
PO4, NO3 nutrients Facultative bacteria mix
Aerobic and anaerobic biodegradation
Remington
Technologies
COGAC®
($3.50/lb)
Granular (backfilling) to powdered (injection) slurry
15% -30% Calcium peroxide, sodium persulfate
Chemical oxidation + biodegradation
Regenesis
PlumeStop®
($?)
Colloidal sized AC (1–2 µ) suspension, less intra-particle agglomeration, less adherence to soil grains, travels farther
Proprietary organic polymer (anticlumping agent) + bacterial strains
Aerobic and anaerobic biodegradation
Plain PAC ~$1.50/lb

How AC-based Amendments Work
Adsorption Degradation AC-based Remedy
1. Adsorption 2. Degradation
3. Regeneration
Organic acids, CO2
Advantages Claimed
• FAST RESPONSE (due to adsorption) • Weeks to Months
• NO REBOUND
• Sustained treatment: regeneration counters back diffusion from soil
• Limited number of injections needed
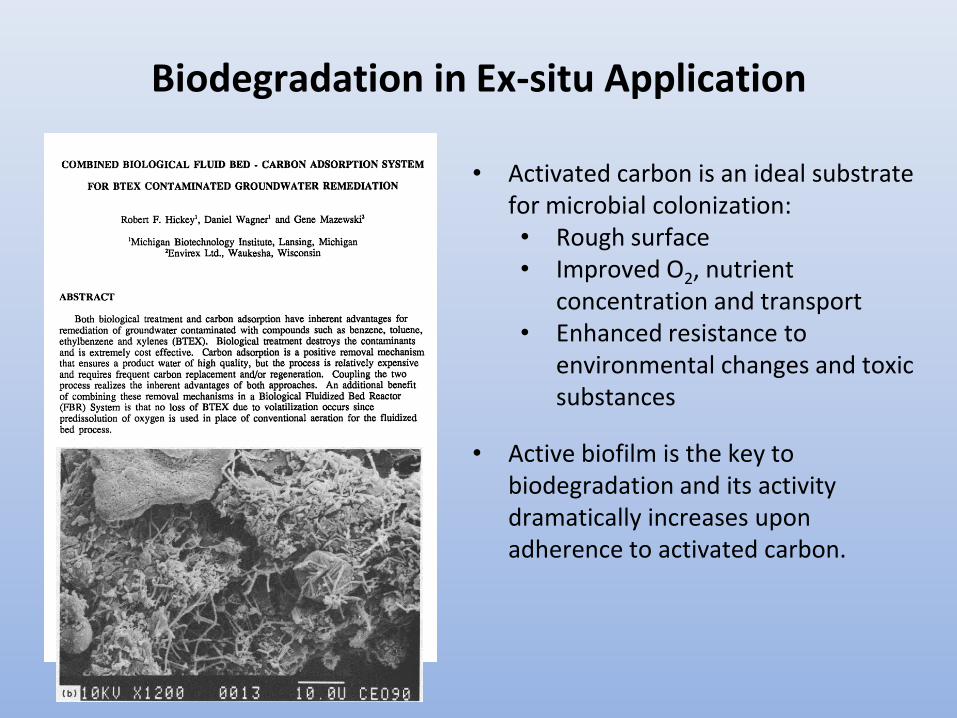
Biodegradation in Ex-situ Application
• Activated carbon is an ideal substrate for microbial colonization: • Rough surface • Improved O2, nutrient
concentration and transport • Enhanced resistance to
environmental changes and toxic substances
• Active biofilm is the key to biodegradation and its activity dramatically increases upon adherence to activated carbon.

Degradation: Conceptual Model
• Adsorption dominant before biofilm is established (Process II)
• Biodegradation dominant once biofilm is established (Process I)
• Remaining adsorption capacity is not used during steady state but mainly serves as emergency capacity:
• Higher influent conc. • Decreasing biodegradation rate
Two Step Process
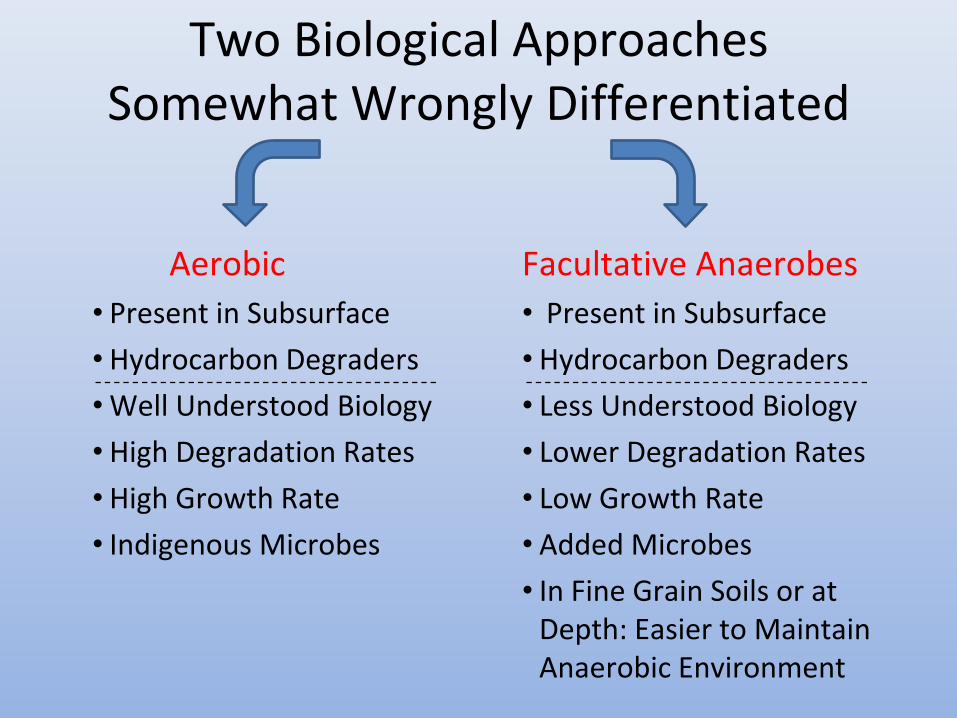
Two Biological Approaches Somewhat Wrongly Differentiated
Aerobic
• Present in Subsurface
• Hydrocarbon Degraders
• Well Understood Biology
• High Degradation Rates
• High Growth Rate
• Indigenous Microbes
Facultative Anaerobes
• Present in Subsurface
• Hydrocarbon Degraders
• Less Understood Biology
• Lower Degradation Rates
• Low Growth Rate
• Added Microbes
• In Fine Grain Soils or at Depth: Easier to Maintain Anaerobic Environment

1. Nitrates drop almost immediately (< month) 2. Sulfates drop over time (≈20% of wells may not drop) 3. Dissolved oxygen generally decreases 4. ORP stays generally negative.
Indications of biological activity Injection Point
Injection Point
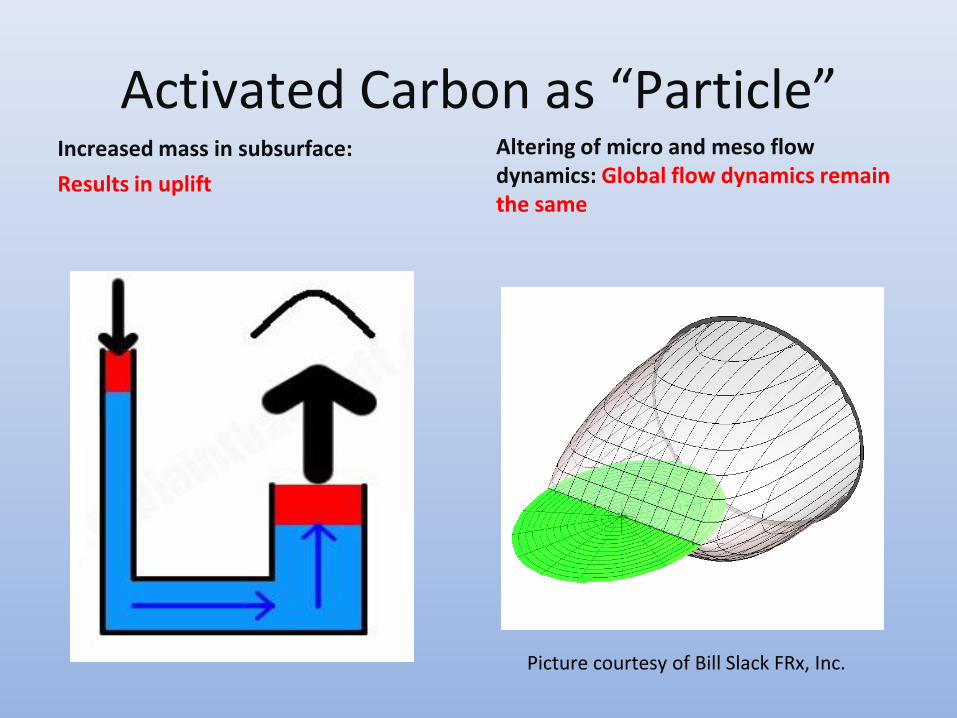
Activated Carbon as “Particle” Increased mass in subsurface:
Results in uplift
Altering of micro and meso flow dynamics: Global flow dynamics remain the same
Picture courtesy of Bill Slack FRx, Inc.
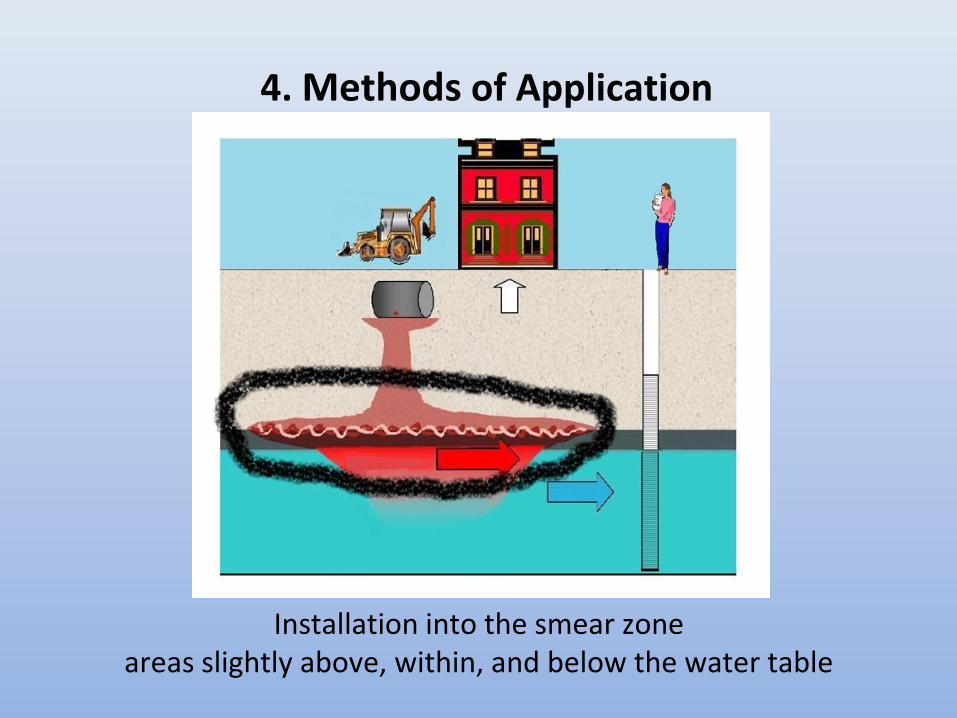
Installation into the smear zone areas slightly above, within, and below the water table
4. Methods of Application

• Gravity Feed: advection and dispersion (not recommended—too slow and limited area)
• Pressure Injection below fracture pressure:
The amendment must be on a molecular scale smaller than soil pore throat size.
• Pressure Injection above fracture pressure:
Makes new openings and follow regions of less resistance Build-up pressure vs Immediate pressure
• Direct application to excavation and trenches (best way to guarantee distribution)
4. Methods of Application
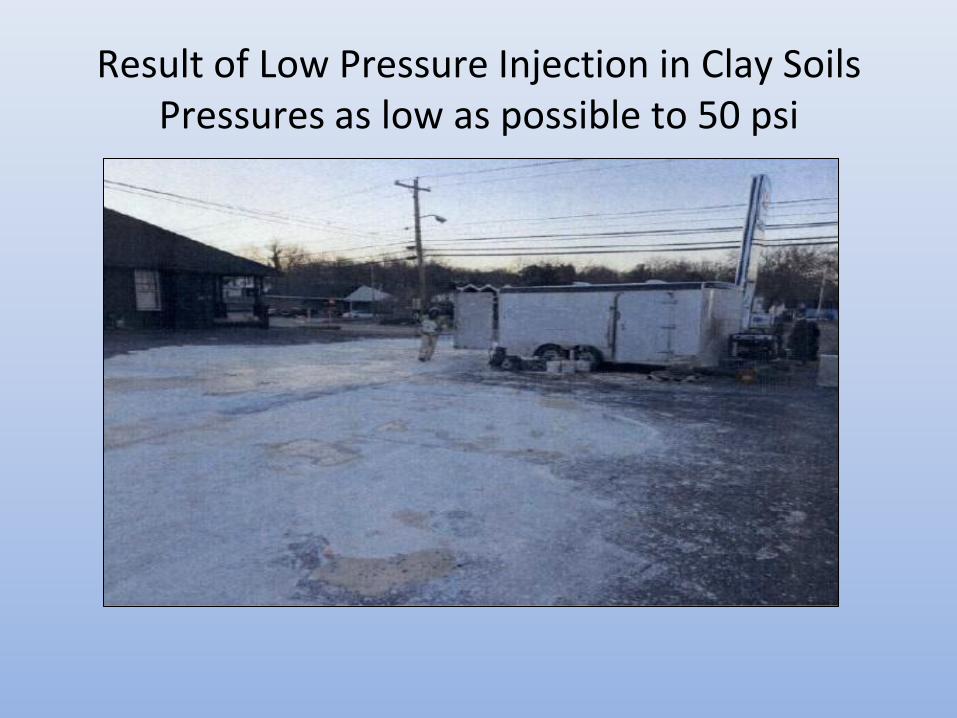
Result of Low Pressure Injection in Clay Soils Pressures as low as possible to 50 psi

High pressure direct push injection (DPI)
• Has become the most widely used technique for carbon
injection
• Direct push rig (e.g., GeoProbe)
• Various designs for injection tip
• Tight spacing (5-7 ft hex grid), 1-3 ft vertical interval
• Initiation pressure is generally greater than 100 psi, typically
300–600 psi in low K zones (fractures), then drops as fracture
propagates at 25-100 psi tight grained,
• Flow rates <1 gpm to 75 gpm (35 to 75 typical)
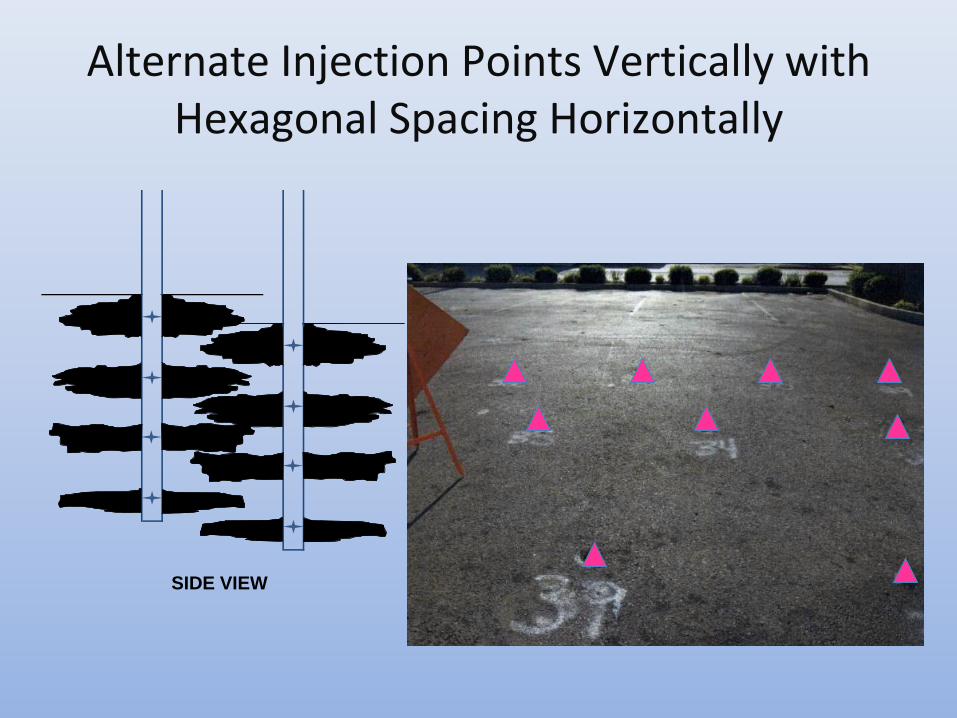
Alternate Injection Points Vertically with Hexagonal Spacing Horizontally
SIDE VIEW
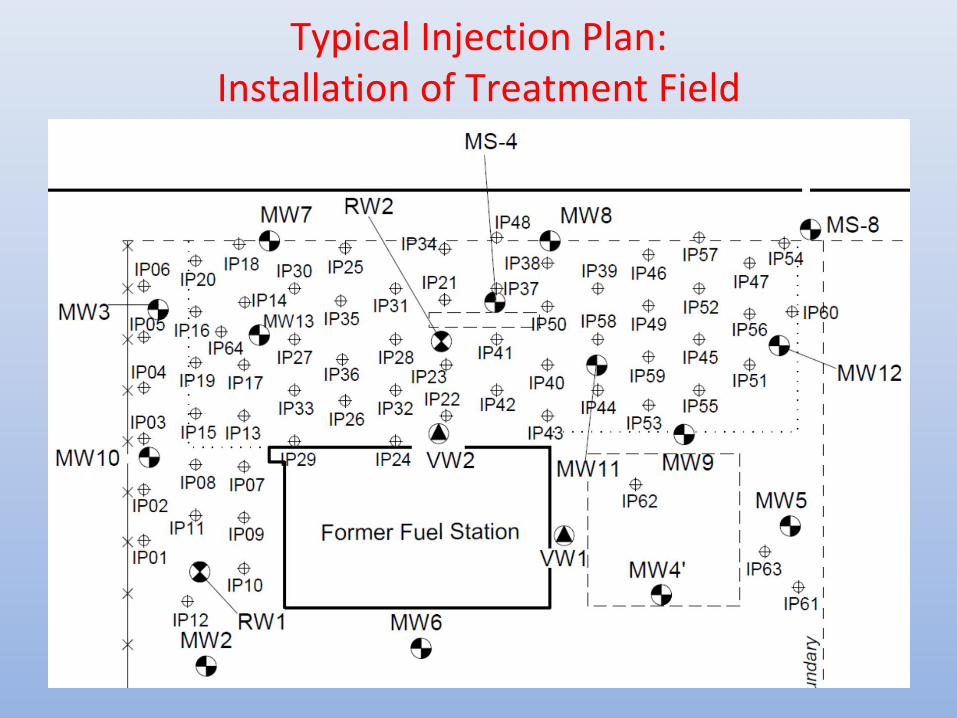
Typical Injection Plan: Installation of Treatment Field
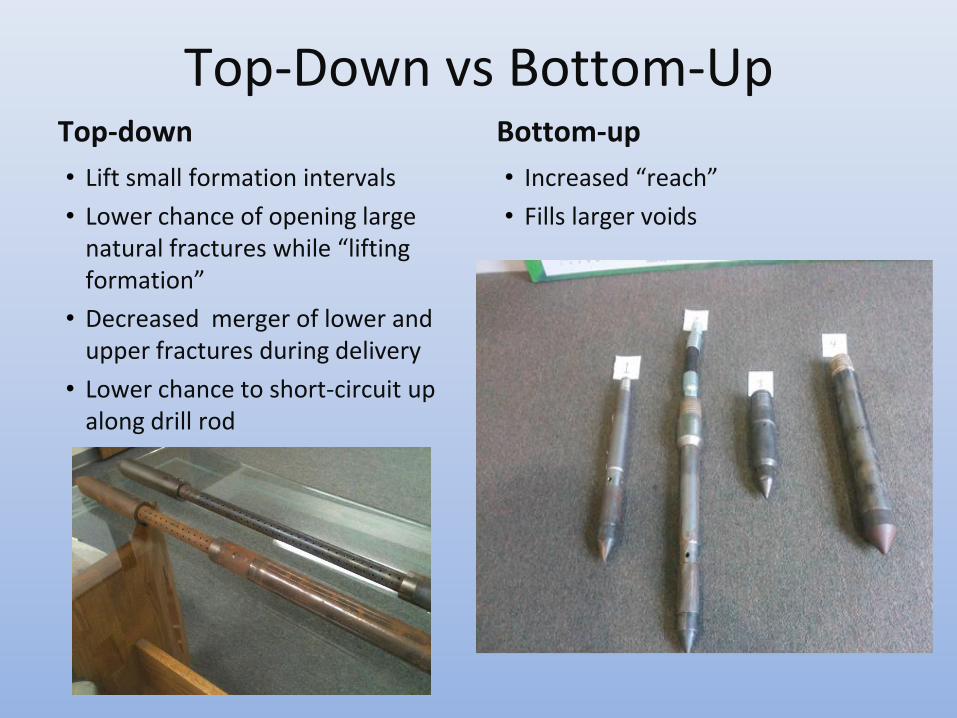
Top-Down vs Bottom-Up Top-down
• Lift small formation intervals
• Lower chance of opening large natural fractures while “lifting formation”
• Decreased merger of lower and upper fractures during delivery
• Lower chance to short-circuit up along drill rod
Bottom-up
• Increased “reach”
• Fills larger voids

Other Methods of Injection
Hydraulic fracturing (hard materials) • Requires borehole installation
• Fracture initiation by notch or water jetting
• Sand or guar gum usually mixed with amendment as slurry to keep
fracture open
High pressure jetting (soft materials) • Similar to grouting process for soil stabilization
• Extremely high pressure (5000 psi) to homogenize amendment and soils
• Applied where hydraulic fracturing is less practical or ineffective (e.g.,
sandy material)
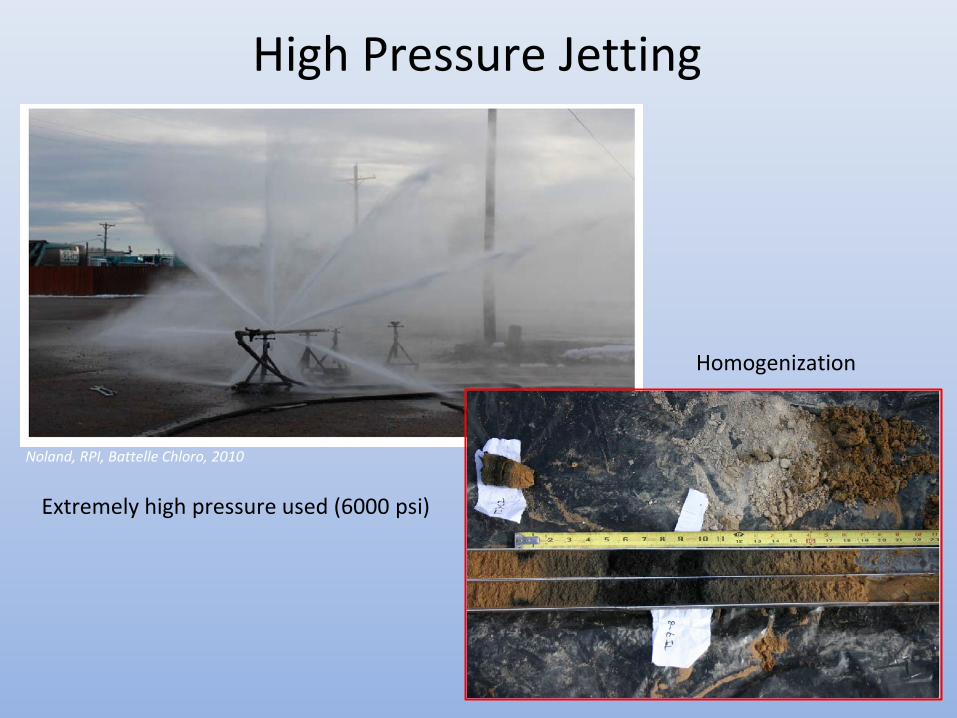
High Pressure Jetting
Noland, RPI, Battelle Chloro, 2010
Extremely high pressure used (6000 psi)
Homogenization
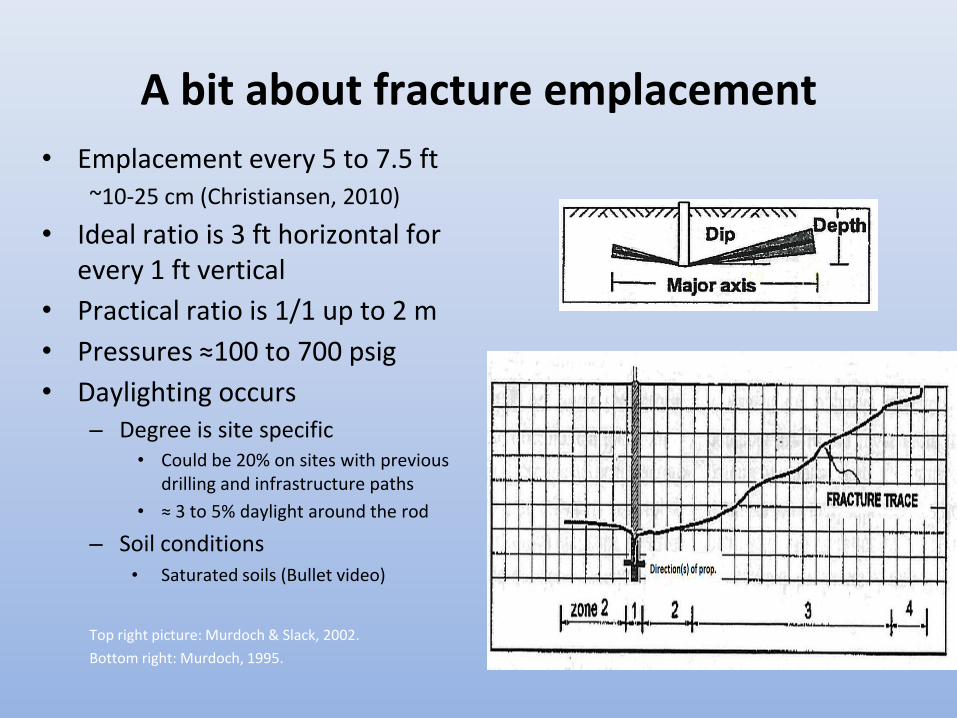
A bit about fracture emplacement
• Emplacement every 5 to 7.5 ft ~10-25 cm (Christiansen, 2010)
• Ideal ratio is 3 ft horizontal for every 1 ft vertical
• Practical ratio is 1/1 up to 2 m
• Pressures ≈100 to 700 psig
• Daylighting occurs – Degree is site specific
• Could be 20% on sites with previous drilling and infrastructure paths
• ≈ 3 to 5% daylight around the rod
– Soil conditions • Saturated soils (Bullet video)
Top right picture: Murdoch & Slack, 2002.
Bottom right: Murdoch, 1995.

Distribution is based on physics and has a general pattern that is predictable
• Jell-O animation
https://youtu.be/2UHTj9mn7h4
https://youtu.be/Jsf0Wa0U1tc
Picture courtesy of Bill Slack FRx, Inc.

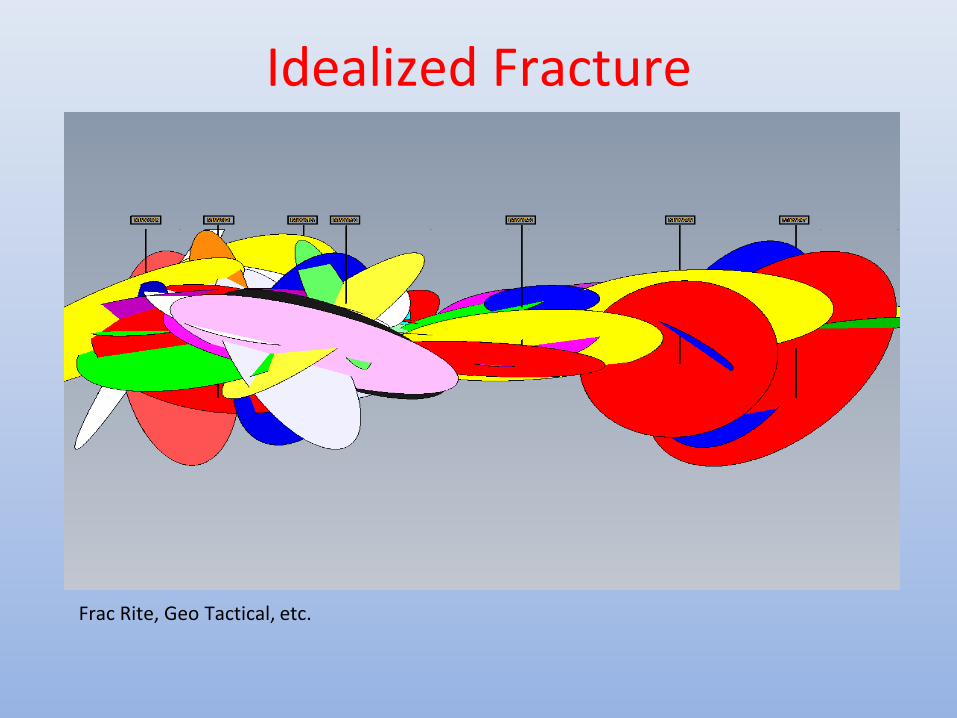
Idealized Fracture
Frac Rite, Geo Tactical, etc.

Look Closer: Random Characteristics Different Sites and Techniques
Natural
Fractures in
Formation
Induced
Fracture in
Formation
Left picture KY site. Right picture courtesy of Bill Slack FRx, Inc.

Seemingly small seams
can fill larger voids

Patterns Seen in Various Soils
Thin veins
Spots
Homogenization

5. How Much to Inject?
• Quantity/volume per interval determined based on amount necessary to build the treatment field and address the mass of contamination.
• Injection point is horizontal while an injection interval is vertical Spacing on the horizontal is controlled by tip geometry, tip
pressures, geology, etc. Spacing is variable, but it is difficult in most geological
materials to consistently reach beyond 6.5ft. (2 meters) Interval spacing varies depending on similar factors but
generally 2 to 4 ft.
• May need multiple injection events to get carbon mass in.

Selecting an Adsorption Coefficient Dosing: Adsorption Coefficient for gasoline is not generally known, so different companies use different estimates. Many use benzene as a “stand-in” for TPH
Generally, a coefficient between 5 & 60 for TPH. • Depends on initial conc. vs
final conc. desired • particular carbon used
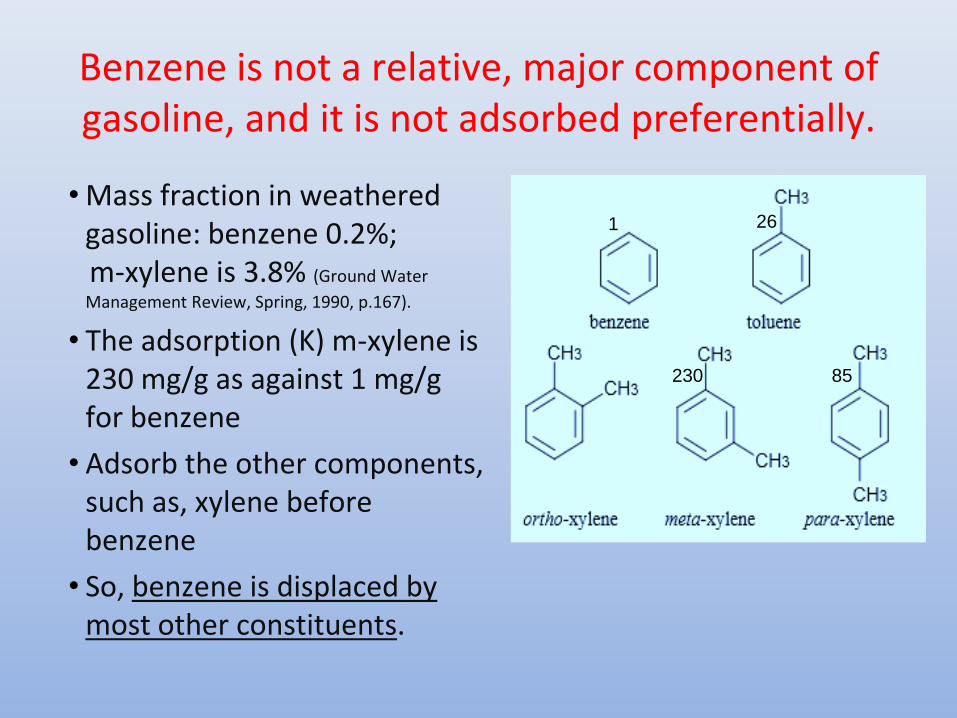
Benzene is not a relative, major component of gasoline, and it is not adsorbed preferentially.
• Mass fraction in weathered gasoline: benzene 0.2%;
m-xylene is 3.8% (Ground Water
Management Review, Spring, 1990, p.167).
• The adsorption (K) m-xylene is 230 mg/g as against 1 mg/g for benzene
• Adsorb the other components, such as, xylene before benzene
• So, benzene is displaced by most other constituents.
1 26
85 230
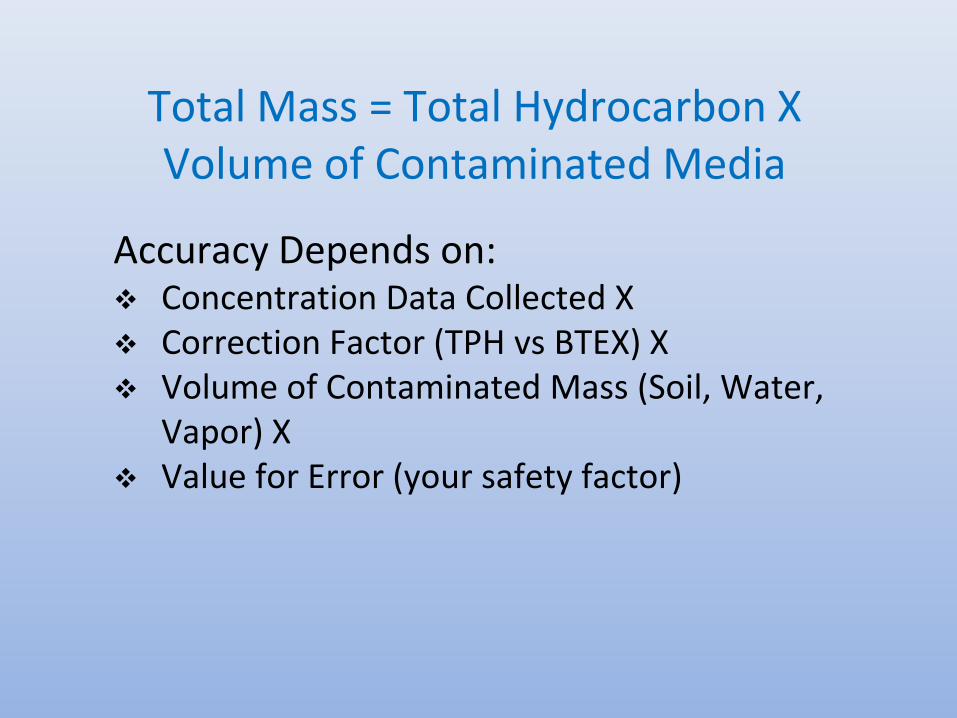
Total Mass = Total Hydrocarbon X Volume of Contaminated Media
Accuracy Depends on: Concentration Data Collected X Correction Factor (TPH vs BTEX) X Volume of Contaminated Mass (Soil, Water,
Vapor) X Value for Error (your safety factor)
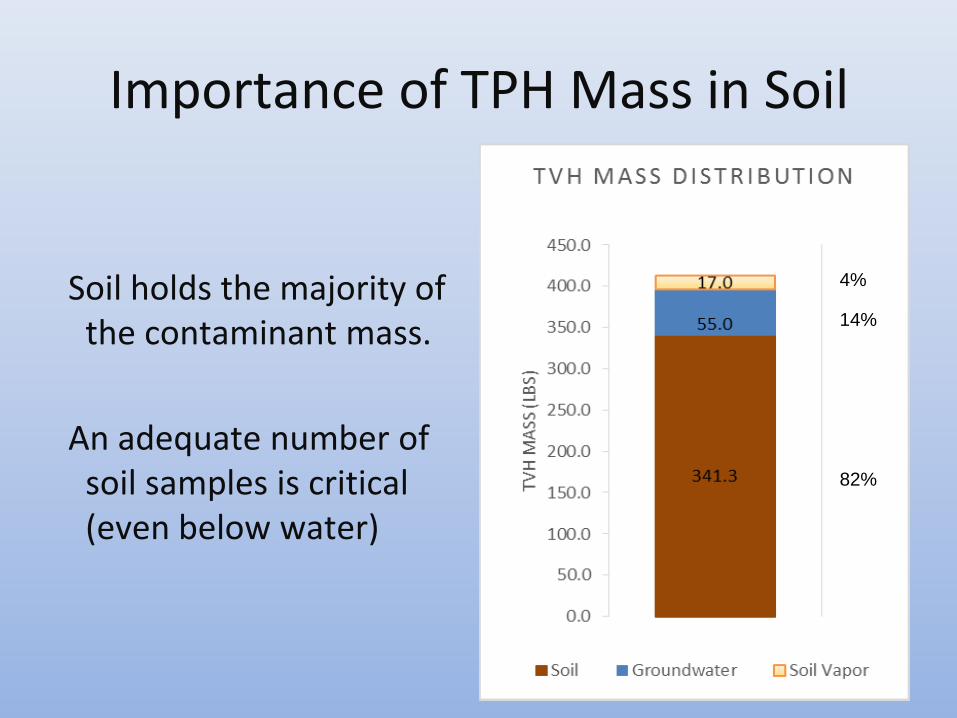
Importance of TPH Mass in Soil
Soil holds the majority of the contaminant mass.
An adequate number of soil samples is critical (even below water)
82%
14%
4%

Determine Contaminant Mass
AST Environmental
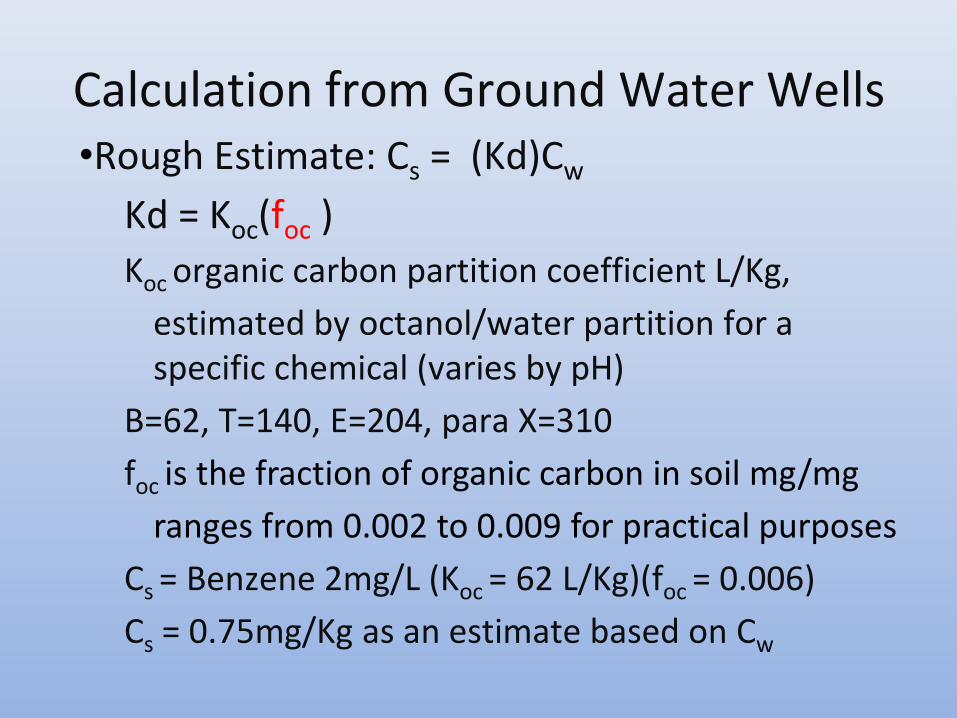
Calculation from Ground Water Wells •Rough Estimate: Cs = (Kd)Cw
Kd = Koc(foc )
Koc organic carbon partition coefficient L/Kg,
estimated by octanol/water partition for a specific chemical (varies by pH)
B=62, T=140, E=204, para X=310
foc is the fraction of organic carbon in soil mg/mg
ranges from 0.002 to 0.009 for practical purposes
Cs = Benzene 2mg/L (Koc = 62 L/Kg)(foc = 0.006)
Cs = 0.75mg/Kg as an estimate based on Cw
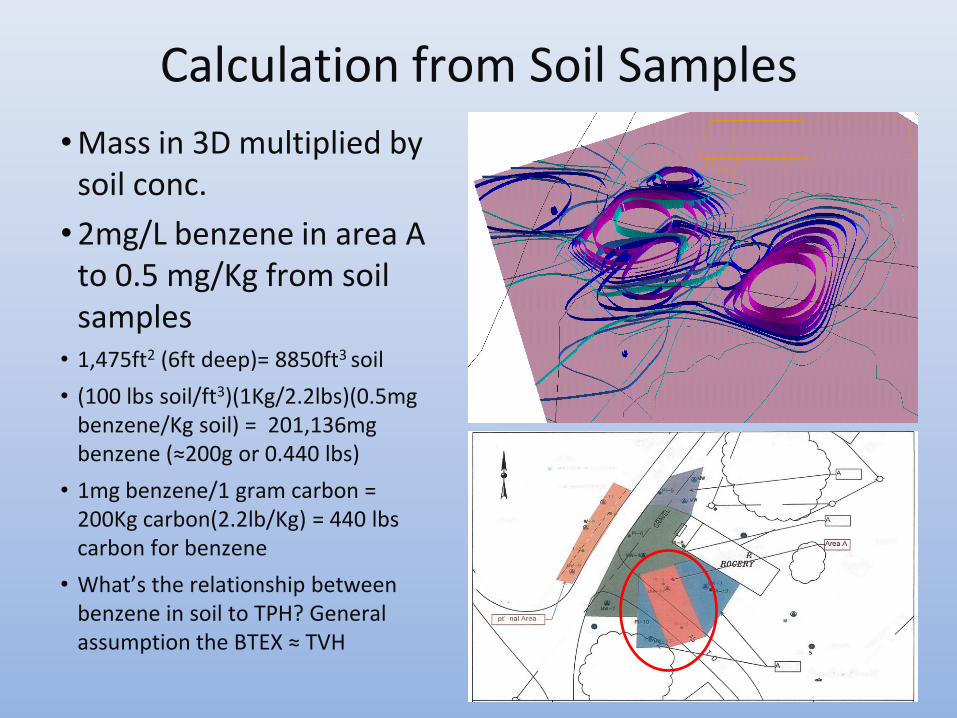
Calculation from Soil Samples
•Mass in 3D multiplied by soil conc.
•2mg/L benzene in area A to 0.5 mg/Kg from soil samples
• 1,475ft2 (6ft deep)= 8850ft3 soil
• (100 lbs soil/ft3)(1Kg/2.2lbs)(0.5mg benzene/Kg soil) = 201,136mg benzene (≈200g or 0.440 lbs)
• 1mg benzene/1 gram carbon = 200Kg carbon(2.2lb/Kg) = 440 lbs carbon for benzene
• What’s the relationship between benzene in soil to TPH? General assumption the BTEX ≈ TVH

[Example of dosing calculation from Remington Technologies]
Mass Calculations and Design
Output
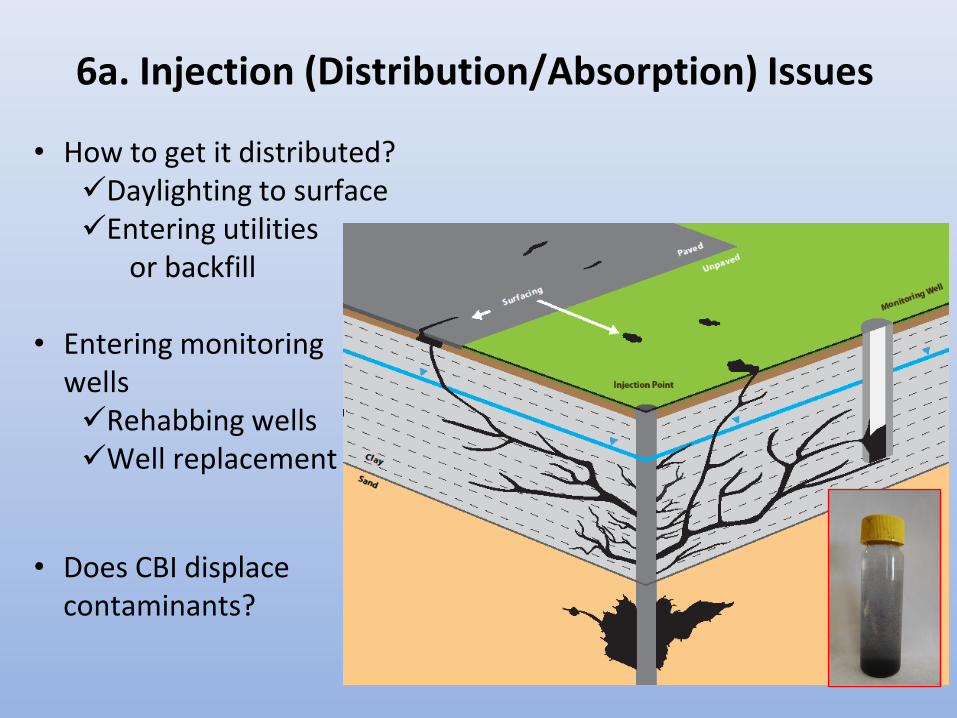
6a. Injection (Distribution/Absorption) Issues
• How to get it distributed? Daylighting to surface Entering utilities or backfill
• Entering monitoring wells Rehabbing wells Well replacement
• Does CBI displace contaminants?

Typical well responses after CBI:
Instant response
Slower response
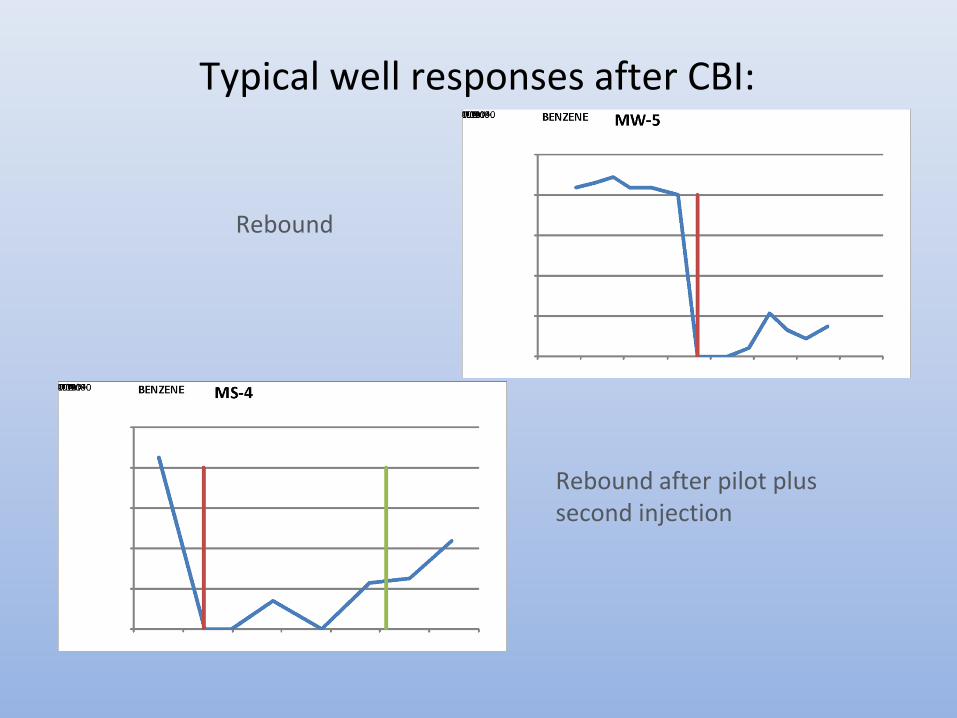
Rebound
Rebound after pilot plus second injection
Typical well responses after CBI:

Injection
Point SB-3
35-116 ppb
MW-9
5 qtrs <5 ppb
Groundwater samples
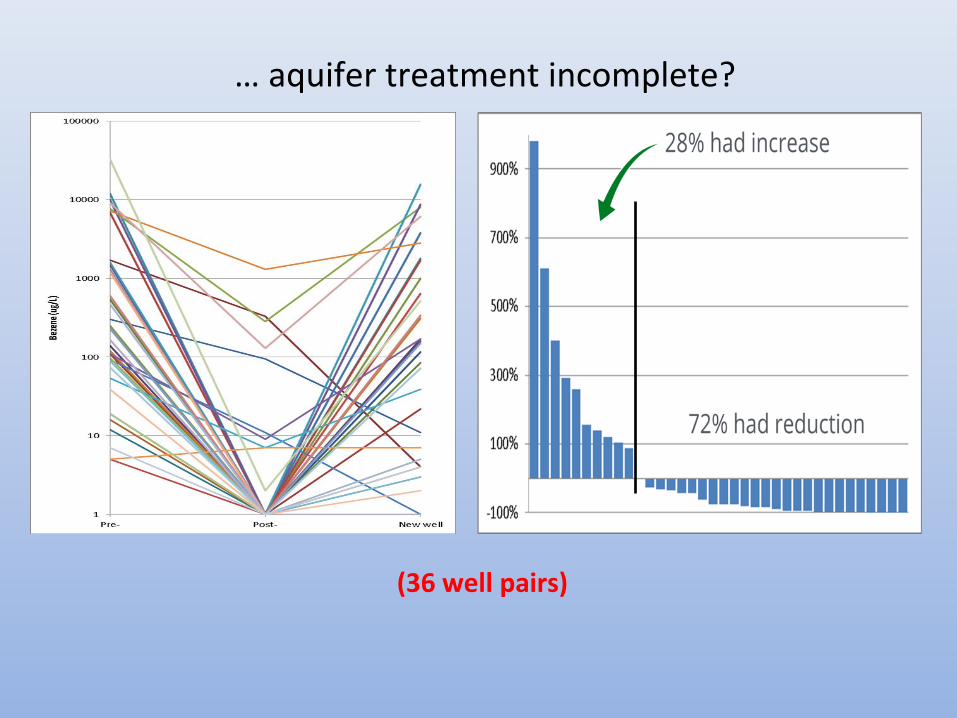
… aquifer treatment incomplete?
(36 well pairs)
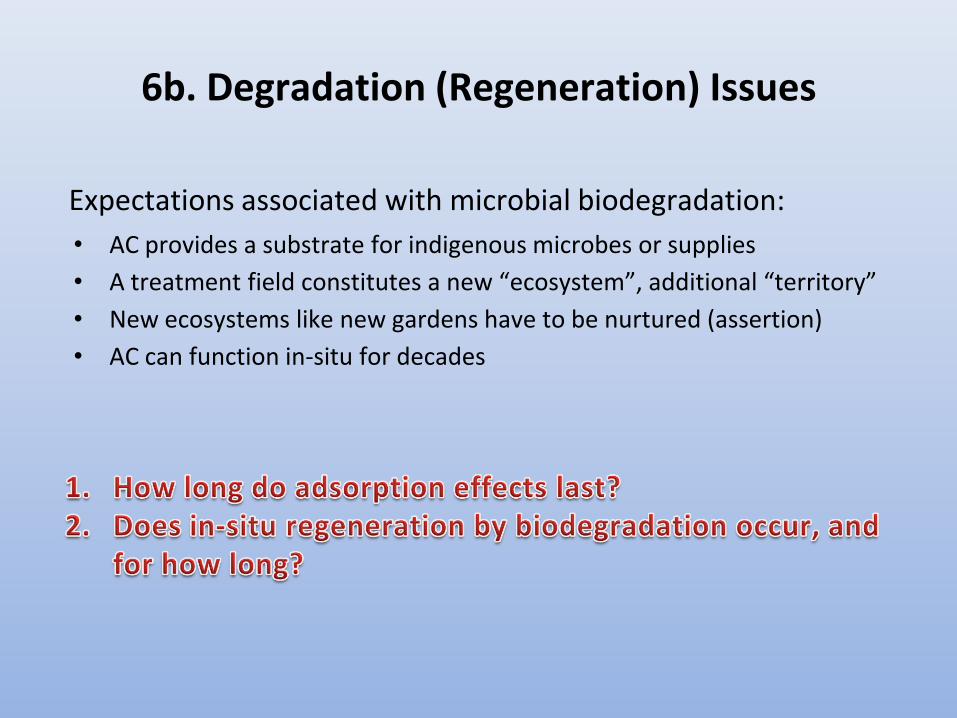
6b. Degradation (Regeneration) Issues
Expectations associated with microbial biodegradation:
• AC provides a substrate for indigenous microbes or supplies
• A treatment field constitutes a new “ecosystem”, additional “territory”
• New ecosystems like new gardens have to be nurtured (assertion)
• AC can function in-situ for decades

1. Poor site characterization to target contaminants. 2. Poor AC distribution (injection). 3. AC overwhelmed - insufficient AC mass applied. 4. Preferential desorption occurring (chemistry). 5. Degradation processes don’t keep up with desorption
from impacted soil (rate limiting). 6. Degradation processes slow or stop (longevity) due to
insufficient inorganic nutrients inappropriate environment (e.g. temperature) lack of degraders
Why does “rebound” occur?
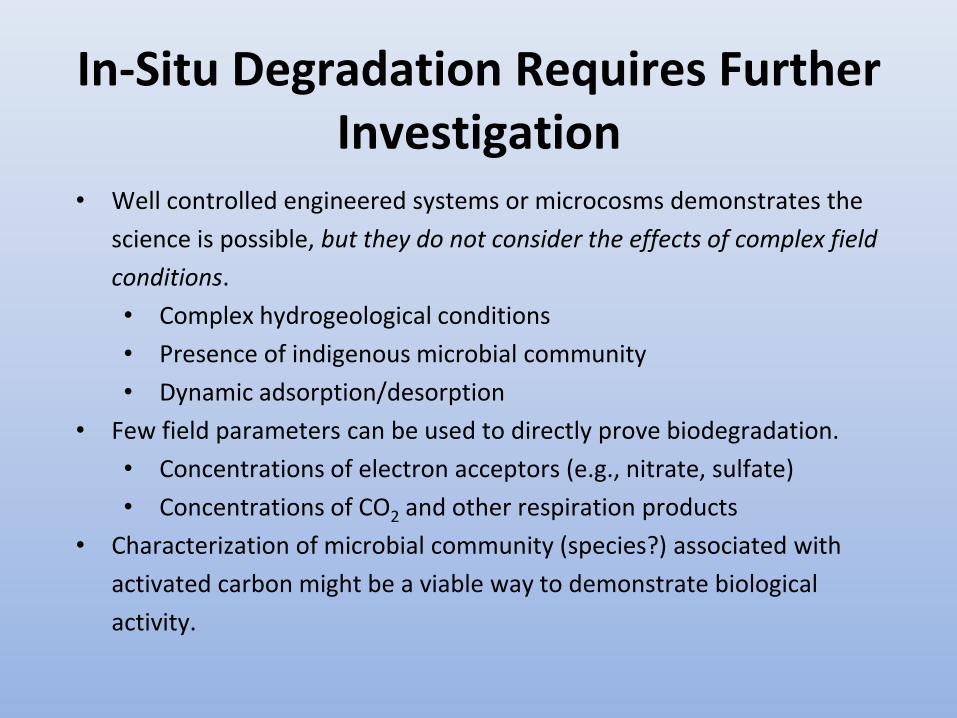
In-Situ Degradation Requires Further Investigation
• Well controlled engineered systems or microcosms demonstrates the
science is possible, but they do not consider the effects of complex field
conditions.
• Complex hydrogeological conditions
• Presence of indigenous microbial community
• Dynamic adsorption/desorption
• Few field parameters can be used to directly prove biodegradation.
• Concentrations of electron acceptors (e.g., nitrate, sulfate)
• Concentrations of CO2 and other respiration products
• Characterization of microbial community (species?) associated with
activated carbon might be a viable way to demonstrate biological
activity.
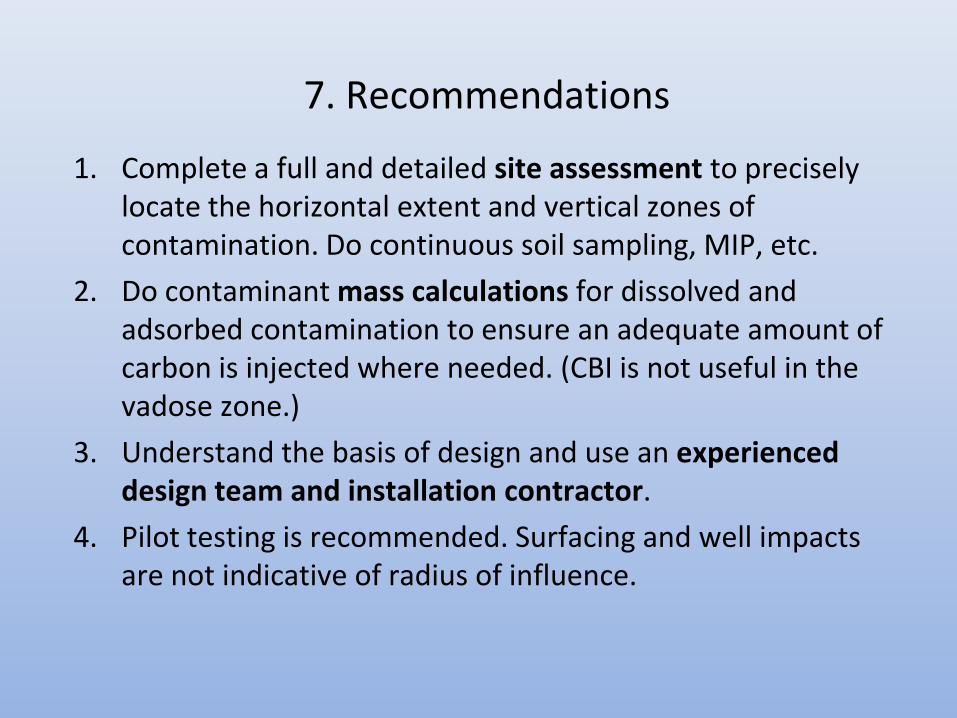
7. Recommendations
1. Complete a full and detailed site assessment to precisely locate the horizontal extent and vertical zones of contamination. Do continuous soil sampling, MIP, etc.
2. Do contaminant mass calculations for dissolved and adsorbed contamination to ensure an adequate amount of carbon is injected where needed. (CBI is not useful in the vadose zone.)
3. Understand the basis of design and use an experienced design team and installation contractor.
4. Pilot testing is recommended. Surfacing and well impacts are not indicative of radius of influence.
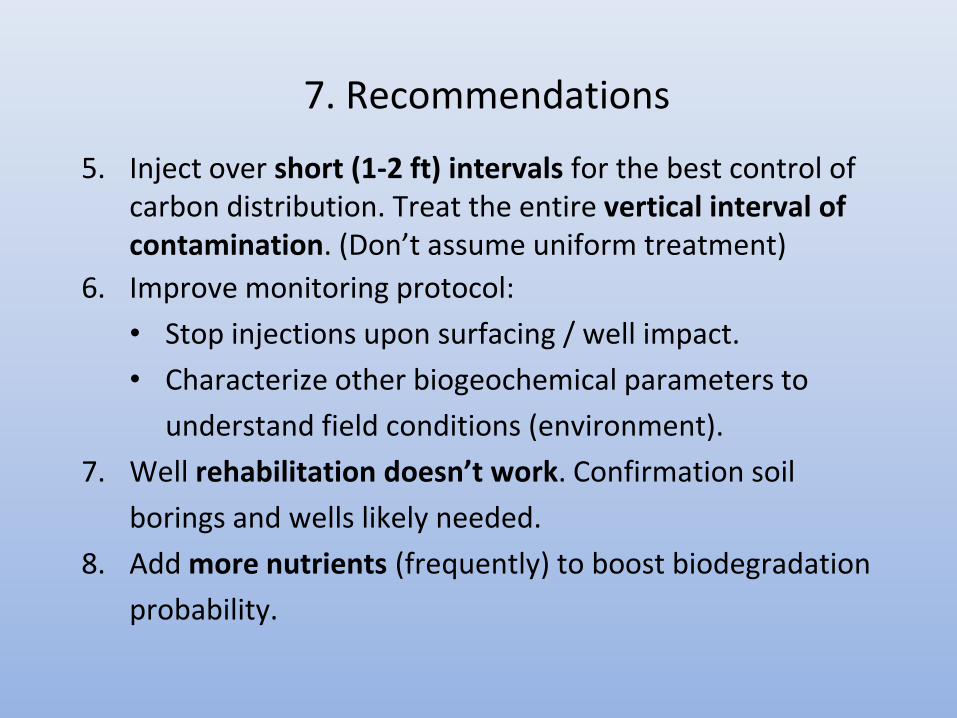
5. Inject over short (1-2 ft) intervals for the best control of carbon distribution. Treat the entire vertical interval of contamination. (Don’t assume uniform treatment)
6. Improve monitoring protocol:
• Stop injections upon surfacing / well impact.
• Characterize other biogeochemical parameters to
understand field conditions (environment).
7. Well rehabilitation doesn’t work. Confirmation soil
borings and wells likely needed.
8. Add more nutrients (frequently) to boost biodegradation
probability.
7. Recommendations

Conclusions
CBI is a promising in-situ remedy for subsurface cleanup at UST sites.
Follow detailed assessment practices, particularly high resolution CSM.
Injection experience is critical.
Despite strong scientific principles, more research needed on the long-term effectiveness of contaminant adsorption/degradation in field applications.
Questions/Discussion
Thank You
Edward Winner
Kentucky DEP
Tom Fox
Colorado OPS