lessons learned in production cost management · lessons learned in production cost management ....
TRANSCRIPT

Lessons Learned In Production Cost Management
Presented at the 2012 SCEA/ISPA Joint Annual Conference and Training Workshop - www.iceaaonline.com

Lessons Learned in Production Cost Management
2
Background • A number of high profile acquisition programs
have experienced significant cost growth in recent years
• Today’s briefing focuses on the production aspects of cost growth • Costly techniques utilized in an attempt to recover
schedule • Inefficiencies associated with deferred work • Incentives that drive additional costs
• We will introduce a conceptual framework to illustrate the drivers for production cost growth and the reasons that EAC projections often underestimate production costs
• Finally, we will discuss approaches to better manage production cost growth and incentivize cost management
Lessons Learned in Production Cost Management Presented at the 2012 SCEA/ISPA Joint Annual Conference and Training Workshop - www.iceaaonline.com

3
Man
Hou
rs
Time Production Milestone I
Phase III Final Assembly and
Test
Phase I Component Assembly
Phase II Component Integration
Planned Delivery
A manning profile is used by production managers to represent planned production hours over time
Curve represents planned production workload to meet integrated master schedule
Majority of work is completed during this phase
Work ramps up during this phase
Work ramps down during this phase
Production Milestone II
Presented at the 2012 SCEA/ISPA Joint Annual Conference and Training Workshop - www.iceaaonline.com

4
For example, in shipbuilding the three major phases of production are associated with significant milestones
Post Launch Phase III
Final Outfitting
Detailing Dock tests and evaluation
Sea trials Modifications
Pre-Launch Phase II
Section assembly
Construction planning
Ship erection
Lay Keel
Block Erection Phase I
Pre-Fabrication of Sections
Equipment
Electrical cables
Pipes
Components
Presented at the 2012 SCEA/ISPA Joint Annual Conference and Training Workshop - www.iceaaonline.com
5
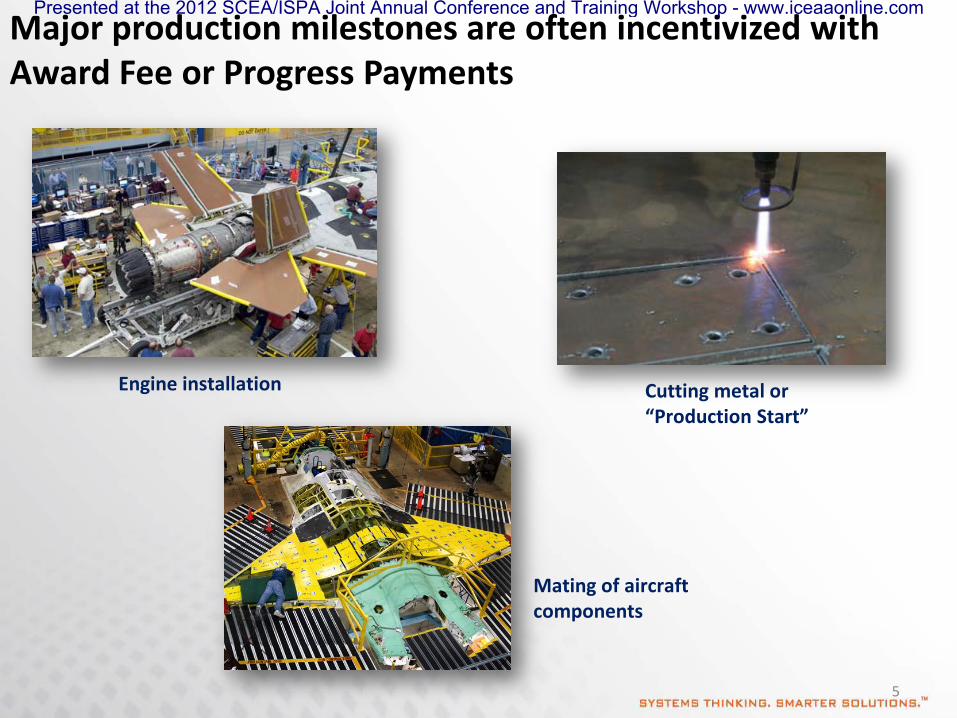
Engine installation Cutting metal or “Production Start”
Mating of aircraft components
Major production milestones are often incentivized with Award Fee or Progress Payments
Presented at the 2012 SCEA/ISPA Joint Annual Conference and Training Workshop - www.iceaaonline.com
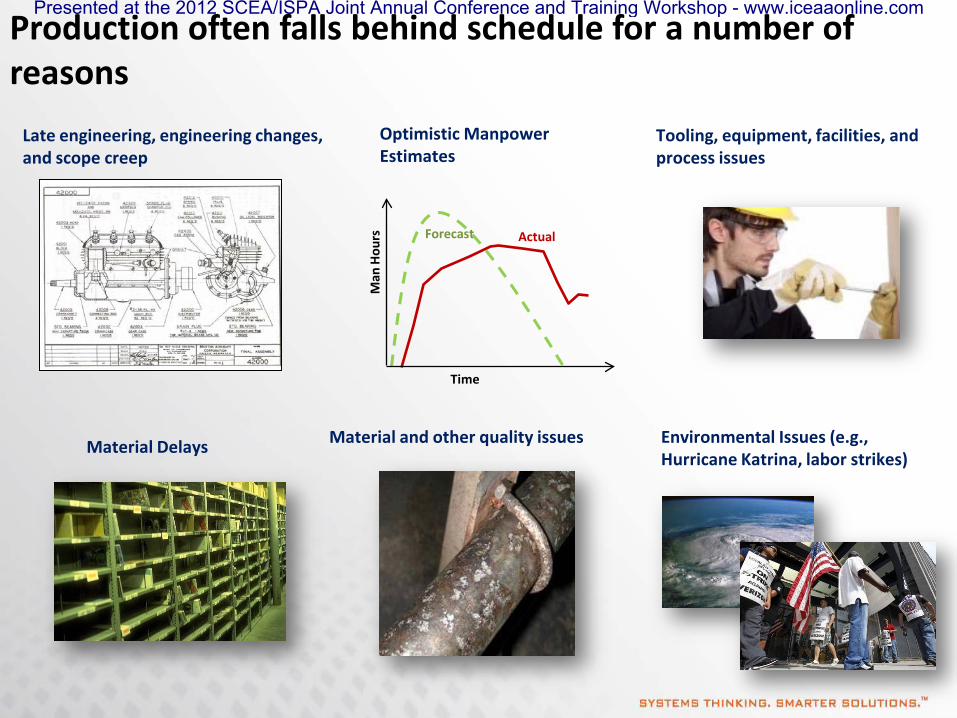
Production often falls behind schedule for a number of reasons
Late engineering, engineering changes, and scope creep
Material and other quality issues Material Delays
Tooling, equipment, facilities, and process issues
Optimistic Manpower Estimates
Time M
an H
ours
Actual Forecast
Environmental Issues (e.g., Hurricane Katrina, labor strikes)
Presented at the 2012 SCEA/ISPA Joint Annual Conference and Training Workshop - www.iceaaonline.com
7
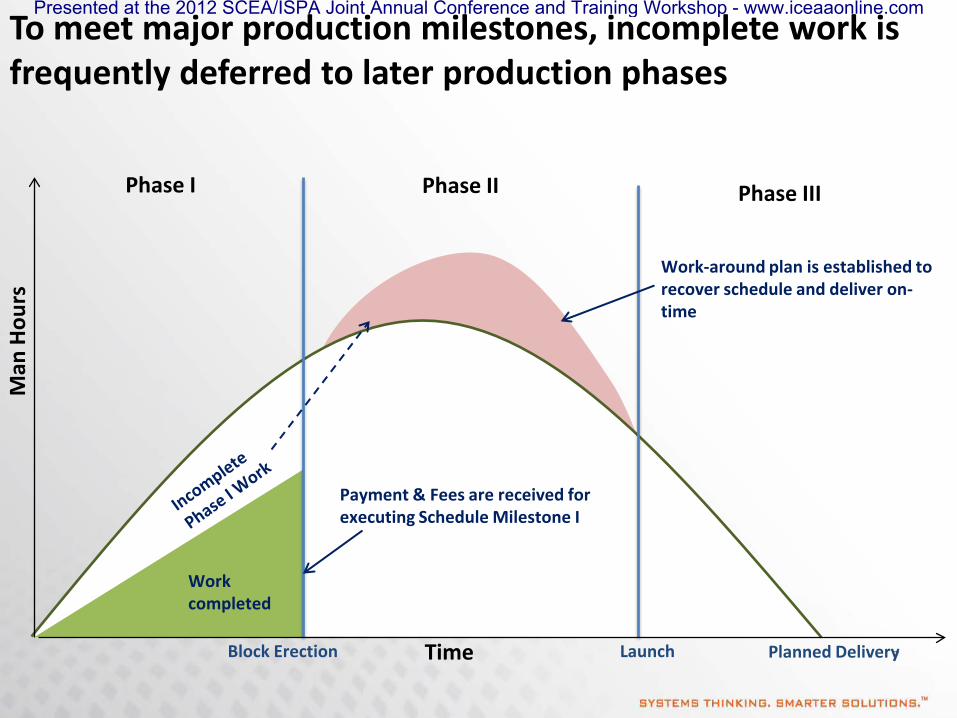
To meet major production milestones, incomplete work is frequently deferred to later production phases
Man
Hou
rs
Time Block Erection Launch
Phase III Phase I Phase II
Payment & Fees are received for executing Schedule Milestone I
Work completed
Planned Delivery
Work-around plan is established to recover schedule and deliver on-time
Presented at the 2012 SCEA/ISPA Joint Annual Conference and Training Workshop - www.iceaaonline.com

8
Work around plans incorporate approaches to recover schedule which result in inefficiencies
Changes to Manpower Plans
Increased Overtime
Increased Staffing / Added Shifts Deferring behind schedule work to later phases
Changes to Production Schedules
Completing work out of sequence
Compressing Schedule
Time
Finish Date
Original Plan
Common techniques used to recover production schedule
Revised Plan
Presented at the 2012 SCEA/ISPA Joint Annual Conference and Training Workshop - www.iceaaonline.com
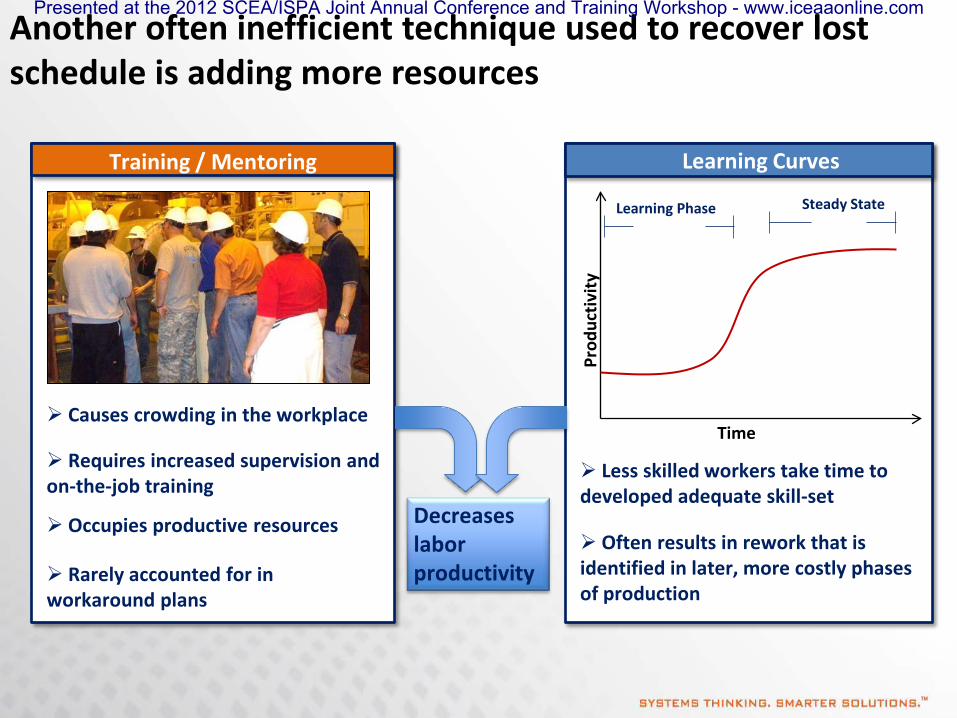
Another often inefficient technique used to recover lost schedule is adding more resources
Training / Mentoring
Rarely accounted for in workaround plans
Requires increased supervision and on-the-job training
Occupies productive resources
Causes crowding in the workplace
Learning Curves
Time
Prod
uctiv
ity
Learning Phase Steady State
Less skilled workers take time to developed adequate skill-set
Often results in rework that is identified in later, more costly phases of production
Decreases labor productivity
Presented at the 2012 SCEA/ISPA Joint Annual Conference and Training Workshop - www.iceaaonline.com

10
Overtime is effective in short bursts, but ineffective and costly when used throughout lengthy production phases
Source: Calculating Loss of Productivity Due to Overtime Using Published Charts – Fact or Fiction; Regula Bruines and Zey Emir
Labor productivity decreases throughout its duration of use
Overtime price premium is often understated because is doesn’t account for productivity loss
Presented at the 2012 SCEA/ISPA Joint Annual Conference and Training Workshop - www.iceaaonline.com

Deferring work and working out of sequence also causes a reduction in labor productivity and causes cost growth
Time
Interferes with planned work
Sub-optimal tool placement
Accessibility issues
Forces updates to IMS
Incurs time to review work around plans
Presented at the 2012 SCEA/ISPA Joint Annual Conference and Training Workshop - www.iceaaonline.com

12
For example, deferring a task like welding will require additional operations and time to complete
Welding Welding
Strip paint
Re-paint
Welding
Strip paint
Re-paint
Remove insulation
Repair & reinstall insulation
Completed as planned in Panel Line: 8 hrs.
Deferred to Pre-Outfit after paint: 40 hrs.
Deferred to Build Stage after compartment closeout: 80 hrs.
Presented at the 2012 SCEA/ISPA Joint Annual Conference and Training Workshop - www.iceaaonline.com

Plans for recovering schedule often fail because these inefficiencies are not taken into account
Optimistic plan to catch up on deferred work
Man
Hou
rs
Time Block Erection Launch Planned Delivery
Contributors to Deferred Work Inefficiencies
Added workload that is not accounted for in revised plan
Phase I Phase II
Presented at the 2012 SCEA/ISPA Joint Annual Conference and Training Workshop - www.iceaaonline.com

Inefficiencies make recovering schedule infeasible because it would require manning beyond a realistic level
Man
Hou
rs
Time Block Erection Launch Planned Delivery
Peak Manning Level
Work must be pushed to the right due to resource constraints
Phase I Phase III
Presented at the 2012 SCEA/ISPA Joint Annual Conference and Training Workshop - www.iceaaonline.com

Best Case Delivery
The deferred work must be pushed to the right due to resource constraints, thus impacting schedule
Man
Hou
rs
Time Block Erection Launch Planned Delivery
Phase I Phase II
Peak Manning Level
Phase III
Presented at the 2012 SCEA/ISPA Joint Annual Conference and Training Workshop - www.iceaaonline.com

16
Resource constraints will also likely prevent completion of Phase II work, further prolonging delivery
Man
Hou
rs
Time
Work completed
Incomplete work from Phase II
Block Erection Launch Planned Delivery
Peak Manning Level
Actual Delivery
Incomplete work from Phase I
Phase I Phase II Phase III
Presented at the 2012 SCEA/ISPA Joint Annual Conference and Training Workshop - www.iceaaonline.com

17
Managing milestone dates can limit cost growth without significantly impacting final delivery dates
Block Erection Launch Block Erection Launch
Fixed Schedule Milestones Flexible Schedule Milestones Vs.
Limits changes to manpower and use of OT, which reduces cost and total workload
More work is completed in phase when it is cost effective
Less work is deferred
Work that is deferred is completed out of phase when it is more costly to perform
Deferred work is affected by inefficiencies
Significantly delays final delivery
Encourages work to be deferred
Late delivery and cost overruns come as a surprise due to optimistic assumptions
Late delivery is expected and schedule changes represent a realistic and cost effective plan
Presented at the 2012 SCEA/ISPA Joint Annual Conference and Training Workshop - www.iceaaonline.com

18
Gold Card Formulas often fail to accurately project production EACs
Human Capital Management Workforce Development & Training Resource Modeling Knowledge Management
• EAC formulas rely on the use of past performance data to project future performance • Don’t fully account for production inefficiencies that result from deferred work,
overtime cost premiums / fatigue, and workaround plans • Early CPIs / SPIs are not as meaningful because many of the complex integration
tasks have yet to be worked • Tasks are often “cherry picked”, with difficult tasks being deferred to the last
minute resulting in inflated CPIs • Rework is more costly later in the production build cycle • Progress or % complete is often overstated early in the build cycle, inflating BCWP
Presented at the 2012 SCEA/ISPA Joint Annual Conference and Training Workshop - www.iceaaonline.com

19
Incentive Fee Criteria often lead to behaviors that drive up production costs
Incentive Criteria Negative Implications
Incentives focused on meeting near-term, schedule milestones
Maximizing near term Incentive Fee is prioritized over total program results
Milestones are executed before sufficient work is completed leading to costly deferred work
Administrative efforts consume excessive manpower Subjective/difficult to measure
Award Fee criteria
Contractors often achieve a high percentage of Award Fee despite poor overall performance
Quality is secondary to meeting schedule milestones
No measures of quality included in criteria
Presented at the 2012 SCEA/ISPA Joint Annual Conference and Training Workshop - www.iceaaonline.com

20
Incentives can be improved by emphasizing end of contract cost, schedule, quality, and performance criteria
Incentive Criteria Revised Incentive Approach
Incentives focused on meeting near-term, schedule milestones
Incentivize end of contract performance (i.e. results vice activity)
Subjective/difficult to measure Award Fee criteria
No measures of quality included in criteria Objective incentive criteria
utilizing an aggregate Award Fee pool
Hold 80% of Incentive to the end of contract and tie it to objective cost, schedule, quality, and technical performance
Base period incentives on successful completion of contract deliverables
Institute an objective scoring method that emphasizes cost, schedule, quality and/or technical performance
Aggregate/Objective Incentive Pool requires less administrative effort to manage
Presented at the 2012 SCEA/ISPA Joint Annual Conference and Training Workshop - www.iceaaonline.com

21
Below is an example of objective incentive fee criteria as applied to a missile production program
Presented at the 2012 SCEA/ISPA Joint Annual Conference and Training Workshop - www.iceaaonline.com

22
Near-term efforts can be balanced with long-term results by applying objective factors to a reserved “Incentive Pool”
Cost Factor
CPI based on original contract baseline + negotiated scope changes 0.80 =
Schedule Factor
(Planned Completion Date – Planned Start Date)
(Actual Completion Date – Planned Start Date)
350 Days
390 Days = = 0.89
Performance or Quality Factor % of Key Performance Indicator Achieved
80 Knots = = 0.75 60 Knots
0.81 ($10,000,000 x 80%) x = $6,480,000
% of incentive that is awarded at end of contract
Presented at the 2012 SCEA/ISPA Joint Annual Conference and Training Workshop - www.iceaaonline.com

23
Several metrics are indicators of potential production cost growth that require management attention
Actual OT vs. Plan Manning Level vs. Plan Productivity
20%
30%
Time Time
80%
Time
Performance Std.
Excessive overtime Leads to worker fatigue and reduced productivity Indicates that the baseline and / or recovery plan is not realistic Could indicate a shortage of needed skillsets
Manning levels over Plan Causes Crowding Reduces Productivity Increases Supervision / Management costs
Indicates overly optimistic or unrealistic planning assumptions Often results from costly approaches to recover schedule
Productivity below Plan
Presented at the 2012 SCEA/ISPA Joint Annual Conference and Training Workshop - www.iceaaonline.com
24
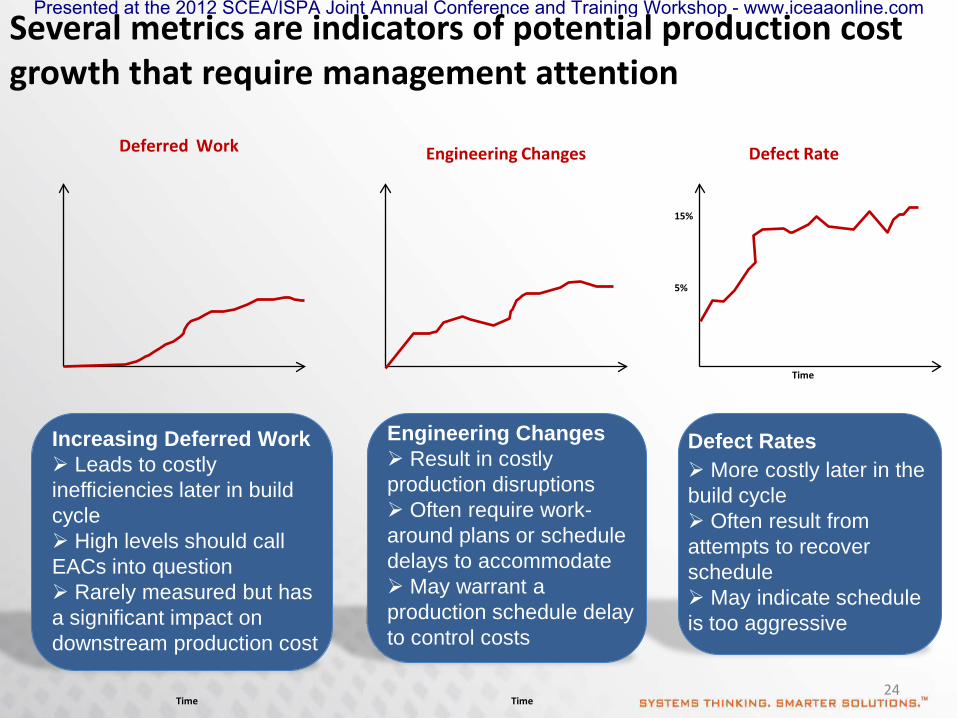
Several metrics are indicators of potential production cost growth that require management attention
Deferred Work Engineering Changes Defect Rate
Time Time
5%
15%
Time
Increasing Deferred Work Leads to costly inefficiencies later in build cycle High levels should call EACs into question Rarely measured but has a significant impact on downstream production cost
Engineering Changes Result in costly production disruptions Often require work-around plans or schedule delays to accommodate May warrant a production schedule delay to control costs
More costly later in the build cycle Often result from attempts to recover schedule May indicate schedule is too aggressive
Defect Rates
Presented at the 2012 SCEA/ISPA Joint Annual Conference and Training Workshop - www.iceaaonline.com

25
• Techniques to recover schedule can lead to later schedule delays due to the increased workload associated with inefficiencies
• Program Managers need to closely monitor production metrics and adjust production schedules to control costs
• Revising the schedule early in the build cycle can reduce costs without dramatically impacting delivery dates • How much are we willing to pay to deliver 4
months late instead of 5 months late?
• Deferred work is rarely measured but may be one of the best predictors of production cost growth
• Incentivizing production milestones often increases deferred work and leads to cost growth
• Incentives should focus on end-results vice interim milestone achievement
Production Cost Lessons Learned Summary
Block Erection Launch
Deferred Work
Presented at the 2012 SCEA/ISPA Joint Annual Conference and Training Workshop - www.iceaaonline.com

Questions?
26
Contact Us
Presented at the 2012 SCEA/ISPA Joint Annual Conference and Training Workshop - www.iceaaonline.com