lester die cast report - spintekspintek.com/pdf/lester_final-2.pdf · lester generates a complex...
TRANSCRIPT

1
Die Casting Waste Water Treatment Using a Membrane Process
Die Casting Waste Water Treatment Using a Membrane Process
Eric S. Peterson*, Jessica Trudeau**, and Bill Cleary**, William A. Greene***
*Idaho National Engineering and Environmental Laboratory P.O. Box 1625
Idaho Falls, Idaho 83415-2208
**Metal Dyne, Inc. Lester Precision Die Casting, Inc
8001 Bavaria Road Twinsburg, OH 44087
***SpinTek Filtration, Inc.
10815 Portal Drive Los Alamitas, CA 90720

2
OUTLINE ABSTRACT INTRODUCTION TECHNICAL APPROACH EXPERIMENTAL-LABORATORY
Testing Procedure
RESULTS -LABORATORY Static Test Cell (STC) membrane testing results. Conclusions from STC Testing ST- II L Testing Results Chemical Analyses. Static Nanofiltration Testing Results. Chemical Analyses. Operating Cost Analysis for a Rotary Membrane System at Lester Die Casting
EXPERIMENTAL-FIELD DEMONSTRATION
Testing Procedure-Field Demonstration Chemical Analysis
RESULTS
Test Data Summary of Test Results
DISCUSSION PROJECT SUMMARY ACKNOWLEDGEMENT

3
ABSTRACT
Water treatment is a major separations challenge for all industrial water users. The die casting industry uses water to cool and carry lubricants to their metal casting dies, and some of the water drips onto the plant floor. Lester Precision Die-Casting (Lester) is generating a complex wastewater stream from their manufacturing operation consisting of various oils, hydrocarbons, heavy metals, and silicones that make it unsuitable for direct discharge to the environment. The treatment of manufacturing wastewater requires a simple, rugged and durable treatment process. The system must be capable of handling a wide compositional range, and varied concentrations, of wastewater components and still consistently provide purified water suitable for reuse or discharge. The purification system must remove large solids present in the wastewater while also removing very small organic detergent and detergent-like molecules, and specific organic chemicals. In addition to purifying the wastewater, the system must be able to concentrate the feed water contaminants to a thick slurry to minimize the total amount of stored waste for subsequent disposal. An existing treatment process is currently being used to treat this water which consists of a biodigester, tubular ultrafilter and reverse osmosis system. Contaminants in the feed stream cause a number problems including fouling of the surface of the ultrafilter and reverse osmosis systems. Fouling of the membranes translates to inconsistent unreliable system operation coupled with excessively high operating costs. An active-surface membrane technology for addressing this challenge was implemented by a team from Lester, Filtration Systems, Inc., and Idaho National Engineering and Environmental Laboratory. Reported in this paper are some of the team’s observations. Active surface ultrafiltration membranes reduced organics from initial Oil and Grease contents by 20 – 25X, COD by 1.5 - 2X, TOC by .6, while the BOD remains the same. As organic retentate concentrations increased the permeate concentrations of the organics remained remarkably similar to their original concentrations. The active surface ultrafiltration membranes showed reduced total metals concentrations in the permeates, while several (lead, and copper) become detectable in the rejectate with increasing concentration of the organic phase. These increased metals concentrations probably indicate that the metals preferred to stay with the organic components of the concentrates. The active surface membranes were not fouled as badly as non-active surface systems (in the timeframe of these experiments). The active surface membrane flux levels are consistently higher and more stable than non-active surface membranes tested (in the same timeframes). This paper reports the results of the bench-scale experiments coupled with pilot-scale studies that have been performed to separate the water, metal ions, and oils and greases.
4
INTRODUCTION
Increased awareness of both environmental and energy needs has resulted in significant efforts in both industrial and governmental sectors to develop energy efficient separations processes.1,2 The Idaho National Engineering and Environmental Laboratory’s Inorganic Membrane Technology Research Program (INEEL-IMTRP) is an ongoing Department of Energy (DOE) effort to develop such energy efficient membrane processes in collaboration with industry. Membranes are energy efficient separation systems when compared to traditional phase separation processes such as distillation. The immediate problem for membranes is that many of the available commercial materials degrade in the harsh thermal and chemical environments frequently encountered in industrial settings. The INEEL Program has traditionally focused upon polymeric membrane separations.3,4, 5,6,7, 8, 9,10,11 Recently, however the Program has begun working in the area of filtration and teamed with Lester Precision Diecasting, Inc. (Lester) a division of Metaldyne, Inc. and Filtration Systems, Inc. (Filtration Systems) to develop a means of performing water die casting solution separations.
Lester generates a complex waste stream of soaps, detergents, oils, hydrocarbons, heavy metals and silicones. They would like to process this waste to generate clean water suitable for reuse in the manufacturing process and concentrate the contaminants for subsequent disposal, ultimately leading toward a closed plant. This problem is prevalent in the metal casting industry and there are many applications for a reliable process that can effectively process this type of waste water.
The treatment of manufacturing wastewater requires a simple, rugged and durable treatment process. The system must be capable of handling a wide compositional range, and varied concentrations, of wastewater components and still consistently provide a purified water suitable for reuse. The purification system will need to remove large solids present in the wastewater while also removing very small organic molecules of detergents, other surfactants, and specific organic chemicals. In addition to purifying the wastewater, the system must be able to concentrate the feed water contaminants to a thick slurry to minimize the total amount of stored waste for subsequent disposal. Several sources of technology that might meet these requirements are available.
TECHNICAL APPROACH
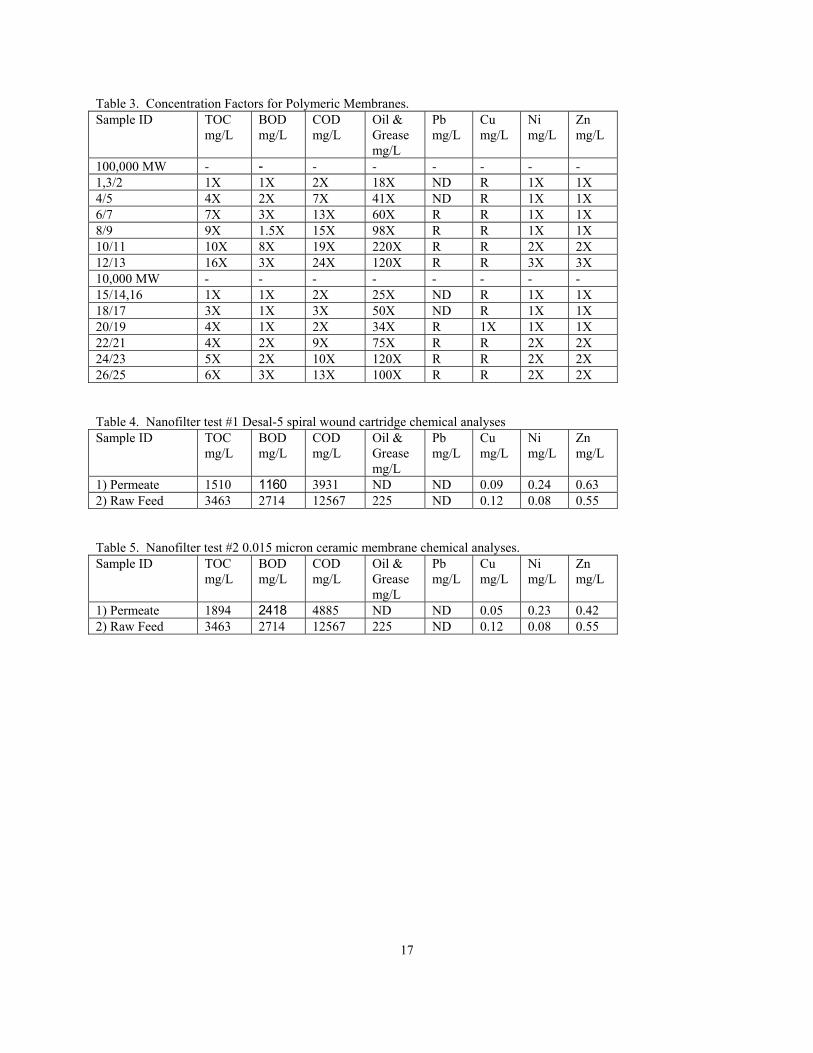
The approach Filtration Systems and INEEL proposed is the use of the ST-II rotary microfiltration system with 0.1 micron ceramic-stainless steel or polymeric composite membranes to remove all of the suspended solids, and many of the organic contaminants (Figure 1). If necessary, the filtrate from the ST-II could be polished by a nanofiltration system to remove smaller organic chemicals from the wastewater. This approach has been followed and the results of the filtration processes are summarized in this paper.
The work on this program consisted of two separate phases. In Phase I (Laboratory) work samples of the wastewater solution was tested in the laboratory on a small flat sheet test system and a single disk rotary filter.
Phase II (Field Demonstration) was the operation of two (2) five disk ST-II rotary microfilters..

5
EXPERIMENTAL-LABORATORY
Filtration Systems, Inc. (Filtration Systems) assembled two test platforms consisting of a membrane filtration system and a pumped skid. Both of the systems were bench scale, and were used to collect data for process applicability on wastewater provided by Lester Die Casting.
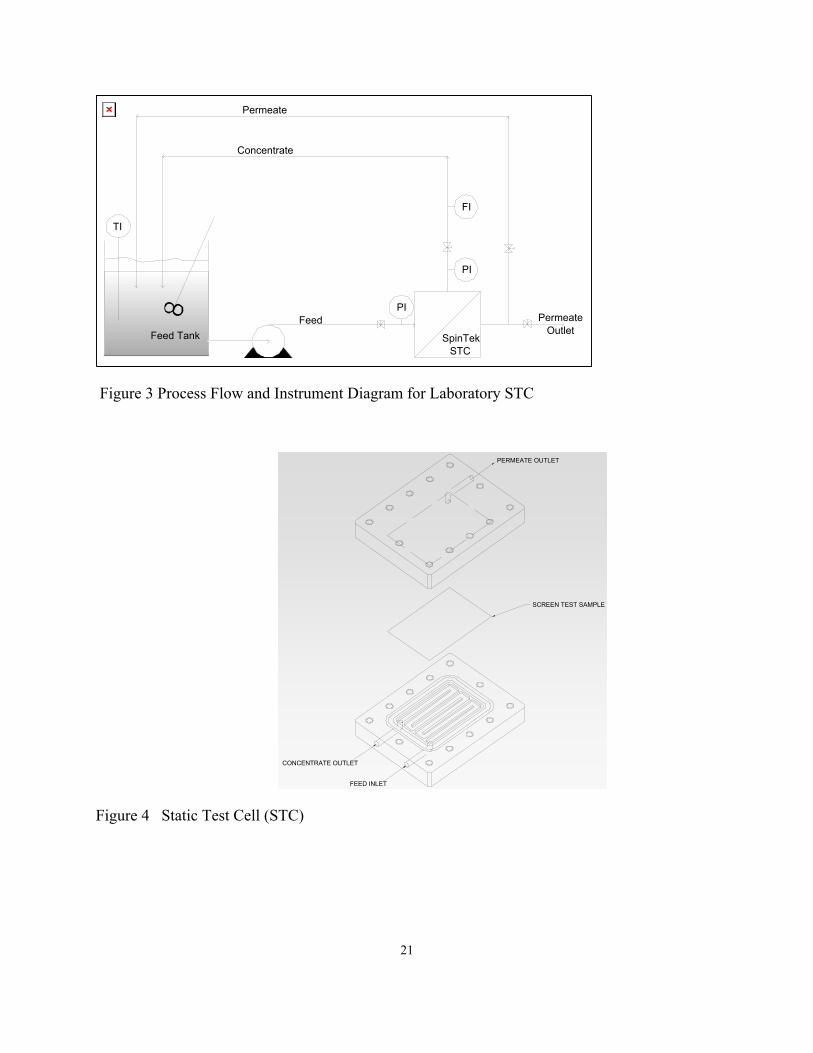
The Static Test Cell (STC) membrane test system provided by Filtration Systems contained one flat sheet membrane test sample. These specialized membranes are also used in the full scale ST-II Rotary Membrane System. The major difference between the two systems is the shear generated at the surface of the membrane. The STC is a static membrane, while the ST-II uses a membrane disk rotating at high velocities to generate shear. The STC system used a test sample wit a volume of approximately two liters and the membrane was fed using a double diaphragm pump.
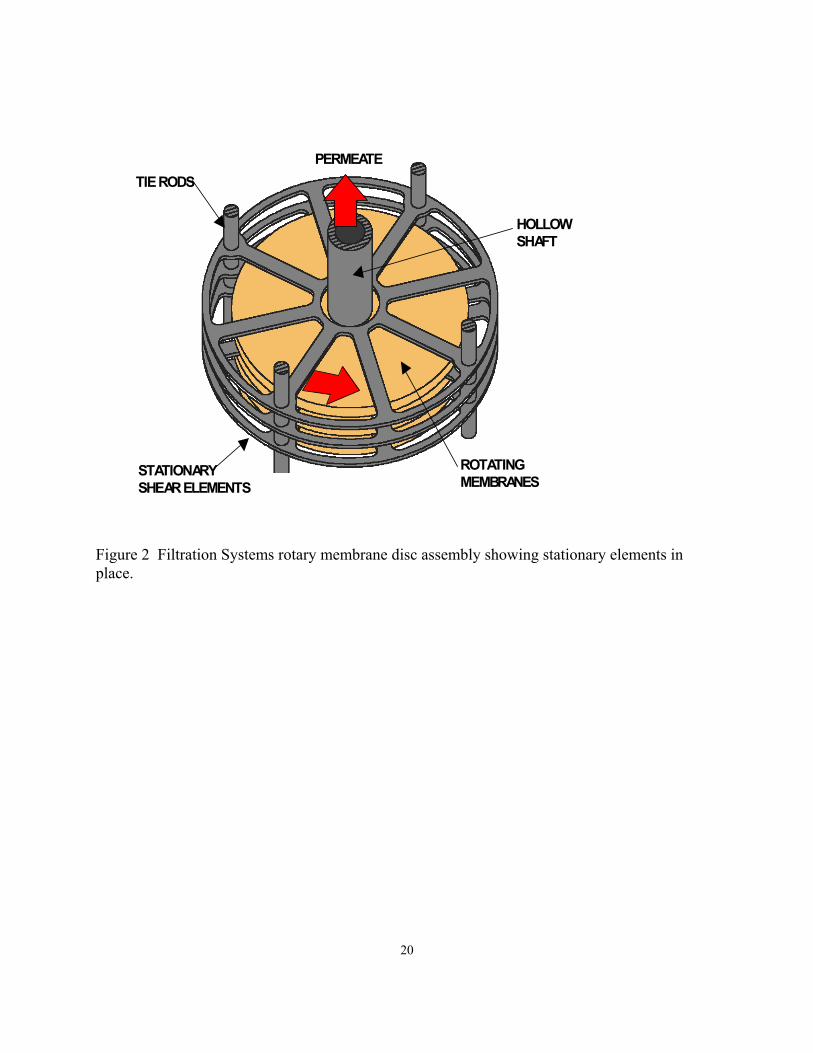
The ST-II rotary membrane system is manufactured by Filtration Systems. This unit has one to twenty five spinning membrane disks with 1.0 ft² of membrane area per disk. These units may be placed in series or parallel, as needed, to obtain the desired membrane surface area. The membrane used in the ST-II is constructed of various materials made into a disc shaped membrane. The disk consists of a central Ryton™ core that is overlaid with a permeate carrier. The disc-carrier system is then overlaid with a selective filtration membrane and the entire assembly glued with appropriate adhesives (Figures 2, 2a). The ST-II can be fully automated including feed flow, pressure, temperature instrumentation, permeate flow rate, and all the necessary safety instrumentation. A variable frequency drive (VFD) was included to control the rotational rate of the membrane disc. The system used in these studies has the capability to perform automated data logging of the above instrumentation.
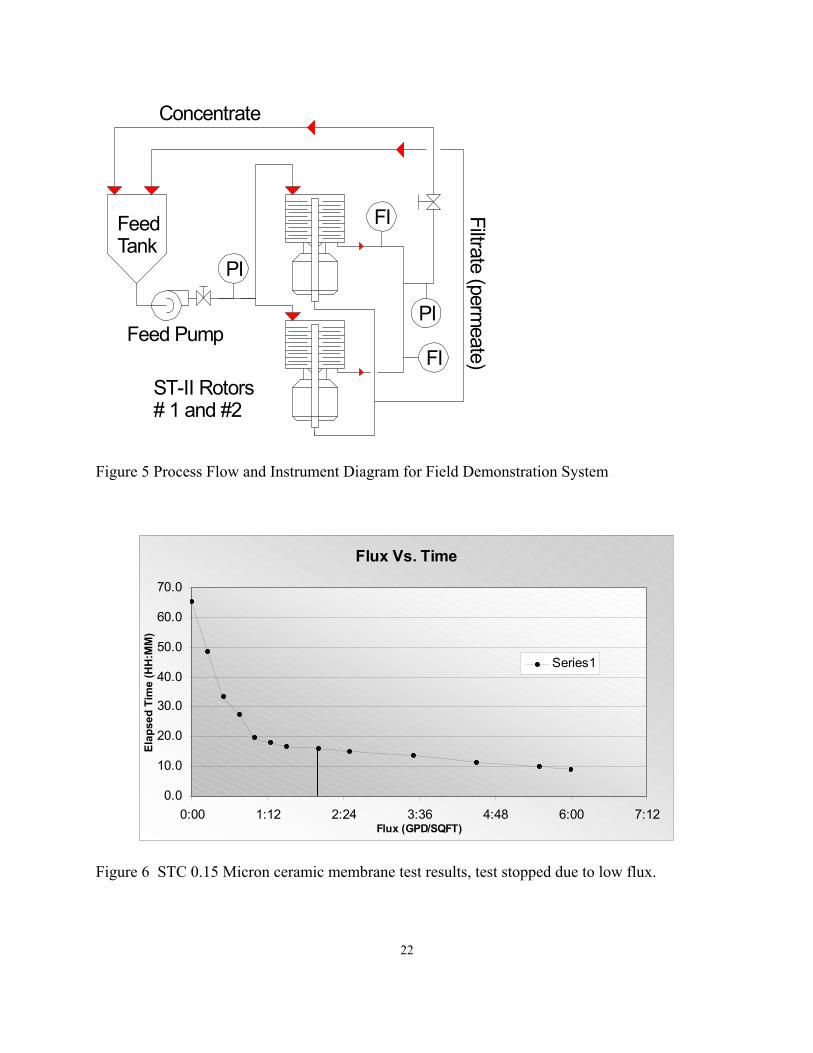
A general layout of the bench-top STC testing equipment (STC) is shown in Figures 3 and 4. The process solutions were pumped from the feed tank to the STC membrane system. A feed pump-throttling valve was used to control the flow to the system. A back-pressure control valve was used to maintain a constant pressure on the membrane system. A general layout of the pilot testing process equipment is shown in Figure 5. The process solutions were pumped from the feed tank to a bypass line and the ST-IIL membrane system. Throttling valves on the bypass line and the membrane feed line were used to control flow through the respective process piping. A valve on the concentrate line of the ST-IIL was used to maintain a constant pressure on the membrane system. The temperature was controlled using heaters set up in the feed tank, along with a heat exchanger on the feed bypass line.
Testing Procedure
The feed solution was pumped from the 55-gallon drums (supplied by Lester/Metal Dyne) into a feed tank equipped with an agitating stirrer. The agitating stirrer was used to assure good mixing of the feed solution prior to its circulation in the membrane testing systems (STC, or ST-IIL).
6
The feed tank was held at constant temperature as indicated in the data tables. The mixer was allowed to run throughout the testing procedure. The feed was pumped through the membrane system as indicated in the data tables. During testing the data was recorded every fifteen minutes, or as needed. Units for the measurements were those normally used in filtration applications. Membrane fluxes are defined below in equation 1.
Flux = Filtrate Flow Rate (gallons per day) Square Foot of Membrane
RESULTS -LABORATORY
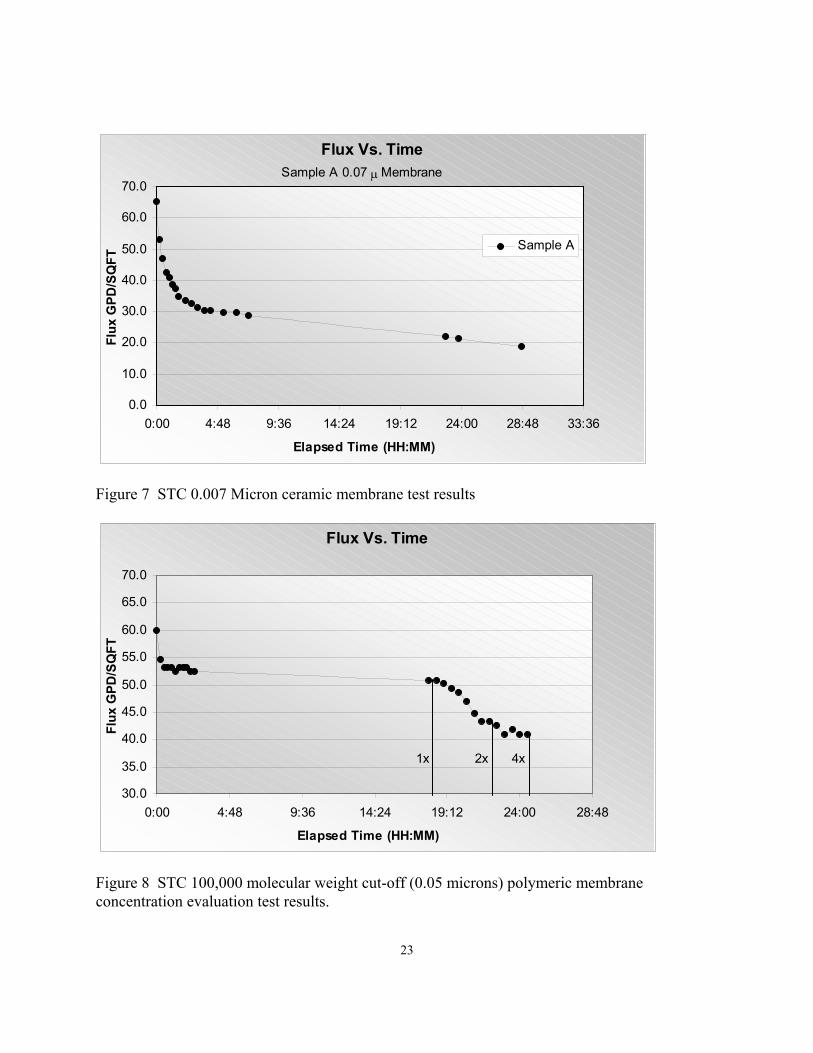
Static Test Cell (STC) membrane testing results. The testing results are summarized for each set of experiments in Figures 6 - 8 for the Static Testing Cell (STC). Conclusions from STC Testing Based upon the Static Test Cell (STC) testing results, shown above in Figures 6-8, we concluded that the unexpected fouling and flux decline problems encountered using the ceramic –stainless steel composite membranes, Figures 6 and 7, suggested that we not pursue them any further. Initially, no concentration work was pursued using the stainless steel composite ceramic membranes because a stable flux was not obtained. The results of our experiments with the polymeric membranes, shown in Figure 8, suggested that we pursue these membranes and their relatives for the Lester water treatment process. Thus the polymeric membranes were slated for further evaluation on the ST-II rotary membrane. Later in the study we did pursue the stainless-steel ceramic composite membranes due to the low durability associated with the polymeric membranes in Lester’s particular feed stream. ST- II L Testing Results The polymeric membrane testing on the ST-IIL was performed using two different polyvinylidene fluoride-based membranes. In the first set of tests (designated as ST-II-I Tests, and ST-II-I Tests 2, respectively), a 100,000 molecular weight cut-off (0.05 micron, 400 angstrom mean pore diameter), ultrafiltration membrane was used. For the second set of tests (designated ST-II-I-10K-Test 3) a “tighter” pore sized ultra/nanofiltration membrane was used with a 10,000 molecular weight cut-off (0.005 microns, 40 angstrom mean pore diameter). One should recognize that these two membranes were manufactured by different manufacturers, and the pore sizes probably are not exactly what they are specified in relationship to one another which probably has led to the unusual results presented in this paper. The results of the experiments are presented in Figures 9 - 14. At the completion of each of these experiments the permeate solutions were allowed to stand overnight before being delivered to the analytical labs. During this time, significant hydro-gel-like precipitates formed in the permeate solutions. The gels, speculatively, are hydrated aluminum and iron oxy-/hydroxy-species. It has also been found that the gels are very pH sensitive, and dissolve immediately with drop wise additions of acid in one-liter samples. Due to the complex nature of the solutions that have been evaluated
7
(i.e. high aluminum and zinc contents) the chemical analyses required greater time to accomplish than originally anticipated. Prior to submission for analysis all samples were acidified with to assure that all metal ions were dissolved in the solutions. Chemical Analyses. Truesdail Laboratories, Inc., Tustin, CA, a commercial EPA certified laboratory, performed chemical analyses on the samples resulting from the testing. The data are summarized in Tables 1 and 2 below. The concentration factors for each of the components are summarized in Table 3. The large number and volume of samples taken at high concentrations for laboratory analysis in Test A resulted in the raw feed that remained having slightly lower concentrations for Test B. This resulted in reduced metals, and organics in the concentrates, but should have had no effect on the permeate analysis. Static Nanofiltration Testing Results. A nanofiltration polishing step was also evaluated to remove the remaining metal ions from the solution. The original assumption for the project was that under the conditions at Lester’s plant (pH, etc.) the metal ions would be clustered in larger globules within the organic phase. Therefore, one could assume that a nanofilter would be adequate to remove the metal ions from the stream. This work has, to our surprise, shown that this assumption was incorrect. Additionally work to evaluate a reasonable cleaning procedure, outlined above in the “Procedures” section of this report, was performed. The results of this work are presented in Figures 15 - 18. Chemical Analyses. Truesdail Laboratories, Inc., Tustin, CA, a commercial EPA certified laboratory, performed chemical analyses on the samples resulting from the testing. The data are summarized in Tables 4 and 5 below. Operating Cost Analysis for a Rotary Membrane System at Lester Die Casting The operational cost analysis for a rotary membrane system in the Lester Die Casting application is summarized in Table 6. The active surface ultrafiltration membranes can reduce organics found in the die-casting solutions substantially. The initial oil and gease by 20 – 25X, COD by 1.5 - 2X, TOC by .6 , while BOD remained the same. As the organic retentate concentrations increased the permeate concentrations of the organics remained remarkably similar to their original concentrations. This speaks for an equilibrium being reached and the membrane pore size being very stable. Thest studies have shown that active surface ultrafiltration membranes can reduce total metals in a die casting waste solution. The metals concentrations are reduced significantly, while several (lead, and copper) become detectable with increasing concentration of the original solutions. The metals were found to increase in concentration in the concentrates probably indicating that they preferred to stay with the organic components of the die casting solutions. The active surface membranes were observed to exhibit less fouling tendency than the non-active surface
8
systems (in the timeframe of these experiments - longer-term pilot studies are needed to evaluate this point). The fluxes of the active surface membrane were consistently higher and more stable than non-active surface membranes tested. We observed that using polymer materials for the active surface membranes provided surprisingly high fluxes and high quality separations. However durability of the polymers became an issue for these systems later in the evaluations, and the inorganic membranes were substituted into the systems for this reason. Lester’s previous studies with ultra filtration followed by reverse osmosis yielded significant problems with membrane fouling by oils, greases, and a material with the consistency of lip stick. The active surface membrane systems showed no significant amount of the “lipstick” observed by Lester in their previous systems. A cleaning procedure for the ultra filtration membranes using detergents was developed in these experiments, and implemented. The process worked well. The preliminary studies with static nanofiltration membranes/modules as a polishing step provided very small to no concentration of metal ions. A true reverse osmosis membrane, such as those already installed at the die casting plant would be most appropriate for a polishing step.
9
EXPERIMENTAL-FIELD DEMONSTRATION
After the successful completion of Phase I, SpinTek fabricated a system consisting of two (2) 5-disk ST-II rotary microfilter units, a feed pump, storage tank, associated piping and valves, and a fully automatic control panel. The system allowed for the continuous operation of the ST-II filter on wastewater and for the concentration of the feed sample to high levels. The feed solution must be concentrated to a 20x level for recycling into the die cast machines. The 500-gallon feed tank allowed for this concentration to occur and still have enough feed solution to operate the ST-II feed pump and rotors.
The feed and filtrate are both returned to the feed tank during initial operation. After the system has stabilized the filtrate line is removed from the feed tank. The removal of the filtrate results in the concentration of the feed in the tank. The two (2) 5 disk systems have ceramic microfiltration membranes with a pore size of 0.2 microns. The ceramic membranes were mounted on Ryton™ disks. Testing Procedure-Field Demonstration 500 gallons of fresh die lube wastewater is added to the feed tank. The filtrate and concentrate were recycled back to the feed tank until performance was stabilized. The filtrate line was then withdrawn from the feed tank and the feed solution was concentrated to the target 20X concentration. It was decided that during one of the tests the feed would be concentrated to 98%+. 98% is the maximum concentration possible due to the hold up volume requirement of the system and equates to a 50x concentration. Depending on the performance of the system it would be decided in the field whether to clean the membranes prior to the start of another concentration run. Chemical Analysis
After flushing the STI-II system with fresh water the feed tank was filled with soft water and the concentrate and permeate recycled back to the tank. After 3 hours of this recycle the permeate was analyzed for COD and the level was 6700 mg/l. After 5 hours, 30 minutes the permeate was again analyzed and had a level of 4400 mg/l of COD.
10
RESULTS
Test Data
Test Run #1
Operation on feed resulted with an initial flux of 34 gfd and ending at 38 gfd. The feed volume of 655 gallons was reduced 51% to 334 gallons in 9 hours of operation.
To the feed tank 50 gallons of city water were added. The flux increased to 45 gfd after 6 ½ hours. After flushing with warm city water the flux increased to 55 gfd.
After a return to service the flux increased to 101 gfd after 15 minutes and was then flushed with city water for a flux of 118 gfd.
The system was washed for 4 hours and the flux started at 44 gfd but was reduced to 41 at the end of the wash. A fresh water flush slightly reduced the flux to 39 gfd.
A subsequent wash of 9 hours did not increase the flux nor did a 5 minute rinse with soft water.
The system was then cleaned with butyl cellusoll (BC) for thirty minutes. The starting flux was 41 gfd and finished at the completion of the cleaning at 85 gfd. The flux remained at 85 gfd after a 5 minute flush.
System pressure remained constant during the test at 50-56 psig inlet pressure and 47 psig on the concentrate.
Test Run #2
Run #2 started after the completion of the cleaning in Test Run #1. The initial flux of the system on feed was low at 25 gfd and remained there during a short run of 1 hour.
Pressure during this service run was 54/49 (psig feed/concentrate).
The system was flushed and then cleaned with MC-4 (caustic 5%) and BC (3%) to 32/26. The cleaning lasted 2 1/4 hours and flux increased to 132 gfd. Pressure of the cleaning solution was increased to 52/41 and flux increased to 246 gfd.
The membranes were then soaked and the flux remained at 246 gfd. The system was flushed with water at 52/42 and the flux lowered slightly to 230 gfd.
The system and feed tank was flushed and refilled with water. To the water 5% of hydrochloric acid was added. At a low pressure of 32/25 the flux started at 164 gfd and ended at 246 gfd after 2 hours.
Pressure was increased to 42/32 and the permeate was too high to measure by the flow meters.
11
After 5 minutes the pressure was increased to 52/39 and the flux was reduced to 396.
The test was completed when a case bolt on one of the ST-II systems began to leak.
Test Run #3
Membranes were flushed with water for 25 minutes at 58/37 and the flux was 58 gfd.
500 gallons of fresh feed was introduced into the feed tank. The system was started at 59/38 and ran for 2 ½ hours with an average flux of 55 gfd.
The system was flushed with water and let sit overnight. The 500 gallons of feed had been reduced to 450 gallons.
The system was restarted in the morning and operated for 6 ¼ hours at 48/31 and flux was stable at 49 gfd.
System was flushed with water and shut off for the night.
System restarted in the morning for an operated for 7 hours at 48/31 and flux was stable at 46 gfd.
Further tests were performed with apparently low flux but this was due to one of the rotors being off. A fuse had blown and operators were unaware of this until the test was completed.
The test was ended with a concentration of 1.4x.
Test Run #4
Prior to Test Run #4 the membrane disks were removed from the system and hand washed with a Safety-Kleen solvent, MC-4 (alkaline cleaner), and a alcohol/glycerin solution.
The system was then flushed with water for 10 minutes and the flux was 163 gfd @ 76/52 pressure.
The feed tank was filled with 500 gallons of fresh feed and concentrated to 25 gallons (20x) in 26 hours. The pressure was 50/34 and the flux began at 75 gfd and completed the concentration run at 63 gfd at the 20x concentration.
The system was flushed with water and the flux was 135 gfd after 2 minutes.
Test Run #5
This test was started without cleaning the membranes from the previous run. The membranes were only flushed with water.
A 500 gallon feed solution was reduced to 25 gallons with pressure at 50/35. The flux began at
12
73 gfd and ended at 54 gfd.
The system was flushed with water and the flux was 97 gfd at a pressure of 42/28.
The pressure was increased to 50/35 and the flux increased to 135 gfd.
Test Run #6
This test run was started without cleaning the membranes from Test Run #5.
The run started with 500 gallons of fresh feed and was reduced to 10 gallons (50x).
Pressure was 50/35 though most of the run.
The flux started at 61 gfd and continually rose to 81 gfd at a concentration of 6x. The flux then started to decrease from 52 gfd at 20x and finally 29 gfd at 50x. The entire concentration run lasted 32 hours.
The system was flushed with water for 5 minutes and the flux was 31 gfd.
Membranes were flushed with Safety-Kleen solvent and then water and flux increased to 128 gfd at 50/35 psig.
Test Run #7
A fresh 500 gallon feed solution was added to the tank and concentrated to 25 gallons (20x).
The flux started at 50 gfd and ended the run at 48 gfd. Pressure started at 50/33 and reduced to 42/29 at 1.2x for unknown reasons. The entire concentration run lasted 36 hours.
The membranes were flushed with water and flux increased to 105 at 50/35.
The membranes were then soaked in butyl cellosolve for 10 minutes and flux increased to 237 at 50/33 psig.
Test Run #8
A fresh 500 gallon sample of feed was reduced to 25 gallons (20x) and flux started at 91 gfd and ended the run at 51 gfd at a pressure of 50/21. It was later determined that the low concentrate pressure of 21 was an incorrect reading by a faulty pressure gauge. The entire concentration run lasted 35 hours.
The membranes were flushed with water and flux increased to 109 at 50/21 psig.
Test Run #9
13
A fresh 500 gallon sample of feed was reduced to 25 gallons (20x) and flux started at 112 gfd and ended the run at 58 gfd at a pressure of 50/35. The entire concentration run lasted 22 hours.
The membranes were flushed with water and flux increased to 83 at 50/35 psig.
Test Run #10
The run started with 500 gallons of fresh feed and was reduced to 25 gallons (20x). Pressure was 50/35 though the run. The entire concentration run lasted 29 hours.
The flux started at 65gfd and ended at 62 gfd at a concentration of 20x.
The system was flushed with water for 5 minutes and the flux was 31 gfd.
Test Run #11
This test run was started without cleaning the membranes from Test Run #10.
The run started with 500 gallons of fresh feed and was reduced to 25 gallons (20x). The entire concentration run lasted 47 hours.
Pressure was 50/35 though the run.
The flux started at 48 gfd and ended at 25 gfd at a concentration of 20x.
The system was flushed with water for 5 minutes and the flux was 39 gfd.
Membrane Cleaning After Test Run #11
The system was first flushed with water at 50/35 and the flux was 32 gfd.
The membranes were then cleaned with MC-4 which is an alkaline cleaner and the flux dropped to 6 gfd and 50/35 psig.
The system was flushed with water at 50/35 and the flux increased to 25 gfd.
The system was then cleaned with Ultrasill for 16 minutes and the flux increased to 151 gfd.
After the Ultrasill cleaning the system was flushed with water and the flux was 177 gfd at 50/36 psig.

14
Summary of Test Results
Test # Cleaning Flux Start
Flux End Final Conc
1 BC 34 38 2x 2 BC, MC-4 164 Water 3 BC, MC-4 49 46 1.1x 4 SK, MC-4,A/G 75 63 20x 5 None 73 54 20x 6 None 61 29 50x 7 None 50 48 20x 8 BC 91 51 20x 9 None 112 58 20x 10 None 65 62 20x 11 None 48 25 20x
Cleaning = This was the solution used to clean the membrane prior to starting the concentration run. Flux = gallons of filtrate per square foot of membrane over 24 hours. BC = butyl cellusolve MC-4 = alkaline cleaner A/G = alcohol and glycerin mixture At the completion of Test #11 the membranes were cleaned and clean water flux increased to 174 gfd.
15
DISCUSSION
Laboratory testing demonstrated through small flat sheet membrane and rotary filter testing that the technology was a good candidate for field testing.
In field testing the die lube solution was successfully concentrated with successive test runs meeting the target of 20x concentration. On one test the solution was concentrated to 50x but the low flux of the membrane between 20x and 50x was too low for commercial implementation.
The filtrate in the entire test runs were very clear indicating satisfactory die lube removal by the ceramic membranes.
Several runs were conducted without cleaning from the previous run that would be beneficial in full-scale implementation of the system. The plant desires to minimize the need for cleaning and the resulting waste a cleaning generates.
After testing the membranes were examined and they had no apparent damage due to abrasion or the effects of the die lube solution.
PROJECT SUMMARY
These studies show that the oil and water mixtures produced by the Lester Plant can be cleaned up using active surface membrane technology with care taken to insure the process is well characterized. The metals content of the solutions can be reduced significantly using tight ultrafiltration active surface membranes. However significant hydro-gel-like precipitates form in the permeate solutions upon standing. The gels speculatively are hydrated aluminum and iron oxy-/hydroxy-species. It has also been found that the gels are very pH sensitive, and dissolve immediately with drop wise additions of acid in one-liter samples. Due to the complex nature of the solutions that have been evaluated (i.e. high aluminum and zinc contents) the chemical analyses required greater time to accomplish than originally anticipated. The proposed second step of nanofiltration to polish the effluent was shown to provide only slight concentration of the metal ions in the solution. The results of the experiments were encouraging because permeates from the nanofiltration system are clear, colorless, and show only slight discoloration and no significant gel precipitation upon standing. Field testing of the ST-II system showed very promising results. A series of 11 tests were conducted and the feed solution was concentrated to the target of 20x. During all of these tests the filtrate was very clear indicating nearly complete removal of the die cast material. One test further concentrated the feed to 50x but the filtrate throughput from 20x to 50x was too low for commercial use. At the completion of the tests the membranes were successfully cleaned and flux recovered.

16
ACKNOWLEDGEMENT
The work described in this paper was supported by the United States Department of Energy, Office of Industrial Technology through Contract No. DE-AC07-76ID01570. We also wish to express our sincere thanks to ATOCHEM, N.A. and Ethyl Corp. for their generous supplies of polyphosphazene polymer for these studies Eric S. Peterson*, Jessica Trudeau**, and Bill Cleary**, William A. Greene*** Tables Table 1. Test A 100,000 MW Cut-off polymeric membrane ST-II-L Tests Chemical Analyses. Sample ID TOC
mg/L BOD mg/L
COD mg/L
Oil & Grease mg/L
Pb mg/L
Cu mg/L
Ni mg/L
Zn mg/L
1)Initial Perm. 2108 2262 6296 11.2 ND ND 0.08 0.47 2) Raw Feed 3463 2714 12567 225 Nd 0.12 0.08 0.55 3) 1X Final 2143 2456 6174 12.7 ND ND ND 0.46 4) 4X Conc. 9287 6030 48230 490 ND 0.70 0.10 0.74 5) 4X Perm. 2272 2445 6456 12.0 ND ND 0.09 0.47 6) 8X Conc. 19637 8072 87928 634 0.36 1.44 0.15 1.00 7) 8x Perm. 2683 2277 6915 10.5 ND ND 0.09 0.52 8) 12 X Conc. 22518 3438 117498 1078 0.51 2.01 0.19 1.22 9) 12 x Perm. 2488 2295 7344 11.6 ND ND 0.11 0.51 10) 16X Conc. 29404 11789 163077 1538 0.70 2.80 0.22 1.38 11) 16X Perm. 2839 1558 8593 6.5 ND ND 0.10 0.54 12) 20X Conc. 43339 12250 206172 1.04 4.00 0.29 1.72 13) 20X Perm. 2680 4014 8725 12.4 ND ND 0.09 0.51 Table 2. Test B 10,000 MW Cut-off polymeric membrane ST-II-L Tests 3 Chemical Analyses. Sample ID TOC
mg/L BOD mg/L
COD mg/L
Oil & Grease mg/L
Pb mg/L
Cu mg/L
Ni mg/L
Zn mg/L
14)Initial Perm. 2406 2219 7393 11.3 ND ND 0.08 0.52 15) Raw Feed 3210 2416 11590 274 ND 0.11 0.10 0.54 16) Final Perm. 2211 1443 6758 13.8 ND ND 0.08 0.51 17) 4X Perm. 2206 2049 7115 5.6 ND ND 0.08 0.51 18) 4X Conc. 6504 3388 26060 294 ND 0.36 0.09 0.63 19) 8X Perm. 2388 2152 7012 18.4 ND ND 0.09 0.55 20) 8x Conc. 10380 3880 47890 634 ND 0.72 0.13 0.83 21) 12 X Perm. 2606 2611 7408 9.4 ND ND 0.09 0.57 22) 12 x Conc. 10572 4699 72370 713 0.33 1.12 0.16 1.04 23) 16X Perm. 2764 2205 8047 7.9 ND ND 0.09 0.56 24) 16X Conc. 14340 5176 79200 944 0.35 1.31 0.15 1.01 25) 20X Perm. 2756 1979 8315 11.7 ND ND 0.09 0.58 26) 20X Conc. 18614 6117 104687 1202 0.40 1.68 0.17 1.11
17
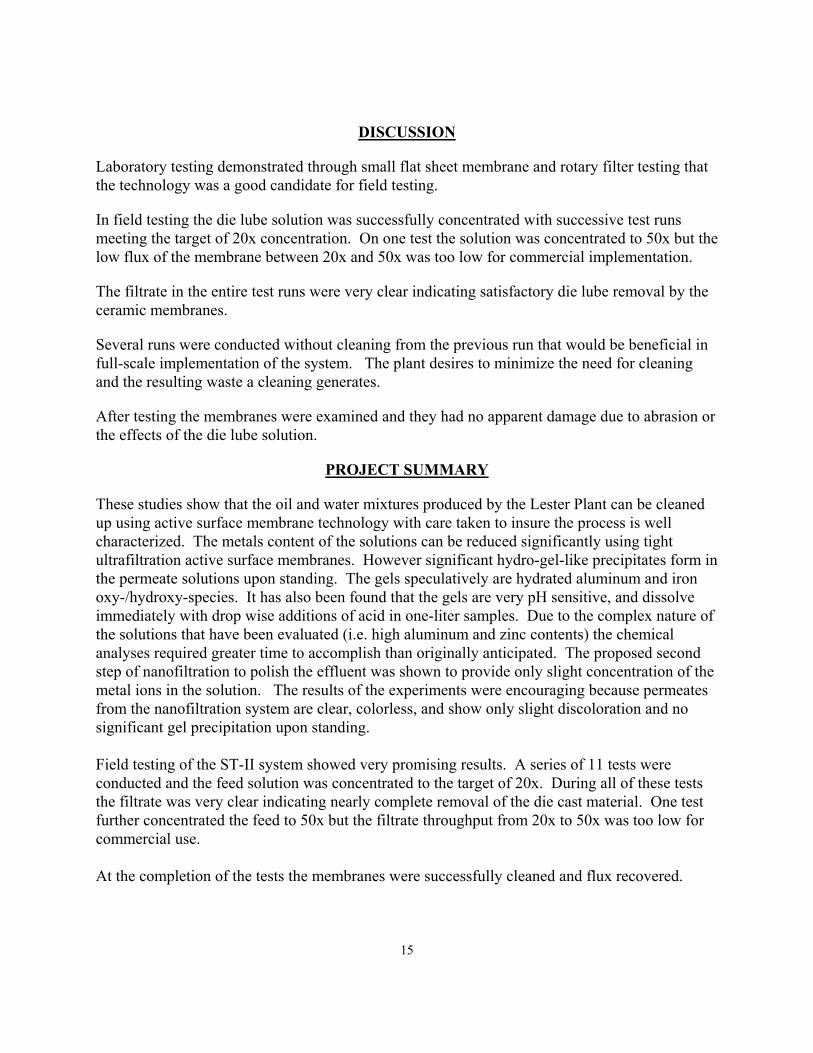
Table 3. Concentration Factors for Polymeric Membranes. Sample ID TOC
mg/L BOD mg/L
COD mg/L
Oil & Grease mg/L
Pb mg/L
Cu mg/L
Ni mg/L
Zn mg/L
100,000 MW - - - - - - - - 1,3/2 1X 1X 2X 18X ND R 1X 1X 4/5 4X 2X 7X 41X ND R 1X 1X 6/7 7X 3X 13X 60X R R 1X 1X 8/9 9X 1.5X 15X 98X R R 1X 1X 10/11 10X 8X 19X 220X R R 2X 2X 12/13 16X 3X 24X 120X R R 3X 3X 10,000 MW - - - - - - - - 15/14,16 1X 1X 2X 25X ND R 1X 1X 18/17 3X 1X 3X 50X ND R 1X 1X 20/19 4X 1X 2X 34X R 1X 1X 1X 22/21 4X 2X 9X 75X R R 2X 2X 24/23 5X 2X 10X 120X R R 2X 2X 26/25 6X 3X 13X 100X R R 2X 2X Table 4. Nanofilter test #1 Desal-5 spiral wound cartridge chemical analyses Sample ID TOC
mg/L BOD mg/L
COD mg/L
Oil & Grease mg/L
Pb mg/L
Cu mg/L
Ni mg/L
Zn mg/L
1) Permeate 1510 1160 3931 ND ND 0.09 0.24 0.63 2) Raw Feed 3463 2714 12567 225 ND 0.12 0.08 0.55 Table 5. Nanofilter test #2 0.015 micron ceramic membrane chemical analyses. Sample ID TOC
mg/L BOD mg/L
COD mg/L
Oil & Grease mg/L
Pb mg/L
Cu mg/L
Ni mg/L
Zn mg/L
1) Permeate 1894 2418 4885 ND ND 0.05 0.23 0.42 2) Raw Feed 3463 2714 12567 225 ND 0.12 0.08 0.55

18
Table 7. Rotating Membrane Cost Analysis. Rotating Membrane System Capitol Costs
Energy Costs
Rotating Membrane System $750,000 Recycle flow/pk 1gal Commissioning $ 20,000 Total recycle flow 320 gpm Shipping/Handling $ 4,000 Recycle pressure drop 30 psig Pump efficiency 80% Operating Capital Analysis Motor efficiency 94%
Assumptions Brake HP – Recycle pump 5.0 BHP
Feed water volume 20,000 GPD Brake HP – Rotors 200 BHP System output 19,000 GPD Brake HP – Total required 160.0 BHP Percentage recovery 95% System power consumption
total 119.4 KW-hr
Membrane 0.1 micron Power cost $0.06/KW-hr Membrane lifetime (conservatively)
1 yr Operating Cost $9.30/Kgal
Membrane Costs Membrane Cleaning Costs
Membrane type 0.1 micron Cleaning interval 5 days Membrane performance 60 GFD Cost per cleaning $25.00 Operating pressure 40 psig Cleaning operating Cost $0.26/ Kgal Membrane diameter 11 in/pk Membrane surface area 1 sq. ft/pk Overall membrane Process Costs Replacement time 1 yr Total membrane Costs (per Kgal) $13.00 Operating days/mon 30 days Total power per Kgal $9.05 Membrane pks/system 320 Membrane cleaning cost per Kgal $0.26 Membrane replacement cost $96,000 Misc. operating cost per Kgal $0.56 Total operating cost per Kgal $22.87 Total daily operating cost $457.40
19
Figure 1 ST-II Waste Water Process
20
Figure 2 Filtration Systems rotary membrane disc assembly showing stationary elements in place.
PERMEATE
ROTATING MEMBRANES
STATIONARY SHEAR ELEMENTS
TIE RODS
HOLLOW SHAFT
21
Concentrate
PermeateOutlet
SpinTekSTC
Feed TankFeed
Permeate
TI
PI
PI
FI
Figure 3 Process Flow and Instrument Diagram for Laboratory STC
SCREEN TEST SAMPLE
PERMEATE OUTLET
FEED INLET
CONCENTRATE OUTLET
Figure 4 Static Test Cell (STC)
22
Feed Pump
ST-II Rotors# 1 and #2
PI
PI
FI
FI
FeedTank
Concentrate
Filtrate (permeate)
Figure 5 Process Flow and Instrument Diagram for Field Demonstration System
Flux Vs. Time
0.0
10.0
20.0
30.0
40.0
50.0
60.0
70.0
0:00 1:12 2:24 3:36 4:48 6:00 7:12Flux (GPD/SQFT)
Elap
sed
Tim
e (H
H:M
M)
Series1
Figure 6 STC 0.15 Micron ceramic membrane test results, test stopped due to low flux.
23
Flux Vs. Time
0.0
10.0
20.0
30.0
40.0
50.0
60.0
70.0
0:00 4:48 9:36 14:24 19:12 24:00 28:48 33:36
Elapsed Time (HH:MM)
Flux
GPD
/SQ
FT
Sample A
Sample A 0.07 µ Membrane
Figure 7 STC 0.007 Micron ceramic membrane test results
Flux Vs. Time
30.0
35.0
40.0
45.0
50.0
55.0
60.0
65.0
70.0
0:00 4:48 9:36 14:24 19:12 24:00 28:48
Elapsed Time (HH:MM)
Flux
GPD
/SQ
FT
1x 2x 4x
Figure 8 STC 100,000 molecular weight cut-off (0.05 microns) polymeric membrane concentration evaluation test results.

24
SpinTek ST-11-1 High Shear Rotary Membrane Filtration System
020406080
100120140
0:0:00 0:2:24 0:4:48 0:7:12 0:9:36 0:12:00 0:14:24 0:16:48 0:19:12
ELAPSED TIME (DD:HH:MM)
FLU
X (g
al/ft
²-day
)
Figure 9 Flux profile for 100,000 NMWC cut-off polymeric membrane (ST-II-1 Tests)
SpinTek ST-11-1 High Shear Rotary Membrane Filtration System
0
20
40
60
80
100
0:18:2
9
0:18:5
9
0:19:2
9
0:19:5
9
0:20:2
9
0:20:5
9
0:21:2
9
0:21:5
9
0:22:2
9
0:22:5
9
0:23:2
9
0:23:5
91:0
:29
ELAPSED TIME (DD:HH:MM)
FLU
X (g
al/ft
²-day
)
Concentration Test
1x C
once
ntra
tion
2x C
once
ntra
tion
3x C
once
ntra
tion
5x C
once
ntra
tion
10x
Con
cent
ratio
n
Figure 10 Concentration profile for 100,000 NMWC cut-off polymeric membrane (ST-II-1 Tests)

25
SpinTek ST-11-1 High Shear Rotary Membrane Filtration System
0
20
40
60
80
100
120
0:0:00 0:4:48 0:9:36 0:14:24 0:19:12 1:0:00 1:4:48
ELAPSED TIME (DD:HH:MM)
FLU
X (g
al/ft
²-day
)
Figure 11 Flux profile for 100,000 NMWC cut-off polymeric membrane (ST-II-1 Tests 2)
SpinTek ST-11-1 High Shear Rotary Membrane Filtration System
0
20
40
60
80
100
120
0:0:00 0:2:24 0:4:48 0:7:12 0:9:36 0:12:00
0:14:24
0:16:48
0:19:12
0:21:36
1:0:00 1:2:24ELAPSED TIME (DD:HH:MM)
FLU
X (g
al/ft
²-day
)
2x C
once
ntra
tion
3x C
once
ntra
tion
5x C
once
ntra
tion
10x
Con
cent
ratio
n
15x
Con
cent
ratio
n
20x
Con
cent
ratio
n
Figure 12 Concentration profile for 100,000 NMWC cut-off polymeric membrane (ST-II-1 Tests 2)

26
SpinTek ST-11-1 High Shear Rotary Membrane Filtration System
0
20
40
60
80
100
0:0:00 0:4:48 0:9:36 0:14:24 0:19:12 1:0:00
ELAPSED TIME (DD:HH:MM)
FLU
X (g
al/ft
²-day
)
Figure 13 Flux profile for 100,000 NMWC cut-off polymeric membrane (ST-II-1 Tests)
SpinTek ST-11-1 High Shear Rotary Membrane Filtration System
0
20
40
60
80
0:22:48 1:2:48 1:6:48 1:10:48 1:14:48 1:18:48 1:22:48 2:2:54 2:6:54 2:10:54
ELAPSED TIME (DD:HH:MM)
FLU
X (g
al/ft
²-day
)
2x C
once
ntra
tion
3x C
once
ntra
tion
5x C
once
ntra
tion
10x
Con
cent
ratio
n
15x
Con
cent
ratio
n
20x
Con
cent
ratio
n
Figure 14 Concentration profile for 100,000 NMWC cut-off polymeric membrane (ST-II-1 Tests 3)

27
5 Day Flux Vs. Time
0.0
20.0
40.0
60.0
80.0
100.0
120.0
140.0
160.0
180.0
200.0
3/7/00 12:00AM
3/8/00 12:00AM
3/9/00 12:00AM
3/10/00 12:00AM
3/11/00 12:00AM
3/12/00 12:00AM
3/13/00 12:00AM
Time (M/D/YY HH:MM)
Flux
(GPD
/SQ
FT) 0.015 Ceramic NF
Figure 15 Performance plot for ceramic STII L ultrafilter membrane (nominal 0.015 micron mean pore diameter) showing flux decline probably due to fouling.
Flux Vs. Time
0.0
10.0
20.0
30.0
40.0
50.0
60.0
0:00 0:30 1:00 1:30 2:00 5:00
Elapsed Time (HH:MM)
Flux
(GPD
/SQ
FT)
Cleaned 0.015 Ceramic
After Cleaning Procedure
Figure 16 Performance plot for ceramic STII L ultrafilter membrane (nominal 0.015 micron mean pore diameter) showing flux performance after cleaning procedure has been performed. Flux decline is probably due to fouling.

28
5 Day Flux Vs. Time
10.0
12.5
15.0
17.5
20.0
22.5
25.0
3/7/00 12:00AM
3/8/00 12:00AM
3/9/00 12:00AM
3/10/00 12:00AM
3/11/00 12:00AM
3/12/00 12:00AM
3/13/00 12:00AM
Time (M/D/YY HH:MM)
Flux
(GPD
/SQ
FT)
Desal-5 Spiral-Wound NF
Figure 17 Performance plot for Desal-5 spiral wound static polymeric nanofilter membrane showing flux decline probably due to fouling.
Flux Vs. Time
0.0
10.0
20.0
30.0
40.0
50.0
60.0
0:00 0:30 1:00 1:30 2:00 5:00
Elapsed Time (HH:MM)
Flux
(GPD
/SQ
FT)
Cleaned 0.015 Ceramic
After Cleaning Procedure
Figure 17 Performance plot for Desal-5 spiral wound static polymeric nanofilter membrane showing flux performance after cleaning procedure has been performed. Flux decline is probably due to fouling, note that flux values return to original values shown in previous figure..

29
REFERENCES
1 Baker, R.W., Cussler, E.L., Eykamp, W., Koros, W.J., Riley, R.L., Strathmann, H., Membrane Separations
Systems - A Research and Development Needs Assessment, U.S. DOE Contract No. DE-AC01-88ER30133, March,
1990.
2 Humphrey, J.L. Seibert, A.F., Koort, R.A., Separation Technologies - Advances and Priorities, U.S. DOE Contract
No. AC07-90D12920, February, 1991.
33 Mcaffrey, R.R., Cummings, D.G., Sep. Sci. And Tech., 23, (12,13), 1627 (1988).
4 Allen, C.W., Cummings, D. G., Grey, A.E., McAtee, R.E., McCaffrey, R. R., J. Memb. Sci., 33, 181 (1987).
5 Mcaffrey, R.R., McAtee, R.E., Grey, A.E., Allen, C.A., Cummings, D.G., Applehans, A.D., J. Memb. Sci., 28, 47, (1986).
6 Femec, D.A., McCaffrey, R.R., J. Appl. Poly. Sci., 52, 501 (1994).
7 Peterson, E.S., Stone, M.L., Bauer, W.F., Orme, C.J., Rec. Prog. En Geni des Proc., Membrane Processes, 6, (22),
381 (1992).
8 Peterson, E.S., Stone, M.L., McCaffrey, R.R., Cummings, D.G., Sep. Sci and Tech., 28, (1-3) (1993).
9 Peterson, E.S., Stone, M.L., J. Memb. Sci., 86, 57 (1994).
10 Peterson, E.S., Stone, M.L., Orme, C.J., Reavill, D.A. III, Sep. Sci. And Tech., 30, (7-9), 1573 (1995).
11 Peterson, E.S., Stone, M.L., Orme, U.S. Patent # 5,385,672, January, 1995.