let’s get italy - unione petrolifera | unione petrolifera · let’s get italy moving. annual...
TRANSCRIPT
ANNUAL
REP
OR
T 20
16
ANNUALREPORT 2016
P i a z z a l e L u i g i S t u r z o , 3 1 - 0 0 1 4 4 R o m e
Ph. +39 06.542.3651 - Fax +39 06.596.029.25
www.unionepetrolifera.it
LET’S GETITALY
MOVING

ANNUALREPORT 2016
LET’S GETITALY
MOVING
2 ANNUAL REPORT UP 2016
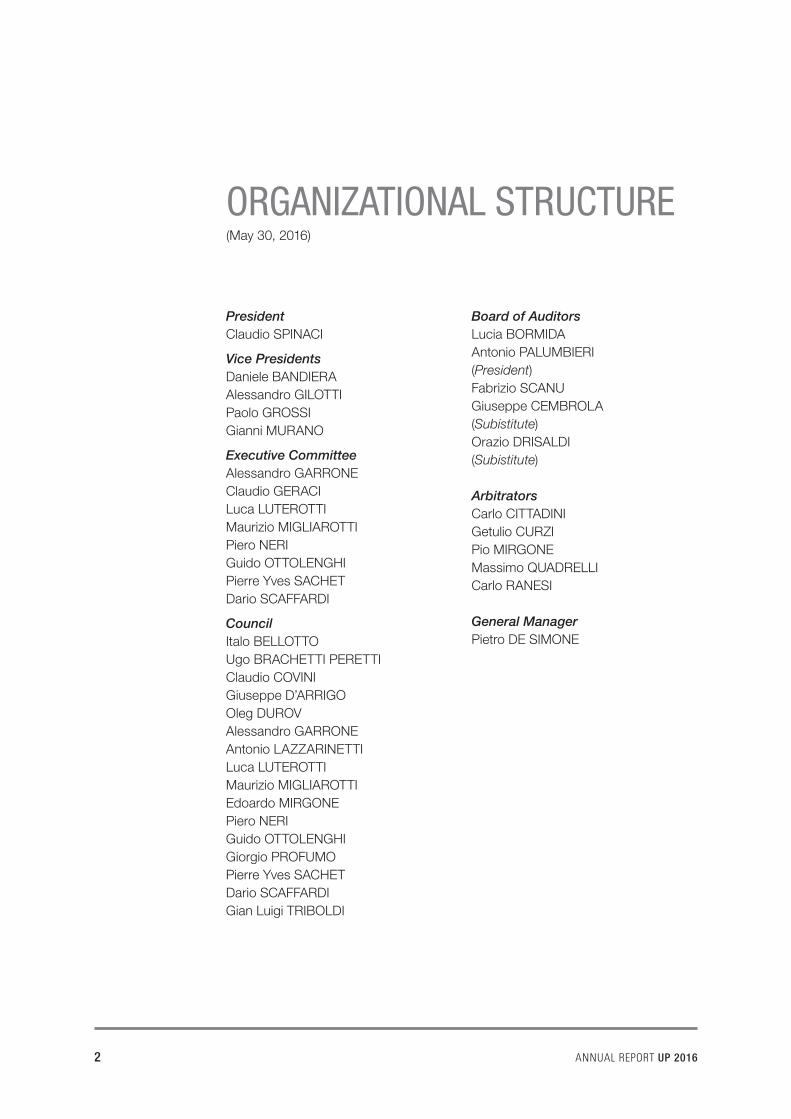
President Claudio SPINACI
Vice Presidents Daniele BANDIERAAlessandro GILOTTIPaolo GROSSIGianni MURANO
Executive CommitteeAlessandro GARRONEClaudio GERACILuca LUTEROTTIMaurizio MIGLIAROTTIPiero NERIGuido OTTOLENGHIPierre Yves SACHETDario SCAFFARDI
CouncilItalo BELLOTTOUgo BRACHETTI PERETTIClaudio COVINIGiuseppe D’ARRIGOOleg DUROVAlessandro GARRONEAntonio LAZZARINETTILuca LUTEROTTIMaurizio MIGLIAROTTIEdoardo MIRGONEPiero NERIGuido OTTOLENGHIGiorgio PROFUMOPierre Yves SACHETDario SCAFFARDIGian Luigi TRIBOLDI
Board of AuditorsLucia BORMIDAAntonio PALUMBIERI (President) Fabrizio SCANUGiuseppe CEMBROLA(Subistitute) Orazio DRISALDI (Subistitute)
ArbitratorsCarlo CITTADINIGetulio CURZIPio MIRGONEMassimo QUADRELLICarlo RANESI
General ManagerPietro DE SIMONE
ORGANIZATIONAL STRUCTURE(May 30, 2016)
ANNUAL REPORT UP 2016 3
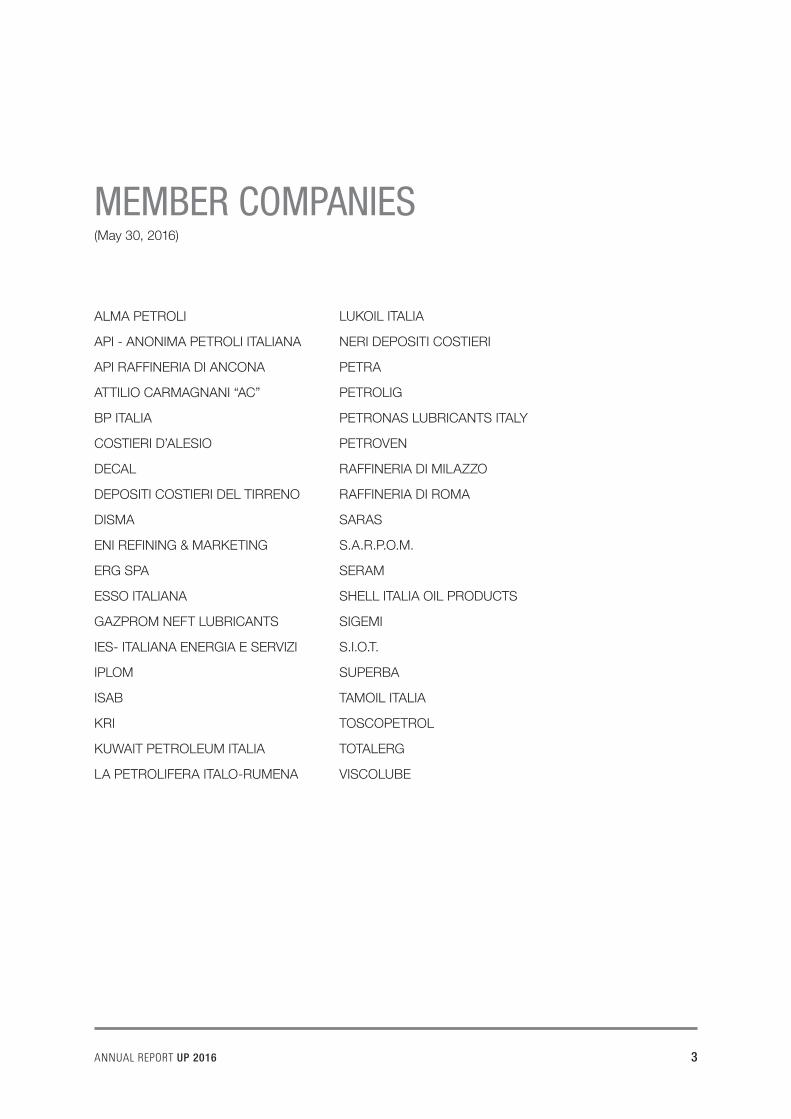
ALMA PETROLI
API - ANONIMA PETROLI ITALIANA
API RAFFINERIA DI ANCONA
ATTILIO CARMAGNANI “AC”
BP ITALIA
COSTIERI D’ALESIO
DECAL
DEPOSITI COSTIERI DEL TIRRENO
DISMA
ENI REFINING & MARKETING
ERG SPA
ESSO ITALIANA
GAZPROM NEFT LUBRICANTS
IES- ITALIANA ENERGIA E SERVIZI
IPLOM
ISAB
KRI
KUWAIT PETROLEUM ITALIA
LA PETROLIFERA ITALO-RUMENA
LUKOIL ITALIA
NERI DEPOSITI COSTIERI
PETRA
PETROLIG
PETRONAS LUBRICANTS ITALY
PETROVEN
RAFFINERIA DI MILAZZO
RAFFINERIA DI ROMA
SARAS
S.A.R.P.O.M.
SERAM
SHELL ITALIA OIL PRODUCTS
SIGEMI
S.I.O.T.
SUPERBA
TAMOIL ITALIA
TOSCOPETROL
TOTALERG
VISCOLUBE
MEMBER COMPANIES(May 30, 2016)

ANNUAL REPORT UP 2016 5
The international market 9The international economic context 9
Oil supply and demand 11
The prices of crude oil and refined products 15
Developments in refining 15
The Italian economy and energy 17The macroeconomic context 17
Energy consumption 25
Solid fuels 26
The energy and oil bills 26
The growth of renewables and the electricity market 28
The contribution of natural gas 32
Oil in Italy 39Domestic production of hydrocarbons 39
Demand for oil products 43
The prices of oil products 46
Imports and exports 47
The Italian downstream 49Refining: a positive 2015 doesn’t get rid of the structural problems 49
The fuel distribution network: changes in the regulatoryframework and critical issues 56
The crisis of the fuel distribution network along motorways 62
Illegality and contraband 63
Adaptation of equipment at sales points to European standards 69
Road haulage: after the judgment by the European Court of Justice 70
Port Reform 70
Compulsory stocks: changes in the law and implementation 71
Taxation 74Fiscal revenues 74
Tax revenues from oil products 76
Tax trends on energy products 78
New fiscal developments in the 2016 Stability Law 81
Customs Agency’s circular on transit losses 82
INDEX
6 ANNUAL REPORT UP 2016
Oil and the environment 83The Paris Agreement (COP 21) and its impact on the sector 83
Reform of the European Union “Emission Trading Scheme” 85
Biofuels: changes in the regulatory framework 86
Labelling of fuels at service stations 87
Air quality in European policies (EU Air Quality Package) 87
Implementation of Directive 2010/75/EU on industrial emissions (IPPC) 91
Developments in environmental management systems (ISO) 93
The Law on environmental crime 94
The latest developments on waste management and site remediation 95
Health and safety 97Implementation of Directive 2012/18/EU (Seveso III) 97
Regulations on pressure equipment 98
Safety performance in 2015 98
Focus The decline of crude oil prices and its effects on economic growth 20
Automobiles and well-being 22
Italy’s potential as a european hub 35
Investments and industrial activities 50
Changes in market share and operators’ structure 52
Awards and special occasions for the oil sector in 2015 52
Green refineries and next generation diesel 54
Oil and Gas Climate Initiative 55
Fighting back against illegality in the trade of oil products.The Protocol with Assopetroli 64
Security initiatives of priority importance for the oil sector 67
OSSIF intersector report on predatory crime in 2015 68
The new Emission Trading Scheme after 2020 84
“Dieselgate” – Tampering antipollution systems 88
Unione Petrolifera events on health and safety 94
New developments on waste management and site remediation 95
ANNUAL REPORT UP 2016 7
STATISTICALAPPENDIX
World 103Energy consumption in major Countries 103Energy and oil dependency 103Crude oil output and reserves 104Oil consumption 105Refining capacity 106The “SPOT” prices of main crudes 107
International market 108Barges quotations Fob Rotterdam of main oil products 108Cargoes quotations Cif North Europe of main oil products 108Cargoes quotations Fob Mediterranean of main oil products 109Cargoes quotations Cif Mediterranean of main oil products 109
Italy 110Energy consumption by primary source 110Energy consumption by sector of use 110The production of hydrocarbons 111The oil supply-demand balance 111Crude oil imports 112Imports of products and semi-finished products 113Exports of products, semi-finished products and crude 113Crude arrivals by ports 114Refineries activities 115Capacities of major refinery plants 115Refining capacity and raw material processed 116Sales to local market and consumption of oil products 117The estimated number of sales points for motorfuels distributionand of the average throughput at year’s end 118The Cif cost of imported crude “Own account” by Country of origin 119The Cif monthly cost of imported crude “Own account” 120The Fob and Cif monthly cost of imported crude “Own account” 120The monthly average prices of major products 121
Europe 122Pump prices and taxes on motorfuels 122Consumer prices and taxes on heating and fuel oils 123

THE INTERNATIONALMARKET
ANNUAL REPORT UP 2016 9
The international economic context
2015 was another very uncertain year for the global economy which on the whole showed signs of improvement, above all in the advanced economies, though this was offset by a weakening – for the fifth straight year– in the emerging and developing Countries.
Indeed, global GDP grew by 3.1 per cent in 2015. This was, however, a smaller increase than the 3.4 per cent recorded the previous year, though it occurred in a definitely more favourable context, not only in exchange markets because of expansive monetary policies, but also in raw materials markets where oil and oth-er commodity prices, after dipping to all time lows, gave hope for a much more robust recovery than actually took place.
2015 was also marked by concerns over the economic situation in China, which for the first time in history failed to meet the growth targets it had set, so that it was forced to lower its growth estimates for the next years with the risk of triggering a “drag” effect on other economies as well.
The sharp drop in crude oil prices, which began during the second half of 2015, had fuelled a certain climate of optimism over the impact this could have on do-mestic consumption, which was partly disappointed: in the first place because of declining demand in producing Countries, then due to reduced investments and global trade and finally because of the impossibility of many Countries to deploy financial leverage1.
The International Monetary Fund (IMF) itself stated in a recent report2: “the widely anticipated “shot in the arm” for the global economy has yet to materialize.” It add-ed that, “paradoxically, global benefits from low prices will likely appear only after prices have recovered somewhat, and advanced economies have made more progress surmounting the current low interest rate environment.”
According to the IMF, this is because the increased positive correlation between equity markets and oil prices, that is, when both variables move in the same direction, makes it harder to apply monetary policy which, in order to deal with deflationary pressures, cannot act counter-cyclically.
Indeed, monetary policies in the leading advanced Countries continued to be strongly oriented towards expansion, except in the United States, which in
1 See Focus “Drop in crude oil prices and its effects on economic growth” on page 20.
2 IMF, “Oil prices and the global economy: it’s complicated”, March 24, 2016.
THE INTERNATIONAL MARKET
10 ANNUAL REPORT UP 2016
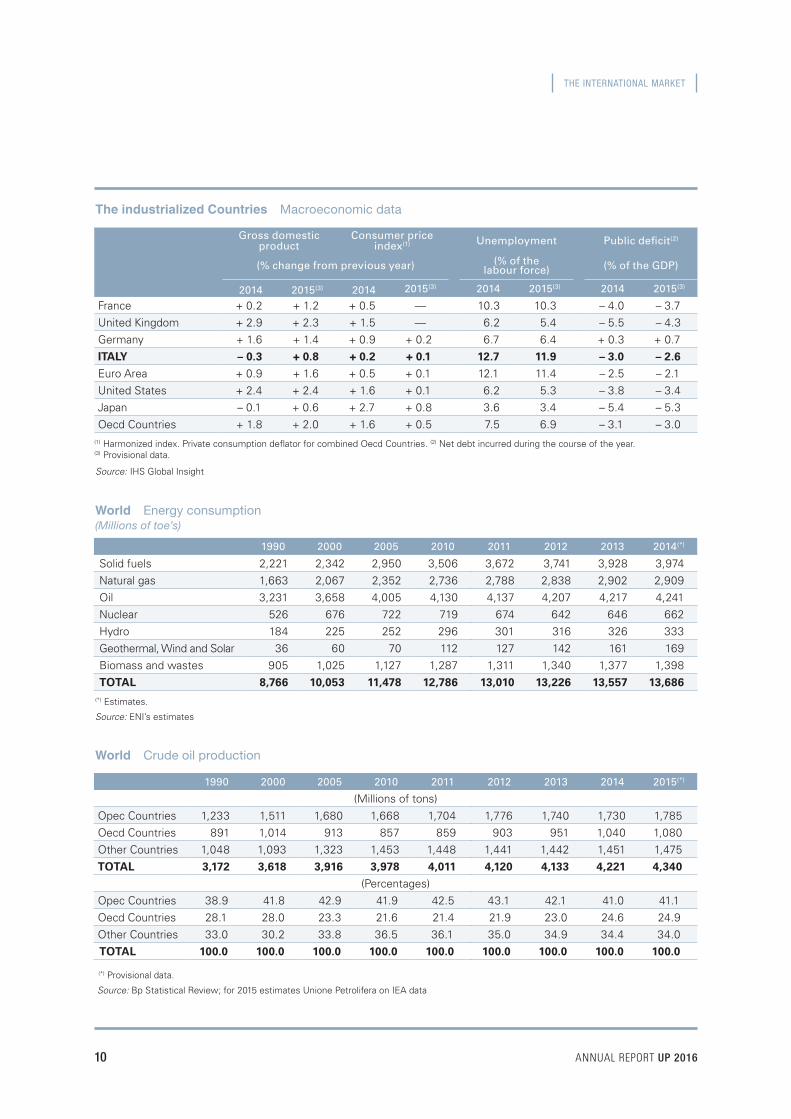
World Crude oil production
1990 2000 2005 2010 2011 2012 2013 2014 2015(*)
(Millions of tons)
Opec Countries 1,233 1,511 1,680 1,668 1,704 1,776 1,740 1,730 1,785 Oecd Countries 891 1,014 913 857 859 903 951 1,040 1,080 Other Countries 1,048 1,093 1,323 1,453 1,448 1,441 1,442 1,451 1,475 TOTAL 3,172 3,618 3,916 3,978 4,011 4,120 4,133 4,221 4,340
(Percentages)Opec Countries 38.9 41.8 42.9 41.9 42.5 43.1 42.1 41.0 41.1Oecd Countries 28.1 28.0 23.3 21.6 21.4 21.9 23.0 24.6 24.9Other Countries 33.0 30.2 33.8 36.5 36.1 35.0 34.9 34.4 34.0TOTAL 100.0 100.0 100.0 100.0 100.0 100.0 100.0 100.0 100.0
(*) Provisional data.
Source: Bp Statistical Review; for 2015 estimates Unione Petrolifera on IEA data
World Energy consumption(Millions of toe’s)
1990 2000 2005 2010 2011 2012 2013 2014(*)
Solid fuels 2,221 2,342 2,950 3,506 3,672 3,741 3,928 3,974Natural gas 1,663 2,067 2,352 2,736 2,788 2,838 2,902 2,909Oil 3,231 3,658 4,005 4,130 4,137 4,207 4,217 4,241Nuclear 526 676 722 719 674 642 646 662Hydro 184 225 252 296 301 316 326 333Geothermal, Wind and Solar 36 60 70 112 127 142 161 169Biomass and wastes 905 1,025 1,127 1,287 1,311 1,340 1,377 1,398TOTAL 8,766 10,053 11,478 12,786 13,010 13,226 13,557 13,686
(*) Estimates.
Source: ENI’s estimates
The industrialized Countries Macroeconomic data
Gross domestic product
Consumer priceindex(1) Unemployment Public deficit(2)
(% change from previous year) (% of the labour force) (% of the GDP)
2014 2015(3) 2014 2015(3) 2014 2015(3) 2014 2015(3)
France + 0.2 + 1.2 + 0.5 — 10.3 10.3 – 4.0 – 3.7United Kingdom + 2.9 + 2.3 + 1.5 — 6.2 5.4 – 5.5 – 4.3Germany + 1.6 + 1.4 + 0.9 + 0.2 6.7 6.4 + 0.3 + 0.7ITALY – 0.3 + 0.8 + 0.2 + 0.1 12.7 11.9 – 3.0 – 2.6
Euro Area + 0.9 + 1.6 + 0.5 + 0.1 12.1 11.4 – 2.5 – 2.1United States + 2.4 + 2.4 + 1.6 + 0.1 6.2 5.3 – 3.8 – 3.4Japan – 0.1 + 0.6 + 2.7 + 0.8 3.6 3.4 – 5.4 – 5.3Oecd Countries + 1.8 + 2.0 + 1.6 + 0.5 7.5 6.9 – 3.1 – 3.0
(1) Harmonized index. Private consumption deflator for combined Oecd Countries. (2) Net debt incurred during the course of the year.(3) Provisional data.
Source: IHS Global Insight
THE INTERNATIONAL MARKET
ANNUAL REPORT UP 2016 11
December 2015, decided to end its longstanding policy of zero interest rates by hiking its interest rate on Federal funds by 25 basis points, which was motivated by an improving labour market.
It was a decision many observers feared because of the repercussions it could have on financial markets and global currencies, but which actually had a limited impact thanks to assurances that monetary policies would remain accom-modating.
In the Eurozone, the Central Bank repeatedly reinforced this monetary stim-ulus injecting further liquidity into the system, so that by the early months of 2016 interest rates were negative in an attempt to counter deflationary pressures afflicting Europe.
Nonetheless, all indicators are pointing to a gradual acceleration of glob-al economic activity. According to the latest IMF estimates in 2016 the global economy is expected to grow by 3.2 per cent and in 2017 by 3.5 per cent. In particular, in the Eurozone, which grew by 1.6 per cent in 2015 (compared to 0.9 per cent in 2014), growth is forecast to be 1.5 per cent in 2016 and 1.6 per cent in 2017.
The growth however remains weak, subject to risks like persistent uncer-tainty of demand conditions in important market outlets and the increase of geopolitical tensions in wide areas of North Africa and the Middle East which may exacerbate the unresolved question of “migrants”, on which the cohesion of Europe appears to depend.
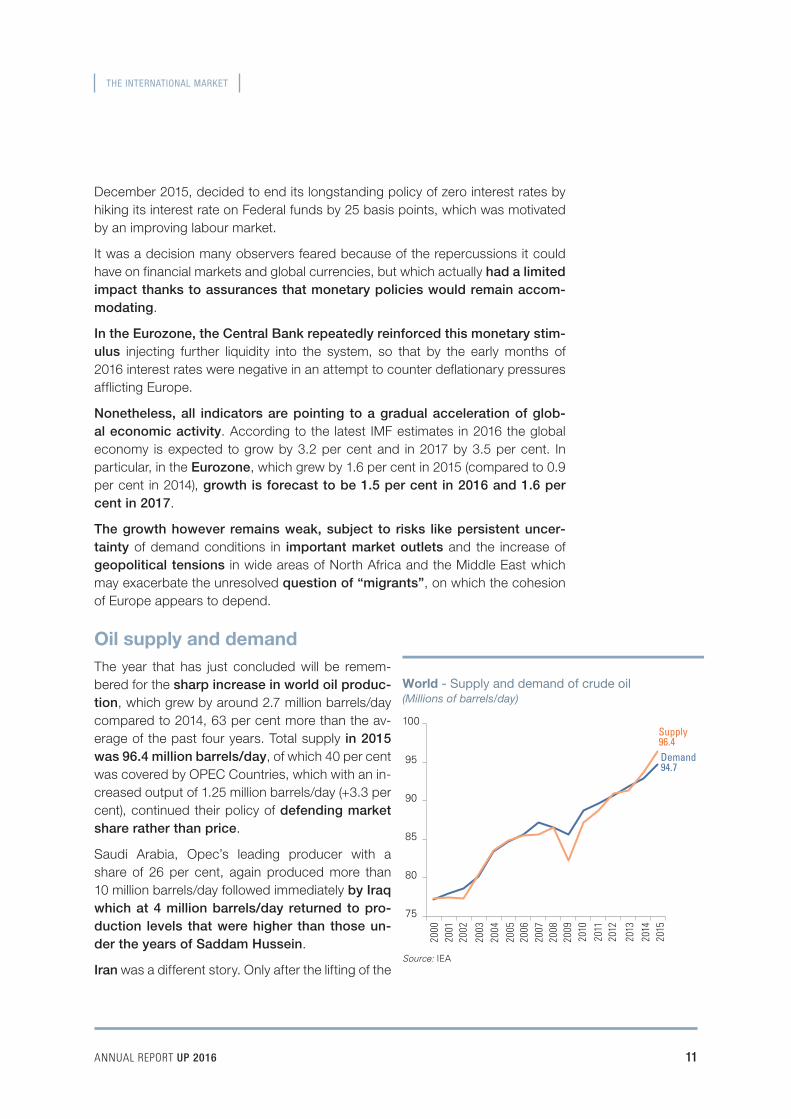
Oil supply and demandThe year that has just concluded will be remem-bered for the sharp increase in world oil produc-tion, which grew by around 2.7 million barrels/day compared to 2014, 63 per cent more than the av-erage of the past four years. Total supply in 2015 was 96.4 million barrels/day, of which 40 per cent was covered by OPEC Countries, which with an in-creased output of 1.25 million barrels/day (+3.3 per cent), continued their policy of defending market share rather than price.
Saudi Arabia, Opec’s leading producer with a share of 26 per cent, again produced more than 10 million barrels/day followed immediately by Iraq which at 4 million barrels/day returned to pro-duction levels that were higher than those un-der the years of Saddam Hussein.
Iran was a different story. Only after the lifting of the Source: IEA
2000
2001
2002
2003
2004
2005
2006
2007
2008
2009
2010
2011
2012
2013
2014
2015
75
80
85
90
95
100
Demand94.7
Supply96.4
World - Supply and demand of crude oil(Millions of barrels/day)
THE INTERNATIONAL MARKET
12 ANNUAL REPORT UP 2016
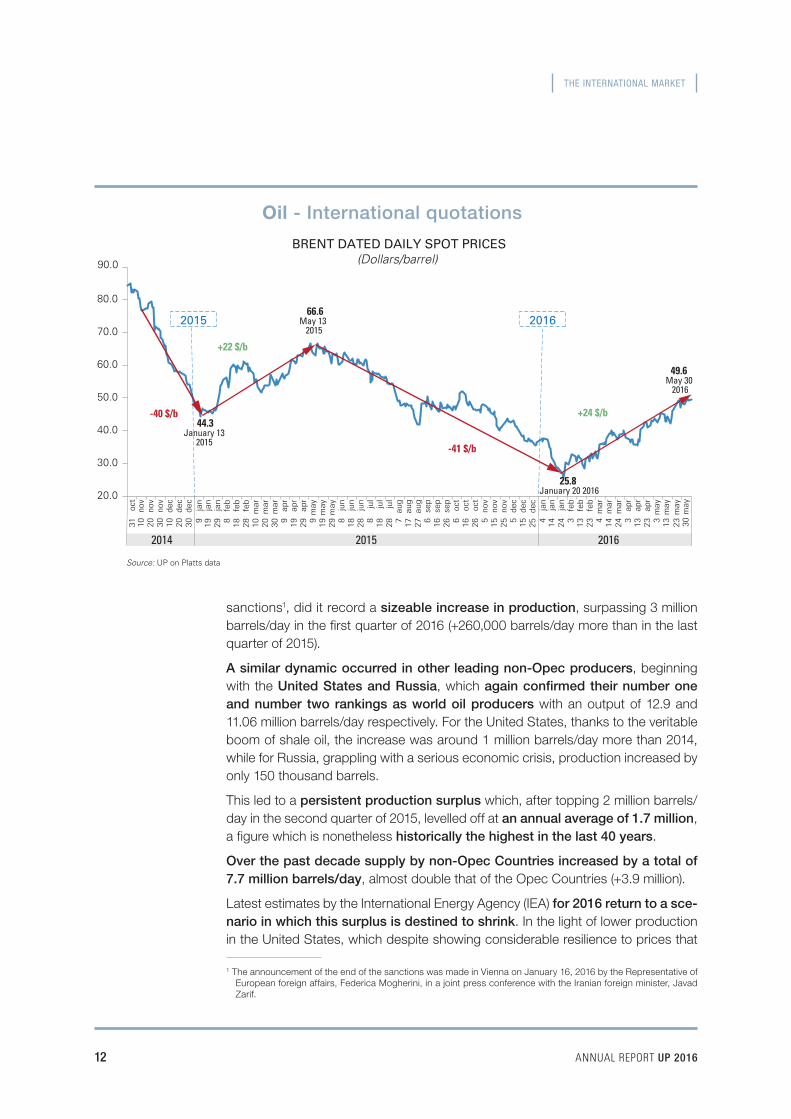
Oil - International quotations
BRENT DATED DAILY SPOT PRICES(Dollars/barrel)
Source: UP on Platts data
20.0
30.0
40.0
50.0
60.0
70.0
80.0
90.0
25.8 January 20 2016
49.6 May 30
2016
25
de
c
2016
+22 $/b
-40 $/b
-41 $/b
+24 $/b44.3
January 13 2015
66.6May 13
20152015
9
jan
19
ja
n
29
jan
8
feb
18
fe
b
28
feb
10
mar
20
mar
30
mar
9
apr
19
ap
r
29
apr
9
may
19
may
29
may
8
jun
18
ju
n
28
jun
8
jul
18
ju
l
28
jul
7
aug
17
aug
27
aug
6
sep
16
se
p
26
sep
6
oct
16
oc
t
26
oct
5
nov
15
no
v
25
nov
5
dec
15
de
c
4
jan
14
ja
n
24
jan
3
feb
13
fe
b
23
feb
4
mar
14
mar
24
mar
3
apr
13
ap
r
23
apr
3
may
13
may
23
may
30
may
31
oc
t
10
nov
20
no
v
30
nov
10
de
c
20
dec
30
de
c
2014 2015 2016
sanctions1, did it record a sizeable increase in production, surpassing 3 million barrels/day in the first quarter of 2016 (+260,000 barrels/day more than in the last quarter of 2015).
A similar dynamic occurred in other leading non-Opec producers, beginning with the United States and Russia, which again confirmed their number one and number two rankings as world oil producers with an output of 12.9 and 11.06 million barrels/day respectively. For the United States, thanks to the veritable boom of shale oil, the increase was around 1 million barrels/day more than 2014, while for Russia, grappling with a serious economic crisis, production increased by only 150 thousand barrels.
This led to a persistent production surplus which, after topping 2 million barrels/day in the second quarter of 2015, levelled off at an annual average of 1.7 million, a figure which is nonetheless historically the highest in the last 40 years.
Over the past decade supply by non-Opec Countries increased by a total of 7.7 million barrels/day, almost double that of the Opec Countries (+3.9 million).
Latest estimates by the International Energy Agency (IEA) for 2016 return to a sce-nario in which this surplus is destined to shrink. In the light of lower production in the United States, which despite showing considerable resilience to prices that
1 The announcement of the end of the sanctions was made in Vienna on January 16, 2016 by the Representative of European foreign affairs, Federica Mogherini, in a joint press conference with the Iranian foreign minister, Javad Zarif.
THE INTERNATIONAL MARKET
ANNUAL REPORT UP 2016 13
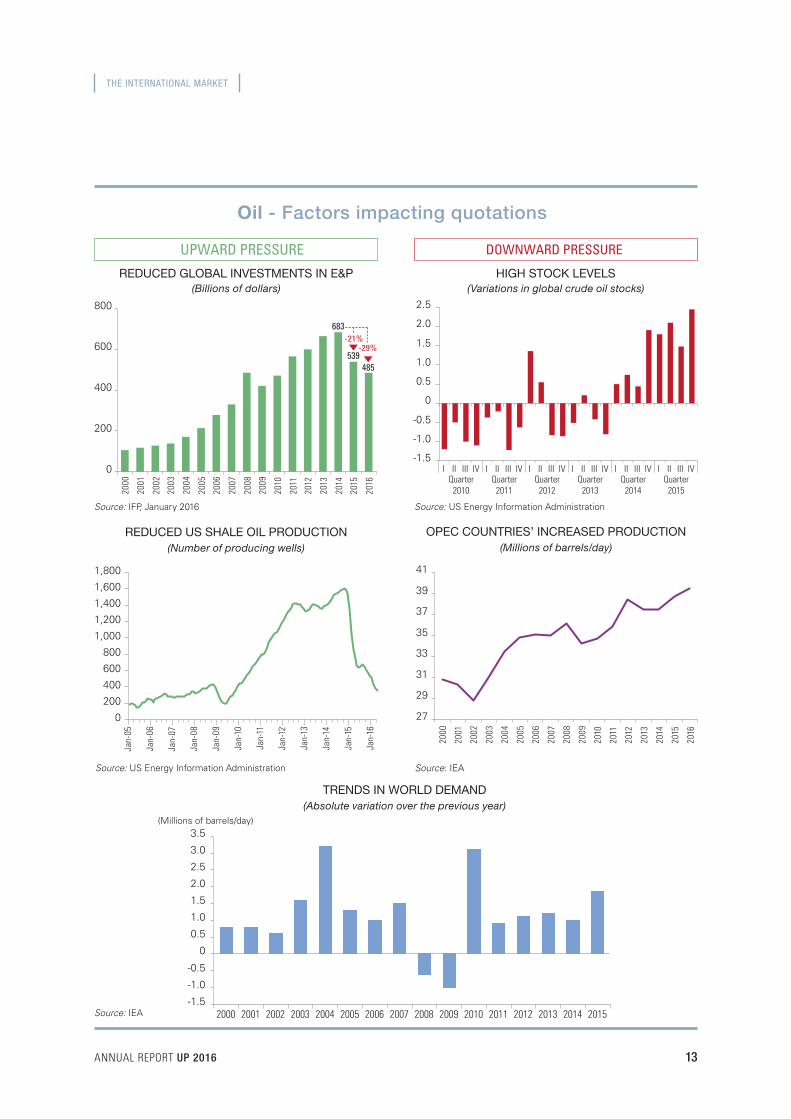
Oil - Factors impacting quotations
Source: IFP, January 2016
REDUCED GLOBAL INVESTMENTS IN E&P(Billions of dollars)
2000
2001
2002
2003
2004
2005
2006
2007
2008
2009
2010
2011
2012
2013
2014
2015
2016
0
200
400
600
800
683
539485
-21%-29%
UPWARD PRESSURE DOWNWARD PRESSURE
-1.5
-1.0
-0.5
0
0.5
1.0
1.5
2.0
2.5
IVIIIIIIQuarter
2014
IVIIIIIIQuarter
2013
IVIIIIIIQuarter
2012
IVIIIIIIQuarter
2011
IVIIIIIIQuarter
2015
IVIIIIIIQuarter
2010
Source: US Energy Information Administration
HIGH STOCK LEVELS(Variations in global crude oil stocks)
REDUCED US SHALE OIL PRODUCTION(Number of producing wells)
Jan-
05
Jan-
06
Jan-
07
Jan-
08
Jan-
09
Jan-
10
Jan-
11
Jan-
12
Jan-
13
Jan-
14
Jan-
15
Jan-
16
0
200
400
600
800
1,000
1,200
1,400
1,600
1,800
Source: US Energy Information Administration
OPEC COUNTRIES’ INCREASED PRODUCTION(Millions of barrels/day)
Source: IEA
2000
2001
2002
2003
2004
2005
2006
2007
2008
2009
2010
2011
2012
2013
2014
2015
2016
27
29
31
33
35
37
39
41
Source: IEA
TRENDS IN WORLD DEMAND(Absolute variation over the previous year)
2000 2001 2002 2003 2004 2005 2006 2007 2008 2009 2010 2011 2012 2013 2014 2015-1.5
-1.0
-0.5
0
0.5
1.0
1.5
2.0
2.5
3.0
3.5(Millions of barrels/day)
THE INTERNATIONAL MARKET
14 ANNUAL REPORT UP 2016
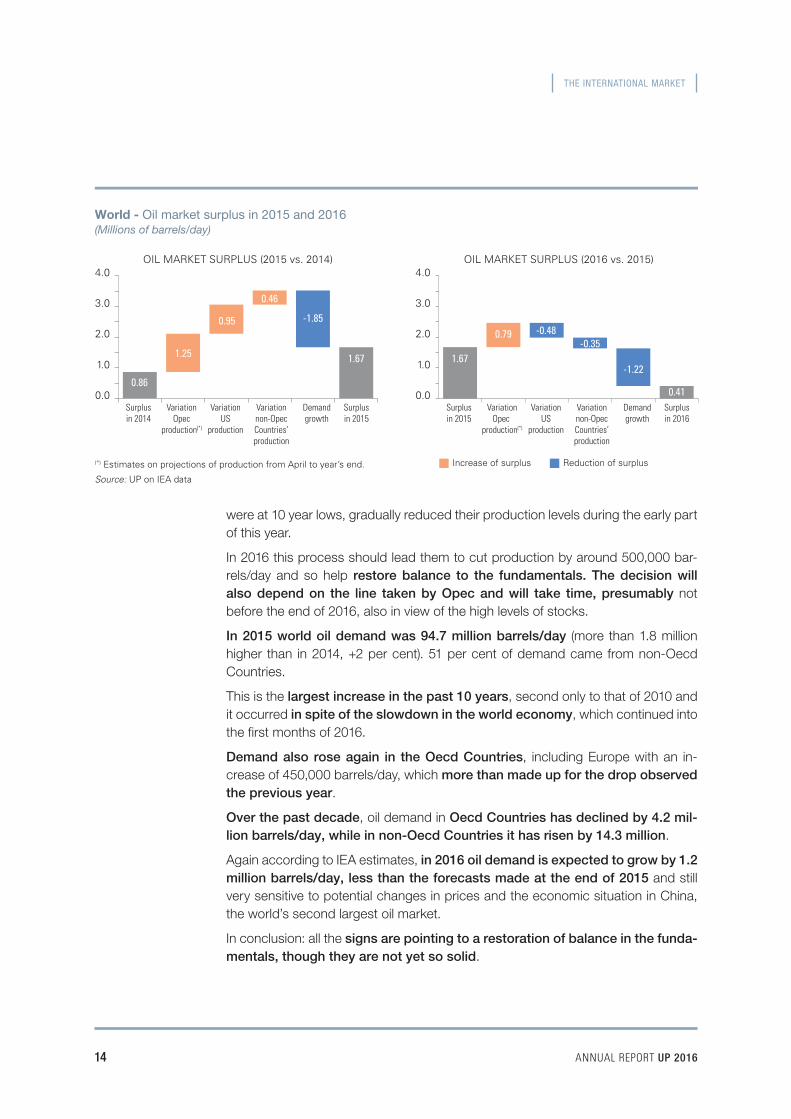
were at 10 year lows, gradually reduced their production levels during the early part of this year.
In 2016 this process should lead them to cut production by around 500,000 bar-rels/day and so help restore balance to the fundamentals. The decision will also depend on the line taken by Opec and will take time, presumably not before the end of 2016, also in view of the high levels of stocks.
In 2015 world oil demand was 94.7 million barrels/day (more than 1.8 million higher than in 2014, +2 per cent). 51 per cent of demand came from non-Oecd Countries.
This is the largest increase in the past 10 years, second only to that of 2010 and it occurred in spite of the slowdown in the world economy, which continued into the first months of 2016.
Demand also rose again in the Oecd Countries, including Europe with an in-crease of 450,000 barrels/day, which more than made up for the drop observed the previous year.
Over the past decade, oil demand in Oecd Countries has declined by 4.2 mil-lion barrels/day, while in non-Oecd Countries it has risen by 14.3 million.
Again according to IEA estimates, in 2016 oil demand is expected to grow by 1.2 million barrels/day, less than the forecasts made at the end of 2015 and still very sensitive to potential changes in prices and the economic situation in China, the world’s second largest oil market.
In conclusion: all the signs are pointing to a restoration of balance in the funda-mentals, though they are not yet so solid.
(*) Estimates on projections of production from April to year’s end.
Source: UP on IEA data
Increase of surplus Reduction of surplus
World - Oil market surplus in 2015 and 2016(Millions of barrels/day)
OIL MARKET SURPLUS (2015 vs. 2014) OIL MARKET SURPLUS (2016 vs. 2015)
0.0
1.0
2.0
3.0
4.0
1.25
0.95
0.46
-1.85
1.67
Surplusin 2014
Surplusin 2015
VariationOpec
production(*)
VariationUS
production
Variationnon-OpecCountries’production
Demandgrowth
0.86
1.67
0.79 -0.48-0.35
-1.22
0.410.0
1.0
2.0
3.0
4.0
Surplusin 2015
Surplusin 2016
VariationOpec
production(*)
VariationUS
production
Variationnon-OpecCountries’production
Demandgrowth
THE INTERNATIONAL MARKET
ANNUAL REPORT UP 2016 15
The prices of crude oil and refined productsThe strong increase in production and record levels of stocks further contributed to the other phenomenon that characterized 2015: the collapsing of oil prices. Indeed over the course of the year prices again began to lose ground: after the slump during the second half of 2014 - from 110 dollars/barrel to 45 dollars (-60 per cent) - they rebounded again to a new high of 67 dollars (+49 per cent) in May 2015, followed by another slide down to 36 dollars (-46 per cent) in mid-December.
A downward trend that gathered speed in the first two months of 2016, sinking as far as 26 dollars in mid-January (with a dip of more than 7 per cent occurring during a single trading session) following the announcement of the so-called “im-plementation day”, which saw the removal of sanctions against Iran, a reaction which in many respects was dictated by speculative movements.
Only rumours of a possible understanding between Russia and Opec for a 5 per cent production cut, which on February 16 turned into a possible agreement in Doha among several producing Countries (Russia, Saudi Arabia, Venezuela, Qatar) to “freeze” their production to the levels of January resulted in prices moving back up to 33-36 dollars/barrel, before rising to around 50 dollars/barrel at the end of May. The Opec summit that followed in the early days of June 2016 confirmed the policy, hitherto adopted by producing Countries, to keep their production ceil-ings unvaried.
The collapse of prices in 2015 had serious repercussions on the oil companies’ financial balance sheets. In many cases companies had to revise investment plans and organisational structures, downsizeing their total investments in 2015 by more than 200 billion dollars and an estimated 300 billion for 2016. 2016 looks like it is going to be another year of low prices and it is hard to say how and when the current downward trend will bottom out. Estimates by the leading Institutes vary in a range from 30 to 50 dollars/barrel, with an annual average of around 44 dollars which should rise to 54 in 2017.
As regards refined products quoted on international markets1, in 2015 the average price of petrol was around 39 eurocents/litre, down 13 cents from the previous year (-25 per cent); gasoil was the same price but down 16 cents (-29 per cent). In the first four months of 2016 these averages declined even fur-ther to 29 cents for petrol and 26 for gasoil, though recently they have begun to rebound again.
Developments in refining2015 was a year that by and large confirmed the fundamental trends that have beset the refining industry over the past few years: non-Oecd Countries were again protagonists and it is among these regions that most investments in new ca-pacity are concentrated (84 per cent), while a structural crisis persists in the Oecd Countries, mostly in Europe. In spite of European refining margins rising
1 Platts Cif Med quotations.
THE INTERNATIONAL MARKET
16 ANNUAL REPORT UP 2016
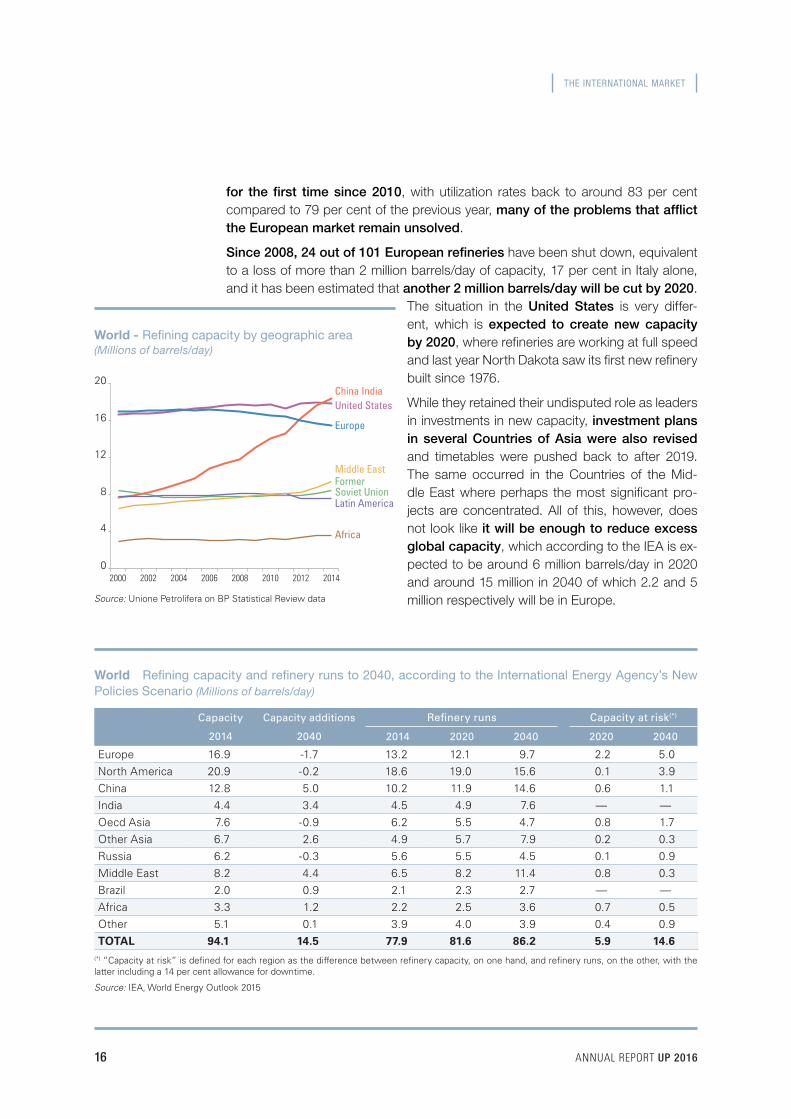
for the first time since 2010, with utilization rates back to around 83 per cent compared to 79 per cent of the previous year, many of the problems that afflict the European market remain unsolved.
Since 2008, 24 out of 101 European refineries have been shut down, equivalent to a loss of more than 2 million barrels/day of capacity, 17 per cent in Italy alone, and it has been estimated that another 2 million barrels/day will be cut by 2020.
The situation in the United States is very differ-ent, which is expected to create new capacity by 2020, where refineries are working at full speed and last year North Dakota saw its first new refinery built since 1976.
While they retained their undisputed role as leaders in investments in new capacity, investment plans in several Countries of Asia were also revised and timetables were pushed back to after 2019. The same occurred in the Countries of the Mid-dle East where perhaps the most significant pro-jects are concentrated. All of this, however, does not look like it will be enough to reduce excess global capacity, which according to the IEA is ex-pected to be around 6 million barrels/day in 2020 and around 15 million in 2040 of which 2.2 and 5 million respectively will be in Europe.
World Refining capacity and refinery runs to 2040, according to the International Energy Agency’s New Policies Scenario (Millions of barrels/day)
Capacity Capacity additions Refinery runs Capacity at risk(*)
2014 2040 2014 2020 2040 2020 2040
Europe 16.9 -1.7 13.2 12.1 9.7 2.2 5.0North America 20.9 -0.2 18.6 19.0 15.6 0.1 3.9China 12.8 5.0 10.2 11.9 14.6 0.6 1.1India 4.4 3.4 4.5 4.9 7.6 — —Oecd Asia 7.6 -0.9 6.2 5.5 4.7 0.8 1.7Other Asia 6.7 2.6 4.9 5.7 7.9 0.2 0.3Russia 6.2 -0.3 5.6 5.5 4.5 0.1 0.9Middle East 8.2 4.4 6.5 8.2 11.4 0.8 0.3Brazil 2.0 0.9 2.1 2.3 2.7 — —Africa 3.3 1.2 2.2 2.5 3.6 0.7 0.5Other 5.1 0.1 3.9 4.0 3.9 0.4 0.9TOTAL 94.1 14.5 77.9 81.6 86.2 5.9 14.6
(*) “Capacity at risk” is defined for each region as the difference between refinery capacity, on one hand, and refinery runs, on the other, with the latter including a 14 per cent allowance for downtime.
Source: IEA, World Energy Outlook 2015
Source: Unione Petrolifera on BP Statistical Review data
2000 2002 2004 2006 2008 2010 2012 20140
4
8
12
16
20
United StatesChina India
Former Soviet UnionLatin America
Middle East
Africa
Europe
World - Refining capacity by geographic area(Millions of barrels/day)
THE ITALIAN ECONOMYAND ENERGY
ANNUAL REPORT UP 2016 17
The macroeconomic context
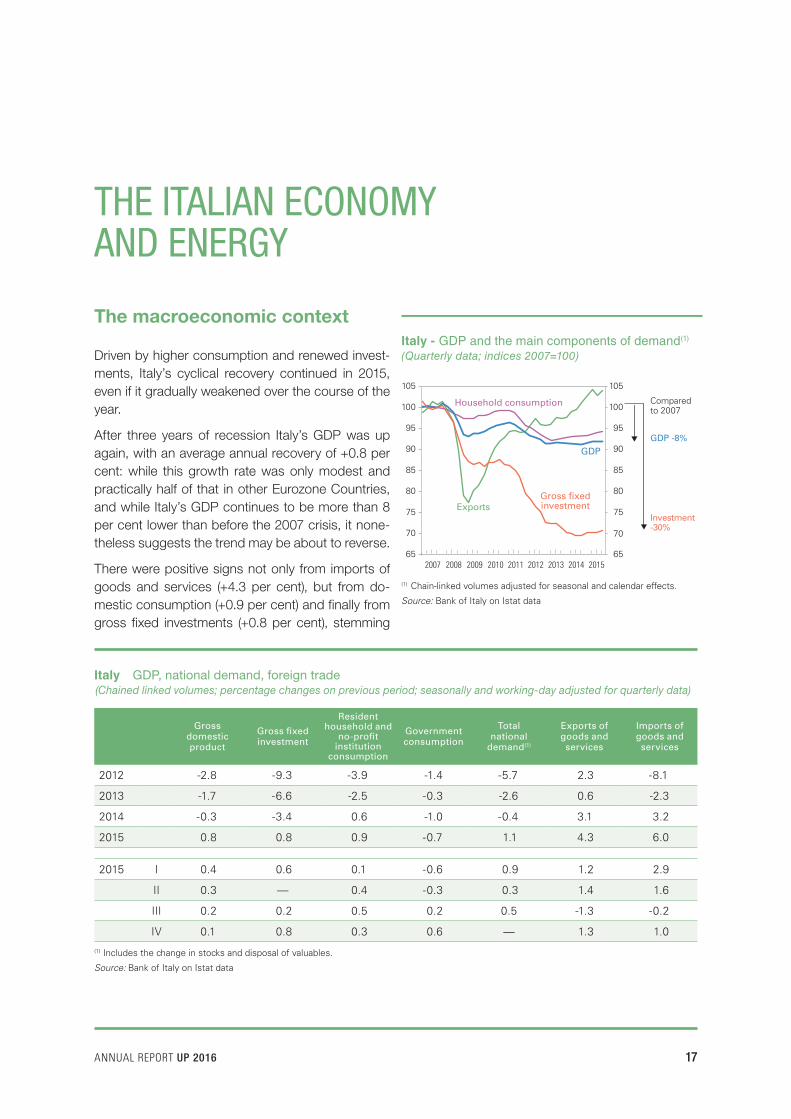
Driven by higher consumption and renewed invest-ments, Italy’s cyclical recovery continued in 2015, even if it gradually weakened over the course of the year.
After three years of recession Italy’s GDP was up again, with an average annual recovery of +0.8 per cent: while this growth rate was only modest and practically half of that in other Eurozone Countries, and while Italy’s GDP continues to be more than 8 per cent lower than before the 2007 crisis, it none-theless suggests the trend may be about to reverse.
There were positive signs not only from imports of goods and services (+4.3 per cent), but from do-mestic consumption (+0.9 per cent) and finally from gross fixed investments (+0.8 per cent), stemming
Italy GDP, national demand, foreign trade(Chained linked volumes; percentage changes on previous period; seasonally and working-day adjusted for quarterly data)
Gross domestic product
Gross fixed investment
Resident household and
no-profit institution
consumption
Government consumption
Total national
demand(1)
Exports of goods and services
Imports of goods and services
2012 -2.8 -9.3 -3.9 -1.4 -5.7 2.3 -8.1
2013 -1.7 -6.6 -2.5 -0.3 -2.6 0.6 -2.3
2014 -0.3 -3.4 0.6 -1.0 -0.4 3.1 3.2
2015 0.8 0.8 0.9 -0.7 1.1 4.3 6.0
2015 I 0.4 0.6 0.1 -0.6 0.9 1.2 2.9
II 0.3 — 0.4 -0.3 0.3 1.4 1.6
III 0.2 0.2 0.5 0.2 0.5 -1.3 -0.2
IV 0.1 0.8 0.3 0.6 — 1.3 1.0
(1) Includes the change in stocks and disposal of valuables.
Source: Bank of Italy on Istat data
(1) Chain-linked volumes adjusted for seasonal and calendar effects.
Source: Bank of Italy on Istat data
Italy - GDP and the main components of demand(1)
(Quarterly data; indices 2007=100)
65
70
75
80
85
90
95
100
105
2007 2008 2009 2010 2011 2012 2013 2014 201565
75
80
85
90
95
100
105
GDP
Exports
Household consumption
Gross fixedinvestment
70
GDP -8%
Investment-30%
Compared to 2007
THE ITALIAN ECONOMY AND ENERGY
18 ANNUAL REPORT UP 2016
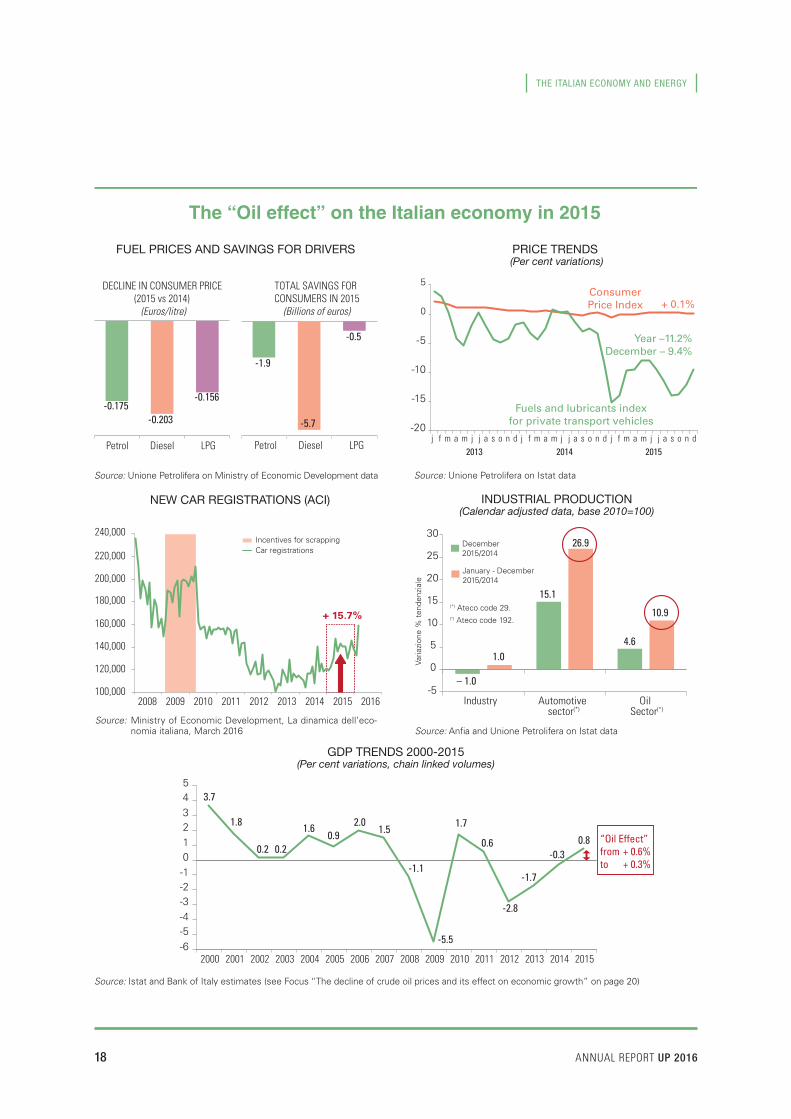
FUEL PRICES AND SAVINGS FOR DRIVERS
Source: Unione Petrolifera on Ministry of Economic Development data
DECLINE IN CONSUMER PRICE (2015 vs 2014)
(Euros/litre)
TOTAL SAVINGS FOR CONSUMERS IN 2015
(Billions of euros)
Petrol Diesel LPGPetrol Diesel LPG
-0.175-0.203
-0.156
-1.9
-5.7
-0.5
The “Oil effect” on the Italian economy in 2015
PRICE TRENDS (Per cent variations)
Source: Unione Petrolifera on Istat data
Consumer Price Index
Fuels and lubricants indexfor private transport vehicles
-20
-15
-10
-5
0
5
j f m a m j j a s o n d
Year –11.2%December – 9.4%
+ 0.1%
2013j f m a m j j a s o n d
2014j f m a m j j a s o n d
2015
NEW CAR REGISTRATIONS (ACI)
Incentives for scrappingCar registrations
240,000
220,000
200,000
180,000
160,000
140,000
120,000
100,0002008 2009 2010 2011 2012 2013 2014 2015 2016
+ 15.7%
Source: Ministry of Economic Development, La dinamica dell’eco-nomia italiana, March 2016 Source: Anfia and Unione Petrolifera on Istat data
INDUSTRIAL PRODUCTION(Calendar adjusted data, base 2010=100)
December 2015/2014
January - December 2015/2014
Industry Automotive sector(*)
Oil Sector(°)
-5
0
5
10
15
20
25
30
– 1.0
1.0
15.1
26.9
4.6
10.9
Varia
zion
e %
ten
denz
iale
(*) Ateco code 29. (°) Ateco code 192.
Source: Istat and Bank of Italy estimates (see Focus “The decline of crude oil prices and its effect on economic growth” on page 20)
GDP TRENDS 2000-2015(Per cent variations, chain linked volumes)
2000 2001 2002 2003 2004 2005 2006 2007 2008 2009 2010 2011 2012 2013 2014 2015
3.7
1.8
0.2 0.20.9
1.6 2.01.5
-1.1
-5.5
1.7
0.6
-2.8
-1.7
-0.30.8
-6-5-4-3-2-1012345
“Oil Effect”from + 0.6%to + 0.3%
ANNUAL REPORT UP 2016 19
THE ITALIAN ECONOMY AND ENERGY
the repeated declines that persisted after the beginning of the financial crisis (they are still 30 per cent lower than levels before the crisis).
Stronger domestic consumption was sustained by a moderate recovery in dispos-able income: the first increase in real terms since 2008.
The improvement in consumers’ purchasing power (+0.8 per cent), encouraged by the general decline in prices, in particular for oil products, acted as an addition-al motor for the economy, stimulating the acquisition of those durable goods, like automobiles, which con-sumers had postponed because of the lingering ef-fects of the crisis, but which are essential for daily life.
The revival of manufacturing activities, which fluctuat-ed during the course of the year was certainly in part thanks to sectors connected to oil.
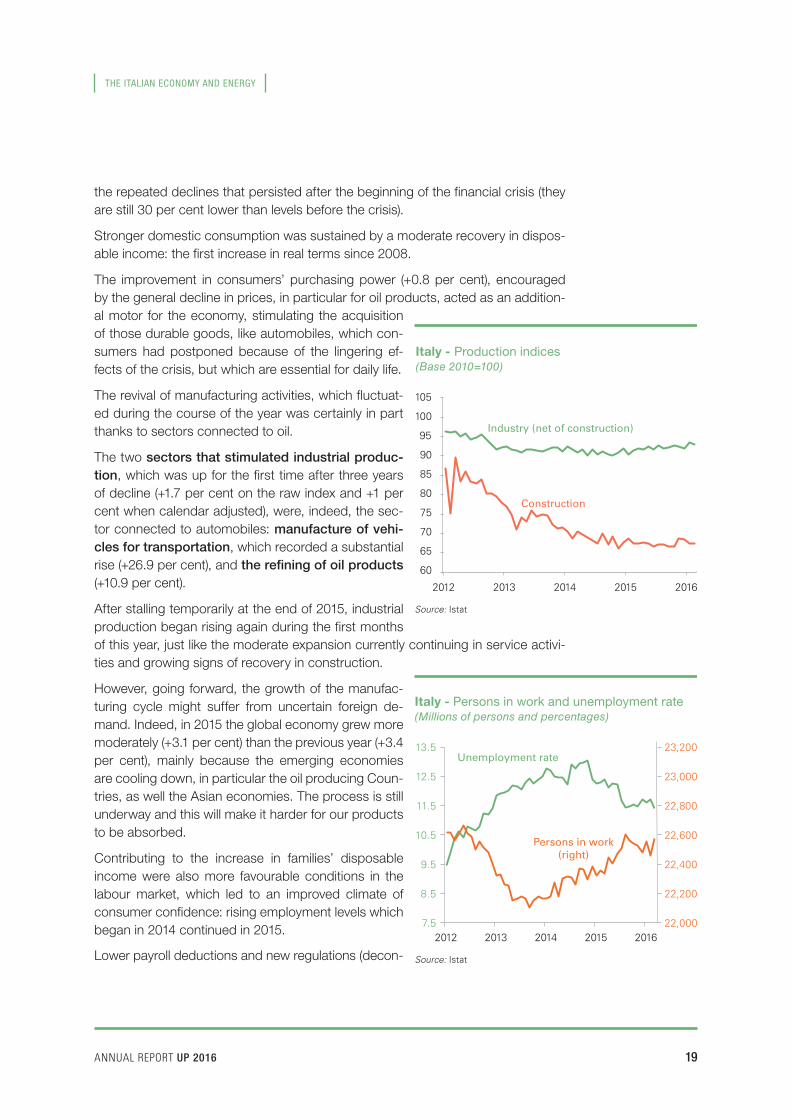
The two sectors that stimulated industrial produc-tion, which was up for the first time after three years of decline (+1.7 per cent on the raw index and +1 per cent when calendar adjusted), were, indeed, the sec-tor connected to automobiles: manufacture of vehi-cles for transportation, which recorded a substantial rise (+26.9 per cent), and the refining of oil products (+10.9 per cent).
After stalling temporarily at the end of 2015, industrial production began rising again during the first months of this year, just like the moderate expansion currently continuing in service activi-ties and growing signs of recovery in construction.
However, going forward, the growth of the manufac-turing cycle might suffer from uncertain foreign de-mand. Indeed, in 2015 the global economy grew more moderately (+3.1 per cent) than the previous year (+3.4 per cent), mainly because the emerging economies are cooling down, in particular the oil producing Coun-tries, as well the Asian economies. The process is still underway and this will make it harder for our products to be absorbed.
Contributing to the increase in families’ disposable income were also more favourable conditions in the labour market, which led to an improved climate of consumer confidence: rising employment levels which began in 2014 continued in 2015.
Lower payroll deductions and new regulations (decon- Source: Istat
Italy - Persons in work and unemployment rate(Millions of persons and percentages)
22,000
22,200
22,400
22,600
22,800
23,000
23,200
7.5
8.5
9.5
10.5
11.5
12.5
13.5
2012 2013 2014 2015 2016
Unemployment rate
Persons in work(right)
Source: Istat
2012 2013 2014 2015 2016
Industry (net of construction)
Construction
105
60
65
70
75
80
85
90
95
100
Italy - Production indices(Base 2010=100)
THE ITALIAN ECONOMY AND ENERGY
20 ANNUAL REPORT UP 2016
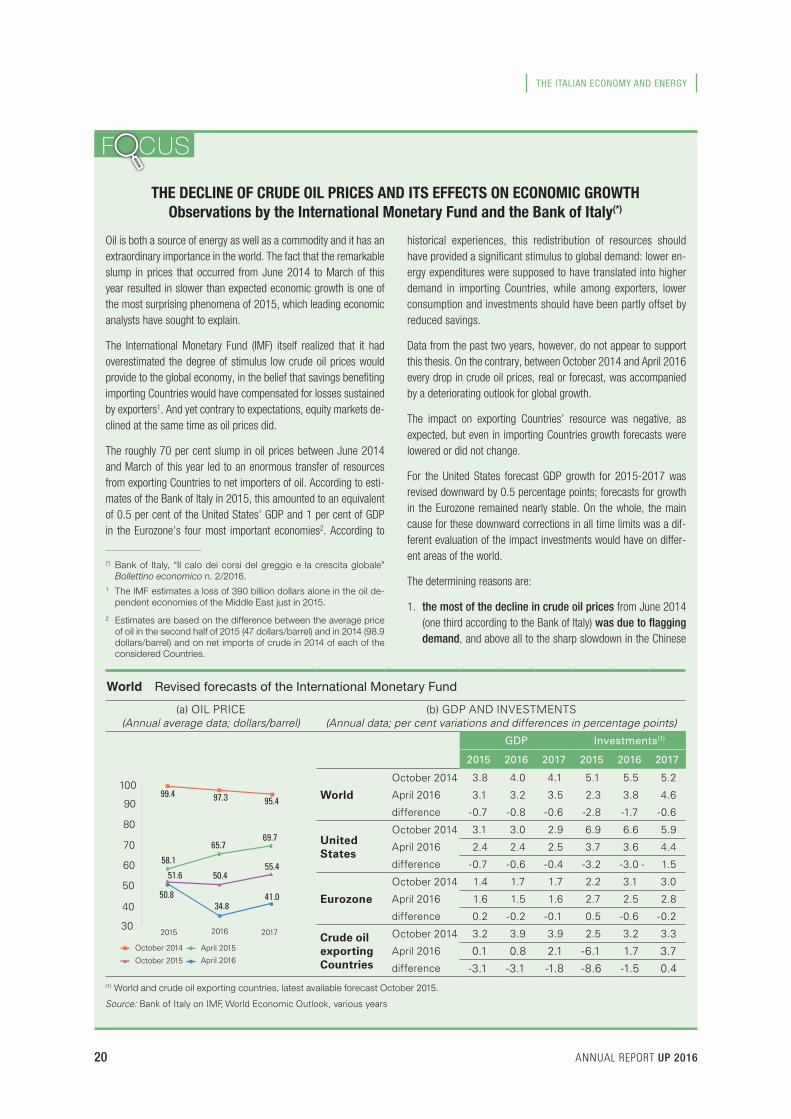
World Revised forecasts of the International Monetary Fund
(a) OIL PRICE (Annual average data; dollars/barrel)
(b) GDP AND INVESTMENTS (Annual data; per cent variations and differences in percentage points)
GDP Investments(1)
2015 2016 2017 2015 2016 2017
100
9099.4
58.1
51.6
50.834.8
41.0
50.455.4
65.769.7
97.3 95.4
80
70
60
50
40
30
April 2016October 2015
April 2015October 2014
2015 2016 2017
World
October 2014 3.8 4.0 4.1 5.1 5.5 5.2
April 2016 3.1 3.2 3.5 2.3 3.8 4.6
difference -0.7 -0.8 -0.6 -2.8 -1.7 -0.6
United States
October 2014 3.1 3.0 2.9 6.9 6.6 5.9
April 2016 2.4 2.4 2.5 3.7 3.6 4.4
difference -0.7 -0.6 -0.4 -3.2 -3.0 - 1.5
Eurozone
October 2014 1.4 1.7 1.7 2.2 3.1 3.0
April 2016 1.6 1.5 1.6 2.7 2.5 2.8
difference 0.2 -0.2 -0.1 0.5 -0.6 -0.2
Crude oil exportingCountries
October 2014 3.2 3.9 3.9 2.5 3.2 3.3
April 2016 0.1 0.8 2.1 -6.1 1.7 3.7difference -3.1 -3.1 -1.8 -8.6 -1.5 0.4
(1) World and crude oil exporting countries, latest available forecast October 2015.
Source: Bank of Italy on IMF, World Economic Outlook, various years
historical experiences, this redistribution of resources should have provided a significant stimulus to global demand: lower en-ergy expenditures were supposed to have translated into higher demand in importing Countries, while among exporters, lower consumption and investments should have been partly offset by reduced savings.
Data from the past two years, however, do not appear to support this thesis. On the contrary, between October 2014 and April 2016 every drop in crude oil prices, real or forecast, was accompanied by a deteriorating outlook for global growth.
The impact on exporting Countries’ resource was negative, as expected, but even in importing Countries growth forecasts were lowered or did not change.
For the United States forecast GDP growth for 2015-2017 was revised downward by 0.5 percentage points; forecasts for growth in the Eurozone remained nearly stable. On the whole, the main cause for these downward corrections in all time limits was a dif-ferent evaluation of the impact investments would have on differ-ent areas of the world.
The determining reasons are:
1. the most of the decline in crude oil prices from June 2014 (one third according to the Bank of Italy) was due to flagging demand, and above all to the sharp slowdown in the Chinese
Oil is both a source of energy as well as a commodity and it has an extraordinary importance in the world. The fact that the remarkable slump in prices that occurred from June 2014 to March of this year resulted in slower than expected economic growth is one of the most surprising phenomena of 2015, which leading economic analysts have sought to explain.
The International Monetary Fund (IMF) itself realized that it had overestimated the degree of stimulus low crude oil prices would provide to the global economy, in the belief that savings benefiting importing Countries would have compensated for losses sustained by exporters1. And yet contrary to expectations, equity markets de-clined at the same time as oil prices did.
The roughly 70 per cent slump in oil prices between June 2014 and March of this year led to an enormous transfer of resources from exporting Countries to net importers of oil. According to esti-mates of the Bank of Italy in 2015, this amounted to an equivalent of 0.5 per cent of the United States’ GDP and 1 per cent of GDP in the Eurozone’s four most important economies2. According to
(*) Bank of Italy, “Il calo dei corsi del greggio e la crescita globale” Bollettino economico n. 2/2016.
1 The IMF estimates a loss of 390 billion dollars alone in the oil de-pendent economies of the Middle East just in 2015.
2 Estimates are based on the difference between the average price of oil in the second half of 2015 (47 dollars/barrel) and in 2014 (98.9 dollars/barrel) and on net imports of crude in 2014 of each of the considered Countries.
THE DECLINE OF CRUDE OIL PRICES AND ITS EFFECTS ON ECONOMIC GROWTHObservations by the International Monetary Fund and the Bank of Italy(*)
ANNUAL REPORT UP 2016 21
THE ITALIAN ECONOMY AND ENERGY
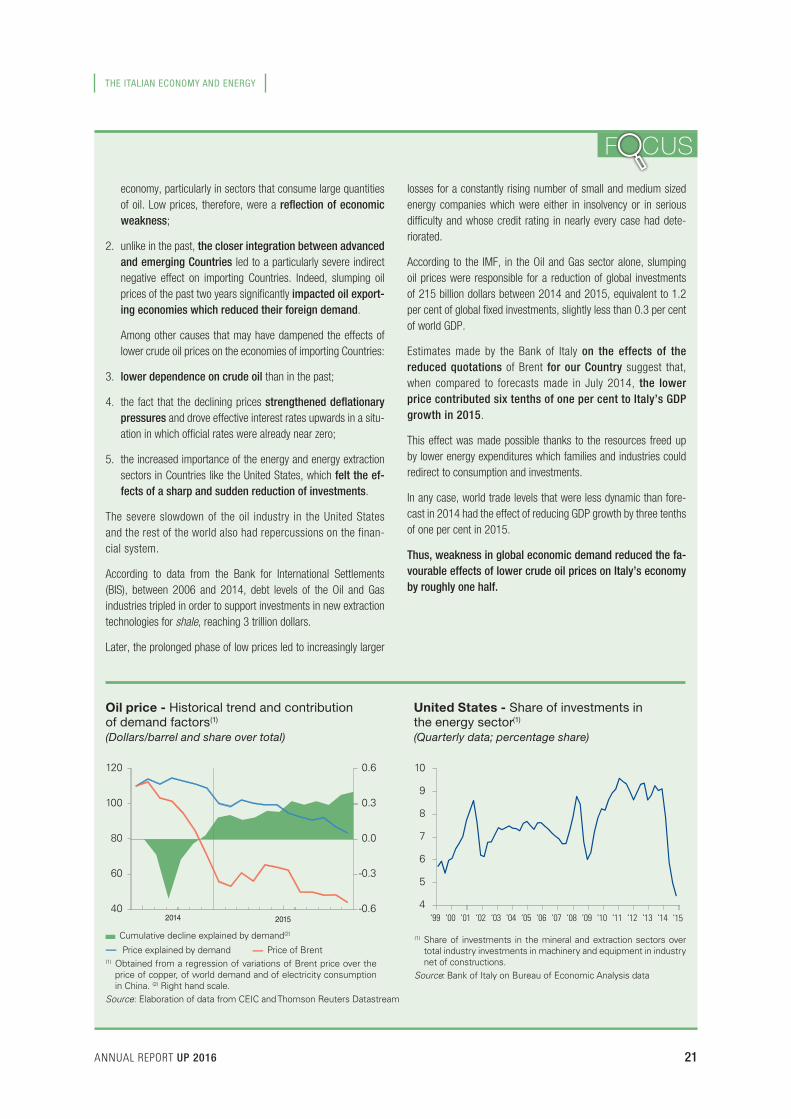
Source: Elaboration of data from CEIC and Thomson Reuters Datastream
Source: Bank of Italy on Bureau of Economic Analysis data
(1) Share of investments in the mineral and extraction sectors over total industry investments in machinery and equipment in industry net of constructions.(1) Obtained from a regression of variations of Brent price over the
price of copper, of world demand and of electricity consumption in China. (2) Right hand scale.
Price of Brent Price explained by demand
Cumulative decline explained by demand(2)
Oil price - Historical trend and contribution of demand factors(1)
(Dollars/barrel and share over total)
United States - Share of investments in the energy sector(1)
(Quarterly data; percentage share)
-0.6
-0.3
0.0
0.3
0.6
40
60
80
100
120
20152014
4
5
6
7
8
9
10
‘99 ‘00 ‘01 ‘02 ‘03 ‘04 ‘05 ‘06 ‘07 ‘08 ‘09 ‘10 ‘11 ‘12 ‘13 ‘14 ‘15
economy, particularly in sectors that consume large quantities of oil. Low prices, therefore, were a reflection of economic weakness;
2. unlike in the past, the closer integration between advanced and emerging Countries led to a particularly severe indirect negative effect on importing Countries. Indeed, slumping oil prices of the past two years significantly impacted oil export-ing economies which reduced their foreign demand.
Among other causes that may have dampened the effects of lower crude oil prices on the economies of importing Countries:
3. lower dependence on crude oil than in the past;
4. the fact that the declining prices strengthened deflationary pressures and drove effective interest rates upwards in a situ-ation in which official rates were already near zero;
5. the increased importance of the energy and energy extraction sectors in Countries like the United States, which felt the ef-fects of a sharp and sudden reduction of investments.
The severe slowdown of the oil industry in the United States and the rest of the world also had repercussions on the finan-cial system.
According to data from the Bank for International Settlements (BIS), between 2006 and 2014, debt levels of the Oil and Gas industries tripled in order to support investments in new extraction technologies for shale, reaching 3 trillion dollars.
Later, the prolonged phase of low prices led to increasingly larger
losses for a constantly rising number of small and medium sized energy companies which were either in insolvency or in serious difficulty and whose credit rating in nearly every case had dete-riorated.
According to the IMF, in the Oil and Gas sector alone, slumping oil prices were responsible for a reduction of global investments of 215 billion dollars between 2014 and 2015, equivalent to 1.2 per cent of global fixed investments, slightly less than 0.3 per cent of world GDP.
Estimates made by the Bank of Italy on the effects of the reduced quotations of Brent for our Country suggest that, when compared to forecasts made in July 2014, the lower price contributed six tenths of one per cent to Italy’s GDP growth in 2015.
This effect was made possible thanks to the resources freed up by lower energy expenditures which families and industries could redirect to consumption and investments.
In any case, world trade levels that were less dynamic than fore-cast in 2014 had the effect of reducing GDP growth by three tenths of one per cent in 2015.
Thus, weakness in global economic demand reduced the fa-vourable effects of lower crude oil prices on Italy’s economy by roughly one half.
THE ITALIAN ECONOMY AND ENERGY
22 ANNUAL REPORT UP 2016
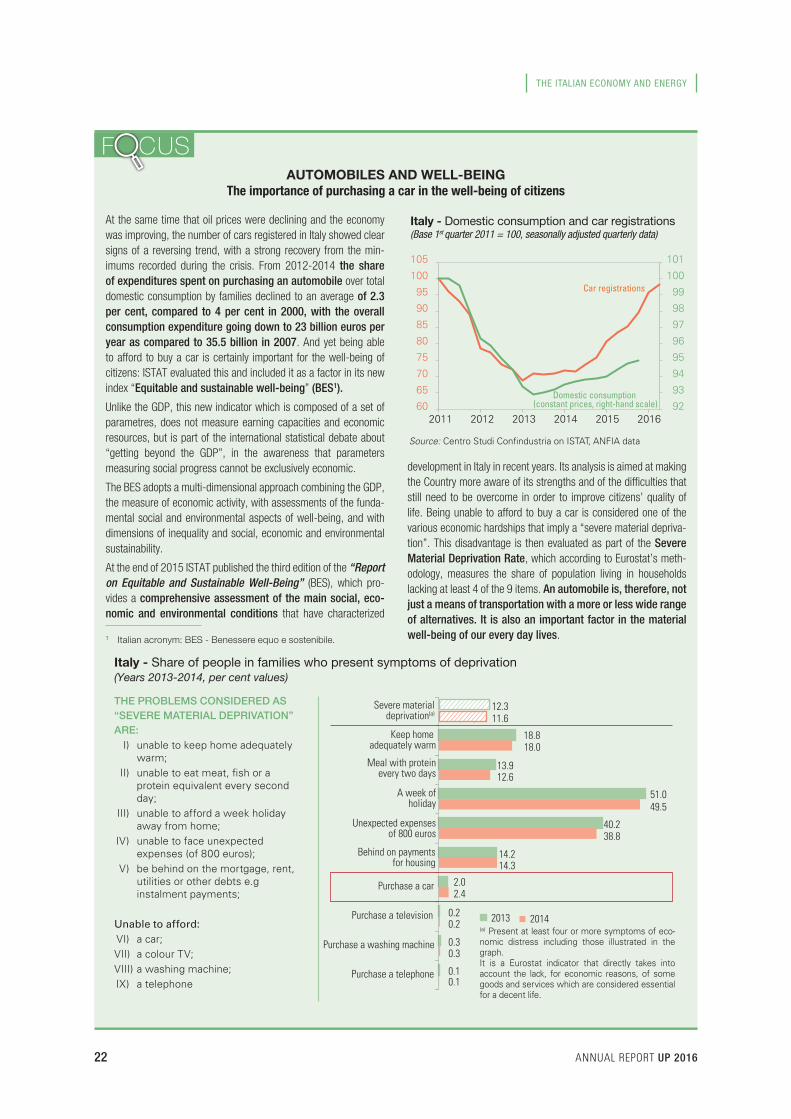
At the same time that oil prices were declining and the economy was improving, the number of cars registered in Italy showed clear signs of a reversing trend, with a strong recovery from the min-imums recorded during the crisis. From 2012-2014 the share of expenditures spent on purchasing an automobile over total domestic consumption by families declined to an average of 2.3 per cent, compared to 4 per cent in 2000, with the overall consumption expenditure going down to 23 billion euros per year as compared to 35.5 billion in 2007. And yet being able to afford to buy a car is certainly important for the well-being of citizens: ISTAT evaluated this and included it as a factor in its new index “Equitable and sustainable well-being” (BES1).
Unlike the GDP, this new indicator which is composed of a set of parametres, does not measure earning capacities and economic resources, but is part of the international statistical debate about “getting beyond the GDP”, in the awareness that parameters measuring social progress cannot be exclusively economic.
The BES adopts a multi-dimensional approach combining the GDP, the measure of economic activity, with assessments of the funda-mental social and environmental aspects of well-being, and with dimensions of inequality and social, economic and environmental sustainability.
At the end of 2015 ISTAT published the third edition of the “Report on Equitable and Sustainable Well-Being” (BES), which pro-vides a comprehensive assessment of the main social, eco-nomic and environmental conditions that have characterized
1 Italian acronym: BES - Benessere equo e sostenibile.
AUTOMOBILES AND WELL-BEING The importance of purchasing a car in the well-being of citizens
development in Italy in recent years. Its analysis is aimed at making the Country more aware of its strengths and of the difficulties that still need to be overcome in order to improve citizens’ quality of life. Being unable to afford to buy a car is considered one of the various economic hardships that imply a “severe material depriva-tion”. This disadvantage is then evaluated as part of the Severe Material Deprivation Rate, which according to Eurostat’s meth-odology, measures the share of population living in households lacking at least 4 of the 9 items. An automobile is, therefore, not just a means of transportation with a more or less wide range of alternatives. It is also an important factor in the material well-being of our every day lives.
60
65
70
75
80
85
90
95
105
100
92
93
94
95
96
97
98
99
100
101
2011 2012 2013 2014 2015 2016
Car registrations
Domestic consumption (constant prices, right-hand scale)
Source: Centro Studi Confindustria on ISTAT, ANFIA data
Italy - Domestic consumption and car registrations (Base 1st quarter 2011 = 100, seasonally adjusted quarterly data)
Italy - Share of people in families who present symptoms of deprivation (Years 2013-2014, per cent values)
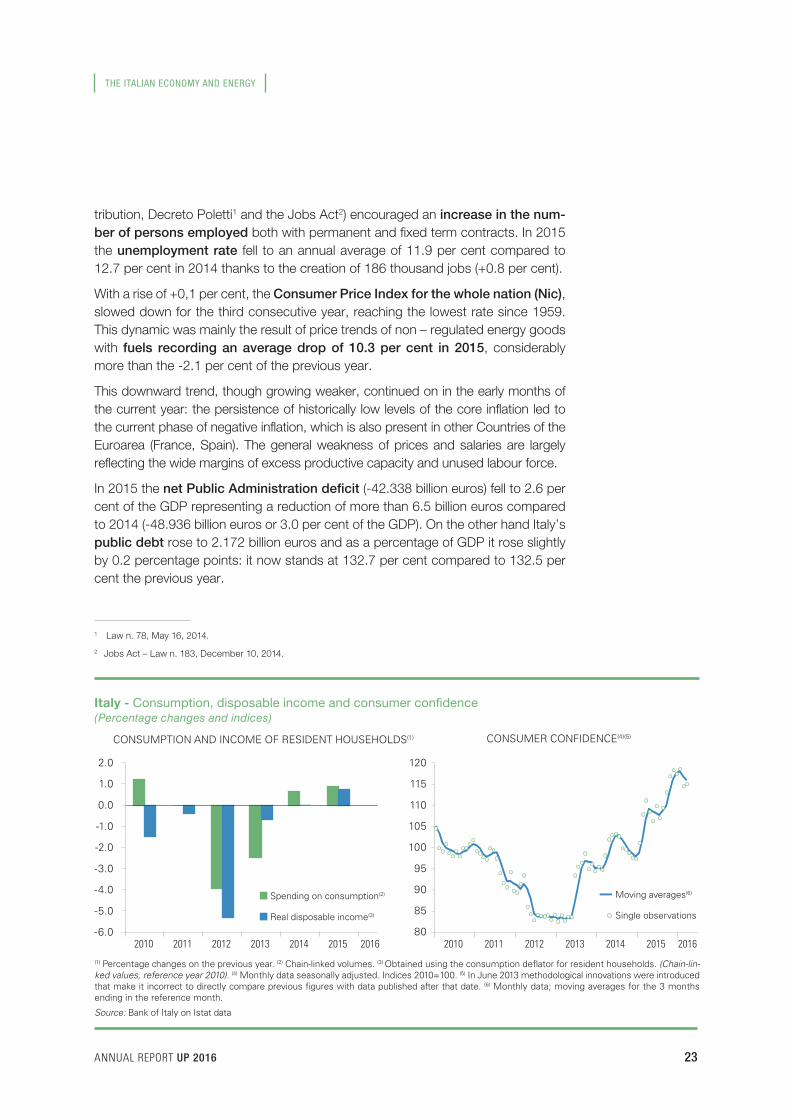
THE PROBLEMS CONSIDERED AS “SEVERE MATERIAL DEPRIVATION” ARE: I) unable to keep home adequately
warm; II) unable to eat meat, fish or a
protein equivalent every second day;
III) unable to afford a week holiday away from home;
IV) unable to face unexpected expenses (of 800 euros);
V) be behind on the mortgage, rent, utilities or other debts e.g instalment payments;
Unable to afford: VI) a car; VII) a colour TV; VIII) a washing machine; IX) a telephone
12.3
18.8
13.9
51.0
40.2
14.2
2.0
0.2
0.3
0.1
11.6
18.0
12.6
49.5
38.8
14.3
2.4
0.2
0.3
0.1
2013 2014
Severe materialdeprivation(a)
Keep home adequately warm
Meal with proteinevery two days
A week ofholiday
Unexpected expensesof 800 euros
Behind on paymentsfor housing
Purchase a car
Purchase a television
Purchase a washing machine
Purchase a telephone
(a) Present at least four or more symptoms of eco-nomic distress including those illustrated in the graph.It is a Eurostat indicator that directly takes into account the lack, for economic reasons, of some goods and services which are considered essential for a decent life.
ANNUAL REPORT UP 2016 23
THE ITALIAN ECONOMY AND ENERGY
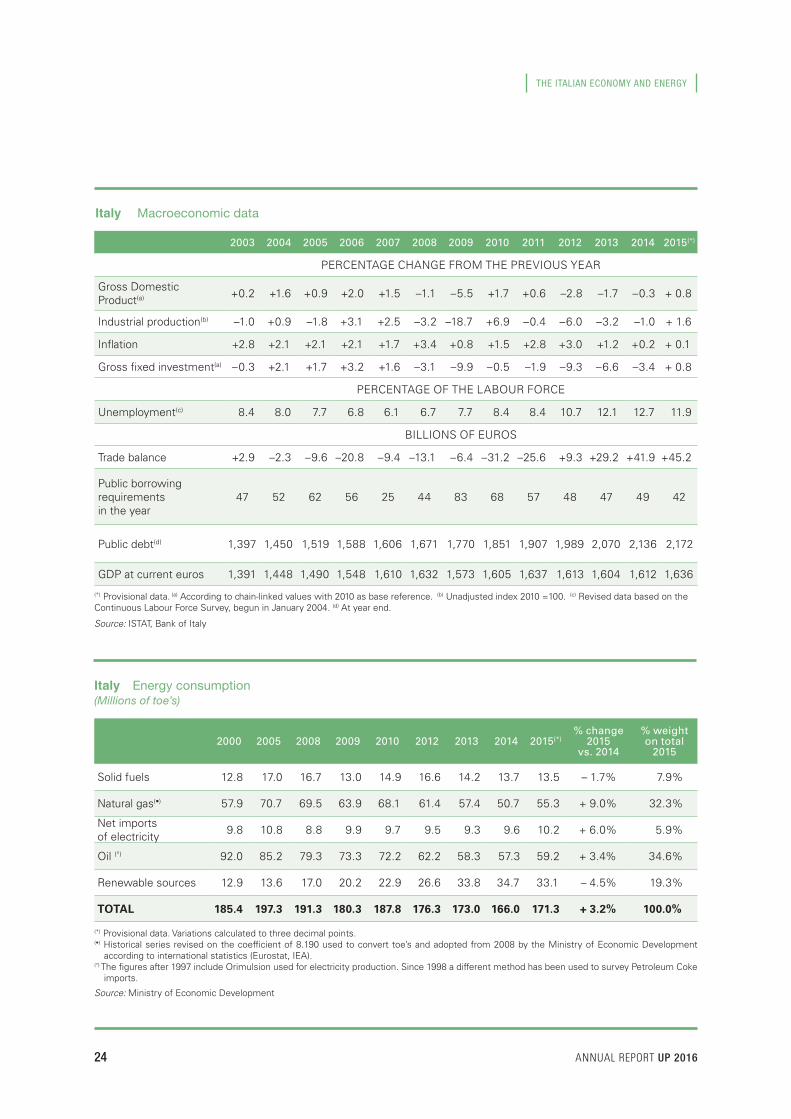
tribution, Decreto Poletti1 and the Jobs Act2) encouraged an increase in the num-ber of persons employed both with permanent and fixed term contracts. In 2015 the unemployment rate fell to an annual average of 11.9 per cent compared to 12.7 per cent in 2014 thanks to the creation of 186 thousand jobs (+0.8 per cent).
With a rise of +0,1 per cent, the Consumer Price Index for the whole nation (Nic), slowed down for the third consecutive year, reaching the lowest rate since 1959. This dynamic was mainly the result of price trends of non – regulated energy goods with fuels recording an average drop of 10.3 per cent in 2015, considerably more than the -2.1 per cent of the previous year.
This downward trend, though growing weaker, continued on in the early months of the current year: the persistence of historically low levels of the core inflation led to the current phase of negative inflation, which is also present in other Countries of the Euroarea (France, Spain). The general weakness of prices and salaries are largely reflecting the wide margins of excess productive capacity and unused labour force.
In 2015 the net Public Administration deficit (-42.338 billion euros) fell to 2.6 per cent of the GDP representing a reduction of more than 6.5 billion euros compared to 2014 (-48.936 billion euros or 3.0 per cent of the GDP). On the other hand Italy’s public debt rose to 2.172 billion euros and as a percentage of GDP it rose slightly by 0.2 percentage points: it now stands at 132.7 per cent compared to 132.5 per cent the previous year.
1 Law n. 78, May 16, 2014.
2 Jobs Act – Law n. 183, December 10, 2014.
(1) Percentage changes on the previous year. (2) Chain-linked volumes. (3) Obtained using the consumption deflator for resident households. (Chain-lin-ked values, reference year 2010). (4) Monthly data seasonally adjusted. Indices 2010=100. (5) In June 2013 methodological innovations were introduced that make it incorrect to directly compare previous figures with data published after that date. (6) Monthly data; moving averages for the 3 months ending in the reference month.
Source: Bank of Italy on Istat data
CONSUMPTION AND INCOME OF RESIDENT HOUSEHOLDS(1)
-6.0
-5.0
-4.0
-3.0
-2.0
-1.0
0.0
1.0
2.0
Spending on consumption(2)
Real disposable income(3)
2010 2011 2012 2013 2014 2015 201680
85
90
95
100
105
110
115
120
2010 2011 2012 2013 2014 2015 2016
Moving averages(6)
Single observations
CONSUMER CONFIDENCE(4)(5)
Italy - Consumption, disposable income and consumer confidence(Percentage changes and indices)
THE ITALIAN ECONOMY AND ENERGY
24 ANNUAL REPORT UP 2016
Italy Energy consumption(Millions of toe’s)
2000 2005 2008 2009 2010 2012 2013 2014 2015(*)% change
2015 vs. 2014
% weight on total
2015
Solid fuels 12.8 17.0 16.7 13.0 14.9 16.6 14.2 13.7 13.5 – 1.7% 7.9%
Natural gas(•) 57.9 70.7 69.5 63.9 68.1 61.4 57.4 50.7 55.3 + 9.0% 32.3%
Net imports of electricity 9.8 10.8 8.8 9.9 9.7 9.5 9.3 9.6 10.2 + 6.0% 5.9%
Oil (°) 92.0 85.2 79.3 73.3 72.2 62.2 58.3 57.3 59.2 + 3.4% 34.6%
Renewable sources 12.9 13.6 17.0 20.2 22.9 26.6 33.8 34.7 33.1 – 4.5% 19.3%
TOTAL 185.4 197.3 191.3 180.3 187.8 176.3 173.0 166.0 171.3 + 3.2% 100.0%
(*) Provisional data. Variations calculated to three decimal points.(•) Historical series revised on the coefficient of 8.190 used to convert toe’s and adopted from 2008 by the Ministry of Economic Development
according to international statistics (Eurostat, IEA).(°) The figures after 1997 include Orimulsion used for electricity production. Since 1998 a different method has been used to survey Petroleum Coke
imports.
Source: Ministry of Economic Development
Italy Macroeconomic data
2003 2004 2005 2006 2007 2008 2009 2010 2011 2012 2013 2014 2015(*)
PERCENTAGE CHANGE FROM THE PREVIOUS YEAR
Gross Domestic Product(a) +0.2 +1.6 +0.9 +2.0 +1.5 –1.1 –5.5 +1.7 +0.6 –2.8 –1.7 –0.3 + 0.8
Industrial production(b) –1.0 +0.9 –1.8 +3.1 +2.5 –3.2 –18.7 +6.9 –0.4 –6.0 –3.2 –1.0 + 1.6
Inflation +2.8 +2.1 +2.1 +2.1 +1.7 +3.4 +0.8 +1.5 +2.8 +3.0 +1.2 +0.2 + 0.1
Gross fixed investment(a) –0.3 +2.1 +1.7 +3.2 +1.6 –3.1 –9.9 –0.5 –1.9 –9.3 –6.6 –3.4 + 0.8
PERCENTAGE OF THE LABOUR FORCE
Unemployment(c) 8.4 8.0 7.7 6.8 6.1 6.7 7.7 8.4 8.4 10.7 12.1 12.7 11.9
BILLIONS OF EUROS
Trade balance +2.9 –2.3 –9.6 –20.8 –9.4 –13.1 –6.4 –31.2 –25.6 +9.3 +29.2 +41.9 +45.2
Public borrowing requirements in the year
47 52 62 56 25 44 83 68 57 48 47 49 42
Public debt(d) 1,397 1,450 1,519 1,588 1,606 1,671 1,770 1,851 1,907 1,989 2,070 2,136 2,172
GDP at current euros 1,391 1,448 1,490 1,548 1,610 1,632 1,573 1,605 1,637 1,613 1,604 1,612 1,636
(*) Provisional data. (a) According to chain-linked values with 2010 as base reference. (b) Unadjusted index 2010 =100. (c) Revised data based on the Continuous Labour Force Survey, begun in January 2004. (d) At year end.
Source: ISTAT, Bank of Italy
ANNUAL REPORT UP 2016 25
THE ITALIAN ECONOMY AND ENERGY
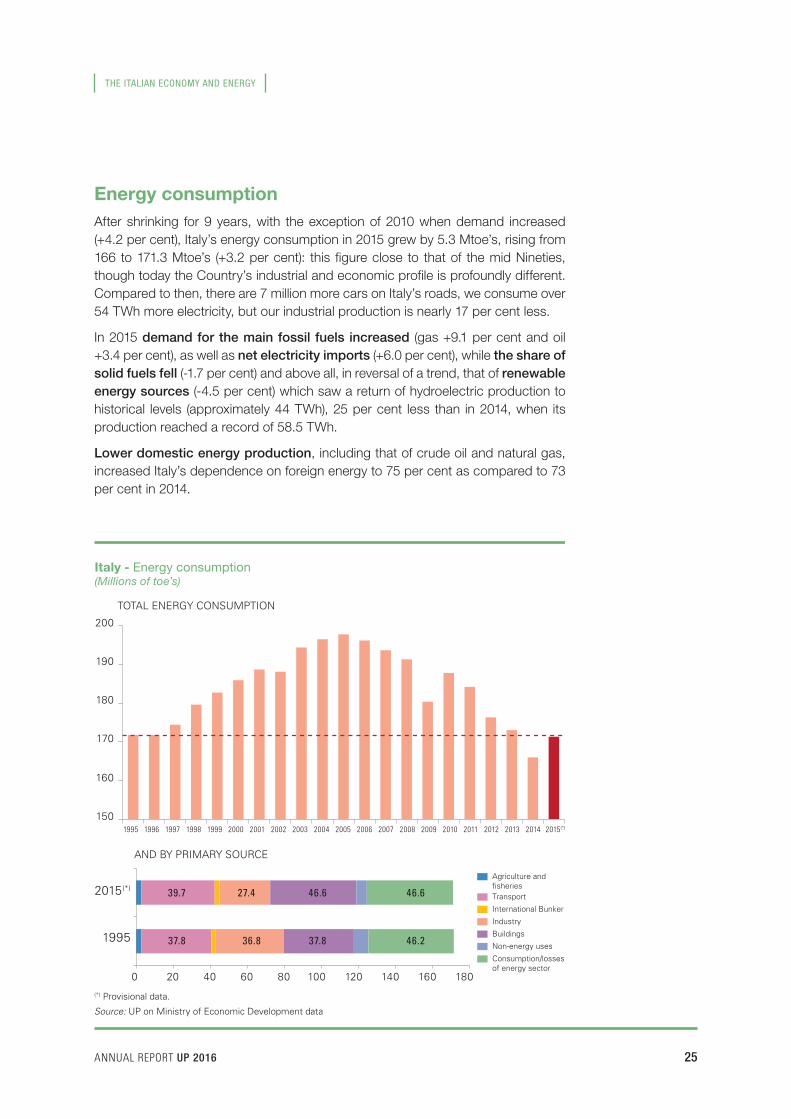
Energy consumptionAfter shrinking for 9 years, with the exception of 2010 when demand increased (+4.2 per cent), Italy’s energy consumption in 2015 grew by 5.3 Mtoe’s, rising from 166 to 171.3 Mtoe’s (+3.2 per cent): this figure close to that of the mid Nineties, though today the Country’s industrial and economic profile is profoundly different. Compared to then, there are 7 million more cars on Italy’s roads, we consume over 54 TWh more electricity, but our industrial production is nearly 17 per cent less.
In 2015 demand for the main fossil fuels increased (gas +9.1 per cent and oil +3.4 per cent), as well as net electricity imports (+6.0 per cent), while the share of solid fuels fell (-1.7 per cent) and above all, in reversal of a trend, that of renewable energy sources (-4.5 per cent) which saw a return of hydroelectric production to historical levels (approximately 44 TWh), 25 per cent less than in 2014, when its production reached a record of 58.5 TWh.
Lower domestic energy production, including that of crude oil and natural gas, increased Italy’s dependence on foreign energy to 75 per cent as compared to 73 per cent in 2014.
(*) Provisional data.
Source: UP on Ministry of Economic Development data
1995
2015(*)
0 20 40 60 80 100 120 140 160 180
Agriculture andfisheriesTransport
International Bunker
Industry
Buildings
Non-energy uses
Consumption/lossesof energy sector
AND BY PRIMARY SOURCE
Italy - Energy consumption(Millions of toe’s)
1995 1996 1997 1998 1999 2000 2001 2002 2003 2004 2005 2006 2007 2008 2009 2010 2011 2012 2013 2014 2015(*)
150
160
170
180
190
200
TOTAL ENERGY CONSUMPTION
39.7 27.4 46.6 46.6
37.8 36.8 37.8 46.2
THE ITALIAN ECONOMY AND ENERGY
26 ANNUAL REPORT UP 2016
Solid fuels In 2015 demand for solid fuels estimated at 13.5 Mtoe’s fell by -1.7 per cent com-pared to 2014: since 2012 this is the third year in a row that demand for this energy source has declined. Its main sectors of use – the steel industry and thermoelectric production are reflecting the effects of an economy that has not yet recovered1, and also the growing difficulties faced by coal-fired plants whose operations, in spite of their low costs and high efficiency, are in conflict with decarbonisation scenarios.
2015 saw a continuation of the decommissioning of several plants2 which will al-ready be completed by 2017-2019, as well as environmental assessments that al-ready in March 2014 led to the suspension of activities of two 300 MW units in the Vado Ligure plant (Tirreno Power), and the postponement of plans to build the new 460 MW unit involving investments of 1.2 billion euros.
The situation also remains critical for the Edipower plant in Brindisi (closed for more than 2 years). In 2015 the Conference of Services planned to reduce the plant’s installed capacities by half (from 640 MW to 300 MW) and to partly replace the use of coal with Secondary Solid Fuels (CSS3) produced in the Region, a project which is meeting with the opposition of local Authorities.
Finally, with regard to Sulcis, the Decree Destination Italy4 provides incentives to produce up to 2,100 GWh/year of electricity from an innovative coal plant which will have significantly lower atmospheric emissions. At present, no choises have yet been made on the question, and decisions are still being awaited by the Region Sardinia, whether it intends to go ahead with the project or whether it will change strategy, also in the light of the Paris Climate Conference5.
Research activities are nonetheless underway with the aim of developing innovative technologies as part of the “Protocol of Understanding to Develop a Technology Research Hub”, signed in 2013 between the Region Sardinia and the Ministry of Economic Development.
The energy and oil billsOne further effect of lower oil prices (-46.7 per cent) on the Italian economy in 2015 was another sizeable reduction in the energy bill, in spite of higher energy con-sumption (+3.2 per cent) and a weaker euro against the dollar.
National expenditures on foreign energy (the net difference between expenditures
1 According to FederCostruzioni, in 2015 the steel sector suffered a 4 per cent production decline and, according to ISTAT, the construction sector, the main destination for steel products, shrank by a further 1 per cent. In addition, operations are underway to transfer Ilva’s complex of companies under administrative receivership.
2 Among the 23 plants whose closure h as been announced by Enel, there are the coal plants of Genoa, Bastardo and Marghera. In the other plants evaluations are underway to improve their efficiency and reduce their environ-mental impact.
3 Italian acronym: CSS – Combustibile Solido Secondario.
4 Decree-Law December 23, 2013 n. 145, converted with amendments by Law February 21 2014, n. 9.
5 Twenty-first annual session of Members of the United Nations Framework Convention of Climate Change (UN-FCCC) held in Paris from November 30 to December 12, 2015. On the effects for the oil sector see also chapter “The Paris Agreement (COP 21) and its impact on the sector” on page 83.
ANNUAL REPORT UP 2016 27
THE ITALIAN ECONOMY AND ENERGY
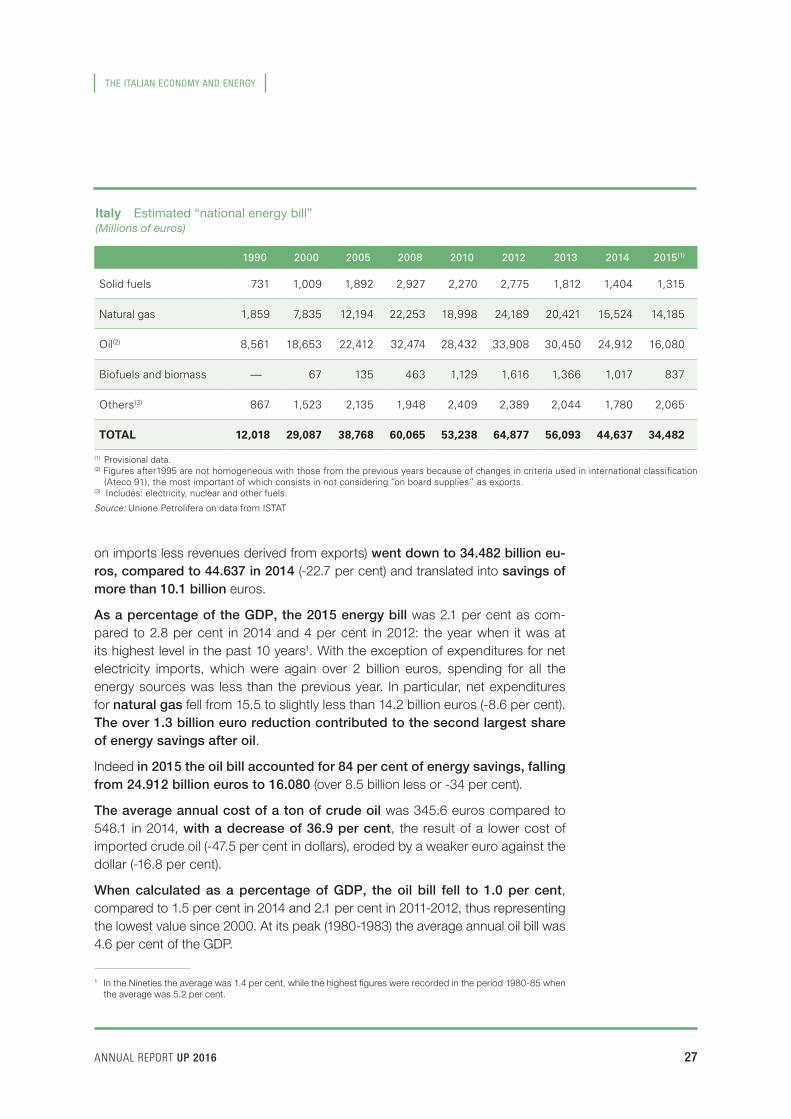
Italy Estimated “national energy bill” (Millions of euros)
1990 2000 2005 2008 2010 2012 2013 2014 2015(1)
Solid fuels 731 1,009 1,892 2,927 2,270 2,775 1,812 1,404 1,315
Natural gas 1,859 7,835 12,194 22,253 18,998 24,189 20,421 15,524 14,185
Oil(2) 8,561 18,653 22,412 32,474 28,432 33,908 30,450 24,912 16,080
Biofuels and biomass — 67 135 463 1,129 1,616 1,366 1,017 837
Others(3) 867 1,523 2,135 1,948 2,409 2,389 2,044 1,780 2,065
TOTAL 12,018 29,087 38,768 60,065 53,238 64,877 56,093 44,637 34,482
(1) Provisional data.(2) Figures after1995 are not homogeneous with those from the previous years because of changes in criteria used in international classification
(Ateco 91), the most important of which consists in not considering “on board supplies” as exports.(3) Includes: electricity, nuclear and other fuels.
Source: Unione Petrolifera on data from ISTAT
on imports less revenues derived from exports) went down to 34.482 billion eu-ros, compared to 44.637 in 2014 (-22.7 per cent) and translated into savings of more than 10.1 billion euros.
As a percentage of the GDP, the 2015 energy bill was 2.1 per cent as com-pared to 2.8 per cent in 2014 and 4 per cent in 2012: the year when it was at its highest level in the past 10 years1. With the exception of expenditures for net electricity imports, which were again over 2 billion euros, spending for all the energy sources was less than the previous year. In particular, net expenditures for natural gas fell from 15.5 to slightly less than 14.2 billion euros (-8.6 per cent). The over 1.3 billion euro reduction contributed to the second largest share of energy savings after oil.
Indeed in 2015 the oil bill accounted for 84 per cent of energy savings, falling from 24.912 billion euros to 16.080 (over 8.5 billion less or -34 per cent).
The average annual cost of a ton of crude oil was 345.6 euros compared to 548.1 in 2014, with a decrease of 36.9 per cent, the result of a lower cost of imported crude oil (-47.5 per cent in dollars), eroded by a weaker euro against the dollar (-16.8 per cent).
When calculated as a percentage of GDP, the oil bill fell to 1.0 per cent, compared to 1.5 per cent in 2014 and 2.1 per cent in 2011-2012, thus representing the lowest value since 2000. At its peak (1980-1983) the average annual oil bill was 4.6 per cent of the GDP.
1 In the Nineties the average was 1.4 per cent, while the highest figures were recorded in the period 1980-85 when the average was 5.2 per cent.
Italy Estimated “national energy bill” (Millions of euros)
1990 1995 2000 2005 2008 2010 2012 2013 2014(1)
Solid fuels 731 991 1,009 1,892 2,927 2,270 2,775 1,812 1,405
Natural gas 1,859 2,661 7,835 12,194 22,253 18,998 24,189 20,421 15,134
Oil(2) 8,561 9,023 18,653 22,412 32,474 28,432 33,908 30,450 24,917
Biofuels and biomass — — 67 135 463 1,129 1,616 1,366 1,015
Others(3) 867 1,563 1,523 2,135 1,948 2,409 2,389 2,044 1,779
TOTAL 12,018 14,238 29,087 38,768 60,065 53,238 64,877 56,093 44,250(1) Provisional data.(2) Figures from 1995 and after are not homogeneous with those from the previous years because of changes in criteria used in international
classification (Ateco 91), the most important of which consists in not considering “on board supplies” as exports.(3) Includes: electricity, nuclear and other fuels.
Source: Unione Petrolifera on data from ISTAT
THE ITALIAN ECONOMY AND ENERGY
28 ANNUAL REPORT UP 2016
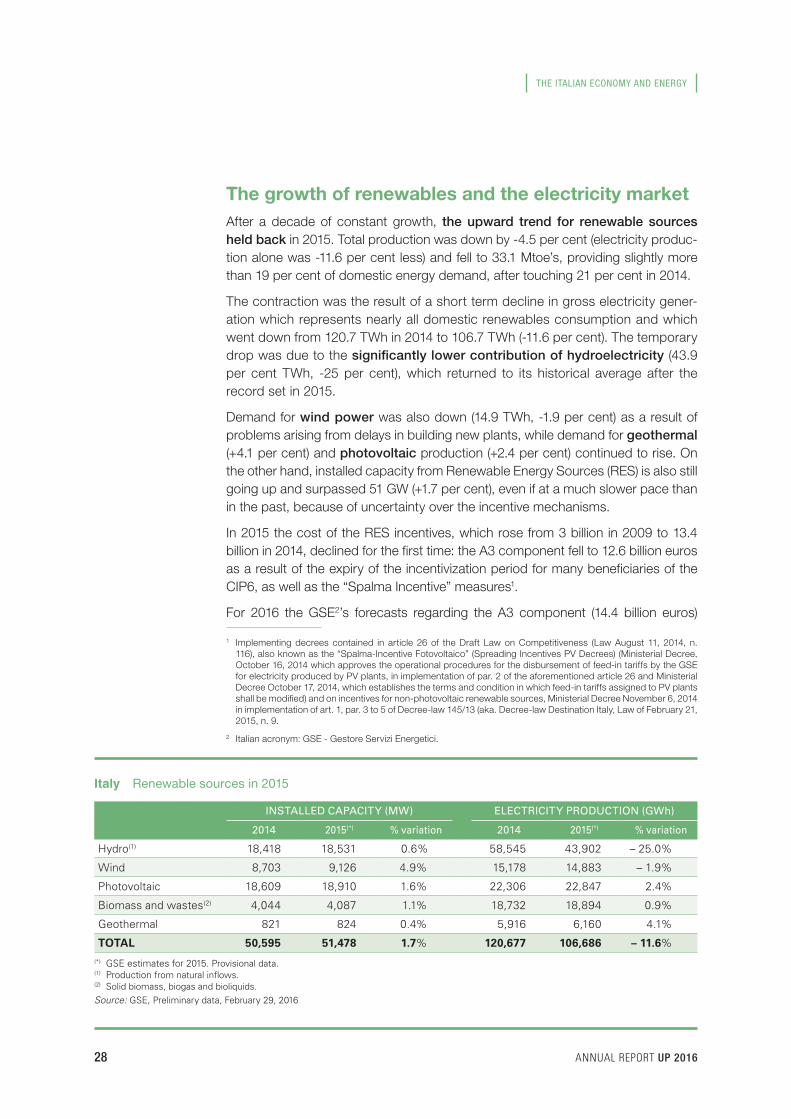
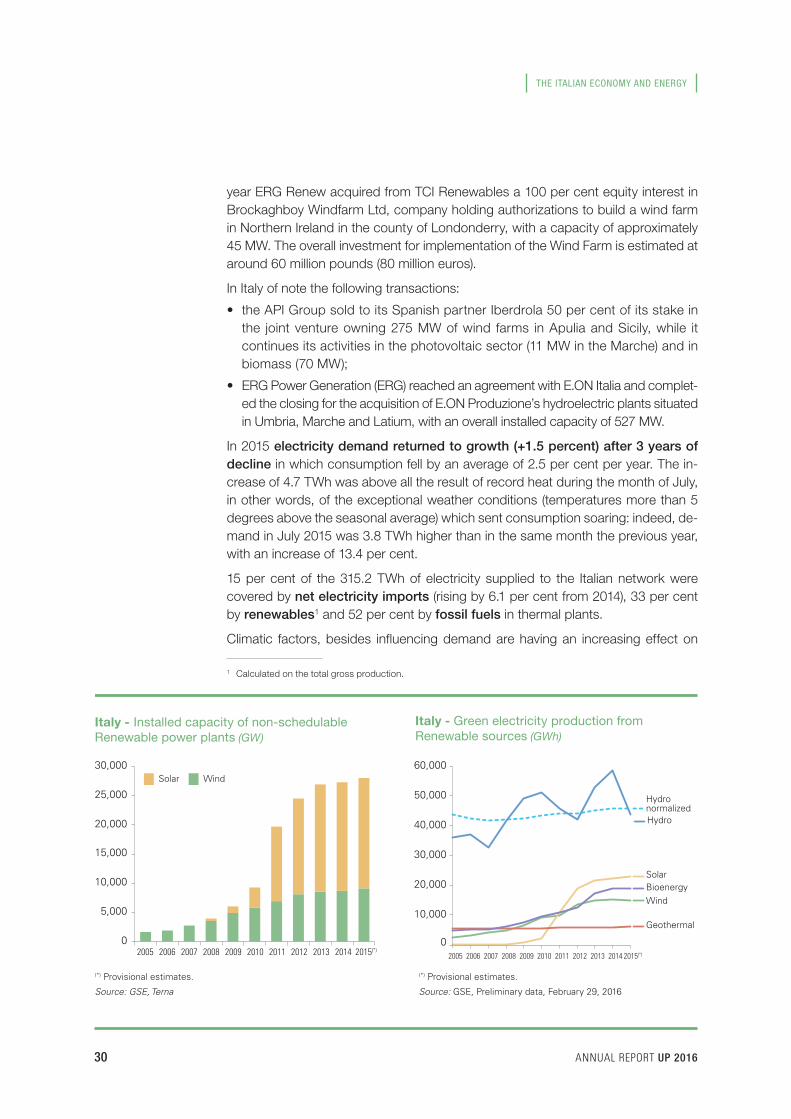
The growth of renewables and the electricity market After a decade of constant growth, the upward trend for renewable sources held back in 2015. Total production was down by -4.5 per cent (electricity produc-tion alone was -11.6 per cent less) and fell to 33.1 Mtoe’s, providing slightly more than 19 per cent of domestic energy demand, after touching 21 per cent in 2014.
The contraction was the result of a short term decline in gross electricity gener-ation which represents nearly all domestic renewables consumption and which went down from 120.7 TWh in 2014 to 106.7 TWh (-11.6 per cent). The temporary drop was due to the significantly lower contribution of hydroelectricity (43.9 per cent TWh, -25 per cent), which returned to its historical average after the record set in 2015.
Demand for wind power was also down (14.9 TWh, -1.9 per cent) as a result of problems arising from delays in building new plants, while demand for geothermal (+4.1 per cent) and photovoltaic production (+2.4 per cent) continued to rise. On the other hand, installed capacity from Renewable Energy Sources (RES) is also still going up and surpassed 51 GW (+1.7 per cent), even if at a much slower pace than in the past, because of uncertainty over the incentive mechanisms.
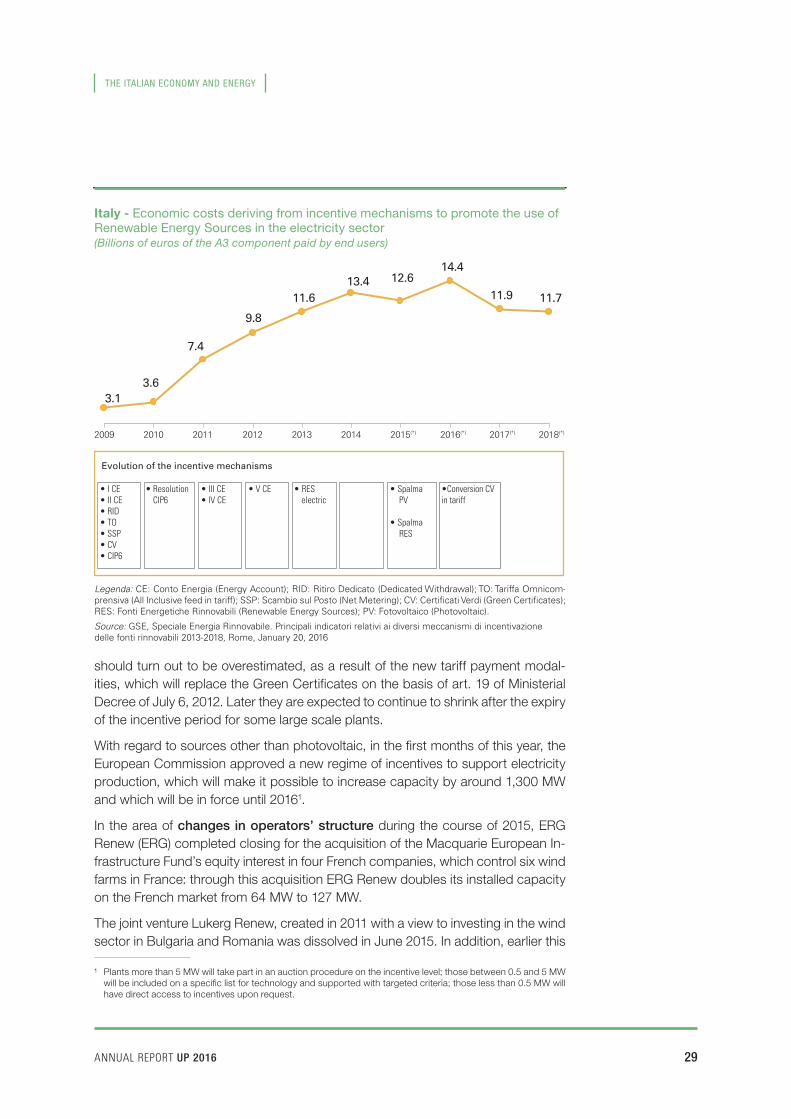
In 2015 the cost of the RES incentives, which rose from 3 billion in 2009 to 13.4 billion in 2014, declined for the first time: the A3 component fell to 12.6 billion euros as a result of the expiry of the incentivization period for many beneficiaries of the CIP6, as well as the “Spalma Incentive” measures1.
For 2016 the GSE2’s forecasts regarding the A3 component (14.4 billion euros)
1 Implementing decrees contained in article 26 of the Draft Law on Competitiveness (Law August 11, 2014, n. 116), also known as the “Spalma-Incentive Fotovoltaico” (Spreading Incentives PV Decrees) (Ministerial Decree, October 16, 2014 which approves the operational procedures for the disbursement of feed-in tariffs by the GSE for electricity produced by PV plants, in implementation of par. 2 of the aforementioned article 26 and Ministerial Decree October 17, 2014, which establishes the terms and condition in which feed-in tariffs assigned to PV plants shall be modified) and on incentives for non-photovoltaic renewable sources, Ministerial Decree November 6, 2014 in implementation of art. 1, par. 3 to 5 of Decree-law 145/13 (aka. Decree-law Destination Italy, Law of February 21, 2015, n. 9.
2 Italian acronym: GSE - Gestore Servizi Energetici.
Italy Renewable sources in 2015
INSTALLED CAPACITY (MW) ELECTRICITY PRODUCTION (GWh)
2014 2015(*) % variation 2014 2015(*) % variation
Hydro(1) 18,418 18,531 0.6% 58,545 43,902 – 25.0%
Wind 8,703 9,126 4.9% 15,178 14,883 – 1.9%
Photovoltaic 18,609 18,910 1.6% 22,306 22,847 2.4%
Biomass and wastes(2) 4,044 4,087 1.1% 18,732 18,894 0.9%
Geothermal 821 824 0.4% 5,916 6,160 4.1%
TOTAL 50,595 51,478 1.7% 120,677 106,686 – 11.6%(*) GSE estimates for 2015. Provisional data.(1) Production from natural inflows.(2) Solid biomass, biogas and bioliquids.Source: GSE, Preliminary data, February 29, 2016
ANNUAL REPORT UP 2016 29
THE ITALIAN ECONOMY AND ENERGY
should turn out to be overestimated, as a result of the new tariff payment modal-ities, which will replace the Green Certificates on the basis of art. 19 of Ministerial Decree of July 6, 2012. Later they are expected to continue to shrink after the expiry of the incentive period for some large scale plants.
With regard to sources other than photovoltaic, in the first months of this year, the European Commission approved a new regime of incentives to support electricity production, which will make it possible to increase capacity by around 1,300 MW and which will be in force until 20161.
In the area of changes in operators’ structure during the course of 2015, ERG Renew (ERG) completed closing for the acquisition of the Macquarie European In-frastructure Fund’s equity interest in four French companies, which control six wind farms in France: through this acquisition ERG Renew doubles its installed capacity on the French market from 64 MW to 127 MW.
The joint venture Lukerg Renew, created in 2011 with a view to investing in the wind sector in Bulgaria and Romania was dissolved in June 2015. In addition, earlier this
¹ Plants more than 5 MW will take part in an auction procedure on the incentive level; those between 0.5 and 5 MW will be included on a specific list for technology and supported with targeted criteria; those less than 0.5 MW will have direct access to incentives upon request.
11.711.9
14.412.613.4
11.6
9.8
7.4
3.63.1
2009 2010 2011 2012 2013 2014 2015(*) 2016(*) 2017(*) 2018(*)
Evolution of the incentive mechanisms
• I CE• II CE • RID • TO • SSP • CV • CIP6
• III CE• IV CE
• V CE • RES electric
• Spalma PV
• Spalma RES
•Conversion CV in tariff
• Resolution CIP6
Italy - Economic costs deriving from incentive mechanisms to promote the use ofRenewable Energy Sources in the electricity sector(Billions of euros of the A3 component paid by end users)
Legenda: CE: Conto Energia (Energy Account); RID: Ritiro Dedicato (Dedicated Withdrawal); TO: Tariffa Omnicom-prensiva (All Inclusive feed in tariff); SSP: Scambio sul Posto (Net Metering); CV: Certificati Verdi (Green Certificates); RES: Fonti Energetiche Rinnovabili (Renewable Energy Sources); PV: Fotovoltaico (Photovoltaic).
Source: GSE, Speciale Energia Rinnovabile. Principali indicatori relativi ai diversi meccanismi di incentivazione delle fonti rinnovabili 2013-2018, Rome, January 20, 2016
THE ITALIAN ECONOMY AND ENERGY
30 ANNUAL REPORT UP 2016
year ERG Renew acquired from TCI Renewables a 100 per cent equity interest in Brockaghboy Windfarm Ltd, company holding authorizations to build a wind farm in Northern Ireland in the county of Londonderry, with a capacity of approximately 45 MW. The overall investment for implementation of the Wind Farm is estimated at around 60 million pounds (80 million euros).
In Italy of note the following transactions:
• the API Group sold to its Spanish partner Iberdrola 50 per cent of its stake in the joint venture owning 275 MW of wind farms in Apulia and Sicily, while it continues its activities in the photovoltaic sector (11 MW in the Marche) and in biomass (70 MW);
• ERG Power Generation (ERG) reached an agreement with E.ON Italia and complet-ed the closing for the acquisition of E.ON Produzione’s hydroelectric plants situated in Umbria, Marche and Latium, with an overall installed capacity of 527 MW.
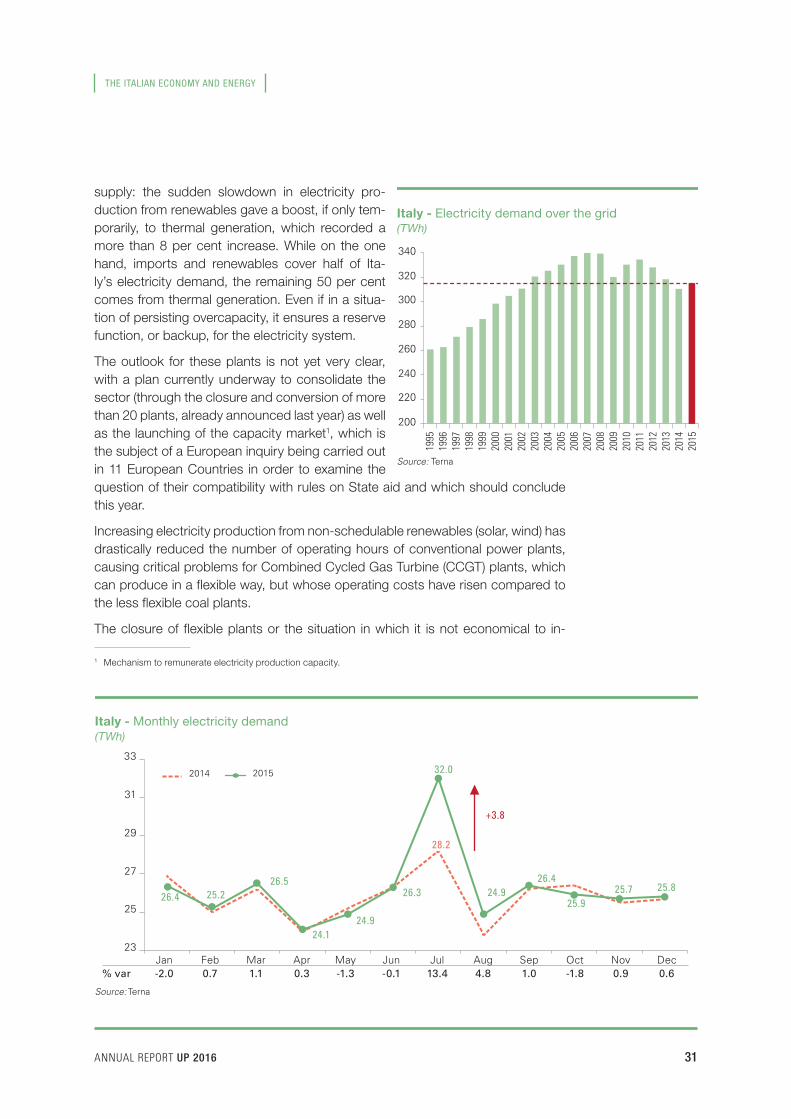
In 2015 electricity demand returned to growth (+1.5 percent) after 3 years of decline in which consumption fell by an average of 2.5 per cent per year. The in-crease of 4.7 TWh was above all the result of record heat during the month of July, in other words, of the exceptional weather conditions (temperatures more than 5 degrees above the seasonal average) which sent consumption soaring: indeed, de-mand in July 2015 was 3.8 TWh higher than in the same month the previous year, with an increase of 13.4 per cent.
15 per cent of the 315.2 TWh of electricity supplied to the Italian network were covered by net electricity imports (rising by 6.1 per cent from 2014), 33 per cent by renewables1 and 52 per cent by fossil fuels in thermal plants.
Climatic factors, besides influencing demand are having an increasing effect on
1 Calculated on the total gross production.
(*) Provisional estimates.
Source: GSE, Terna
(*) Provisional estimates.
Source: GSE, Preliminary data, February 29, 2016
2005 2006 2007 2008 2009 2010 2011 2012 2013 2014 2015(*)0
5,000
10,000
15,000
20,000
25,000
30,000WindSolar
10,000
20,000
30,000
40,000
50,000
60,000
HydronormalizedHydro
WindBioenergySolar
Geothermal
2005 2006 2007 2008 2009 2010 2011 2012 2013 2014 2015(*)
0
Italy - Installed capacity of non-schedulable Renewable power plants (GW)
Italy - Green electricity production fromRenewable sources (GWh)
ANNUAL REPORT UP 2016 31
THE ITALIAN ECONOMY AND ENERGY
supply: the sudden slowdown in electricity pro-duction from renewables gave a boost, if only tem-porarily, to thermal generation, which recorded a more than 8 per cent increase. While on the one hand, imports and renewables cover half of Ita-ly’s electricity demand, the remaining 50 per cent comes from thermal generation. Even if in a situa-tion of persisting overcapacity, it ensures a reserve function, or backup, for the electricity system.
The outlook for these plants is not yet very clear, with a plan currently underway to consolidate the sector (through the closure and conversion of more than 20 plants, already announced last year) as well as the launching of the capacity market1, which is the subject of a European inquiry being carried out in 11 European Countries in order to examine the question of their compatibility with rules on State aid and which should conclude this year.
Increasing electricity production from non-schedulable renewables (solar, wind) has drastically reduced the number of operating hours of conventional power plants, causing critical problems for Combined Cycled Gas Turbine (CCGT) plants, which can produce in a flexible way, but whose operating costs have risen compared to the less flexible coal plants.
The closure of flexible plants or the situation in which it is not economical to in-
1 Mechanism to remunerate electricity production capacity.
Italy - Monthly electricity demand(TWh)
Source: Terna
23
25
27
29
31
33
2014 2015
Jan Feb Mar Apr May Jun Jul Aug Sep Oct Nov Dec% var -2.0 0.7 1.1 0.3 -1.3 -0.1 13.4 4.8 1.0 -1.8 0.9 0.6
26.4 25.226.5
24.124.9
26.3
32.0
+3.8
24.926.4
25.925.7 25.8
28.2
Italy - Electricity demand over the grid(TWh)
1995
1996
1997
1998
1999
2000
2001
2002
2003
2004
2005
2006
2007
2008
2009
2010
2011
2012
2013
2014
2015
200
220
240
260
280
300
320
340
Source: Terna
THE ITALIAN ECONOMY AND ENERGY
32 ANNUAL REPORT UP 2016
vest in them put the electrical system at risk since these plants are necessary to ensure sufficient supply for the intermittent production of some renewables. Moreover, the presence of incentives for renewables distorts price signals that are required to stimulate in-vestments.
With the capacity market, producers will not only be paid for electricity produced but also for their capacity to produce it. Its adoption in Italy is currently being defined: based on Ministerial Decree of June 30, 2014 which approved the regulatory framework proposed by Terna and compatible with the timeline required for approval by the Commission, the market should begin operating from 2017 with the first auction to be held at the end of 2016.
In addition, the Italian Regulatory Authority for Elec-tricity Energy and Water (AEEGSI) proposed (Ruling 95/2015/eel) anticipating the capacity market in order to organize the first auctions for the delivery period (2017-2020) (“first implementation phase”).
The contribution of natural gasIn 2015 natural gas was the energy source which recorded the highest rise in de-mand. With an increase of 5.6 billion cubic metres (+9.1 per cent) its consumption again surpassed 67.5 billion cubic metres: the same volume as in 1999. However, gas demand is 17 billion cubic metres less than it was in 2008 (-20 per cent).
Factors which favoured gas consumption in 2015 were:
• winter temperatures that were colder by 1°C/day, which drove up consumption by households by approximately 3 billion cubic metres (+11.8 per cent);
• increased electricity demand (+1.5 per cent) associated with the need to com-pensate for less hydroelectric production (-25 per cent) returned to normal levels after the record of 2014 and resulted in a more than 3 billion cubic metre increase for power generation (+16.8 per cent).
Thus, gas showed its capability to swiftly compensate for potential RES electricity production shortages.
With regard to industrial consumption, gas demand contracted for the fifth year in a row (-3.4 per cent): the 14 billion cubic metres consumed in 2015 were 27 per cent less than the 19.2 billion of 2007.
On the other hand, demand from the transport sector continued to grow, surpass-ing 1.15 billion cubic metres (+9.3 per cent).
Source: GSE, Rapporto delle attività, March 16, 2016
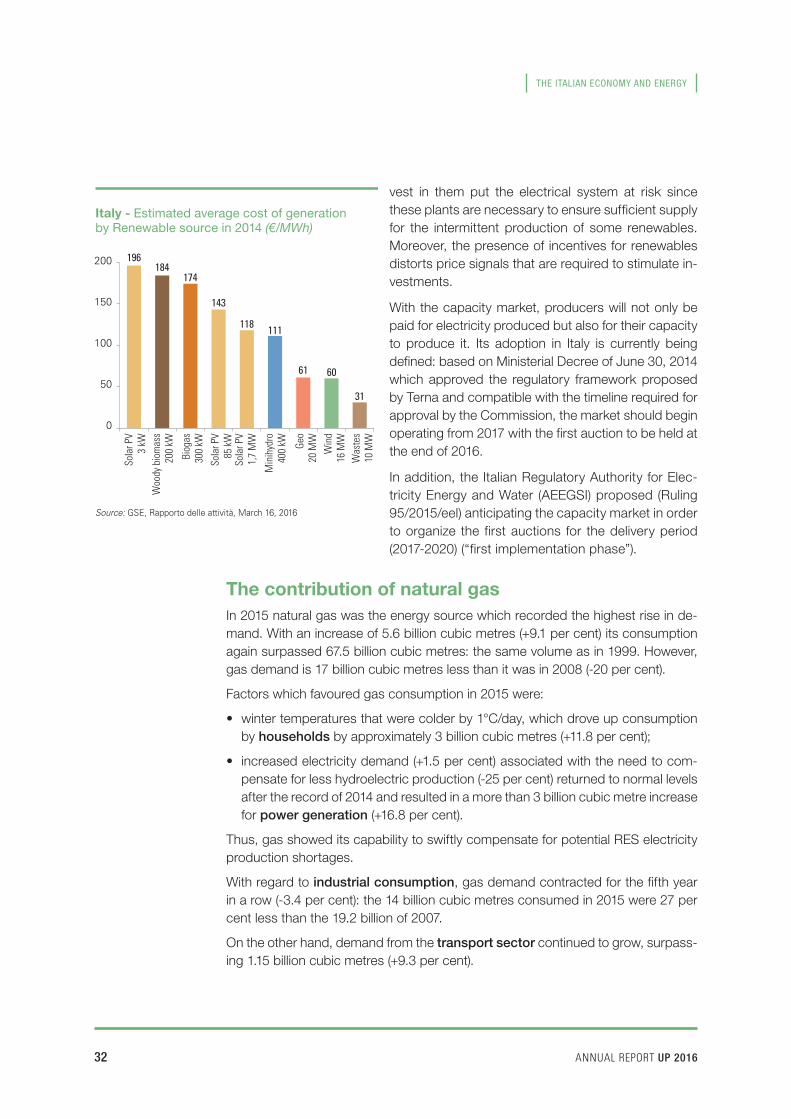
Italy - Estimated average cost of generation by Renewable source in 2014 (€/MWh)
Sola
r PV
3 kW
Woo
dy b
iom
ass
200
kW
Biog
as30
0 kW
Sola
r PV
85 k
WSo
lar P
V1,
7 M
W
Min
ihyd
ro40
0 kW Ge
o20
MW
Win
d16
MW
Was
tes
10 M
W
0
50
100
150
200 196184
174
143
118 111
61 60
31
ANNUAL REPORT UP 2016 33
THE ITALIAN ECONOMY AND ENERGY
Like elsewhere in Europe, natural gas in Italy is fac-ing a series of critical problems like:
– uncertainties about its role in domestic and in-ternational environmental policies, with potential demand growth cooling off;
– a growing dependence on imports;
– the development of LNG1;
– the gradual decline of imports based on take or pay contracts which is forcing operators to short term plans.
Industrial activities in Italy not only tend to push gas consumption towards end uses (LNG, road and maritime) that are less developed than the tra-ditional sectors (households, industry and power generation), but internationally Italian gas operators are also looking for opportu-nities for infrastructure connections among the European networks.
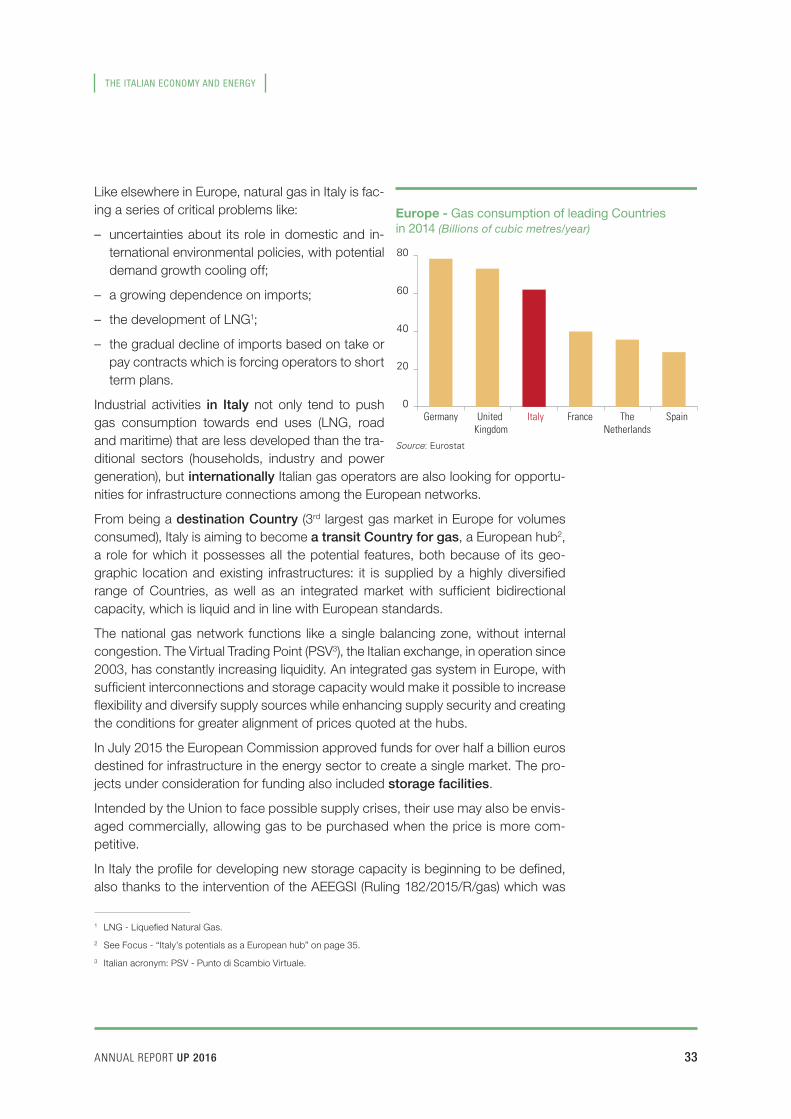
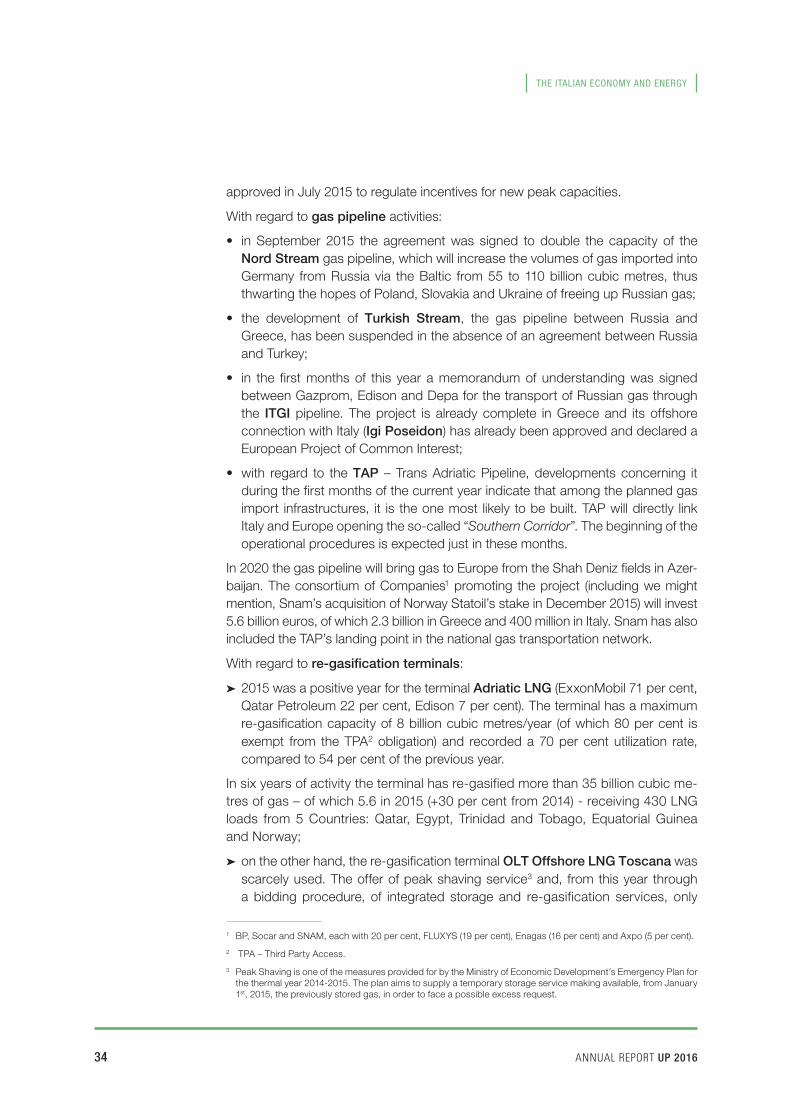
From being a destination Country (3rd largest gas market in Europe for volumes consumed), Italy is aiming to become a transit Country for gas, a European hub2, a role for which it possesses all the potential features, both because of its geo-graphic location and existing infrastructures: it is supplied by a highly diversified range of Countries, as well as an integrated market with sufficient bidirectional capacity, which is liquid and in line with European standards.
The national gas network functions like a single balancing zone, without internal congestion. The Virtual Trading Point (PSV3), the Italian exchange, in operation since 2003, has constantly increasing liquidity. An integrated gas system in Europe, with sufficient interconnections and storage capacity would make it possible to increase flexibility and diversify supply sources while enhancing supply security and creating the conditions for greater alignment of prices quoted at the hubs.
In July 2015 the European Commission approved funds for over half a billion euros destined for infrastructure in the energy sector to create a single market. The pro-jects under consideration for funding also included storage facilities.
Intended by the Union to face possible supply crises, their use may also be envis-aged commercially, allowing gas to be purchased when the price is more com-petitive.
In Italy the profile for developing new storage capacity is beginning to be defined, also thanks to the intervention of the AEEGSI (Ruling 182/2015/R/gas) which was
1 LNG - Liquefied Natural Gas.
2 See Focus - “Italy’s potentials as a European hub” on page 35.
3 Italian acronym: PSV - Punto di Scambio Virtuale.
Source: Eurostat
Germany United Kingdom
Italy France TheNetherlands
Spain0
20
40
60
80
Europe - Gas consumption of leading Countries in 2014 (Billions of cubic metres/year)
THE ITALIAN ECONOMY AND ENERGY
34 ANNUAL REPORT UP 2016
approved in July 2015 to regulate incentives for new peak capacities.
With regard to gas pipeline activities:
• in September 2015 the agreement was signed to double the capacity of the Nord Stream gas pipeline, which will increase the volumes of gas imported into Germany from Russia via the Baltic from 55 to 110 billion cubic metres, thus thwarting the hopes of Poland, Slovakia and Ukraine of freeing up Russian gas;
• the development of Turkish Stream, the gas pipeline between Russia and Greece, has been suspended in the absence of an agreement between Russia and Turkey;
• in the first months of this year a memorandum of understanding was signed between Gazprom, Edison and Depa for the transport of Russian gas through the ITGI pipeline. The project is already complete in Greece and its offshore connection with Italy (Igi Poseidon) has already been approved and declared a European Project of Common Interest;
• with regard to the TAP – Trans Adriatic Pipeline, developments concerning it during the first months of the current year indicate that among the planned gas import infrastructures, it is the one most likely to be built. TAP will directly link Italy and Europe opening the so-called “Southern Corridor”. The beginning of the operational procedures is expected just in these months.
In 2020 the gas pipeline will bring gas to Europe from the Shah Deniz fields in Azer-baijan. The consortium of Companies1 promoting the project (including we might mention, Snam’s acquisition of Norway Statoil’s stake in December 2015) will invest 5.6 billion euros, of which 2.3 billion in Greece and 400 million in Italy. Snam has also included the TAP’s landing point in the national gas transportation network.
With regard to re-gasification terminals:
➤ 2015 was a positive year for the terminal Adriatic LNG (ExxonMobil 71 per cent, Qatar Petroleum 22 per cent, Edison 7 per cent). The terminal has a maximum re-gasification capacity of 8 billion cubic metres/year (of which 80 per cent is exempt from the TPA2 obligation) and recorded a 70 per cent utilization rate, compared to 54 per cent of the previous year.
In six years of activity the terminal has re-gasified more than 35 billion cubic me-tres of gas – of which 5.6 in 2015 (+30 per cent from 2014) - receiving 430 LNG loads from 5 Countries: Qatar, Egypt, Trinidad and Tobago, Equatorial Guinea and Norway;
➤ on the other hand, the re-gasification terminal OLT Offshore LNG Toscana was scarcely used. The offer of peak shaving service3 and, from this year through a bidding procedure, of integrated storage and re-gasification services, only
1 BP, Socar and SNAM, each with 20 per cent, FLUXYS (19 per cent), Enagas (16 per cent) and Axpo (5 per cent).
2 TPA – Third Party Access.
3 Peak Shaving is one of the measures provided for by the Ministry of Economic Development’s Emergency Plan for the thermal year 2014-2015. The plan aims to supply a temporary storage service making available, from January 1st, 2015, the previously stored gas, in order to face a possible excess request.
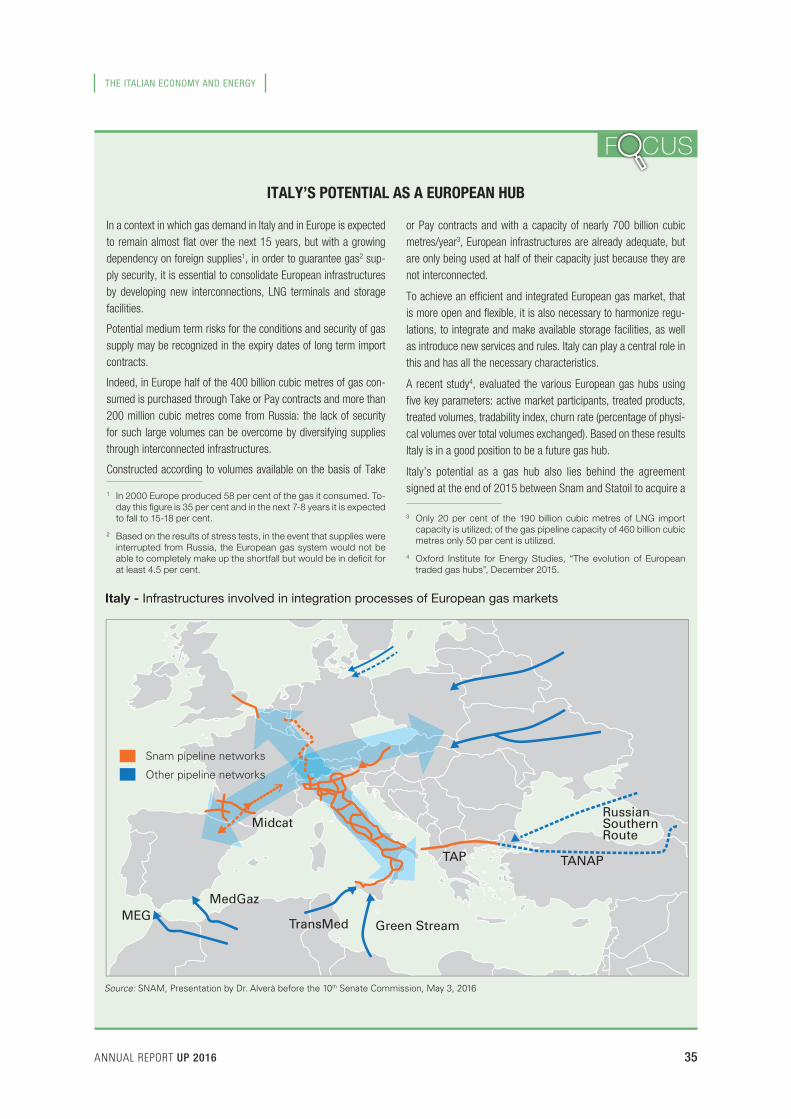
ANNUAL REPORT UP 2016 35
THE ITALIAN ECONOMY AND ENERGY
ITALY’S POTENTIAL AS A EUROPEAN HUB
Other pipeline networks
Snam pipeline networks
Green Stream
TANAP
TransMed
Midcat
MEG
TAP
RussianSouthernRoute
MedGaz
Italy - Infrastructures involved in integration processes of European gas markets
Source: SNAM, Presentation by Dr. Alverà before the 10th Senate Commission, May 3, 2016
In a context in which gas demand in Italy and in Europe is expected to remain almost flat over the next 15 years, but with a growing dependency on foreign supplies1, in order to guarantee gas2 sup-ply security, it is essential to consolidate European infrastructures by developing new interconnections, LNG terminals and storage facilities.
Potential medium term risks for the conditions and security of gas supply may be recognized in the expiry dates of long term import contracts.
Indeed, in Europe half of the 400 billion cubic metres of gas con-sumed is purchased through Take or Pay contracts and more than 200 million cubic metres come from Russia: the lack of security for such large volumes can be overcome by diversifying supplies through interconnected infrastructures.
Constructed according to volumes available on the basis of Take
1 In 2000 Europe produced 58 per cent of the gas it consumed. To-day this figure is 35 per cent and in the next 7-8 years it is expected to fall to 15-18 per cent.
2 Based on the results of stress tests, in the event that supplies were interrupted from Russia, the European gas system would not be able to completely make up the shortfall but would be in deficit for at least 4.5 per cent.
or Pay contracts and with a capacity of nearly 700 billion cubic metres/year3, European infrastructures are already adequate, but are only being used at half of their capacity just because they are not interconnected.
To achieve an efficient and integrated European gas market, that is more open and flexible, it is also necessary to harmonize regu-lations, to integrate and make available storage facilities, as well as introduce new services and rules. Italy can play a central role in this and has all the necessary characteristics.
A recent study4, evaluated the various European gas hubs using five key parameters: active market participants, treated products, treated volumes, tradability index, churn rate (percentage of physi-cal volumes over total volumes exchanged). Based on these results Italy is in a good position to be a future gas hub.
Italy’s potential as a gas hub also lies behind the agreement signed at the end of 2015 between Snam and Statoil to acquire a
3 Only 20 per cent of the 190 billion cubic metres of LNG import capacity is utilized; of the gas pipeline capacity of 460 billion cubic metres only 50 per cent is utilized.
4 Oxford Institute for Energy Studies, “The evolution of European traded gas hubs”, December 2015.
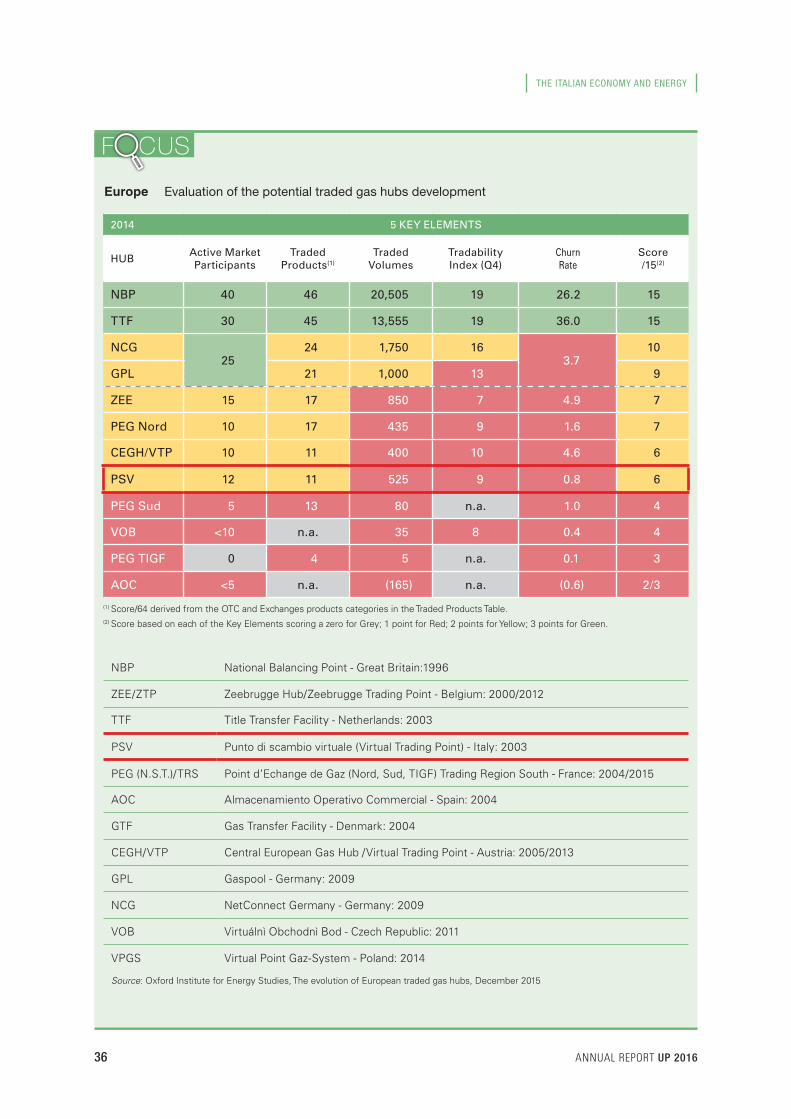
THE ITALIAN ECONOMY AND ENERGY
36 ANNUAL REPORT UP 2016
Europe Evaluation of the potential traded gas hubs development
2014 5 KEY ELEMENTS
HUBActive MarketParticipants
Traded Products(1)
TradedVolumes
TradabilityIndex (Q4)
ChurnRate
Score/15(2)
NBP 40 46 20,505 19 26.2 15
TTF 30 45 13,555 19 36.0 15
NCG25
24 1,750 163.7
10
GPL 21 1,000 13 9
ZEE 15 17 850 7 4.9 7
PEG Nord 10 17 435 9 1.6 7
CEGH/VTP 10 11 400 10 4.6 6
PSV 12 11 525 9 0.8 6
PEG Sud 5 13 80 n.a. 1.0 4
VOB <10 n.a. 35 8 0.4 4
PEG TIGF 0 4 5 n.a. 0.1 3
AOC <5 n.a. (165) n.a. (0.6) 2/3
(1) Score/64 derived from the OTC and Exchanges products categories in the Traded Products Table.(2) Score based on each of the Key Elements scoring a zero for Grey; 1 point for Red; 2 points for Yellow; 3 points for Green.
NBP National Balancing Point - Great Britain:1996
ZEE/ZTP Zeebrugge Hub/Zeebrugge Trading Point - Belgium: 2000/2012
TTF Title Transfer Facility - Netherlands: 2003
PSV Punto di scambio virtuale (Virtual Trading Point) - Italy: 2003
PEG (N.S.T.)/TRS Point d’Echange de Gaz (Nord, Sud, TIGF) Trading Region South - France: 2004/2015
AOC Almacenamiento Operativo Commercial - Spain: 2004
GTF Gas Transfer Facility - Denmark: 2004
CEGH/VTP Central European Gas Hub /Virtual Trading Point - Austria: 2005/2013
GPL Gaspool - Germany: 2009
NCG NetConnect Germany - Germany: 2009
VOB Virtuálnì Obchodnì Bod - Czech Republic: 2011
VPGS Virtual Point Gaz-System - Poland: 2014
Source: Oxford Institute for Energy Studies, The evolution of European traded gas hubs, December 2015
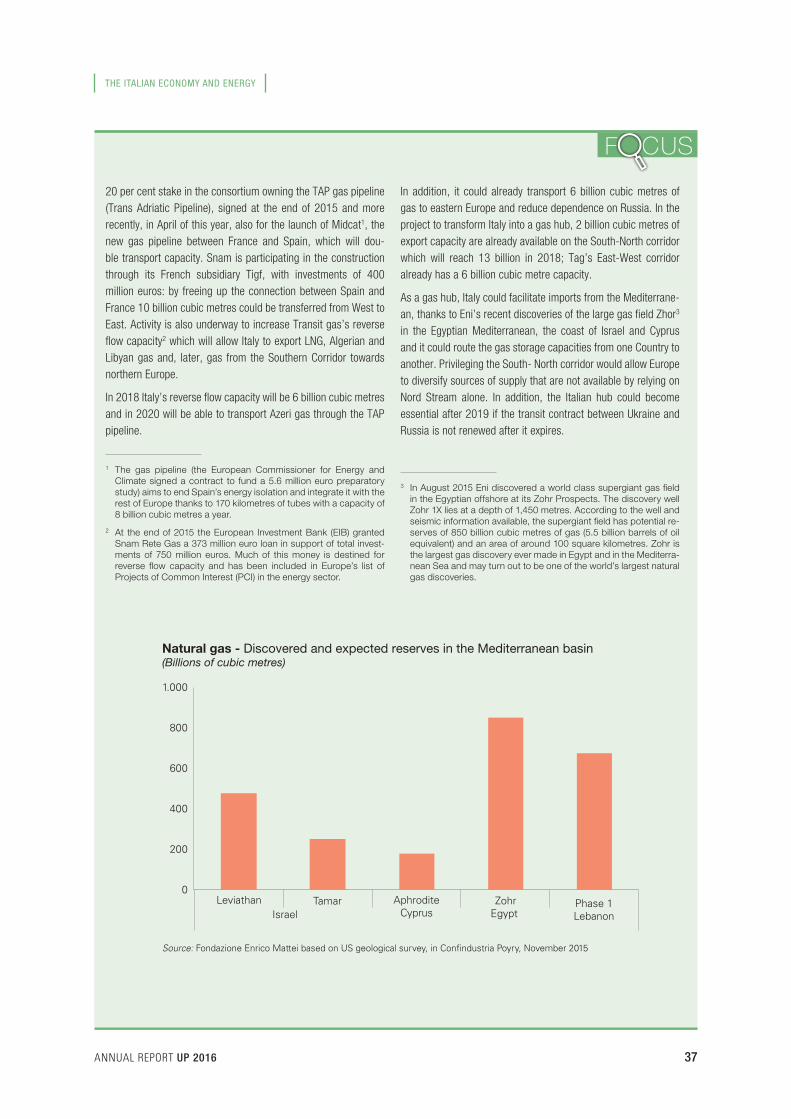
ANNUAL REPORT UP 2016 37
THE ITALIAN ECONOMY AND ENERGY
20 per cent stake in the consortium owning the TAP gas pipeline (Trans Adriatic Pipeline), signed at the end of 2015 and more recently, in April of this year, also for the launch of Midcat1, the new gas pipeline between France and Spain, which will dou-ble transport capacity. Snam is participating in the construction through its French subsidiary Tigf, with investments of 400 million euros: by freeing up the connection between Spain and France 10 billion cubic metres could be transferred from West to East. Activity is also underway to increase Transit gas’s reverse flow capacity2 which will allow Italy to export LNG, Algerian and Libyan gas and, later, gas from the Southern Corridor towards northern Europe.
In 2018 Italy’s reverse flow capacity will be 6 billion cubic metres and in 2020 will be able to transport Azeri gas through the TAP pipeline.
1 The gas pipeline (the European Commissioner for Energy and Climate signed a contract to fund a 5.6 million euro preparatory study) aims to end Spain’s energy isolation and integrate it with the rest of Europe thanks to 170 kilometres of tubes with a capacity of 8 billion cubic metres a year.
2 At the end of 2015 the European Investment Bank (EIB) granted Snam Rete Gas a 373 million euro loan in support of total invest-ments of 750 million euros. Much of this money is destined for reverse flow capacity and has been included in Europe’s list of Projects of Common Interest (PCI) in the energy sector.
In addition, it could already transport 6 billion cubic metres of gas to eastern Europe and reduce dependence on Russia. In the project to transform Italy into a gas hub, 2 billion cubic metres of export capacity are already available on the South-North corridor which will reach 13 billion in 2018; Tag’s East-West corridor already has a 6 billion cubic metre capacity.
As a gas hub, Italy could facilitate imports from the Mediterrane-an, thanks to Eni’s recent discoveries of the large gas field Zhor3 in the Egyptian Mediterranean, the coast of Israel and Cyprus and it could route the gas storage capacities from one Country to another. Privileging the South- North corridor would allow Europe to diversify sources of supply that are not available by relying on Nord Stream alone. In addition, the Italian hub could become essential after 2019 if the transit contract between Ukraine and Russia is not renewed after it expires.
3 In August 2015 Eni discovered a world class supergiant gas field in the Egyptian offshore at its Zohr Prospects. The discovery well Zohr 1X lies at a depth of 1,450 metres. According to the well and seismic information available, the supergiant field has potential re-serves of 850 billion cubic metres of gas (5.5 billion barrels of oil equivalent) and an area of around 100 square kilometres. Zohr is the largest gas discovery ever made in Egypt and in the Mediterra-nean Sea and may turn out to be one of the world’s largest natural gas discoveries.
0
200
400
600
800
1.000
Leviathan Tamar AphroditeCyprus
ZohrEgypt
Phase 1LebanonIsrael
Natural gas - Discovered and expected reserves in the Mediterranean basin (Billions of cubic metres)
Source: Fondazione Enrico Mattei based on US geological survey, in Confindustria Poyry, November 2015
THE ITALIAN ECONOMY AND ENERGY
38 ANNUAL REPORT UP 2016
allowed the partial allocation its of re-gasification capacity. Official recognition of the terminal’s strategic importance means the operator is partially covered for the missing revenue which in 2015 involved the application of surcharges to the tariff components covering transport fees amounting to 80 million euros.
For planned re-gasification terminals, it currently appears that construction of the following will not be realized in the short term:
■ the Api Nova Energia offshore project in Falconara obtained an extension of the deadline to 2019 for its Environmental Impact Assessment (EIA1);
■ in Panigaglia studies are underway to add small-scale services to those already offered, thus adapting the terminal for the direct distribution of LNG;
■ the terminal in Porto Empedocle (AG) is considered to be of less strategic im-portance for the parent company (Enel);
■ last December the new project for the Edison terminal was presented, which is to be built in the industrial complex of Solvay in Rosignano;
■ for the Zaule project (TS) the Ministry of Economic Development recently de-cided to reopen authorization procedures following the confirmation by the Ministry of the Environment that its EIA authorization was still valid.
1 Italian acronym: VIA - Valutazione di Impatto Ambientale.
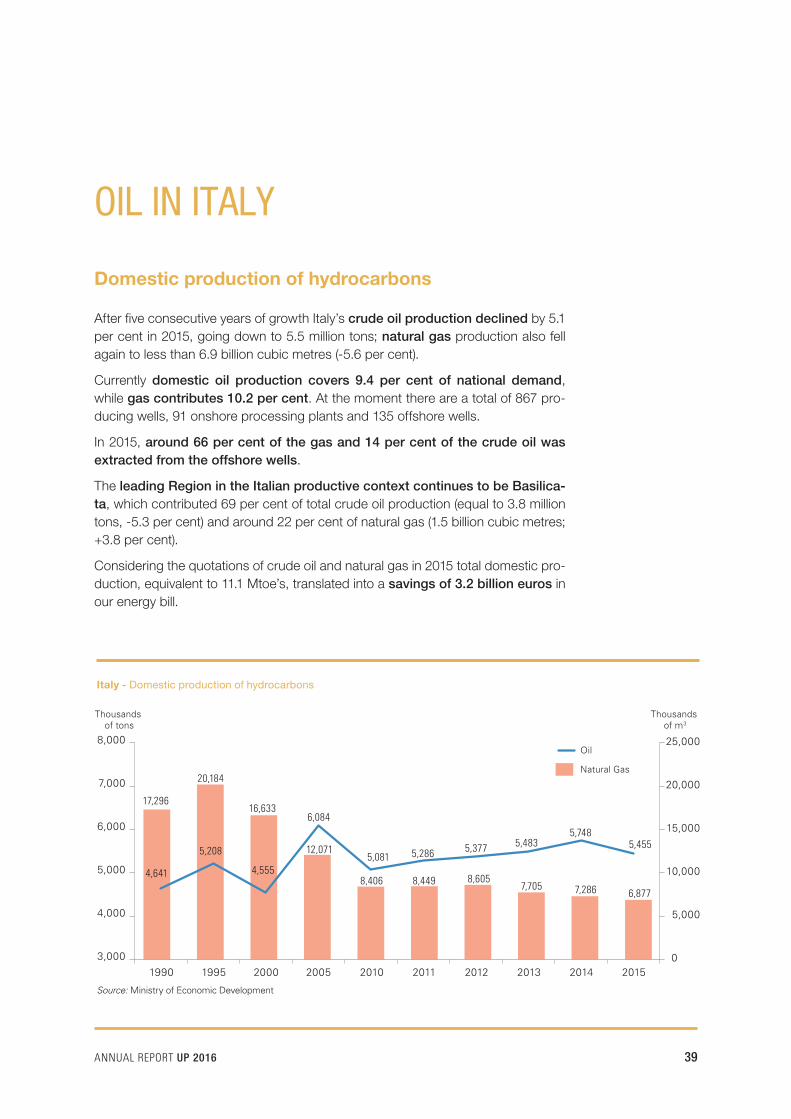
OIL IN ITALY
ANNUAL REPORT UP 2016 39
Domestic production of hydrocarbons
After five consecutive years of growth Italy’s crude oil production declined by 5.1 per cent in 2015, going down to 5.5 million tons; natural gas production also fell again to less than 6.9 billion cubic metres (-5.6 per cent).
Currently domestic oil production covers 9.4 per cent of national demand, while gas contributes 10.2 per cent. At the moment there are a total of 867 pro-ducing wells, 91 onshore processing plants and 135 offshore wells.
In 2015, around 66 per cent of the gas and 14 per cent of the crude oil was extracted from the offshore wells.
The leading Region in the Italian productive context continues to be Basilica-ta, which contributed 69 per cent of total crude oil production (equal to 3.8 million tons, -5.3 per cent) and around 22 per cent of natural gas (1.5 billion cubic metres; +3.8 per cent).
Considering the quotations of crude oil and natural gas in 2015 total domestic pro-duction, equivalent to 11.1 Mtoe’s, translated into a savings of 3.2 billion euros in our energy bill.
Italy - Domestic production of hydrocarbons
3,000
4,000
5,000
6,000
7,000
8,000
0
5,000
10,000
15,000
20,000
25,000
1990 1995 2000 2005 2010 2011 2012 2013 2014 2015
Oil
Natural Gas
17,296
4,641
20,184
5,208
16,633
4,555
6,084
12,0715,081
8,406
5,286
8,449
5,377
8,605
5,483
7,705
5,748
7,286
5,455
6,877
Source: Ministry of Economic Development
Thousands of tons
Thousands of m3
OIL IN ITALY
40 ANNUAL REPORT UP 2016
Regulatory uncertainty and risks for E&P in Italy
According to the 2015 Annual Report of the Ministry of Economic Development’s Directorate for Safety of Mining and Energy Activities “in over 60 years of activ-ity the hydrocarbons exploration and production industry has been a reference model in Italy for its overall safety and performance standards”. This statement has been further confirmed by the safety indicators illustrated in the 2nd Environ-mental Report of the Italian Exploration and Production Sector (E&P), presented in November 2015.
And yet it was just in 2015 and during the current year that the industry became an unwilling protagonist in a series of challenges and disputes which produced signif-icant impacts on investments and production activities planned at the end of 2014:
– article 38 of Decree-law n. 133/2014 “Sblocca Italia” had led to hopes of re-newed impetus for the exploration, development and production activities, as well as for the underground storage of natural gas, since it described these activities as being “of strategic interest, of public utility, urgent and no longer deferrable”, aligning Italy’s authorization procedures with other Euro-pean Countries’ standards, without impairing the rights of Regions and local Authorities;
– nevertheless, divergent views on energy strategies between the Regions and the central Government, often fuelled by local opposition, culminated in July 2015 in a request for a referendum submitted by a number of Regions1 to oppose changes to onshore permitting (art. 38 “Sblocca Italia”) and to block offshore activities within 12 nautical miles (22.2 kilometres from the coast) as per art. 35 of the Decree-law on Development;
– aiming to find a position that both central and local Authorities could agree upon, at the end of 2015 the Stability Law2 reintroduced the ban on Explora-tion and Production of hydrocarbons within 12 nautical miles and removed the measures in the “Sblocca Italia” Decree-law, thus deeply affecting a number of submitted projects;
– as a result of this measure, already at the beginning of this year 27 submis-sions planned within-or partially within-12 miles from the coast were rejected or relocated. This has had a serious impact on planned investments of many international companies originally allocated for E&P activities in Italy.
Ultimately, the continuous changes to the regulatory framework that have oc-curred over the past ten years have significantly reduced the interest of a lot of foreign investors, and seriously damaged Italy’s reputation. In addition to the recent fluctuations in oil prices, this element of uncertainty is having a deeply depressive effect on investments, with the risk of notable consequences on em-ployment and economic development.
1 The Referendum was initially promoted by 5 Regions (Marche, Molise, Apulia, Basilicata and Calabria) and later included 5 more (Abruzzo, Campania, Liguria, Sardinia and Veneto).
2 Law n. 208 December 28, 2015.
ANNUAL REPORT UP 2016 41
OIL IN ITALY
The strengths of E&P
The domestic production of hydrocarbons in Italy has a great energetic and soci-oeconomic importance our Country. It has been estimated that in 2015 alone, the domestic production of hydrocarbons guaranteed over 340 million euros revenue to the Public Administrations, as royalties and fees, plus 630 million euros in taxes.
2015 also marked the restart of upstream activities in Emilia-Romagna after the 2012 earthquake. Following in-depth international investigations and the publica-tion of studies that ruled out any correlation between the seismic event and hydro-carbon exploration and production, the Region Emilia-Romagna and the Ministry of Economic Development signed an “Operative Agreement”, which revoked the suspension of activities that had been in effect since the previous year.
Finally, over the last year huge investments were made especially in Italy’s two main onshore fields – both located in the Region Basilicata – as well as for the develop-ment of the offshore project known as Ibleo.
u 250 million euros were invested in the Val d’Agri Oil Center (joint venture Eni and Shell). In the second half of 2015 the fifth gas treatment line with SO2 reduc-tion technologies was tested and set in operation.
u The Tempa Rossa field (Total operator 50 per cent, Mitsui 25 per cent, Shell 25 per cent) received more than 300 million euros of investment in 2015. However, production will not get underway until beginning of 2018. Production amounts to 50,000 barrels/day of crude oil and 230,000 cubic metres of gas. Crude will be transported through the Viggiano pipeline to the Raffineria di Taranto, where two storage tanks and a new vapour recovery system will be built.
u The Ibleo project, also favoured by the Protocol of Understanding signed in 2014 between the Region Sicily and the operators, calls for a total investment of around 900 million euros. This is the most important offshore initiative in Italy and is also closely connected to the reconversion project at the Raffineria di Gela. Sicily will significantly benefit in terms of employment, as the project will produce more than 10 billion cubic metres of gas in around 14 years.
At the end of March an investigation led to the suspension of the activity of the Val d’Agri Oil Center located in Viggiano. For the time being, the production shut down has generated significant financial and employment losses. The temporary closure has also impacted crude oil supplies to the Raffineria di Taranto which is usually supplied by Viggiano.
The agreements signed with the Regions Sicily and Emilia-Romagna and the po-tential for development confirmed by the investments decided by the Oil Compa-nies operating in Italy – in spite of adverse market conditions and conflicts that emerged and culminated in the referendum initiative – emphasize the importance of the Oil & Gas industry for the Italian industrial context. Its relevance becomes even more evident if we consider the vast number of spin off and related activities as-sociated with the upstream sector in Italy: a chain of Companies supplying goods and services to E&P operators, which have been recognized as world leaders both
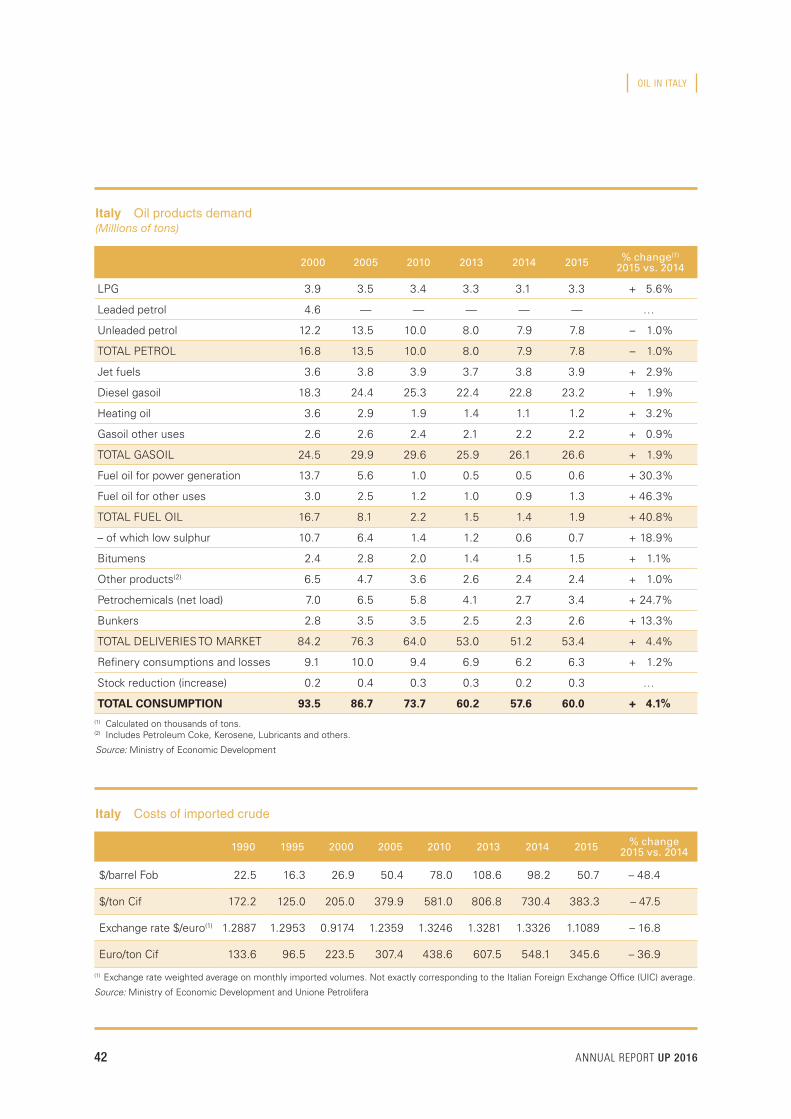
OIL IN ITALY
42 ANNUAL REPORT UP 2016
Italy Oil products demand (Millions of tons)
2000 2005 2010 2013 2014 2015 % change(1)
2015 vs. 2014
LPG 3.9 3.5 3.4 3.3 3.1 3.3 + 5.6%
Leaded petrol 4.6 — — — — — …
Unleaded petrol 12.2 13.5 10.0 8.0 7.9 7.8 – 1.0%
TOTAL PETROL 16.8 13.5 10.0 8.0 7.9 7.8 – 1.0%
Jet fuels 3.6 3.8 3.9 3.7 3.8 3.9 + 2.9%
Diesel gasoil 18.3 24.4 25.3 22.4 22.8 23.2 + 1.9%
Heating oil 3.6 2.9 1.9 1.4 1.1 1.2 + 3.2%
Gasoil other uses 2.6 2.6 2.4 2.1 2.2 2.2 + 0.9%
TOTAL GASOIL 24.5 29.9 29.6 25.9 26.1 26.6 + 1.9%
Fuel oil for power generation 13.7 5.6 1.0 0.5 0.5 0.6 + 30.3%
Fuel oil for other uses 3.0 2.5 1.2 1.0 0.9 1.3 + 46.3%
TOTAL FUEL OIL 16.7 8.1 2.2 1.5 1.4 1.9 + 40.8%
– of which low sulphur 10.7 6.4 1.4 1.2 0.6 0.7 + 18.9%
Bitumens 2.4 2.8 2.0 1.4 1.5 1.5 + 1.1%
Other products(2) 6.5 4.7 3.6 2.6 2.4 2.4 + 1.0%
Petrochemicals (net load) 7.0 6.5 5.8 4.1 2.7 3.4 + 24.7%
Bunkers 2.8 3.5 3.5 2.5 2.3 2.6 + 13.3%
TOTAL DELIVERIES TO MARKET 84.2 76.3 64.0 53.0 51.2 53.4 + 4.4%
Refinery consumptions and losses 9.1 10.0 9.4 6.9 6.2 6.3 + 1.2%
Stock reduction (increase) 0.2 0.4 0.3 0.3 0.2 0.3 …
TOTAL CONSUMPTION 93.5 86.7 73.7 60.2 57.6 60.0 + 4.1%(1) Calculated on thousands of tons.(2) Includes Petroleum Coke, Kerosene, Lubricants and others.
Source: Ministry of Economic Development
Italy Costs of imported crude
1990 1995 2000 2005 2010 2013 2014 2015 % change2015 vs. 2014
$/barrel Fob 22.5 16.3 26.9 50.4 78.0 108.6 98.2 50.7 – 48.4
$/ton Cif 172.2 125.0 205.0 379.9 581.0 806.8 730.4 383.3 – 47.5
Exchange rate $/euro(1) 1.2887 1.2953 0.9174 1.2359 1.3246 1.3281 1.3326 1.1089 – 16.8
Euro/ton Cif 133.6 96.5 223.5 307.4 438.6 607.5 548.1 345.6 – 36.9
(1) Exchange rate weighted average on monthly imported volumes. Not exactly corresponding to the Italian Foreign Exchange Office (UIC) average.
Source: Ministry of Economic Development and Unione Petrolifera
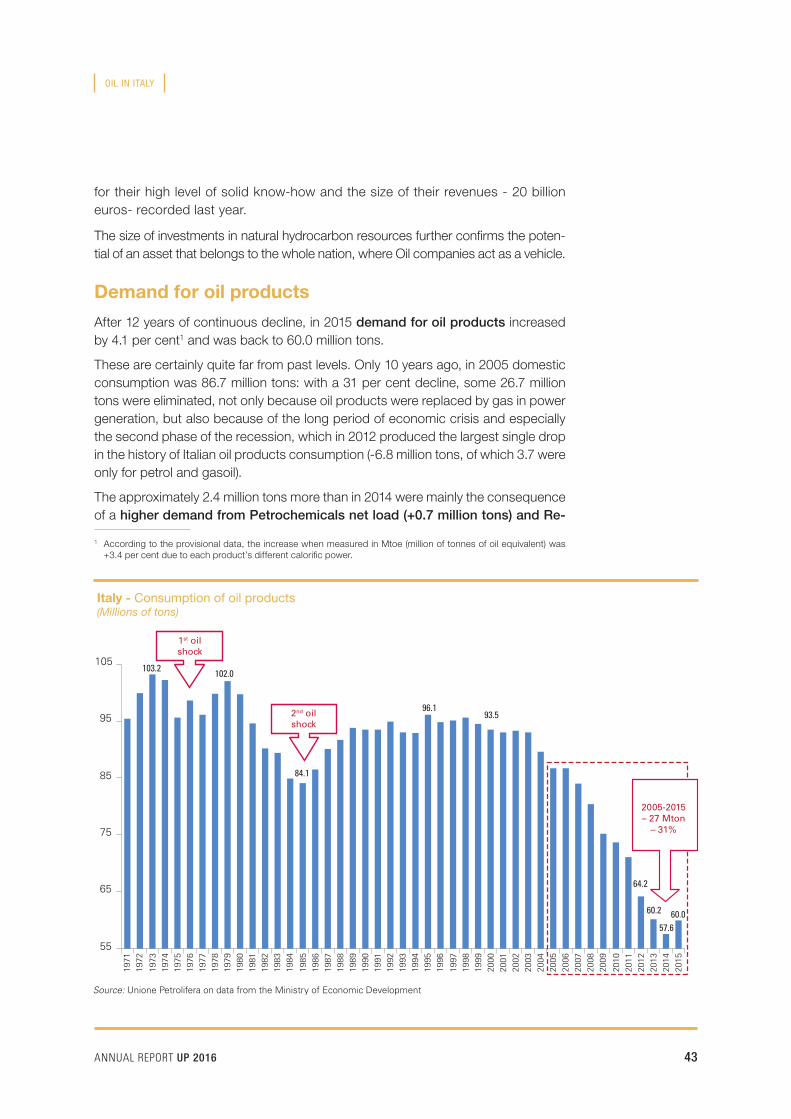
ANNUAL REPORT UP 2016 43
OIL IN ITALY
for their high level of solid know-how and the size of their revenues - 20 billion euros- recorded last year.
The size of investments in natural hydrocarbon resources further confirms the poten-tial of an asset that belongs to the whole nation, where Oil companies act as a vehicle.
Demand for oil products
After 12 years of continuous decline, in 2015 demand for oil products increased by 4.1 per cent1 and was back to 60.0 million tons.
These are certainly quite far from past levels. Only 10 years ago, in 2005 domestic consumption was 86.7 million tons: with a 31 per cent decline, some 26.7 million tons were eliminated, not only because oil products were replaced by gas in power generation, but also because of the long period of economic crisis and especially the second phase of the recession, which in 2012 produced the largest single drop in the history of Italian oil products consumption (-6.8 million tons, of which 3.7 were only for petrol and gasoil).
The approximately 2.4 million tons more than in 2014 were mainly the consequence of a higher demand from Petrochemicals net load (+0.7 million tons) and Re-
1 According to the provisional data, the increase when measured in Mtoe (million of tonnes of oil equivalent) was +3.4 per cent due to each product’s different calorific power.
1971
1972
1973
1974
1975
1976
1977
1978
1979
1980
1981
1982
1983
1984
1985
1986
1987
1988
1989
1990
1991
1992
1993
1994
1995
1996
1997
1998
1999
2000
2001
2002
2003
2004
2005
2006
2007
2008
2009
2010
2011
2012
2013
2014
2015
55
65
75
85
95
105
Italy - Consumption of oil products(Millions of tons)
57.6
60.2 60.0
64.2
2005-2015– 27 Mton
– 31%
1st oilshock
2nd oilshock
93.5
84.1
102.0103.2
96.1
Source: Unione Petrolifera on data from the Ministry of Economic Development
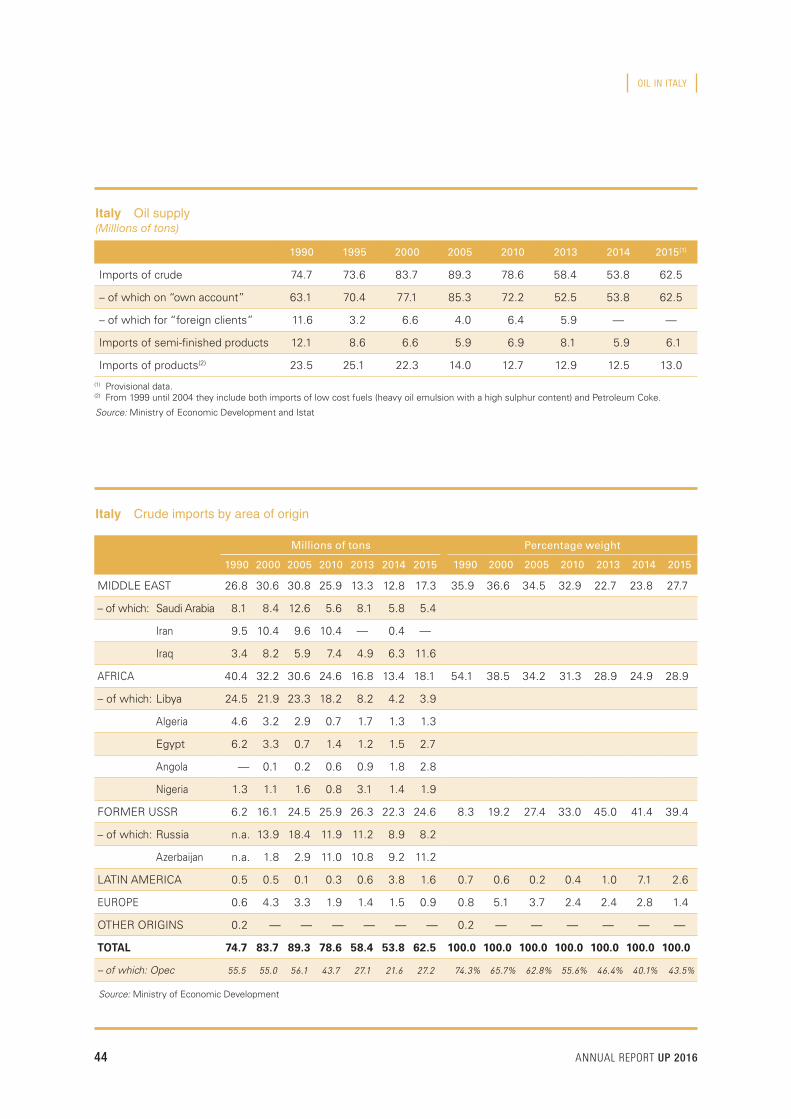
OIL IN ITALY
44 ANNUAL REPORT UP 2016
Italy Oil supply(Millions of tons)
1990 1995 2000 2005 2010 2013 2014 2015(1)
Imports of crude 74.7 73.6 83.7 89.3 78.6 58.4 53.8 62.5
– of which on “own account” 63.1 70.4 77.1 85.3 72.2 52.5 53.8 62.5
– of which for “foreign clients” 11.6 3.2 6.6 4.0 6.4 5.9 — —
Imports of semi-finished products 12.1 8.6 6.6 5.9 6.9 8.1 5.9 6.1
Imports of products(2) 23.5 25.1 22.3 14.0 12.7 12.9 12.5 13.0
(1) Provisional data.(2) From 1999 until 2004 they include both imports of low cost fuels (heavy oil emulsion with a high sulphur content) and Petroleum Coke.
Source: Ministry of Economic Development and Istat
Italy Crude imports by area of origin
Millions of tons Percentage weight
1990 2000 2005 2010 2013 2014 2015 1990 2000 2005 2010 2013 2014 2015
MIDDLE EAST 26.8 30.6 30.8 25.9 13.3 12.8 17.3 35.9 36.6 34.5 32.9 22.7 23.8 27.7
– of which: Saudi Arabia 8.1 8.4 12.6 5.6 8.1 5.8 5.4
Iran 9.5 10.4 9.6 10.4 — 0.4 —
Iraq 3.4 8.2 5.9 7.4 4.9 6.3 11.6
AFRICA 40.4 32.2 30.6 24.6 16.8 13.4 18.1 54.1 38.5 34.2 31.3 28.9 24.9 28.9
– of which: Libya 24.5 21.9 23.3 18.2 8.2 4.2 3.9
Algeria 4.6 3.2 2.9 0.7 1.7 1.3 1.3
Egypt 6.2 3.3 0.7 1.4 1.2 1.5 2.7
Angola — 0.1 0.2 0.6 0.9 1.8 2.8
Nigeria 1.3 1.1 1.6 0.8 3.1 1.4 1.9
FORMER USSR 6.2 16.1 24.5 25.9 26.3 22.3 24.6 8.3 19.2 27.4 33.0 45.0 41.4 39.4
– of which: Russia n.a. 13.9 18.4 11.9 11.2 8.9 8.2
Azerbaijan n.a. 1.8 2.9 11.0 10.8 9.2 11.2
LATIN AMERICA 0.5 0.5 0.1 0.3 0.6 3.8 1.6 0.7 0.6 0.2 0.4 1.0 7.1 2.6
EUROPE 0.6 4.3 3.3 1.9 1.4 1.5 0.9 0.8 5.1 3.7 2.4 2.4 2.8 1.4
OTHER ORIGINS 0.2 — — — — — — 0.2 — — — — — —
TOTAL 74.7 83.7 89.3 78.6 58.4 53.8 62.5 100.0 100.0 100.0 100.0 100.0 100.0 100.0
– of which: Opec 55.5 55.0 56.1 43.7 27.1 21.6 27.2 74.3% 65.7% 62.8% 55.6% 46.4% 40.1% 43.5%
Source: Ministry of Economic Development
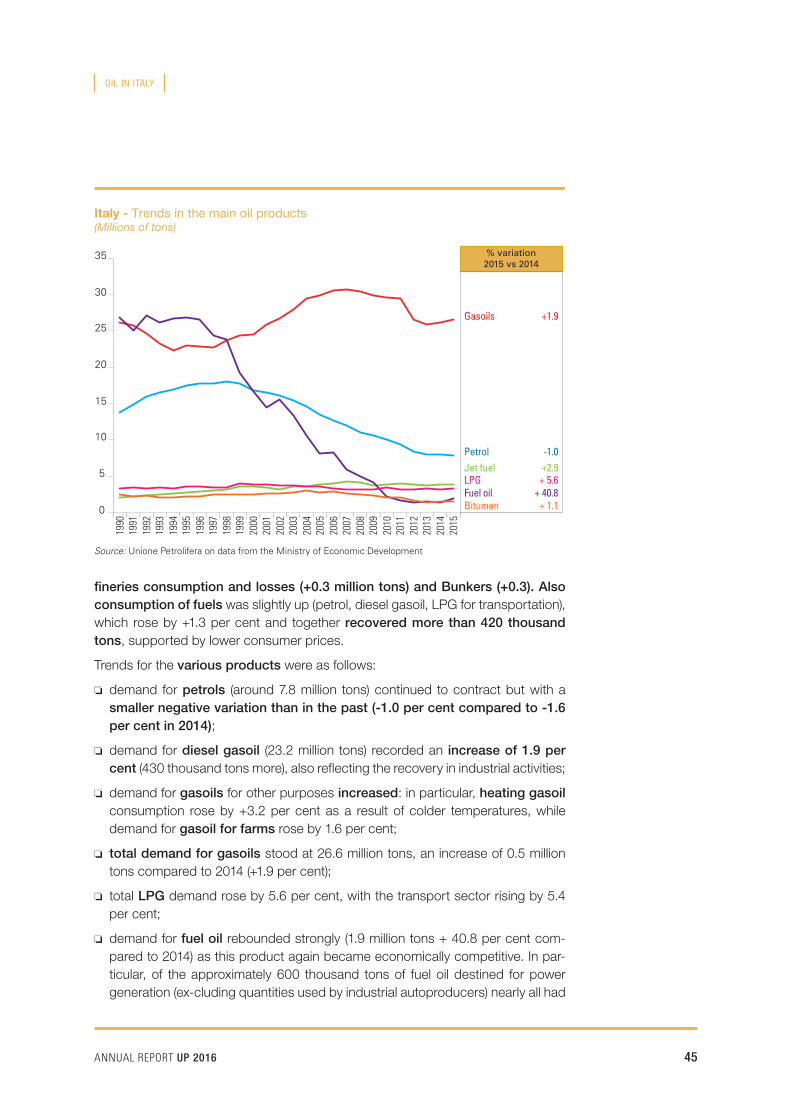
ANNUAL REPORT UP 2016 45
OIL IN ITALY
fineries consumption and losses (+0.3 million tons) and Bunkers (+0.3). Also consumption of fuels was slightly up (petrol, diesel gasoil, LPG for transportation), which rose by +1.3 per cent and together recovered more than 420 thousand tons, supported by lower consumer prices.
Trends for the various products were as follows:
❏ demand for petrols (around 7.8 million tons) continued to contract but with a smaller negative variation than in the past (-1.0 per cent compared to -1.6 per cent in 2014);
❏ demand for diesel gasoil (23.2 million tons) recorded an increase of 1.9 per cent (430 thousand tons more), also reflecting the recovery in industrial activities;
❏ demand for gasoils for other purposes increased: in particular, heating gasoil consumption rose by +3.2 per cent as a result of colder temperatures, while demand for gasoil for farms rose by 1.6 per cent;
❏ total demand for gasoils stood at 26.6 million tons, an increase of 0.5 million tons compared to 2014 (+1.9 per cent);
❏ total LPG demand rose by 5.6 per cent, with the transport sector rising by 5.4 per cent;
❏ demand for fuel oil rebounded strongly (1.9 million tons + 40.8 per cent com-pared to 2014) as this product again became economically competitive. In par-ticular, of the approximately 600 thousand tons of fuel oil destined for power generation (ex-cluding quantities used by industrial autoproducers) nearly all had
Italy - Trends in the main oil products(Millions of tons)
Source: Unione Petrolifera on data from the Ministry of Economic Development
% variation2015 vs 2014
Gasoils +1.9
Jet fuel +2.9LPG + 5.6Fuel oil + 40.8Bitumen + 1.1
Petrol -1.0
1990
1991
1992
1993
1994
1995
1996
1997
1998
1999
2000
2001
2002
2003
2004
2005
2006
2007
2008
2009
2010
2011
2012
2013
2014
2015
0
5
10
15
20
25
30
35
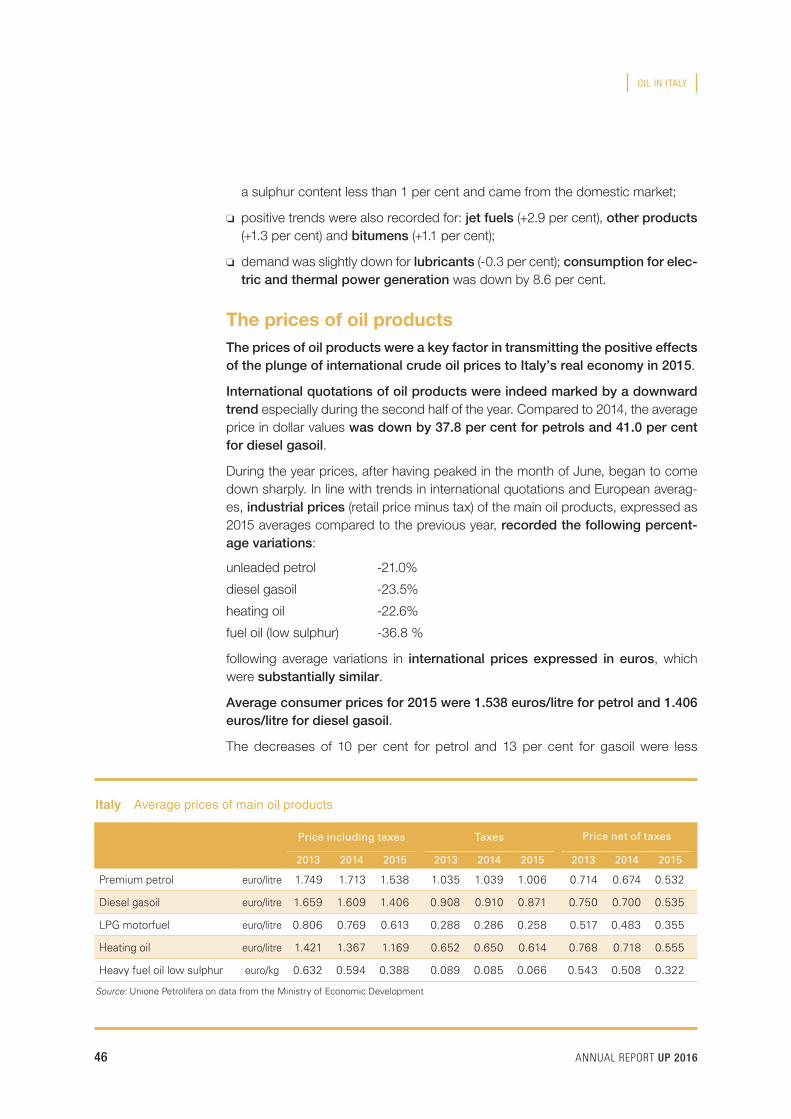
OIL IN ITALY
46 ANNUAL REPORT UP 2016
a sulphur content less than 1 per cent and came from the domestic market;
❏ positive trends were also recorded for: jet fuels (+2.9 per cent), other products (+1.3 per cent) and bitumens (+1.1 per cent);
❏ demand was slightly down for lubricants (-0.3 per cent); consumption for elec-tric and thermal power generation was down by 8.6 per cent.
The prices of oil productsThe prices of oil products were a key factor in transmitting the positive effects of the plunge of international crude oil prices to Italy’s real economy in 2015.
International quotations of oil products were indeed marked by a downward trend especially during the second half of the year. Compared to 2014, the average price in dollar values was down by 37.8 per cent for petrols and 41.0 per cent for diesel gasoil.
During the year prices, after having peaked in the month of June, began to come down sharply. In line with trends in international quotations and European averag-es, industrial prices (retail price minus tax) of the main oil products, expressed as 2015 averages compared to the previous year, recorded the following percent-age variations:
unleaded petrol -21.0%
diesel gasoil -23.5%
heating oil -22.6%
fuel oil (low sulphur) -36.8 %
following average variations in international prices expressed in euros, which were substantially similar.
Average consumer prices for 2015 were 1.538 euros/litre for petrol and 1.406 euros/litre for diesel gasoil.
The decreases of 10 per cent for petrol and 13 per cent for gasoil were less
Italy Average prices of main oil products
Price including taxes Taxes Price net of taxes
2013 2014 2015 2013 2014 2015 2013 2014 2015
Premium petrol euro/litre 1.749 1.713 1.538 1.035 1.039 1.006 0.714 0.674 0.532
Diesel gasoil euro/litre 1.659 1.609 1.406 0.908 0.910 0.871 0.750 0.700 0.535
LPG motorfuel euro/litre 0.806 0.769 0.613 0.288 0.286 0.258 0.517 0.483 0.355
Heating oil euro/litre 1.421 1.367 1.169 0.652 0.650 0.614 0.768 0.718 0.555
Heavy fuel oil low sulphur euro/kg 0.632 0.594 0.388 0.089 0.085 0.066 0.543 0.508 0.322
Source: Unione Petrolifera on data from the Ministry of Economic Development
ANNUAL REPORT UP 2016 47
OIL IN ITALY
significant in terms of percentage, given their considerable fiscal component: in total, taxes amount to 65 per cent of the end price of petrol and 62 per cent of gasoil.
In 2015 taxes on petrol fell to 1.006 euros/litre compared to 1.039 in 2014 (-3.2 per cent), while for gasoil they fell from 0.910 to 0.871 euro/litre (-4.2 per cent): these decreases were connected to lower industrial prices which had the effect of reducing the amount of VAT charged.
Imports and exportsItaly imported 62.5 million tons of crude oil in 2015, an increase of 16.0 per cent from the previous year: although this figure is higher than the minimums of the past two years, it is still far from previous import levels. Again in 2015 there were no im-ports of oil for “foreign clients”.
Imports were up both of finished products (13.0 million tons, +4.0 per cent) and foreign semi-finished products (6.1 million tons, +3.8 per cent).
2015 saw a significant rise in exports of crude, semi-finished and finished prod-ucts, which stood at 28.1 million tons (+33.7 per cent from 2014). Compared to 2007 when exports were 31.2 million tons, this represents a 3.1 million tons decline.
The flare up of tensions in Libya during 2015 led to a further reduction of flows from the Country that historically was our main oil supplier.
The missing volumes were made up by the area of the former Soviet Union, which took Libya’s place, with Azerbaijan (17.9 per cent), Russia (13.1 per cent), and Kazakhstan (8.4 per cent), contributing to more than 39 per cent of the crude oil imported into Italy.
Finally, volumes coming from Iraq at 11.6 million tons were up significantly by 85 per cent, making Iraq our main oil supplier in 2015.
Compared to 2010, when the level of imports from our three main supply areas (Africa, former Soviet Union and Middle East) was absolutely balanced (around 33 per cent each), geopolitical turmoil has reduced both Africa’s share (28.9 per cent) and the Middle East (27.7 per cent).
However, the number of our crude oil supplier Countries has risen (29 in 2015 com-pared to 25 in 2010) thus increasing Italy’s oil supply diversification.
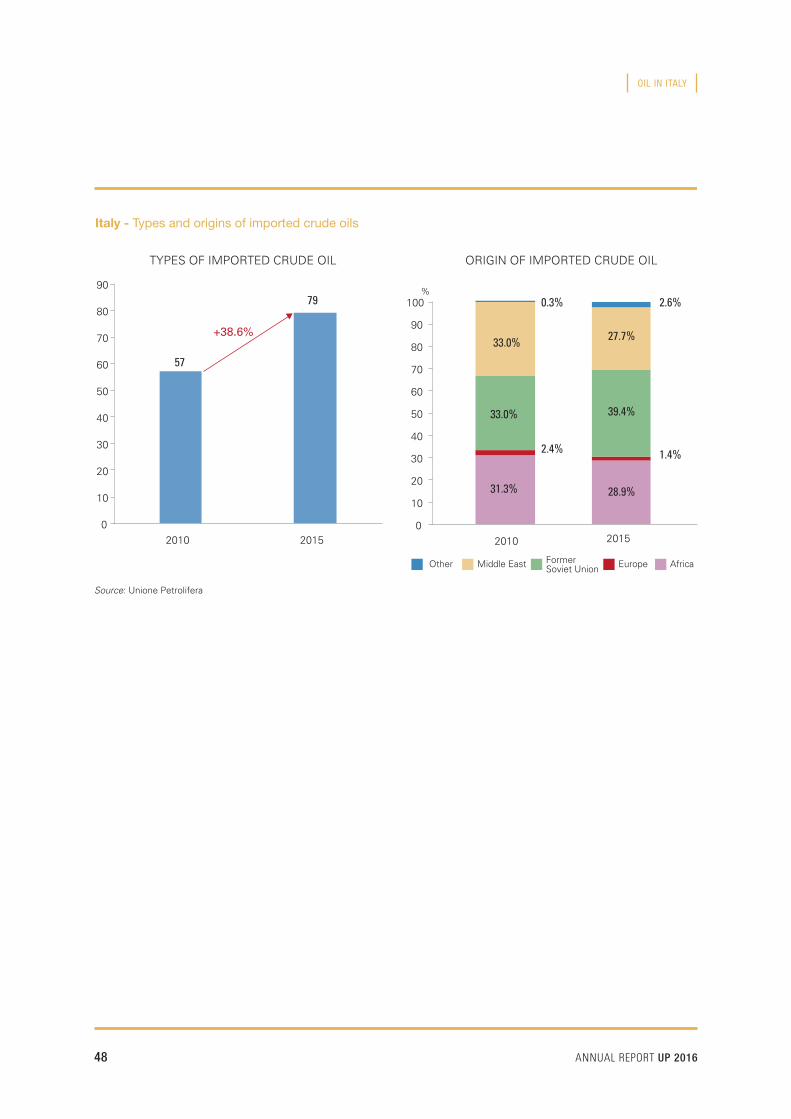
OIL IN ITALY
48 ANNUAL REPORT UP 2016
TYPES OF IMPORTED CRUDE OIL ORIGIN OF IMPORTED CRUDE OIL
57
79
0
10
20
30
40
50
60
70
80
90
2010 2015
+38.6%
31.3%
2.4%
33.0%
33.0%
0.3%
28.9%
1.4%
39.4%
27.7%
2.6%
0
10
20
30
40
50
60
70
80
90
100
2010 2015
%
Other Middle East Former Soviet Union Europe Africa
Source: Unione Petrolifera
Italy - Types and origins of imported crude oils
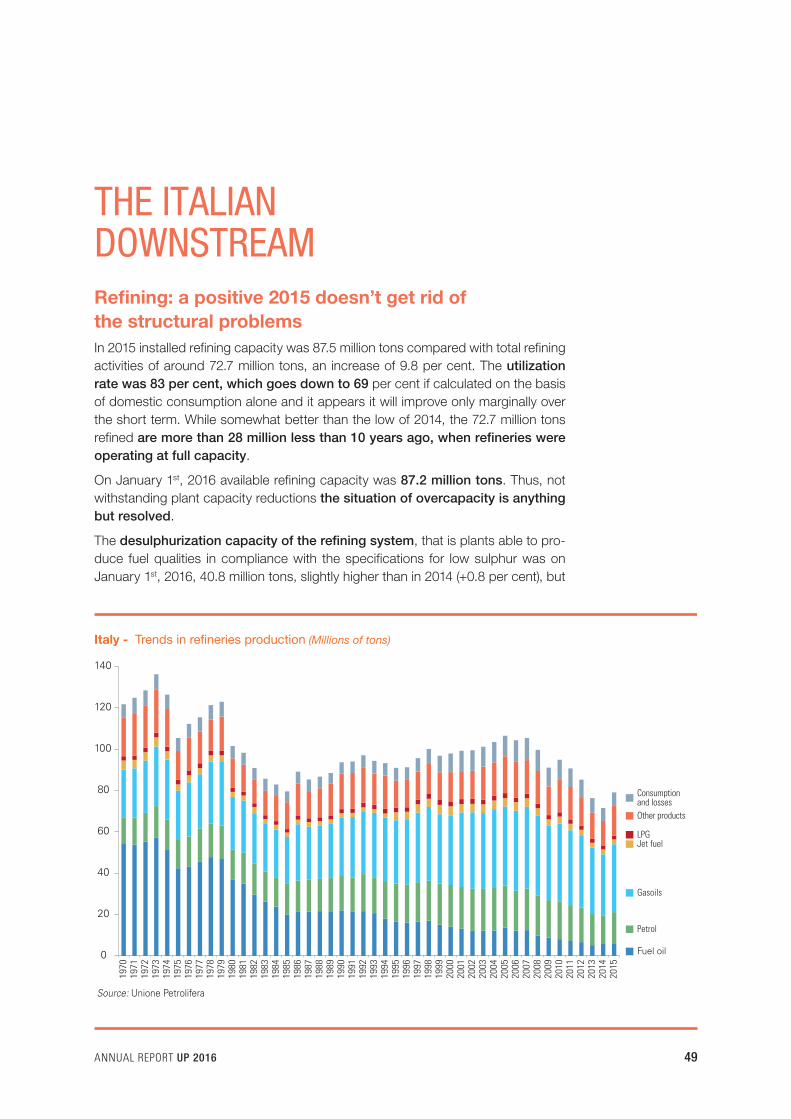
THE ITALIANDOWNSTREAM
ANNUAL REPORT UP 2016 49
Refining: a positive 2015 doesn’t get rid ofthe structural problemsIn 2015 installed refining capacity was 87.5 million tons compared with total refining activities of around 72.7 million tons, an increase of 9.8 per cent. The utilization rate was 83 per cent, which goes down to 69 per cent if calculated on the basis of domestic consumption alone and it appears it will improve only marginally over the short term. While somewhat better than the low of 2014, the 72.7 million tons refined are more than 28 million less than 10 years ago, when refineries were operating at full capacity.
On January 1st, 2016 available refining capacity was 87.2 million tons. Thus, not withstanding plant capacity reductions the situation of overcapacity is anything but resolved.
The desulphurization capacity of the refining system, that is plants able to pro-duce fuel qualities in compliance with the specifications for low sulphur was on January 1st, 2016, 40.8 million tons, slightly higher than in 2014 (+0.8 per cent), but
0
20
40
60
80
100
120
140
1970
1971
1972
1973
1974
1975
1976
1977
1978
1979
1980
1981
1982
1983
1984
1985
1986
1987
1988
1989
1990
1991
1992
1993
1994
1995
1996
1997
1998
1999
2000
2001
2002
2003
2004
2005
2006
2007
2008
2009
2010
2011
2012
2013
2014
2015
LPGJet fuel
Gasoils
Petrol
Consumption and lossesOther products
Fuel oil
Italy - Trends in re�neries production (Millions of tons)
Source: Unione Petrolifera
THE ITALIAN DOWNSTREAM
50 ANNUAL REPORT UP 2016
In response to market changes and ever stricter standards, the technological innovation of products and processes continues to be the main strategy of Italy’s oil industry.
With regard to refineries:
• in 2015 the Raffineria Api began preliminary activities for the production of low sulphur Marine fuel oil, as well as the plant to produce nitrogen, which will be used to continuously feed the refineries networks, together with a project for the internal pro-duction of oxygen. Studies have also begun for the creation of components needed for the production of diesel from second generation vegetable oil and for an improved use of ethanol in petrol production;
• after investing 120 million euros in 2015, this year the Raf-fineria di Milazzo will invest around 100 million euros for the revamping of the Hds1 plant and of the Topping and Vacuum fur-naces and the completion of the new fire prevention depot. Cur-rent investment activities also include work on the new sulphur plant and a third vapour recovery unit, the cover of the waste water treatment tanks and interventions to upgrade the piers.
It was just in these months that the refinery was able to ob-tain 110 million euros of financing from the European Invest-ment Bank (EIB) as part of the Juncker project introduced by the Commission in 2014 to relaunch the economy and it has been included in the list of strategic infrastructures of national interest (art. 57 of Law n. 35/2012).
The European Investment Bank funds1, which will be disbursed over a multiyear period, amount to a total of 236 million euros. They aim to:
– reduce environmental impact (with the construction of an ad-ditional sulphur recovery unit to process crude oil with a higher sulphur content),
– increase energy efficiency (improving operational stability, heat recovery and the plants’ performance),
– increase environmental protection (with improvement of pre-ventive controls over potential events that could contaminate the subsoil and aquifers);
• in 2015 Saras invested 86.2 million euros, of which 85 per cent went to its refining segment, mostly for interventions aimed at energy efficiency and improving heat recovery processes. In particular, changes were made to allow a greater heat integration between the Mild Hydro Cracking plants and atmospheric distil-
1 From the technical point of view 30 million will be disbursed direct-ly by the EIB, another 40 million by the EIB but guaranteed by the Cassa Depositi e Presititi (CDP) and the final 40 million through an Italian banking institute.
lation units (Toppings) and desulphurization units. In addition, the first investments were made to integrate the new “Nord Plants” acquired from Versalis in 2014 with the aim of optimizing and enhancing their functioning.
Finally, investments for environmental protection, regarded the installation and restoration of the double bottoms of some of the hydrocarbon tanks and interventions on the flooring of tank ba-sins and pipings; investments in safety included improving fire prevention and detection systems and the segregation of zones in the plant;
• Total acquired from Eni the licence to use its EST-Eni Slurry Technology, which allows the conversion of up to 95 per cent of residual fuel oils, while in the current refining techniques this is not higher than 70 per cent. The EST technology is the result of 15 years of research by Eni and was experimented for two years in the Raffineria di Sannazzaro;
• in the Viscolube plant in Pieve Fissiraga (LO) an investment of around one million euros went to constructing a new thermodea-sphaltization column which began operating in September 2015. It is 34 metres long and able to separate previously dehydrated oil into its lubricant components, gasoil and bitumens, allowing improvements in quality and performance.
With regard to developments in transportation infrastructure for crude oil and products:
• in September 2015 the Società Italiana per l’Oleodotto Transal-pino (Siot) obtained a renewal of its concession from the Harbour Authority of Trieste for another 50 years. At the Trieste oil termi-nal which Siot has been managing since 1964 more than 500 vessels a year dock, discharging 41.5 million tons of crude oil (equivalent to 75 per cent of the port’s traffic and with the TAL pipeline guaranteeing 90 per cent of Austria’s oil demand, 40 per cent of Germany’s and 50 per cent of the Czech Republic’s.
Siot’s Development Plan provides for 20 million euros of invest-ments to be made from 2015-2017;
• in the first months of this year the Harbour Authority of Genoa evaluated the project proposed by the Attilio Carmagnani compa-ny (active since 1904 in the handling and storage of petrochemi-cals via ship, rail and tanker lorry) and Superba (the company that manages the coastal depot connected to Multedo Oil Port in Genoa) to relocate their own coastal depots situated at the current head-quarters of Multedo di Pegli inside the Port’s water airport in an area of more than 30 thousand square metres currently occupied by Enel’s coal power plant, but which will be vacated by the end of next year. Concentrating the two depots could reduce the risks associated with the movement of stored products and the area of Multedo would in any case be remediated by the two Companies.
INVESTMENTS AND INDUSTRIAL ACTIVITIES
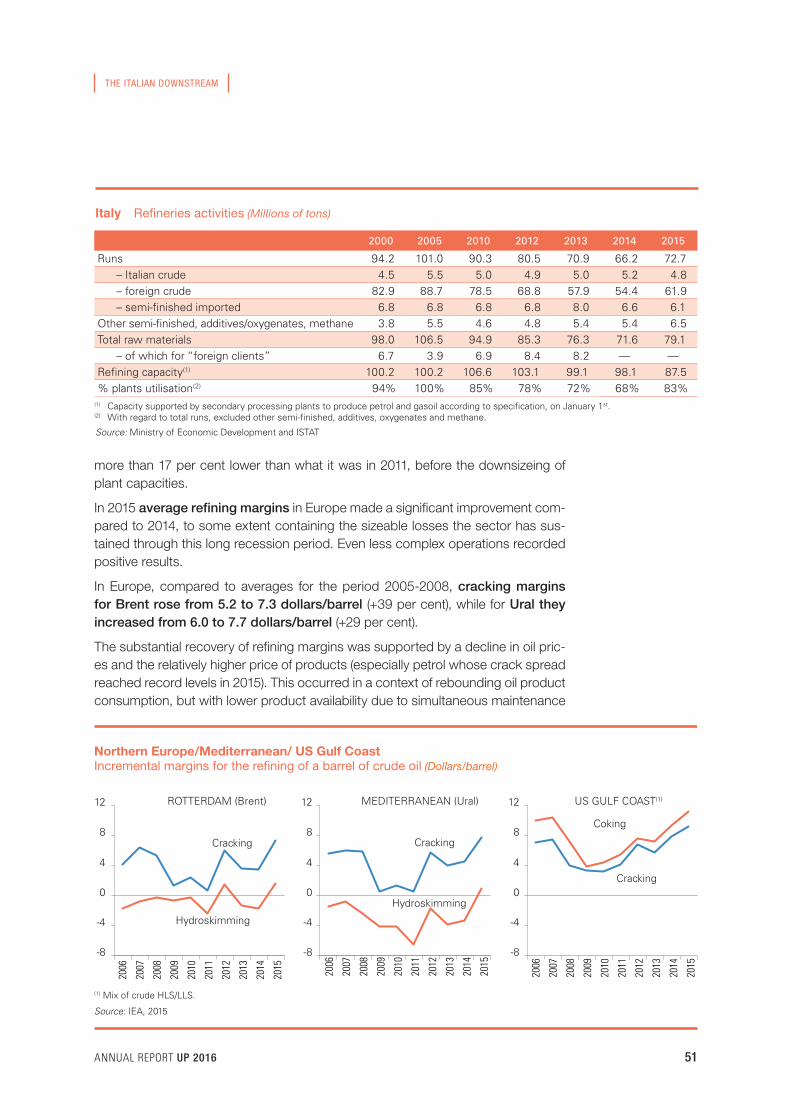
THE ITALIAN DOWNSTREAM
ANNUAL REPORT UP 2016 51
more than 17 per cent lower than what it was in 2011, before the downsizeing of plant capacities.
In 2015 average refining margins in Europe made a significant improvement com-pared to 2014, to some extent containing the sizeable losses the sector has sus-tained through this long recession period. Even less complex operations recorded positive results.
In Europe, compared to averages for the period 2005-2008, cracking margins for Brent rose from 5.2 to 7.3 dollars/barrel (+39 per cent), while for Ural they increased from 6.0 to 7.7 dollars/barrel (+29 per cent).
The substantial recovery of refining margins was supported by a decline in oil pric-es and the relatively higher price of products (especially petrol whose crack spread reached record levels in 2015). This occurred in a context of rebounding oil product consumption, but with lower product availability due to simultaneous maintenance
(1) Mix of crude HLS/LLS.
Source: IEA, 2015
-8
-4
0
4
8
12
Hydroskimming
Cracking
ROTTERDAM (Brent)
2014
2013
2012
2011
2010
2009
2008
2007
2015
2006
-8
-4
0
4
8
12
Cracking
Hydroskimming
MEDITERRANEAN (Ural)
2014
2013
2012
2011
2010
2009
2008
2007
2015
2006
-8
-4
0
4
8
12
Cracking
Coking
US GULF COAST(1)
2014
2013
2012
2011
2010
2009
2008
2007
2015
2006
Northern Europe/Mediterranean/ US Gulf CoastIncremental margins for the re�ning of a barrel of crude oil (Dollars/barrel)
Italy Refineries activities (Millions of tons)
2000 2005 2010 2012 2013 2014 2015
Runs 94.2 101.0 90.3 80.5 70.9 66.2 72.7– Italian crude 4.5 5.5 5.0 4.9 5.0 5.2 4.8– foreign crude 82.9 88.7 78.5 68.8 57.9 54.4 61.9– semi-finished imported 6.8 6.8 6.8 6.8 8.0 6.6 6.1
Other semi-finished, additives/oxygenates, methane 3.8 5.5 4.6 4.8 5.4 5.4 6.5Total raw materials 98.0 106.5 94.9 85.3 76.3 71.6 79.1
– of which for “foreign clients” 6.7 3.9 6.9 8.4 8.2 — —Refining capacity(1) 100.2 100.2 106.6 103.1 99.1 98.1 87.5% plants utilisation(2) 94% 100% 85% 78% 72% 68% 83%
(1) Capacity supported by secondary processing plants to produce petrol and gasoil according to specification, on January 1st.(2) With regard to total runs, excluded other semi-finished, additives, oxygenates and methane.
Source: Ministry of Economic Development and ISTAT
THE ITALIAN DOWNSTREAM
52 ANNUAL REPORT UP 2016
In 2015 and in the early months of this year the profile of the
operators’ assets changed only slightly. These included the fol-
lowing:
• the merger by incorporation of Erg Supply & Trading into Erg
Spa effective from July 1st, 2015 (for accounting and tax
purposes from January 1st, 2015);
• in October 2015, Rosneft JV Progetti, an indirect subsidiary
of Rosneft Oil Company sold its 8.99 per cent interest in
Saras to institutional investors for a total of 162.4 million
euros. With this deal Rosneft’s interest in Saras went down
from 21 to 12 per cent.
With the acquisition of this 9 per cent stake from Rosneft,
the Swiss institute UBS through UBS AG and UBS Switzer-
land AG, becomes an important shareholder in Saras owning
2.189 per cent of the Group;
• in September 2015 Saras established a new subsidiary in
Geneva, “Saras Trading SA”, which began its activities in
January of this year and which according to the Group’s
industrial Plan for 2016-2019 will aim to pursue new com-
mercial opportunities.
CHANGES IN MARKET SHARE AND OPERATORS’ STRUCTURE
In spite of the difficulties and uncertainty besetting an economy not yet completely out of a crisis, that caused profound changes in industrial structures, last year the oil sector again confirmed its excellence among national industries.
Among the events of 2015 and recognitions obtained by the oil sector the following anniversaries are of note:
• 40th year of activity for the Raffineria Isab di Priolo Gargallo (SR) and
• the 50th anniversary of the Raffineria Saras in Sarroch (CA), which are among the largest and most complex refineries in the Mediterranean.
In addition, the following awards were conferred on Eni:
• “Exploration Company of the Year” by the Petroleum Econo-mist, for having implemented an innovative approach in explo-ration activities and a unique capacity to successfully pursue its own business interests often in challenging environments;
• the National Prize for Innovation (“Prize of Prizes”) instituted
under the auspices of the President of the Republic and award-ed by Cotec, the National Foundation for Technological Innova-tion (Eni won the prize for the seventh straight year).
And in the following rankings:
• the highest ranking on the CDP “Italy Climate Disclosure Lead-ership Index” (CDLI), which includes Italy’s best publicly listed Companies for the completeness of information they provide on questions of climate change and greenhouse gas emissions;
• the top place on Comprend’s Webranking list for online Finan-cial communication by publicly listed Companies (followed by Erg in 13th place);
• the inclusion among the 20 “Capex Top Spenders”, Standard & Poor’s capital expenditure survey of investments by non-finan-cial Companies in Europe and the among the first 60 globally.
Also in 2015 Chairman & CEO of Exxon Mobil Corporation Rex W. Tillerson was given the “Petroleum Executive of the Year Award”.
AWARDS AND SPECIAL OCCASIONS FOR THE OIL SECTOR IN 2015
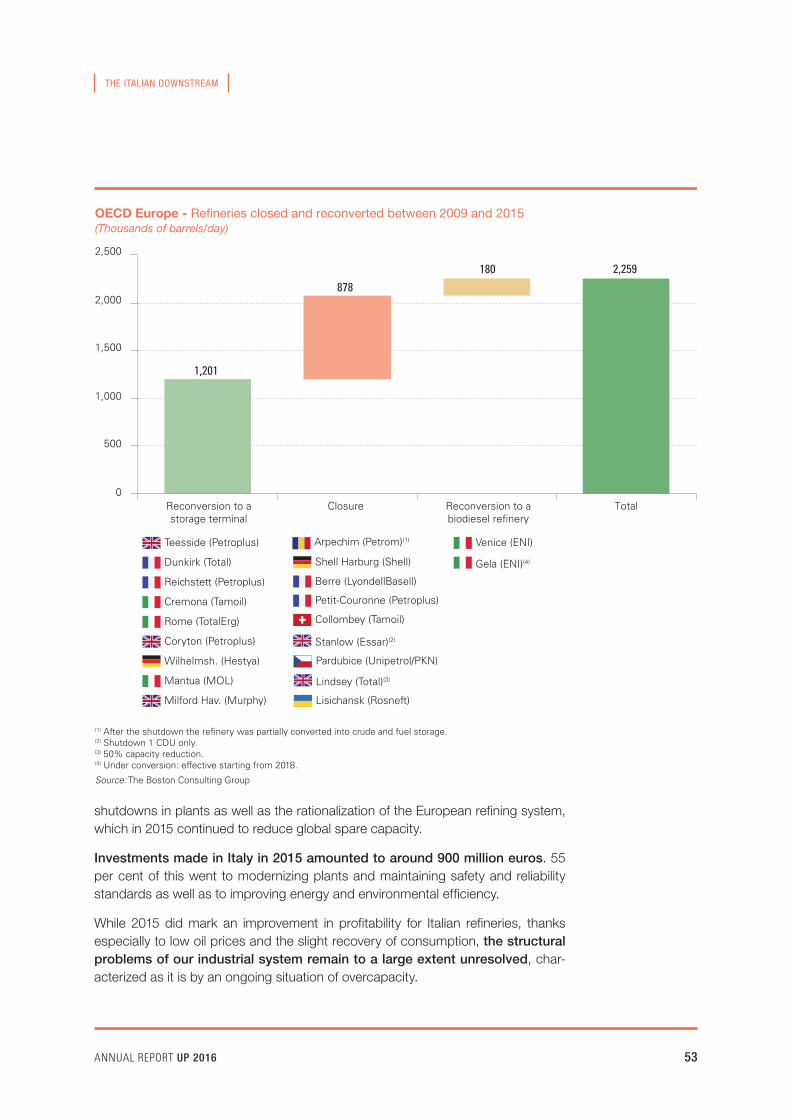
THE ITALIAN DOWNSTREAM
ANNUAL REPORT UP 2016 53
shutdowns in plants as well as the rationalization of the European refining system, which in 2015 continued to reduce global spare capacity.
Investments made in Italy in 2015 amounted to around 900 million euros. 55 per cent of this went to modernizing plants and maintaining safety and reliability standards as well as to improving energy and environmental efficiency.
While 2015 did mark an improvement in profitability for Italian refineries, thanks especially to low oil prices and the slight recovery of consumption, the structural problems of our industrial system remain to a large extent unresolved, char-acterized as it is by an ongoing situation of overcapacity.
OECD Europe - Re�neries closed and reconverted between 2009 and 2015 (Thousands of barrels/day)
(1) After the shutdown the refinery was partially converted into crude and fuel storage.(2) Shutdown 1 CDU only. (3) 50% capacity reduction. (4) Under conversion: effective starting from 2018.
Source: The Boston Consulting Group
Gela (ENI)(4)
Venice (ENI)Teesside (Petroplus)
Reichstett (Petroplus)
Rome (TotalErg)
Cremona (Tamoil)
Dunkirk (Total)
Coryton (Petroplus)
Wilhelmsh. (Hestya)
Mantua (MOL)
Milford Hav. (Murphy)
Shell Harburg (Shell)
Berre (LyondellBasell)
Petit-Couronne (Petroplus)
Collombey (Tamoil)
Stanlow (Essar)(2)
Pardubice (Unipetrol/PKN)
Lindsey (Total)(3)
Lisichansk (Rosneft)
Arpechim (Petrom)(1)
0
1,500
1,000
500
2,500
2,000
TotalClosureReconversion to astorage terminal
Reconversion to a biodiesel refinery
180878
2,259
1,201
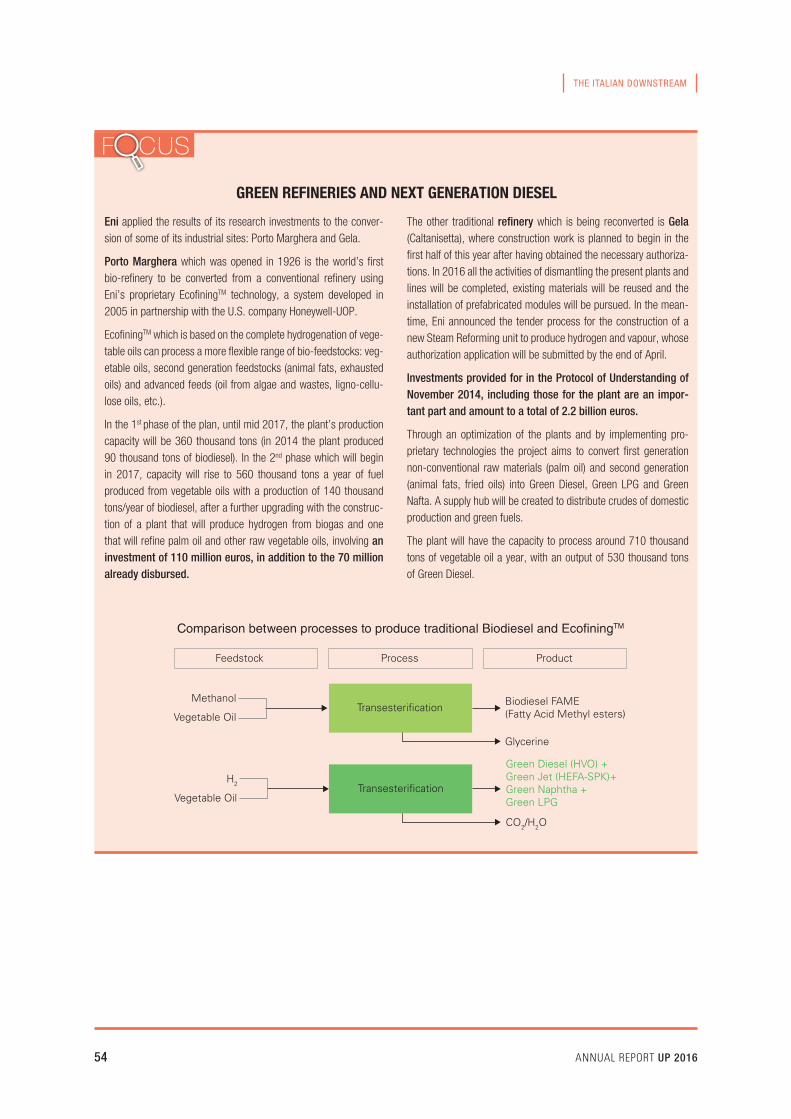
THE ITALIAN DOWNSTREAM
54 ANNUAL REPORT UP 2016
Eni applied the results of its research investments to the conver-sion of some of its industrial sites: Porto Marghera and Gela.
Porto Marghera which was opened in 1926 is the world’s first bio-refinery to be converted from a conventional refinery using Eni’s proprietary EcofiningTM technology, a system developed in 2005 in partnership with the U.S. company Honeywell-UOP.
EcofiningTM which is based on the complete hydrogenation of vege-table oils can process a more flexible range of bio-feedstocks: veg-etable oils, second generation feedstocks (animal fats, exhausted oils) and advanced feeds (oil from algae and wastes, ligno-cellu-lose oils, etc.).
In the 1st phase of the plan, until mid 2017, the plant’s production capacity will be 360 thousand tons (in 2014 the plant produced 90 thousand tons of biodiesel). In the 2nd phase which will begin in 2017, capacity will rise to 560 thousand tons a year of fuel produced from vegetable oils with a production of 140 thousand tons/year of biodiesel, after a further upgrading with the construc-tion of a plant that will produce hydrogen from biogas and one that will refine palm oil and other raw vegetable oils, involving an investment of 110 million euros, in addition to the 70 million already disbursed.
The other traditional refinery which is being reconverted is Gela (Caltanisetta), where construction work is planned to begin in the first half of this year after having obtained the necessary authoriza-tions. In 2016 all the activities of dismantling the present plants and lines will be completed, existing materials will be reused and the installation of prefabricated modules will be pursued. In the mean-time, Eni announced the tender process for the construction of a new Steam Reforming unit to produce hydrogen and vapour, whose authorization application will be submitted by the end of April.
Investments provided for in the Protocol of Understanding of November 2014, including those for the plant are an impor-tant part and amount to a total of 2.2 billion euros.
Through an optimization of the plants and by implementing pro-prietary technologies the project aims to convert first generation non-conventional raw materials (palm oil) and second generation (animal fats, fried oils) into Green Diesel, Green LPG and Green Nafta. A supply hub will be created to distribute crudes of domestic production and green fuels.
The plant will have the capacity to process around 710 thousand tons of vegetable oil a year, with an output of 530 thousand tons of Green Diesel.
GREEN REFINERIES AND NEXT GENERATION DIESEL
ProcessFeedstock Product
TransesterificationMethanol
Vegetable Oil
H2
Vegetable OilTransesterification
Biodiesel FAME(Fatty Acid Methyl esters)
Glycerine
Green Diesel (HVO) + Green Jet (HEFA-SPK)+ Green Naphtha + Green LPG
CO2/H2O
Comparison between processes to produce traditional Biodiesel and Eco�ningTM
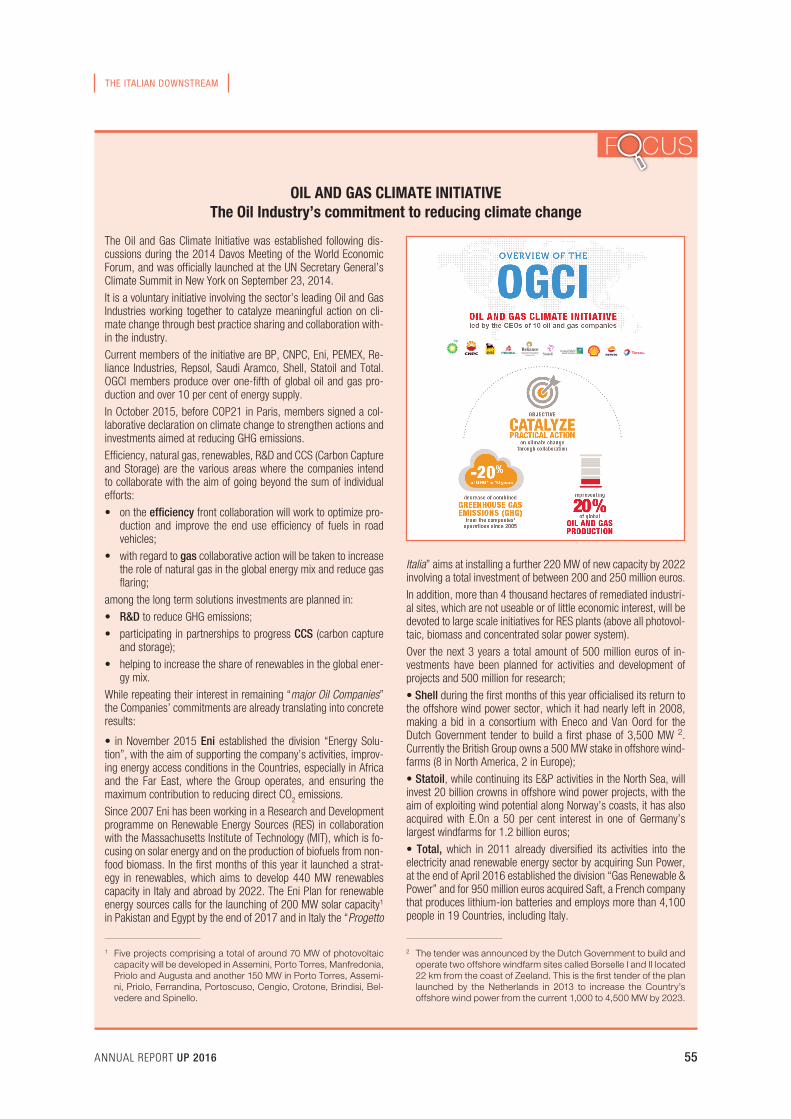
THE ITALIAN DOWNSTREAM
ANNUAL REPORT UP 2016 55
The Oil and Gas Climate Initiative was established following dis-cussions during the 2014 Davos Meeting of the World Economic Forum, and was officially launched at the UN Secretary General’s Climate Summit in New York on September 23, 2014.
It is a voluntary initiative involving the sector’s leading Oil and Gas Industries working together to catalyze meaningful action on cli-mate change through best practice sharing and collaboration with-in the industry.
Current members of the initiative are BP, CNPC, Eni, PEMEX, Re-liance Industries, Repsol, Saudi Aramco, Shell, Statoil and Total. OGCI members produce over one-fifth of global oil and gas pro-duction and over 10 per cent of energy supply.
In October 2015, before COP21 in Paris, members signed a col-laborative declaration on climate change to strengthen actions and investments aimed at reducing GHG emissions.
Efficiency, natural gas, renewables, R&D and CCS (Carbon Capture and Storage) are the various areas where the companies intend to collaborate with the aim of going beyond the sum of individual efforts:
• on the efficiency front collaboration will work to optimize pro-duction and improve the end use efficiency of fuels in road vehicles;
• with regard to gas collaborative action will be taken to increase the role of natural gas in the global energy mix and reduce gas flaring;
among the long term solutions investments are planned in:
• R&D to reduce GHG emissions;
• participating in partnerships to progress CCS (carbon capture and storage);
• helping to increase the share of renewables in the global ener-gy mix.
While repeating their interest in remaining “major Oil Companies” the Companies’ commitments are already translating into concrete results:
• in November 2015 Eni established the division “Energy Solu-tion”, with the aim of supporting the company’s activities, improv-ing energy access conditions in the Countries, especially in Africa and the Far East, where the Group operates, and ensuring the maximum contribution to reducing direct CO2 emissions.
Since 2007 Eni has been working in a Research and Development programme on Renewable Energy Sources (RES) in collaboration with the Massachusetts Institute of Technology (MIT), which is fo-cusing on solar energy and on the production of biofuels from non-food biomass. In the first months of this year it launched a strat-egy in renewables, which aims to develop 440 MW renewables capacity in Italy and abroad by 2022. The Eni Plan for renewable energy sources calls for the launching of 200 MW solar capacity1 in Pakistan and Egypt by the end of 2017 and in Italy the “Progetto
1 Five projects comprising a total of around 70 MW of photovoltaic capacity will be developed in Assemini, Porto Torres, Manfredonia, Priolo and Augusta and another 150 MW in Porto Torres, Assemi-ni, Priolo, Ferrandina, Portoscuso, Cengio, Crotone, Brindisi, Bel-vedere and Spinello.
Italia” aims at installing a further 220 MW of new capacity by 2022 involving a total investment of between 200 and 250 million euros.
In addition, more than 4 thousand hectares of remediated industri-al sites, which are not useable or of little economic interest, will be devoted to large scale initiatives for RES plants (above all photovol-taic, biomass and concentrated solar power system).
Over the next 3 years a total amount of 500 million euros of in-vestments have been planned for activities and development of projects and 500 million for research;
• Shell during the first months of this year officialised its return to the offshore wind power sector, which it had nearly left in 2008, making a bid in a consortium with Eneco and Van Oord for the Dutch Government tender to build a first phase of 3,500 MW 2. Currently the British Group owns a 500 MW stake in offshore wind-farms (8 in North America, 2 in Europe);
• Statoil, while continuing its E&P activities in the North Sea, will invest 20 billion crowns in offshore wind power projects, with the aim of exploiting wind potential along Norway’s coasts, it has also acquired with E.On a 50 per cent interest in one of Germany’s largest windfarms for 1.2 billion euros;
• Total, which in 2011 already diversified its activities into the electricity anad renewable energy sector by acquiring Sun Power, at the end of April 2016 established the division “Gas Renewable & Power” and for 950 million euros acquired Saft, a French company that produces lithium-ion batteries and employs more than 4,100 people in 19 Countries, including Italy.
2 The tender was announced by the Dutch Government to build and operate two offshore windfarm sites called Borselle I and II located 22 km from the coast of Zeeland. This is the first tender of the plan launched by the Netherlands in 2013 to increase the Country’s offshore wind power from the current 1,000 to 4,500 MW by 2023.
OIL AND GAS CLIMATE INITIATIVEThe Oil Industry’s commitment to reducing climate change
THE ITALIAN DOWNSTREAM
56 ANNUAL REPORT UP 2016
For some years refining in Italy and more general in Europe has been affected by a structural decline in domestic oil consumption, by excessive costs of European leg-islation and by a growing unequal competition from exporting Countries, especially Asia and the Middle East, which can rely on various forms of internal subsidies, on a booming domestic demand and far less stringent environmental regulations than in Europe.
These are clear competitive advantages and they have made international com-petition so asymmetric that the structural outlook for the near future remains bleak. This scenario was debated at length last March 1st in Brussels during the Refining Forum, which for the first time included the participation of the Europe-an Commissioner for Climate/Energy Miguel Arias Cañete. During the meeting the results of the Fitness Check conducted by the European Commission in the past three years were illustrated.
On this occasion the strategic importance of the refining industry was again stressed, not only for supply security but also for the contribution to energy secu-rity European refining can make in the transition towards a low carbon econ-omy, in keeping with the targets of COP21 in Paris.
It is therefore important that the European Institutions continue to monitor the impact of future legislation on the sector, since the results of the Fitness Check (tested under only the pre-2012 regulations) show that higher costs due to legis-lation accounted for 25 per cent of the loss of competitiveness in the period considered.
These are very high figures for an intensely competitive global market like refining and hence every new piece of legislation needs to be carefully evaluated; all the more so for the Industrial Emissions Directive and the Directive on Emission Trading (ETS II) covering the period 2020-2030.
Only be removing all those measures that severely damage the sector’s compet-itiveness and which have no real justification in terms of cost and benefit, will it be possible to keep this industrial activity in Europe, rather than relocating it in other regions of the Planet which will bring no environmental benefits but will certainly lead to economic, social and security disadvantages.
The fuel distribution network: changes in the regula-tory framework and critical issuesDespite great economic difficulties with margins practically at zero, in 2015 Italy’s fuel distribution network continued its efforts of rationalization, which led to the closure of around 300 sales points. On January 1st, 2015 Italy’s fuel distribu-tion network was estimated at 21,000 sales points, compared to 21,300 at the beginning of 2015. The decline was above all due to fewer company-owned service stations, while the number of other operators increased and now repre-sents 50 per cent of the market.
From 2007 until today, the number of sales points owned by independent oper-
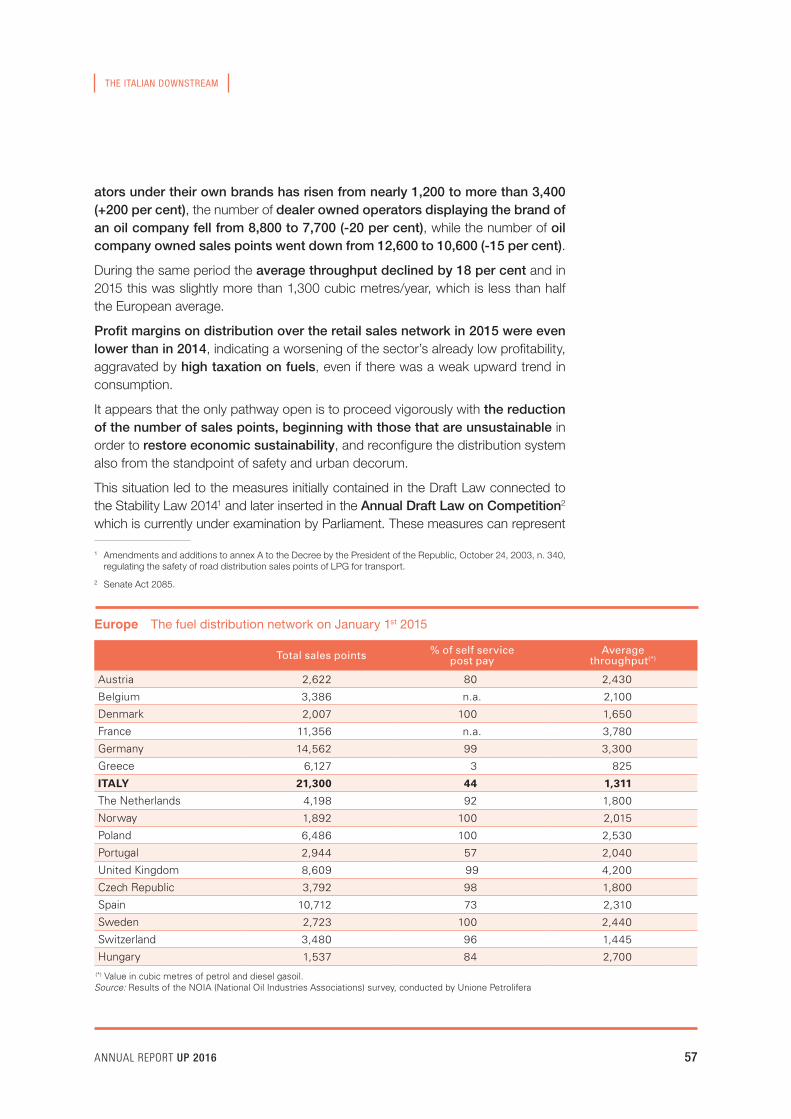
THE ITALIAN DOWNSTREAM
ANNUAL REPORT UP 2016 57
ators under their own brands has risen from nearly 1,200 to more than 3,400 (+200 per cent), the number of dealer owned operators displaying the brand of an oil company fell from 8,800 to 7,700 (-20 per cent), while the number of oil company owned sales points went down from 12,600 to 10,600 (-15 per cent).
During the same period the average throughput declined by 18 per cent and in 2015 this was slightly more than 1,300 cubic metres/year, which is less than half the European average.
Profit margins on distribution over the retail sales network in 2015 were even lower than in 2014, indicating a worsening of the sector’s already low profitability, aggravated by high taxation on fuels, even if there was a weak upward trend in consumption.
It appears that the only pathway open is to proceed vigorously with the reduction of the number of sales points, beginning with those that are unsustainable in order to restore economic sustainability, and reconfigure the distribution system also from the standpoint of safety and urban decorum.
This situation led to the measures initially contained in the Draft Law connected to the Stability Law 20141 and later inserted in the Annual Draft Law on Competition2 which is currently under examination by Parliament. These measures can represent
1 Amendments and additions to annex A to the Decree by the President of the Republic, October 24, 2003, n. 340, regulating the safety of road distribution sales points of LPG for transport.
2 Senate Act 2085.
Europe The fuel distribution network on January 1st 2015
Total sales points % of self service post pay
Average throughput(*)
Austria 2,622 80 2,430
Belgium 3,386 n.a. 2,100
Denmark 2,007 100 1,650
France 11,356 n.a. 3,780
Germany 14,562 99 3,300
Greece 6,127 3 825
ITALY 21,300 44 1,311
The Netherlands 4,198 92 1,800
Norway 1,892 100 2,015
Poland 6,486 100 2,530
Portugal 2,944 57 2,040
United Kingdom 8,609 99 4,200
Czech Republic 3,792 98 1,800
Spain 10,712 73 2,310
Sweden 2,723 100 2,440
Switzerland 3,480 96 1,445
Hungary 1,537 84 2,700(*) Value in cubic metres of petrol and diesel gasoil.Source: Results of the NOIA (National Oil Industries Associations) survey, conducted by Unione Petrolifera
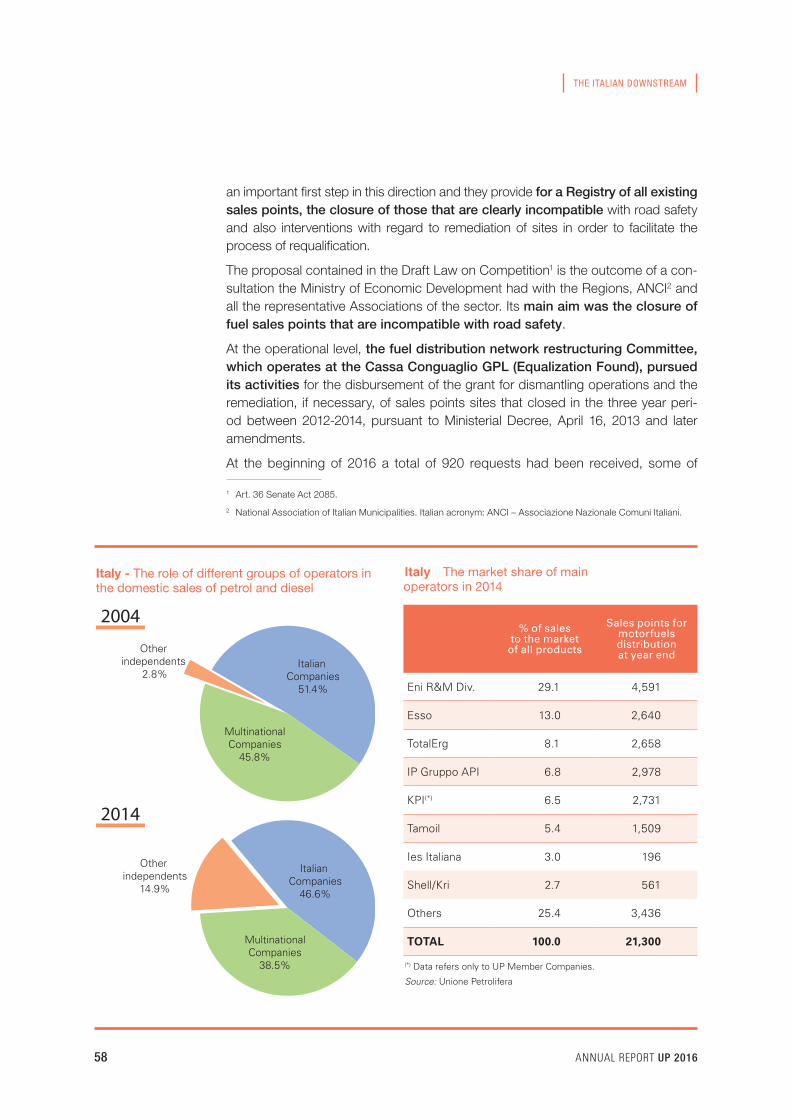
THE ITALIAN DOWNSTREAM
58 ANNUAL REPORT UP 2016
an important first step in this direction and they provide for a Registry of all existing sales points, the closure of those that are clearly incompatible with road safety and also interventions with regard to remediation of sites in order to facilitate the process of requalification.
The proposal contained in the Draft Law on Competition1 is the outcome of a con-sultation the Ministry of Economic Development had with the Regions, ANCI2 and all the representative Associations of the sector. Its main aim was the closure of fuel sales points that are incompatible with road safety.
At the operational level, the fuel distribution network restructuring Committee, which operates at the Cassa Conguaglio GPL (Equalization Found), pursued its activities for the disbursement of the grant for dismantling operations and the remediation, if necessary, of sales points sites that closed in the three year peri-od between 2012-2014, pursuant to Ministerial Decree, April 16, 2013 and later amendments.
At the beginning of 2016 a total of 920 requests had been received, some of
1 Art. 36 Senate Act 2085.
2 National Association of Italian Municipalities. Italian acronym: ANCI – Associazione Nazionale Comuni Italiani.
Italy - The role of different groups of operators in the domestic sales of petrol and diesel
Other independents
2.8%Italian
Companies51.4%
MultinationalCompanies
45.8%
2004
2014
Italian Companies
46.6%
MultinationalCompanies
38.5%
Other independents
14.9%
Italy The market share of main operators in 2014
% of sales to the market
of all products
Sales points for motorfuelsdistribution at year end
Eni R&M Div. 29.1 4,591
Esso 13.0 2,640
TotalErg 8.1 2,658
IP Gruppo API 6.8 2,978
KPI(*) 6.5 2,731
Tamoil 5.4 1,509
Ies Italiana 3.0 196
Shell/Kri 2.7 561
Others 25.4 3,436
TOTAL 100.0 21,300
(*) Data refers only to UP Member Companies.
Source: Unione Petrolifera
THE ITALIAN DOWNSTREAM
ANNUAL REPORT UP 2016 59
them already paid out, while the others will have to wait for the conclusion of the proceedings.
In this regard, a number of procedural and operational difficulties remain in the preliminary procedures, in spite of the streamlining measures adopted by the Ministry. It is hoped that the process of examining the applications can be speeded up, in view of the pledge made by the Offices assigned to the task and in consideration of the concern the operators expressed over how slowly they are proceeding and also of the considerable economic costs the sector had to sustain in 2015 to make the final payment to the Fund, which was paid to the Cassa Conguaglio GPL.
Another problem to resolve is the recovery of missing contributions to the Fund itself, a phenomenon which was already noticeable when a number of advance deposits due were not paid and which the Cassa Conguaglio GPL is still working on.
Finally, there is the issue of managing the Rationalization Fund after December 31, 2016, the last date for the reorganization of the Cassa Conguaglio GPL. One possible solution could be the proposal made in the Draft Law on Competition to transfer the Fund’s responsibilities to the GSE or its parent companies.
The Draft Law on Competition1 also delegates to the Ministry of Economic Devel-opment, after consulting with the Regions and the Antitrust Authority, the task of defining “technical obstacles and economic costs” so that there would be no obligation to install LPG or methane at the new sales points.
It is hoped that this measure will make it possible to define a certain framework that reconciles the need to develop the market of alternative fuels in line with the terms of DAFI Directive 2014/94/EU2, with that of safeguarding competition, while eliminating reasons for disagreement between the State and the Regions. Indeed, in 2015 the absence of nationwide homogeneous criteria led the Presidency of the Council of Ministers to contest before the Constitutional Court the validity of several regional laws making it compulsory to install LPG or methane in new sales points.
Such disputes do not help operators, who need a certain and stable legal frame-work in order to invest.
In order to promote the use of these alternative fuels it is also essential to permit their distribution through self-service facilities. In this regard, we are waiting for the Italian Gas Committee, federated UNI3 to issue the technical standards regu-lating the prohibition to distribute LPG in tanks not destined for motor vehicles. This regulation is needed in order to implement the amendments made by Minis-terial Decree on March 31, 20144 to the Decree by the President of the Republic n. 340/2003 concerning the sale of LPG in unattended self-service facilities.
1 Art. 35 Senate Act 2085.
2 Directive 2014/94/EU of the European Parliament and Council of October 22, 2014. DAFI - Deployment of Alterna-tive Fuels Infrastructure.
3 Italian acronym: CIG - Comitato Italiano Gas. It is federated the Italian Organization for Standardization. Italian acronym: UNI - Ente Italiano di Unificazione.
4 Amendments and additions to annex A to the Decree by the President of the Republic, October 24, 2003, n. 340, containing measures regulating the safety of road distribution plants of LPG for transport.
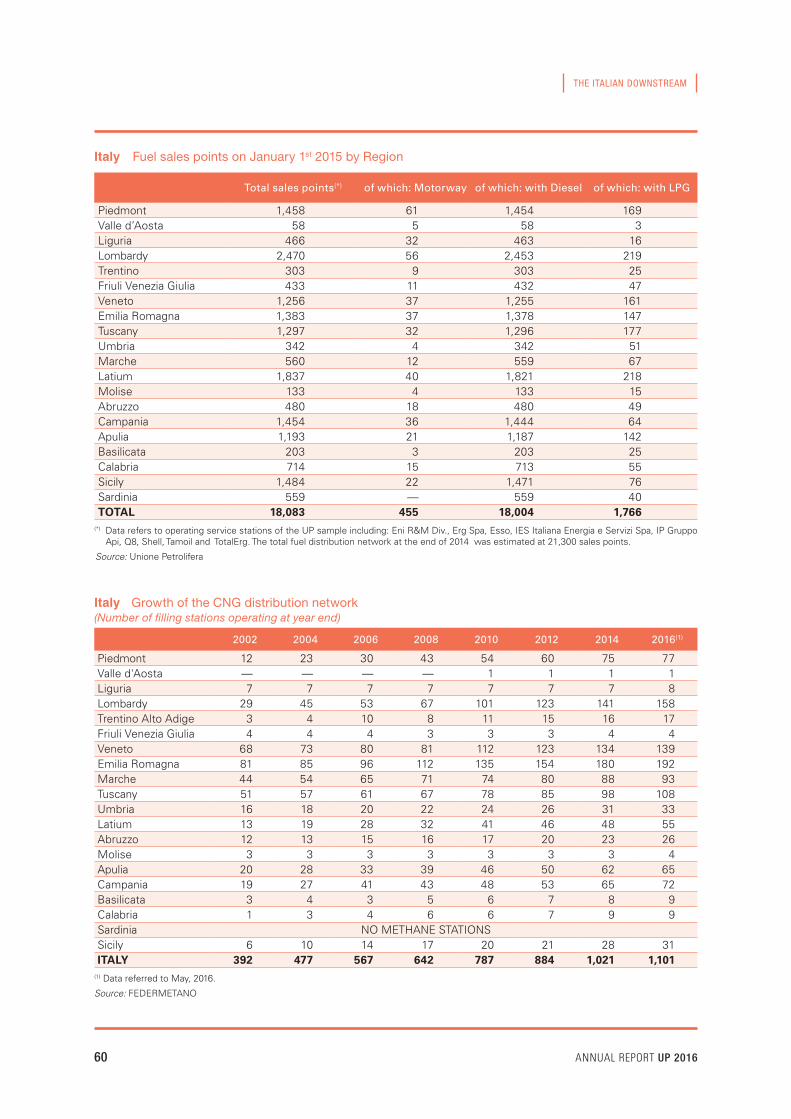
THE ITALIAN DOWNSTREAM
60 ANNUAL REPORT UP 2016
Italy Fuel sales points on January 1st 2015 by Region
Total sales points(*) of which: Motorway of which: with Diesel of which: with LPG
Piedmont 1,458 61 1,454 169Valle d’Aosta 58 5 58 3Liguria 466 32 463 16Lombardy 2,470 56 2,453 219Trentino 303 9 303 25Friuli Venezia Giulia 433 11 432 47Veneto 1,256 37 1,255 161Emilia Romagna 1,383 37 1,378 147Tuscany 1,297 32 1,296 177Umbria 342 4 342 51Marche 560 12 559 67Latium 1,837 40 1,821 218Molise 133 4 133 15Abruzzo 480 18 480 49Campania 1,454 36 1,444 64Apulia 1,193 21 1,187 142Basilicata 203 3 203 25Calabria 714 15 713 55Sicily 1,484 22 1,471 76Sardinia 559 — 559 40TOTAL 18,083 455 18,004 1,766
(*) Data refers to operating service stations of the UP sample including: Eni R&M Div., Erg Spa, Esso, IES Italiana Energia e Servizi Spa, IP Gruppo Api, Q8, Shell, Tamoil and TotalErg. The total fuel distribution network at the end of 2014 was estimated at 21,300 sales points.
Source: Unione Petrolifera
Italy Growth of the CNG distribution network (Number of filling stations operating at year end)
2002 2004 2006 2008 2010 2012 2014 2016(1)
Piedmont 12 23 30 43 54 60 75 77Valle d'Aosta — — — — 1 1 1 1Liguria 7 7 7 7 7 7 7 8Lombardy 29 45 53 67 101 123 141 158Trentino Alto Adige 3 4 10 8 11 15 16 17Friuli Venezia Giulia 4 4 4 3 3 3 4 4Veneto 68 73 80 81 112 123 134 139Emilia Romagna 81 85 96 112 135 154 180 192Marche 44 54 65 71 74 80 88 93Tuscany 51 57 61 67 78 85 98 108Umbria 16 18 20 22 24 26 31 33Latium 13 19 28 32 41 46 48 55Abruzzo 12 13 15 16 17 20 23 26Molise 3 3 3 3 3 3 3 4Apulia 20 28 33 39 46 50 62 65Campania 19 27 41 43 48 53 65 72Basilicata 3 4 3 5 6 7 8 9Calabria 1 3 4 6 6 7 9 9Sardinia NO METHANE STATIONSSicily 6 10 14 17 20 21 28 31ITALY 392 477 567 642 787 884 1,021 1,101
(1) Data referred to May, 2016.
Source: FEDERMETANO
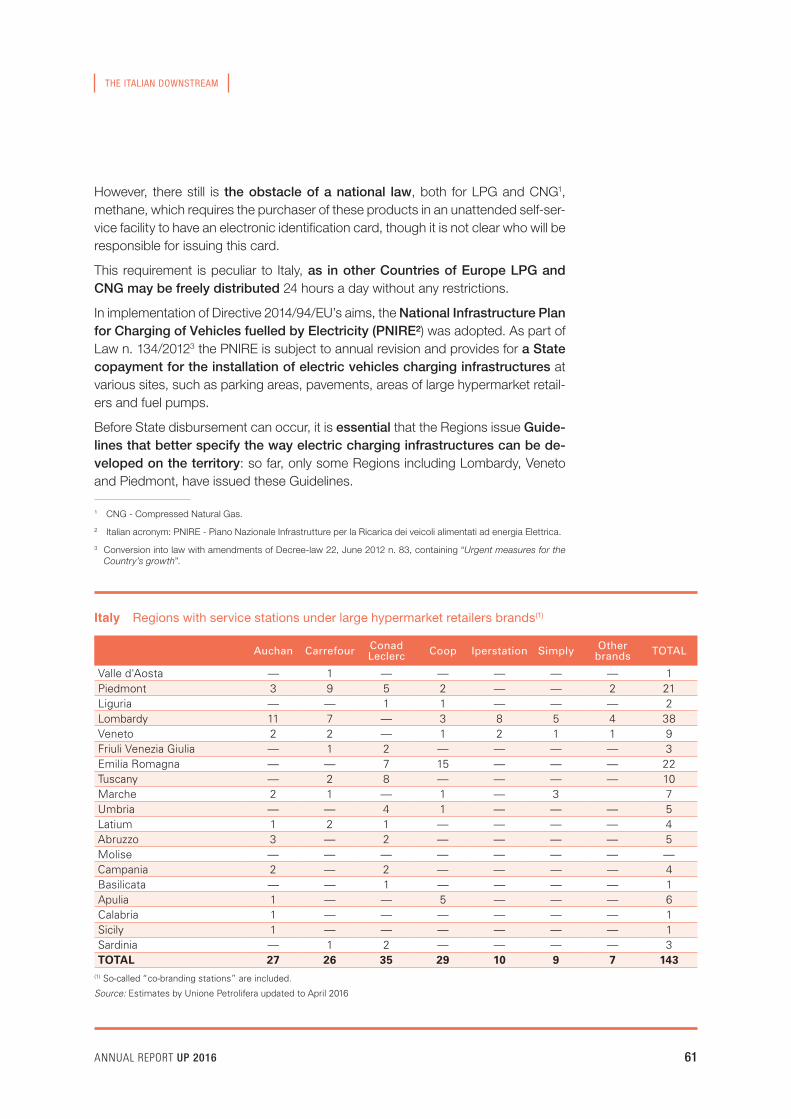
THE ITALIAN DOWNSTREAM
ANNUAL REPORT UP 2016 61
However, there still is the obstacle of a national law, both for LPG and CNG1, methane, which requires the purchaser of these products in an unattended self-ser-vice facility to have an electronic identification card, though it is not clear who will be responsible for issuing this card.
This requirement is peculiar to Italy, as in other Countries of Europe LPG and CNG may be freely distributed 24 hours a day without any restrictions.
In implementation of Directive 2014/94/EU’s aims, the National Infrastructure Plan for Charging of Vehicles fuelled by Electricity (PNIRE2) was adopted. As part of Law n. 134/20123 the PNIRE is subject to annual revision and provides for a State copayment for the installation of electric vehicles charging infrastructures at various sites, such as parking areas, pavements, areas of large hypermarket retail-ers and fuel pumps.
Before State disbursement can occur, it is essential that the Regions issue Guide-lines that better specify the way electric charging infrastructures can be de-veloped on the territory: so far, only some Regions including Lombardy, Veneto and Piedmont, have issued these Guidelines.
1 CNG - Compressed Natural Gas.
2 Italian acronym: PNIRE - Piano Nazionale Infrastrutture per la Ricarica dei veicoli alimentati ad energia Elettrica.
3 Conversion into law with amendments of Decree-law 22, June 2012 n. 83, containing “Urgent measures for the Country’s growth”.
Italy Regions with service stations under large hypermarket retailers brands(1)
Auchan Carrefour ConadLeclerc Coop Iperstation Simply Other
brands TOTAL
Valle d'Aosta — 1 — — — — — 1Piedmont 3 9 5 2 — — 2 21Liguria — — 1 1 — — — 2Lombardy 11 7 — 3 8 5 4 38Veneto 2 2 — 1 2 1 1 9Friuli Venezia Giulia — 1 2 — — — — 3Emilia Romagna — — 7 15 — — — 22Tuscany — 2 8 — — — — 10Marche 2 1 — 1 — 3 7Umbria — — 4 1 — — — 5Latium 1 2 1 — — — — 4Abruzzo 3 — 2 — — — — 5Molise — — — — — — — —Campania 2 — 2 — — — — 4Basilicata — — 1 — — — — 1Apulia 1 — — 5 — — — 6Calabria 1 — — — — — — 1Sicily 1 — — — — — — 1Sardinia — 1 2 — — — — 3TOTAL 27 26 35 29 10 9 7 143
(1) So-called “co-branding stations” are included.
Source: Estimates by Unione Petrolifera updated to April 2016
THE ITALIAN DOWNSTREAM
62 ANNUAL REPORT UP 2016
While this is a no doubt an excellent initiative, it raises a number of questions that still need to be resolved. First of all, it is not yet clear how to go beyond the cur-rent rules that only allow those who produce electricity to sell it, a requirement that cannot always be met by the operator of fuel service station.
Moreover with regard to State financing, it is not clear if the funds allocated are compatible with art 107 of the Treaty on the Functioning of the European Union in matters of State Aid.
The crisis of the fuel distribution network along motorwaysAfter a lengthy wait, Ministerial Decree August 7, 2015, signed by the Ministries of Economic Development and Transport, approved the Plan to restructure service station areas along motorways.
The Plan, which was examined by the Conference of Regions and Autonomous Provinces, had been touted as a useful instrument to restore economic viability and efficiency of motorway services. Unfortunately, it proved to be disappointing and confusing.
As Unione Petrolifera pointed out to the Antitrust Authority, the Interministerial De-cree, besides not at all contributing to the hoped for restructuring of the motorway network, intervenes heavily in private relationships between company and re-tailers.
For these reasons, and in view of the deterioration of the already critical situation faced by motorway service stations, whose volumes sold continued to decline in 2015 (-7 per cent; since 2007 the decline is 55 per cent) while traffic increased by more than 3 per cent, the oil sector submitted an appeal to the Regional Ad-ministrative Court1 of Latium against the Decree approving the Plan.
Among the elements behind the appeal are the requirements motorway conces-sionaires need to respect in performing procedures when assigning fuel-lubricant or restaurant services along motorways and which make it difficult for competi-tors to prepare competitive bids, above all because they include burdensome conditions for the assignees.
Earlier, Unione Petrolifera had also drawn attention to the critical aspect of the scheduling of the tenders, which prevent interested parties from consciously and rationally participating, thus damaging competition and, consequently, the quality of services to consumers.
This critical problem was resolved with the note of December 2015, in which the competent Ministries rescheduled the tender process, which expired on Decem-ber 31, 2015, and set the new deadline of June 30, 2016 for the bidding to close.
This dispute which also saw the Retailers Associations file a lawsuit with the TAR,
1 Italian acronym: TAR – Tribunale Amministrativo Regionale.
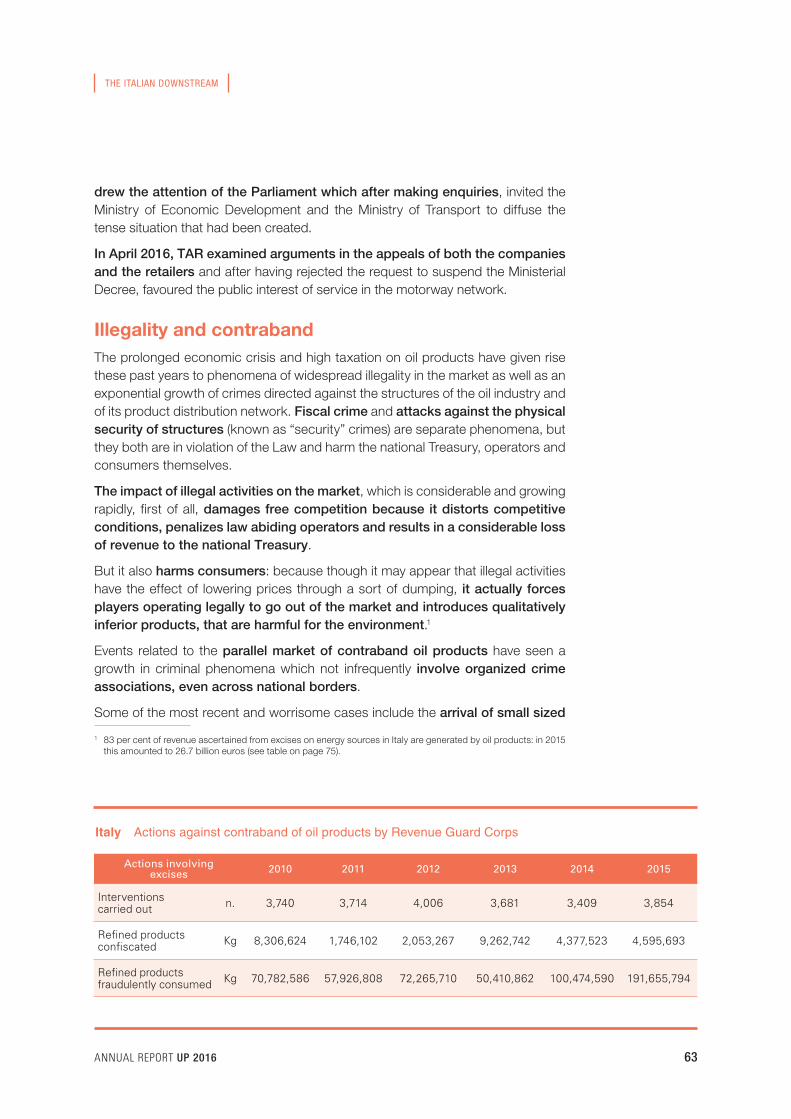
THE ITALIAN DOWNSTREAM
ANNUAL REPORT UP 2016 63
drew the attention of the Parliament which after making enquiries, invited the Ministry of Economic Development and the Ministry of Transport to diffuse the tense situation that had been created.
In April 2016, TAR examined arguments in the appeals of both the companies and the retailers and after having rejected the request to suspend the Ministerial Decree, favoured the public interest of service in the motorway network.
Illegality and contraband The prolonged economic crisis and high taxation on oil products have given rise these past years to phenomena of widespread illegality in the market as well as an exponential growth of crimes directed against the structures of the oil industry and of its product distribution network. Fiscal crime and attacks against the physical security of structures (known as “security” crimes) are separate phenomena, but they both are in violation of the Law and harm the national Treasury, operators and consumers themselves.
The impact of illegal activities on the market, which is considerable and growing rapidly, first of all, damages free competition because it distorts competitive conditions, penalizes law abiding operators and results in a considerable loss of revenue to the national Treasury.
But it also harms consumers: because though it may appear that illegal activities have the effect of lowering prices through a sort of dumping, it actually forces players operating legally to go out of the market and introduces qualitatively inferior products, that are harmful for the environment.1
Events related to the parallel market of contraband oil products have seen a growth in criminal phenomena which not infrequently involve organized crime associations, even across national borders.
Some of the most recent and worrisome cases include the arrival of small sized
1 83 per cent of revenue ascertained from excises on energy sources in Italy are generated by oil products: in 2015 this amounted to 26.7 billion euros (see table on page 75).
Italy Actions against contraband of oil products by Revenue Guard Corps
Actions involving excises 2010 2011 2012 2013 2014 2015
Interventions carried out n. 3,740 3,714 4,006 3,681 3,409 3,854
Refined productsconfiscated Kg 8,306,624 1,746,102 2,053,267 9,262,742 4,377,523 4,595,693
Refined products fraudulently consumed Kg 70,782,586 57,926,808 72,265,710 50,410,862 100,474,590 191,655,794
THE ITALIAN DOWNSTREAM
64 ANNUAL REPORT UP 2016
Unione Petrolifera together with Assopetroli prepared a docu-ment with the aim of providing the competent Authorities with possible proposals regarding intervention in the area of taxation. If these are appropriately implemented in procedure and timing they would be a useful instrument to counteract a rapidly growing phenomenon.
• It has been observed that there are too many fiscal ware-houses, which are the logistical facilities for the distribution system of oil products exempt from excises. Currently, there are some 400 warehouses, often of modest size, which are not justifiable in terms of operational needs or supplying the market. Frequently they are also associated with the VAT storage warehouses, so that they present an elevated risk from the fiscal point of view.
For these reasons measures need to be taken to ensure that the new warehouses be limited to facilities that are re-supplied mainly via sea/pipeline and to small warehouses only if they are considered of strategic importance for the logistics and distribution of incentivized products. In relation to the currently operating fiscal warehouses, enforcement Authorities need to perform regular inspections to determine compliance with the objective and subjective criteria indicat-ed by the Customs Agency in Circular 16/D of April 28, 2006.
• Also for registered receivers, that is, operators who are authorized to receive excise-exempt products, a special regulation would need to define the requirements of access to this suspension, in view of the fact that fuel distribution sales points have also been given the suspension, when under the current rules they should only be allowed to receive products on which the tax has already been paid.
• Other critical issues derive from the movement of products within other States in the European Union. The circulation system for lubricants is simpler than that of other fuels, since the terms of Directive on the taxation of energy products do not apply to them. As a result, the movement of lubricants
from other European member States to Italy are not trace-able. This system favours a double system of tax evasion (evasion of the excise on lubricants; their use as gasoil and, hence, an evasion of the excise on fuels). In order to counter these behaviours it was suggested that an extension of the intra-community circulation system of suspended duty for fuels (EMCS – Excise Movement Control System) should be promoted at the European Commission, to cover the transport of lubricants as well.
• It has also been observed that fuels being passed through Italy towards other members States from eastern Eu-rope are rerouted in order to supply Italy’s network of clandestine storage facilities. A valid instrument to counter these particular cases could be the compulsory adoption of an electronic system that can trace the route tanker lorries really take. This proposal is currently under study also for the purpose of road safety.
• Fiscal fraud involving fuels also occurs in the wilful and fraudulent use of the declaration of habitual exporter for the purpose of purchasing goods in exception of VAT.
In order to repress the phenomenon, it was proposed that the acquisition of fuels through use of the plafond mechanism only apply to those habitual exporters, who during the previous year made exports or conducted intra-community trade of the same products.
These operators will also have to obtain, upon special request, an anticipatory certificate from the Customs Agency which declares the amount of the above mentioned trading operations that were conducted the previous year.
The Revenue Agency will then only issue the receipt for the elec-tronic declaration of habitual exporter, with specific reference to the oil products involved, after they have received from the Cus-toms Agency the abovementioned certificate stating the amount of the export and/or community operations carried out in the ref-erence year, above a value of one million euros.
FIGHTING BACK AGAINST ILLEGALITY IN THE TRADE OF OIL PRODUCTS.THE PROTOCOL WITH ASSOPETROLI
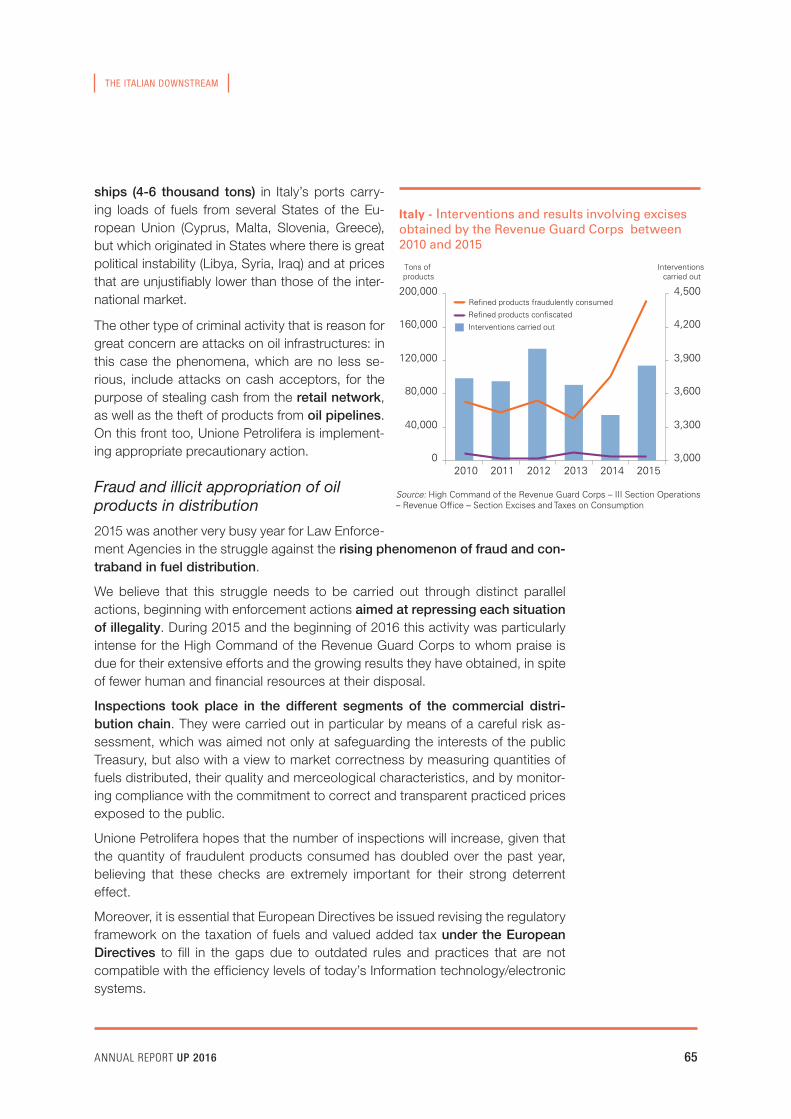
THE ITALIAN DOWNSTREAM
ANNUAL REPORT UP 2016 65
ships (4-6 thousand tons) in Italy’s ports carry-ing loads of fuels from several States of the Eu-ropean Union (Cyprus, Malta, Slovenia, Greece), but which originated in States where there is great political instability (Libya, Syria, Iraq) and at prices that are unjustifiably lower than those of the inter-national market.
The other type of criminal activity that is reason for great concern are attacks on oil infrastructures: in this case the phenomena, which are no less se-rious, include attacks on cash acceptors, for the purpose of stealing cash from the retail network, as well as the theft of products from oil pipelines. On this front too, Unione Petrolifera is implement-ing appropriate precautionary action.
Fraud and illicit appropriation of oil products in distribution
2015 was another very busy year for Law Enforce-ment Agencies in the struggle against the rising phenomenon of fraud and con-traband in fuel distribution.
We believe that this struggle needs to be carried out through distinct parallel actions, beginning with enforcement actions aimed at repressing each situation of illegality. During 2015 and the beginning of 2016 this activity was particularly intense for the High Command of the Revenue Guard Corps to whom praise is due for their extensive efforts and the growing results they have obtained, in spite of fewer human and financial resources at their disposal.
Inspections took place in the different segments of the commercial distri-bution chain. They were carried out in particular by means of a careful risk as-sessment, which was aimed not only at safeguarding the interests of the public Treasury, but also with a view to market correctness by measuring quantities of fuels distributed, their quality and merceological characteristics, and by monitor-ing compliance with the commitment to correct and transparent practiced prices exposed to the public.
Unione Petrolifera hopes that the number of inspections will increase, given that the quantity of fraudulent products consumed has doubled over the past year, believing that these checks are extremely important for their strong deterrent effect.
Moreover, it is essential that European Directives be issued revising the regulatory framework on the taxation of fuels and valued added tax under the European Directives to fill in the gaps due to outdated rules and practices that are not compatible with the efficiency levels of today’s Information technology/electronic systems.
Italy - Interventions and results involving excisesobtained by the Revenue Guard Corps between 2010 and 2015
0
40,000
80,000
120,000
160,000
200,000
Refined products confiscated
Refined products fraudulently consumed
Interventions carried out
2010 2011 2012 2013 2014 20153,000
3,300
3,600
3,900
4,200
4,500
Interventions carried out
Tons of products
Source: High Command of the Revenue Guard Corps – III Section Operations – Revenue Office – Section Excises and Taxes on Consumption
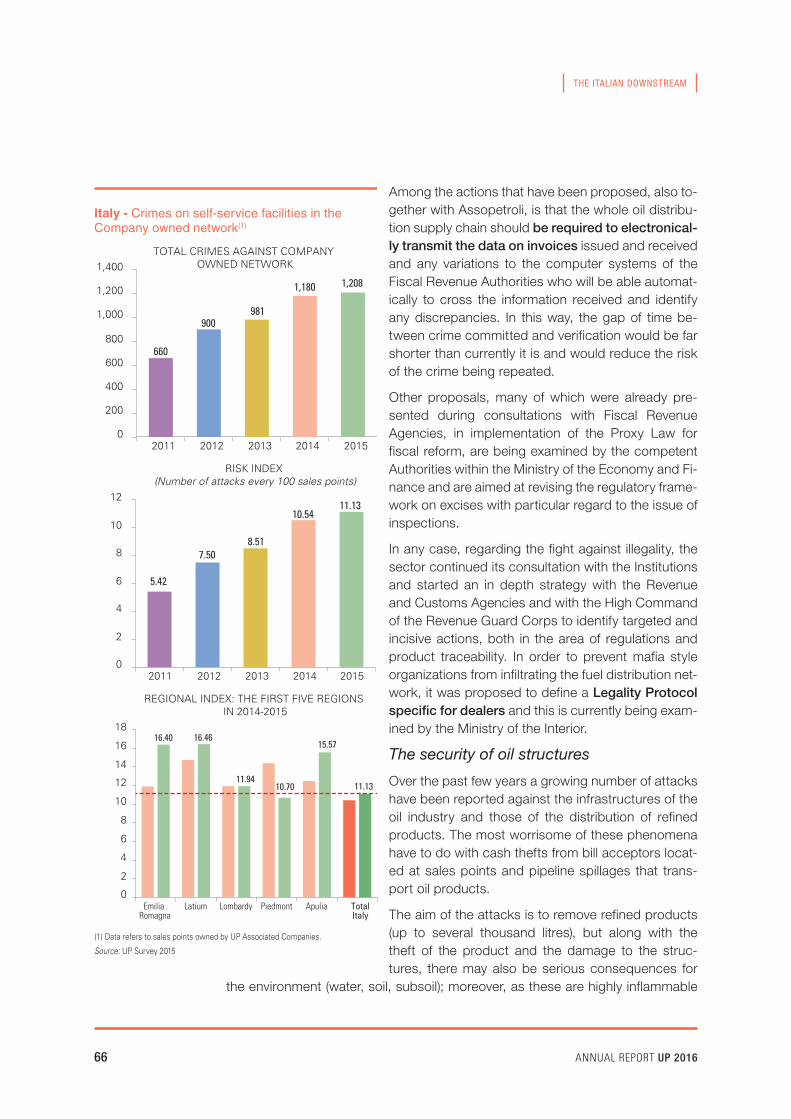
THE ITALIAN DOWNSTREAM
66 ANNUAL REPORT UP 2016
Among the actions that have been proposed, also to-gether with Assopetroli, is that the whole oil distribu-tion supply chain should be required to electronical-ly transmit the data on invoices issued and received and any variations to the computer systems of the Fiscal Revenue Authorities who will be able automat-ically to cross the information received and identify any discrepancies. In this way, the gap of time be-tween crime committed and verification would be far shorter than currently it is and would reduce the risk of the crime being repeated.
Other proposals, many of which were already pre-sented during consultations with Fiscal Revenue Agencies, in implementation of the Proxy Law for fiscal reform, are being examined by the competent Authorities within the Ministry of the Economy and Fi-nance and are aimed at revising the regulatory frame-work on excises with particular regard to the issue of inspections.
In any case, regarding the fight against illegality, the sector continued its consultation with the Institutions and started an in depth strategy with the Revenue and Customs Agencies and with the High Command of the Revenue Guard Corps to identify targeted and incisive actions, both in the area of regulations and product traceability. In order to prevent mafia style organizations from infiltrating the fuel distribution net-work, it was proposed to define a Legality Protocol specific for dealers and this is currently being exam-ined by the Ministry of the Interior.
The security of oil structures
Over the past few years a growing number of attacks have been reported against the infrastructures of the oil industry and those of the distribution of refined products. The most worrisome of these phenomena have to do with cash thefts from bill acceptors locat-ed at sales points and pipeline spillages that trans-port oil products.
The aim of the attacks is to remove refined products (up to several thousand litres), but along with the theft of the product and the damage to the struc-tures, there may also be serious consequences for
the environment (water, soil, subsoil); moreover, as these are highly inflammable
2011 2012 2013 2014 20150
200
400
600
800
1,000
1,200
1,400
660
900981
1,180 1,208
TOTAL CRIMES AGAINST COMPANY OWNED NETWORK
RISK INDEX (Number of attacks every 100 sales points)
2011 2012 2013 2014 20150
2
4
6
8
10
12
8.51
10.54
7.50
5.42
11.13
(1) Data refers to sales points owned by UP Associated Companies.
Source: UP Survey 2015
Emilia Romagna
Latium Lombardy Piedmont Apulia TotalItaly
0
2
4
6
8
10
12
14
16
1816.40
11.9410.70
15.5716.46
11.13
REGIONAL INDEX: THE FIRST FIVE REGIONS IN 2014-2015
Italy - Crimes on self-service facilities in the Company owned network(1)
THE ITALIAN DOWNSTREAM
ANNUAL REPORT UP 2016 67
substances, they represent a public safety risk in addition to potential service interruptions.
To address these problems, a monitoring table was set up with the task of gath-ering precise information about the events that have transpired in recent years, in order to come up with concrete proposals.
Of foremost importance is tougher penalties against those who attack oil infra-structures, boosting investigation activities by centralizing all the available infor-mation, implementing local prevention plans and countermeasures by Law En-forcement.
Attacks against cash acceptors also increased in 2015, with 10.5 incidents for every 100 sales points compared to a risk index1 of 8.5 last year as reported in the OSSIF 2015 Report on predatory crime.
With the aim of defining possible technical-executive interventions to improve the security of self-service cash acceptor terminals from physical attacks and fraud, UP, Assopetroli, Grandi Rete and ANIMA/ACIS2 prepared the Guidelines “Tech-nical security standards for self-service payment terminals”, which are an in-strument to make informed choices on the technical solutions that are currently available or being implemented.
The Guidelines list the countermeasures thought to be the most effective for each type of attack, either known or potential, against equipment. The measures are oriented towards physically strengthening cash acceptors in order to increase the time needed to break into them and to discourage theft.
Another line of action to reduce cash theft is to incentivize electronic payment
1 Risk index: number of attacks for every 100 sales points.
2 ANIMA (Federazione delle Associazioni nazionali dell’Industria Meccanica Varia ed Affine) – Federation of the Ital-ian Associations of Mechanical and Engineering Industries. ACISM (Associazione Costruttori Italiani di Strumenti di Misura) – Measuring Instruments Producers’ Association.
Oil Pipelines • tougher penalties for those attacking oil structures (amending
art. 433 of the Penal Code), as was already done for copper theft. In addition, criminals could be subject to the penalties contained in the recent Law on Environmental Crime (Law 68/2015);
• boosting investigative activities by centralizing all the available information on attacks against oil pipelines;
• implementing local prevention plans and countermeasures by Law Enforcement.
Fuel Distribution Network• systemic synergies with Law Enforcement Agencies to help
prevent criminal attacks;• incentivizing electronic payment, making it attractive for both
oil and non-oil purchases, and removing the obstacles that still exist in the payment chain;
• Legality Protocol specific for dealers, with the Ministry of Inte-rior for the prevention of Mafia style crimes, by also involving retailers’ Associations and independent operators of the distri-bution network.
SECURITY INITIATIVES OF PRIORITY IMPORTANCE FOR THE OIL SECTOR
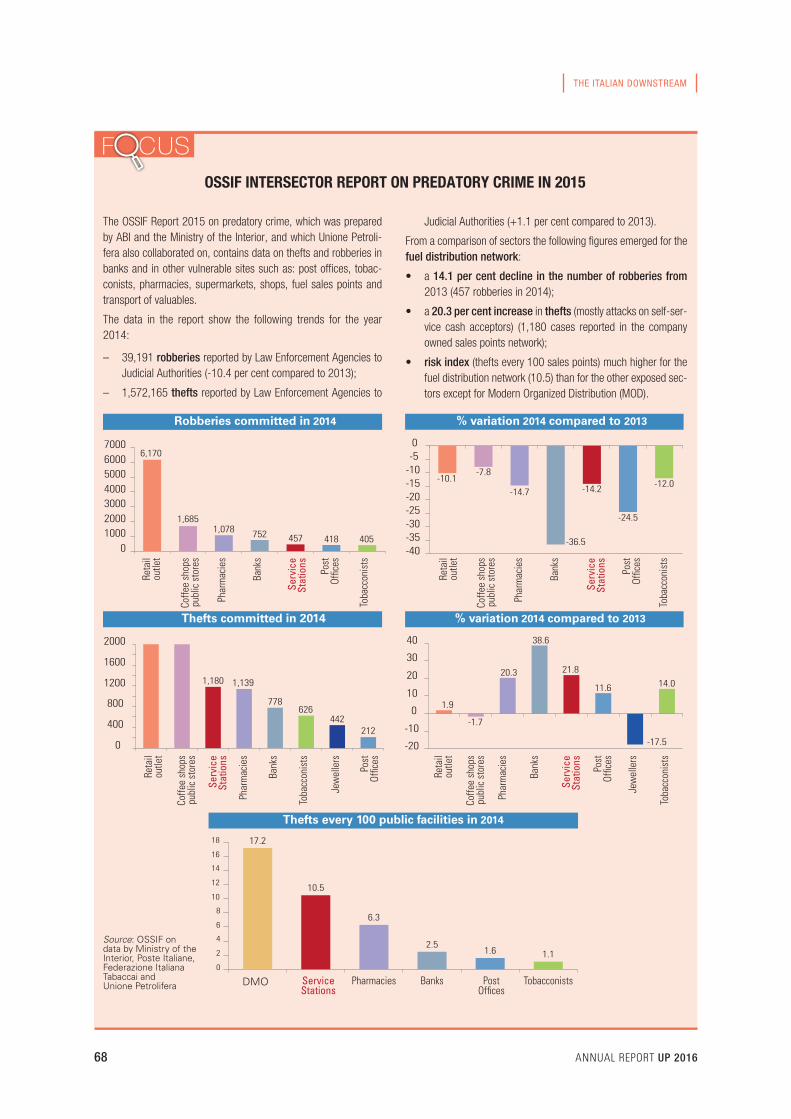
THE ITALIAN DOWNSTREAM
68 ANNUAL REPORT UP 2016
The OSSIF Report 2015 on predatory crime, which was prepared by ABI and the Ministry of the Interior, and which Unione Petroli-fera also collaborated on, contains data on thefts and robberies in banks and in other vulnerable sites such as: post offices, tobac-conists, pharmacies, supermarkets, shops, fuel sales points and transport of valuables.
The data in the report show the following trends for the year 2014:
– 39,191 robberies reported by Law Enforcement Agencies to Judicial Authorities (-10.4 per cent compared to 2013);
– 1,572,165 thefts reported by Law Enforcement Agencies to
Judicial Authorities (+1.1 per cent compared to 2013).
From a comparison of sectors the following figures emerged for the fuel distribution network:
• a 14.1 per cent decline in the number of robberies from 2013 (457 robberies in 2014);
• a 20.3 per cent increase in thefts (mostly attacks on self-ser-vice cash acceptors) (1,180 cases reported in the company owned sales points network);
• risk index (thefts every 100 sales points) much higher for the fuel distribution network (10.5) than for the other exposed sec-tors except for Modern Organized Distribution (MOD).
OSSIF INTERSECTOR REPORT ON PREDATORY CRIME IN 2015
Robberies committed in 2014 % variation 2014 compared to 2013
Thefts committed in 2014 % variation 2014 compared to 2013
Source: OSSIF on data by Ministry of the Interior, Poste Italiane,Federazione Italiana Tabaccai and Unione Petrolifera
Thefts every 100 public facilities in 2014
DMO Pharmacies Banks PostOffices
ServiceStations
Tobacconists0
2
4
6
8
10
12
14
16
18 17.2
10.5
6.3
2.51.6 1.1
-20
-10
0
10
20
30
40
1.9
-1.7
20.3
38.6
21.8
11.6
-17.5
14.0
Reta
ilou
tlet
Coffe
e sh
ops
publ
ic s
tore
s
Bank
s
Serv
ice
Stat
ions
Toba
ccon
ists
Phar
mac
ies
Post
Offic
es
Jew
elle
rs
Reta
ilou
tlet
Coffe
e sh
ops
publ
ic s
tore
s
Phar
mac
ies
Bank
s
Post
Offic
es
Serv
ice
Stat
ions
Toba
ccon
ists
Jew
elle
rs
0
400
800
1200
1600
2000
1,180 1,139
778626
442212
Reta
ilou
tlet
Coffe
e sh
ops
publ
ic s
tore
s
Phar
mac
ies
Bank
s
Serv
ice
Stat
ions
Post
Offic
es
Toba
ccon
ists
01000200030004000500060007000
6,170
1,6851,078 752 457 418 405
-40-35-30-25-20-15-10-50
-10.1-7.8
-14.7
-36.5
-14.2
-24.5
-12.0
Reta
ilou
tlet
Coffe
e sh
ops
publ
ic s
tore
s
Phar
mac
ies
Bank
s
Serv
ice
Stat
ions
Post
Offic
es
Toba
ccon
ists
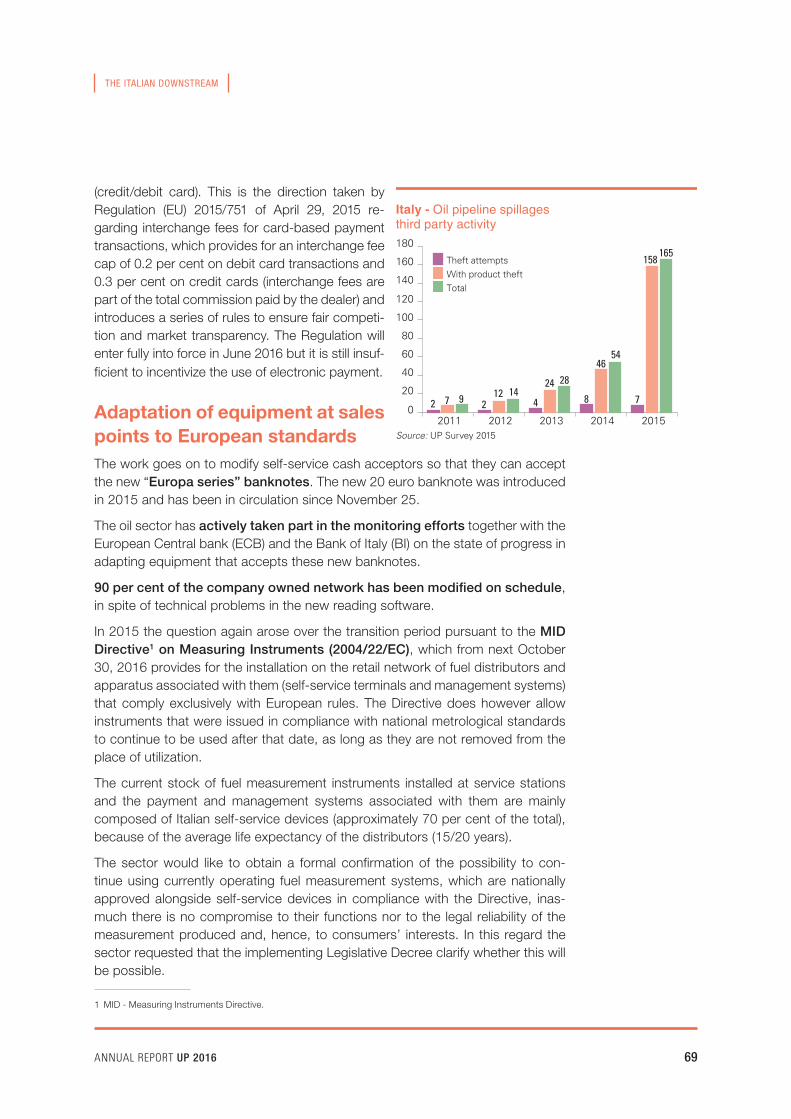
THE ITALIAN DOWNSTREAM
ANNUAL REPORT UP 2016 69
Italy - Oil pipeline spillagesthird party activity
2011 2012 2013 2014 20150
20
40
60
80
100
120
140
160
180
2 7 9 2 4
24 28
8
46
7
158165
1412
54
Theft attemptsWith product theftTotal
Source: UP Survey 2015
(credit/debit card). This is the direction taken by Regulation (EU) 2015/751 of April 29, 2015 re-garding interchange fees for card-based payment transactions, which provides for an interchange fee cap of 0.2 per cent on debit card transactions and 0.3 per cent on credit cards (interchange fees are part of the total commission paid by the dealer) and introduces a series of rules to ensure fair competi-tion and market transparency. The Regulation will enter fully into force in June 2016 but it is still insuf-ficient to incentivize the use of electronic payment.
Adaptation of equipment at sales points to European standardsThe work goes on to modify self-service cash acceptors so that they can accept the new “Europa series” banknotes. The new 20 euro banknote was introduced in 2015 and has been in circulation since November 25.
The oil sector has actively taken part in the monitoring efforts together with the European Central bank (ECB) and the Bank of Italy (BI) on the state of progress in adapting equipment that accepts these new banknotes.
90 per cent of the company owned network has been modified on schedule, in spite of technical problems in the new reading software.
In 2015 the question again arose over the transition period pursuant to the MID Directive1 on Measuring Instruments (2004/22/EC), which from next October 30, 2016 provides for the installation on the retail network of fuel distributors and apparatus associated with them (self-service terminals and management systems) that comply exclusively with European rules. The Directive does however allow instruments that were issued in compliance with national metrological standards to continue to be used after that date, as long as they are not removed from the place of utilization.
The current stock of fuel measurement instruments installed at service stations and the payment and management systems associated with them are mainly composed of Italian self-service devices (approximately 70 per cent of the total), because of the average life expectancy of the distributors (15/20 years).
The sector would like to obtain a formal confirmation of the possibility to con-tinue using currently operating fuel measurement systems, which are nationally approved alongside self-service devices in compliance with the Directive, inas-much there is no compromise to their functions nor to the legal reliability of the measurement produced and, hence, to consumers’ interests. In this regard the sector requested that the implementing Legislative Decree clarify whether this will be possible.
1 MID - Measuring Instruments Directive.
THE ITALIAN DOWNSTREAM
70 ANNUAL REPORT UP 2016
Road haulage: after the judgment by the European Court of JusticeFollowing the Sentence of the European Court of Justice issued in September 2014 overturning Italian legislation on haulage, a series of measures were made that radically changed the legislative environment in which the players are operating.
Law n. 190/20141 and the Sentence of the TAR of Latium of February 20, 2015 restored the principle of the autonomous negotiation between contracting parties when determining the price of haulage services. The only function the Ministry of Infrastructures and Transport continues to retain on this issue is the power to pub-lish “suggested reference figures of hauliers’ operating costs for third parties”. The numbers are updated monthly online and specifically refer to the cost of diesel for hauliers. The problem however remains that this publication might in the future be used for a surreptitious reintroduction of minimum costs.
Port ReformOf great current and strategic interest for Italy was the reform of the port and logistic system, which was launched during 2015. With the aim of stimulating growth in the traffic of freight and passengers, with particular attention to multi-modality, the “Unblock Italy” Decree2 known as “Sblocca Italia” (Law n. 164/2014) delegated authority to the President of the Council of Ministers to issue a Decree of the President of the Republic containing a Strategic Plan for Ports and Logistics.
The Plan was approved in August 2015 and defines a strategy of actions. It is based on an analysis of the current situation in ports understood as “exchange gateways for territorial economic-productive systems and consumptions”, of trends in traffic demand, of supply in terms of available infrastructure and services, of ad-ministrative problems and inspections.
The decision to define a set of new port strategies for Italy was also welcomed by the business world, which agrees with the need to create an integrated and mul-timodal system of infrastructure, to simplify dredging and excavating procedures, to improve and streamline inspections, especially in the area of customs and health.
Following the Region Campania’a appeal against the Plan, the Constitutional Court, with Sentence n. 261/2015, declared the delegatory measure issued to the Gov-ernment to be illegitimate, since it did not require a review by the Conference of State-Regions. The Government however believes this problem can be overcome, as the overlying structure of the delegatory measure is intact.
In relation to the question of port governance, the Plan calls for the establishment of a Port Systems Authority, whose creation, in replacement of the current Port
1 Measures for the statement of the State’s annual and multi-year budget (Stability Law 2015).
2 Converted into Law with amendments by Decree-law of September 12, 2014, n.133 containing urgent measures for the opening of construction sites, the creation of public works, the digitalization of the Country, administrative simplifications, the emergency of hydrogeological instability and to encourage the recovery of productive activi-ties.
THE ITALIAN DOWNSTREAM
ANNUAL REPORT UP 2016 71
Authorities, is the object of a draft Legislative Decree, which received a preliminary approval by the Council of Ministers in December 2015, on the basis of the deleg-atory authority pursuant to the so-called “Legge Madia” (Law n. 124/20151), which was submitted to review by the unified Conference of State-Regions which gave its go ahead after making a few observations last March 31. The opinion of the Parlia-mentary Commissions is still being awaited.
While in its current version, the outlined Legislative Decree significantly restruc-tures the national port system it does not appear to be incisive enough to effec-tively restore the sector’s competitiveness.
On the contrary, the creation of publicly appointed offices and the exclusion of stakeholders, who are relegated to an advisory role on a few questions, is reason for considerable concern. The 15 Authorities provided for in the Plan would be structured on a pyramidal model centred on the plenipotentiary figure of the President, appointed by the Ministry.
The strategy lines, ought rather to be decided at a national level, by a table com-posed of the individual Presidents of the Port Authorities and of the Ministry of Infrastructure and Transport.
The only positive feature is the establishment of an Administrative single window and a single window for Customs and Inspections located at every Port System Authority, with the aim of streamlining procedures, but whose real effective-ness will have to be evaluated over time.
Moreover, the Legislative Decree does not intervene on the regulations regarding the concession of State owned areas and docks, whose criteria based on Law n. 84/19842 should be dealt with by a specific Interministerial Decree, whose con-tents are not yet known, but which it is hoped will take into due consideration the strategic importance of oil logistics in supplying Italy’s energy needs and a sufficient level of planned investments.
Compulsory stocks: changes in the lawand implementationItalian operators pointed out several times the rigidities of national law with re-gard to foreign held stocks and this drew the attention of the European Union, which issued an Infringement Procedure n. 4014/2015 against Italy.
This intervention by the European Union led the Italian Government to amend Leg-islative Decree n. 249/20123 through the measure known as “European Law 2014” (Law n. 115/2015), which provided the possibility for those operators under stockholding obligations to maintain at least 30 per cent of their total stocks abroad at their own expense, regardless of whether the stocks are products or “any oil”. This flexibility was increased in the annual Decree that determines the
1 Proxy to the Government on the issue of reorganizing the Public Administrations.
2 Revision of legislation concerning ports.
3 Implementation of Directive 2009/119/EC, which obliges member States to maintain a minimum quantity of stocks of crude oil and/or oil products.
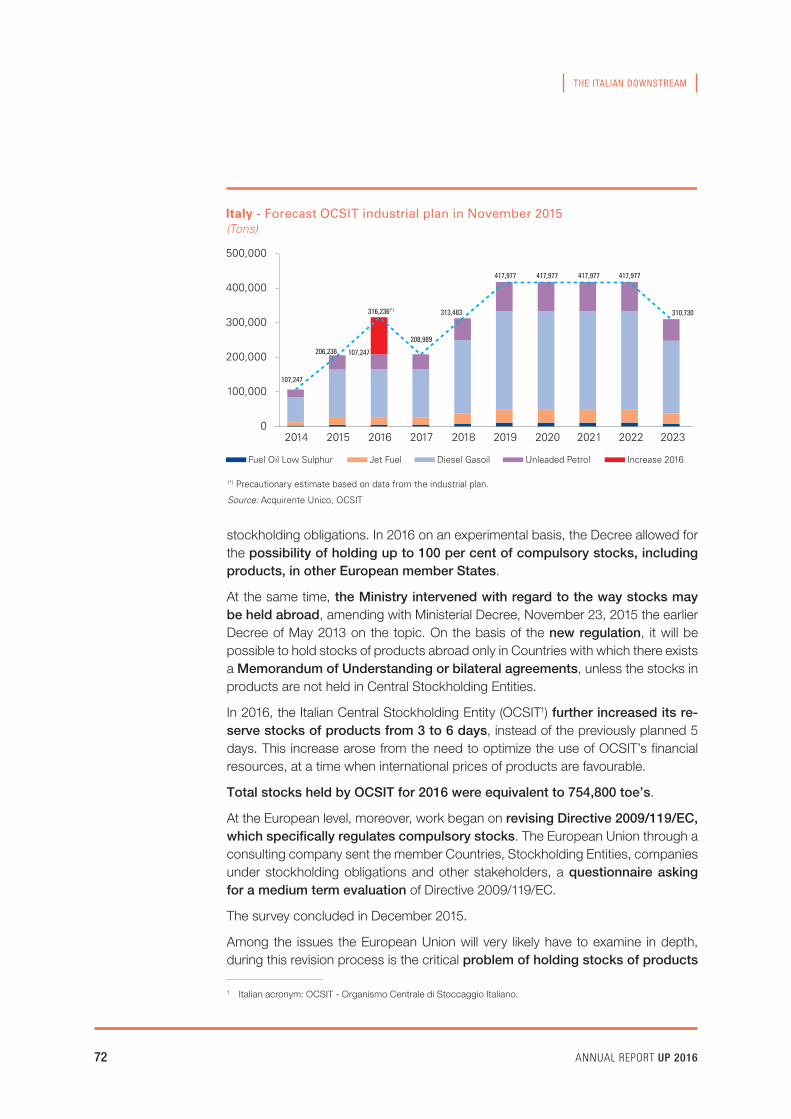
THE ITALIAN DOWNSTREAM
72 ANNUAL REPORT UP 2016
stockholding obligations. In 2016 on an experimental basis, the Decree allowed for the possibility of holding up to 100 per cent of compulsory stocks, including products, in other European member States.
At the same time, the Ministry intervened with regard to the way stocks may be held abroad, amending with Ministerial Decree, November 23, 2015 the earlier Decree of May 2013 on the topic. On the basis of the new regulation, it will be possible to hold stocks of products abroad only in Countries with which there exists a Memorandum of Understanding or bilateral agreements, unless the stocks in products are not held in Central Stockholding Entities.
In 2016, the Italian Central Stockholding Entity (OCSIT1) further increased its re-serve stocks of products from 3 to 6 days, instead of the previously planned 5 days. This increase arose from the need to optimize the use of OCSIT’s financial resources, at a time when international prices of products are favourable.
Total stocks held by OCSIT for 2016 were equivalent to 754,800 toe’s.
At the European level, moreover, work began on revising Directive 2009/119/EC, which specifically regulates compulsory stocks. The European Union through a consulting company sent the member Countries, Stockholding Entities, companies under stockholding obligations and other stakeholders, a questionnaire asking for a medium term evaluation of Directive 2009/119/EC.
The survey concluded in December 2015.
Among the issues the European Union will very likely have to examine in depth, during this revision process is the critical problem of holding stocks of products
1 Italian acronym: OCSIT - Organismo Centrale di Stoccaggio Italiano.
107,247
107,247
206,236
316,236(*)
208,989
417,977 417,977 417,977 417,977
0
100,000
200,000
300,000
400,000
500,000
2014 2015 2016 2017 2018 2019 2020 2021 2022 2023
313,483 310,730
Fuel Oil Low Sulphur Jet Fuel Diesel Gasoil Unleaded Petrol Increase 2016
(*) Precautionary estimate based on data from the industrial plan.
Source: Acquirente Unico, OCSIT
Italy - Forecast OCSIT industrial plan in November 2015(Tons)
THE ITALIAN DOWNSTREAM
ANNUAL REPORT UP 2016 73
also of secondary importance, like Petroleum Coke, and whether to use a stand-ardized model for the Memorandum of Understanding (MoU).
Still with regard to the implementation of this Legislative Decree n. 249/2012, the GME1’s annual survey of existing stockholding capacities and their reception and dispatch infrastructures is now going on regularly.
Consultations also proceeded with the aim of finalizing the Oil Logistics Market Platform, that brings together supply and demand of storage, as well as the wholesale oil product Platform, which is a venue for supply and demand of wholesale oil products and also extended to biofuels. These platforms are to be set up at the GME.
With the aim of promoting the use of these Platforms before their approval, Unione Petrolifera expressed the need for the GME to obtain a prior evaluation by the Antitrust Authority (AGCM2) on whether the Platforms will be in compliance with antitrust regulations.
The consultations with the GME and the Ministry of Economic Development were also aimed at defining the methods used to measure available stockholding and transit capacity, whose implementation will require the complex activities in warehouses adapt themselves in spite of the uncertainties of the rules.
1 Italian acronym: GME - Gestore Mercati Energetici.
2 Italian acronym: AGCM – Autorità Garante della Concorrenza e del Mercato. Italian Competition Authority.
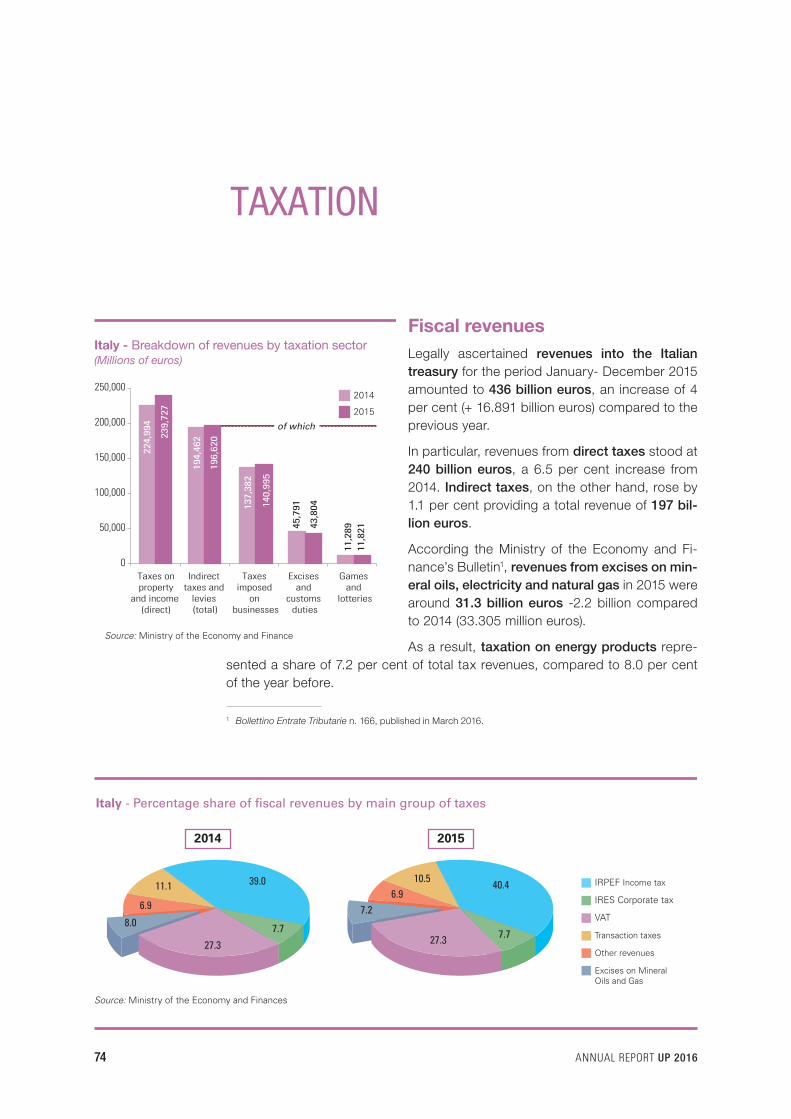
TAXATION
74 ANNUAL REPORT UP 2016
Fiscal revenuesLegally ascertained revenues into the Italian treasury for the period January- December 2015 amounted to 436 billion euros, an increase of 4 per cent (+ 16.891 billion euros) compared to the previous year.
In particular, revenues from direct taxes stood at 240 billion euros, a 6.5 per cent increase from 2014. Indirect taxes, on the other hand, rose by 1.1 per cent providing a total revenue of 197 bil-lion euros.
According the Ministry of the Economy and Fi-nance’s Bulletin1, revenues from excises on min-eral oils, electricity and natural gas in 2015 were around 31.3 billion euros -2.2 billion compared to 2014 (33.305 million euros).
As a result, taxation on energy products repre-sented a share of 7.2 per cent of total tax revenues, compared to 8.0 per cent of the year before.
1 Bollettino Entrate Tributarie n. 166, published in March 2016.
Source: Ministry of the Economy and Finance
Taxes onproperty
and income (direct)
Indirect taxes and
levies (total)
Taxes imposed
on businesses
Excises and
customs duties
Games and
lotteries
0
50,000
100,000
150,000
200,000
250,0002014
2015
224
,994
239
,727
194,
462
196
,620
137,
382
140
,995
45,
791
43,
804
11,8
2111
,289
of which
Italy - Breakdown of revenues by taxation sector(Millions of euros)
Source: Ministry of the Economy and Finances
Italy - Percentage share of fiscal revenues by main group of taxes
7.7
40.46.9
10.5
7.2
27.3
11.1 39.0
7.7
27.3
8.0
6.9
20152014
Excises on Mineral Oils and Gas
Other revenues
Transaction taxes
IRES Corporate tax
VAT
IRPEF Income tax
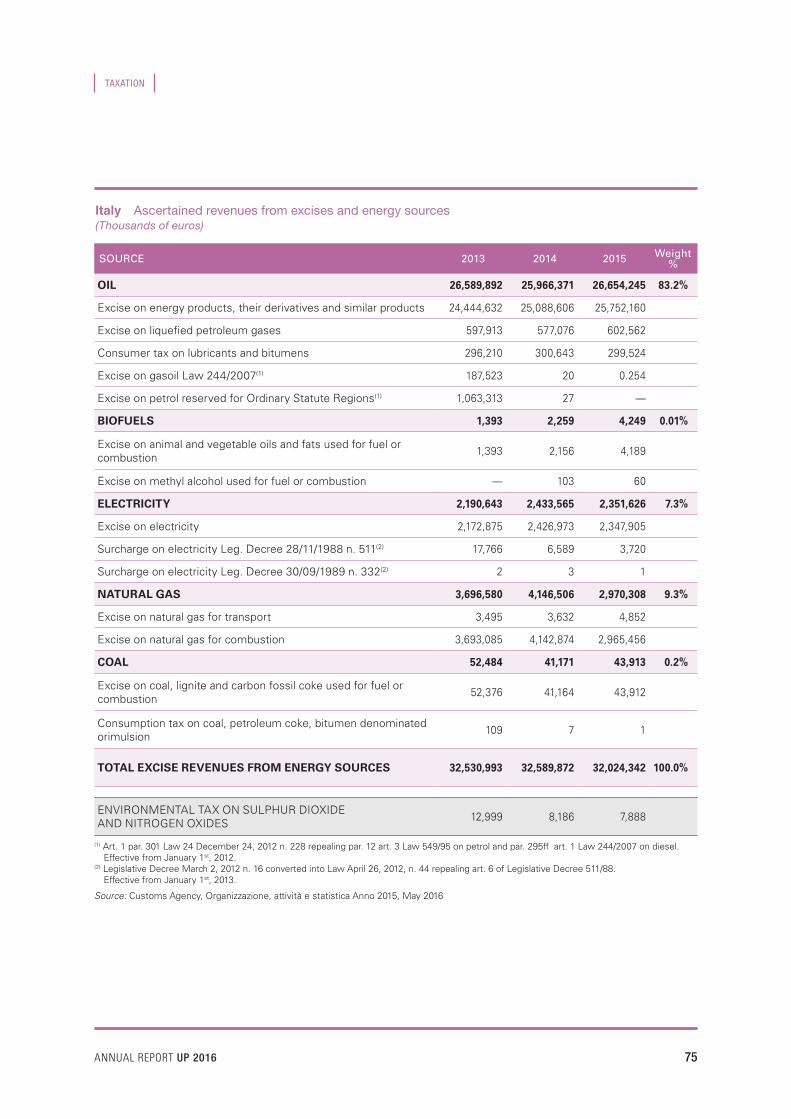
TAXATION
ANNUAL REPORT UP 2016 75
Italy Ascertained revenues from excises and energy sources(Thousands of euros)
SOURCE 2013 2014 2015 Weight%
OIL 26,589,892 25,966,371 26,654,245 83.2%
Excise on energy products, their derivatives and similar products 24,444,632 25,088,606 25,752,160
Excise on liquefied petroleum gases 597,913 577,076 602,562
Consumer tax on lubricants and bitumens 296,210 300,643 299,524
Excise on gasoil Law 244/2007(1) 187,523 20 0.254
Excise on petrol reserved for Ordinary Statute Regions(1) 1,063,313 27 —
BIOFUELS 1,393 2,259 4,249 0.01%
Excise on animal and vegetable oils and fats used for fuel or combustion 1,393 2,156 4,189
Excise on methyl alcohol used for fuel or combustion — 103 60
ELECTRICITY 2,190,643 2,433,565 2,351,626 7.3%
Excise on electricity 2,172,875 2,426,973 2,347,905
Surcharge on electricity Leg. Decree 28/11/1988 n. 511(2) 17,766 6,589 3,720
Surcharge on electricity Leg. Decree 30/09/1989 n. 332(2) 2 3 1
NATURAL GAS 3,696,580 4,146,506 2,970,308 9.3%
Excise on natural gas for transport 3,495 3,632 4,852
Excise on natural gas for combustion 3,693,085 4,142,874 2,965,456
COAL 52,484 41,171 43,913 0.2%
Excise on coal, lignite and carbon fossil coke used for fuel or combustion 52,376 41,164 43,912
Consumption tax on coal, petroleum coke, bitumen denominated orimulsion 109 7 1
TOTAL EXCISE REVENUES FROM ENERGY SOURCES 32,530,993 32,589,872 32,024,342 100.0%
ENVIRONMENTAL TAX ON SULPHUR DIOXIDE AND NITROGEN OXIDES 12,999 8,186 7,888
(1) Art. 1 par. 301 Law 24 December 24, 2012 n. 228 repealing par. 12 art. 3 Law 549/95 on petrol and par. 295ff art. 1 Law 244/2007 on diesel. Effective from January 1st, 2012.(2) Legislative Decree March 2, 2012 n. 16 converted into Law April 26, 2012, n. 44 repealing art. 6 of Legislative Decree 511/88. Effective from January 1st, 2013.
Source: Customs Agency, Organizzazione, attività e statistica Anno 2015, May 2016
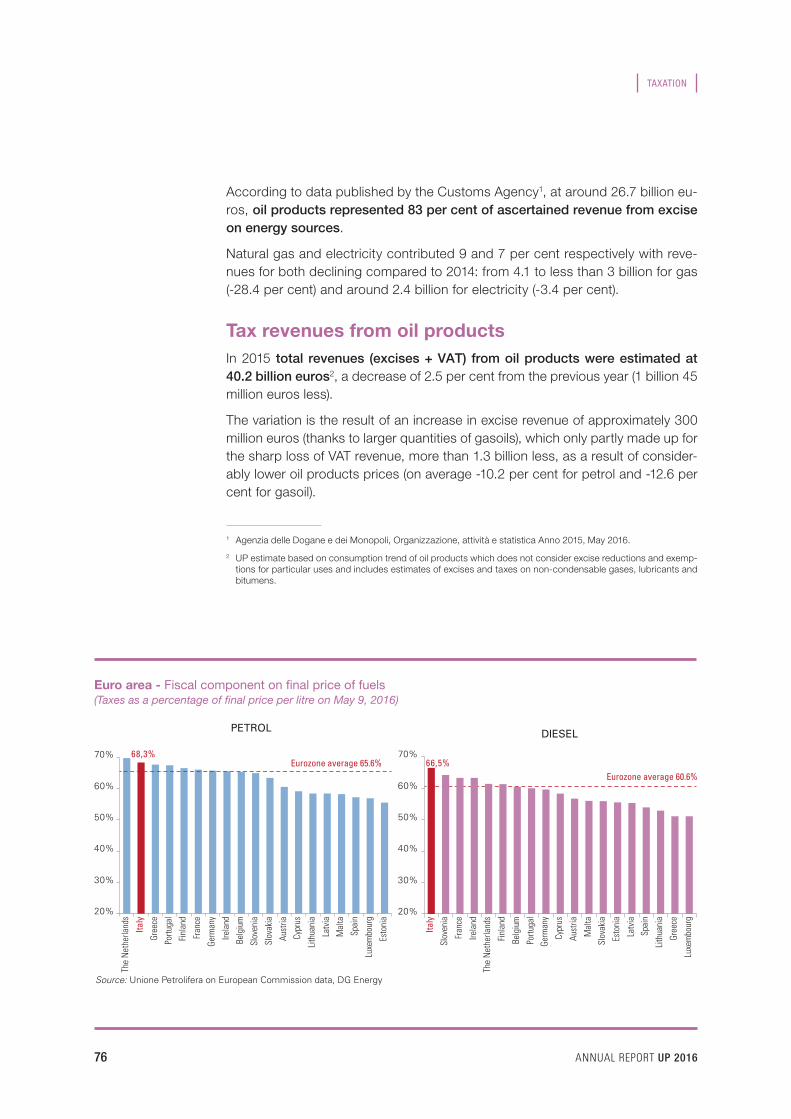
TAXATION
76 ANNUAL REPORT UP 2016
According to data published by the Customs Agency1, at around 26.7 billion eu-ros, oil products represented 83 per cent of ascertained revenue from excise on energy sources.
Natural gas and electricity contributed 9 and 7 per cent respectively with reve-nues for both declining compared to 2014: from 4.1 to less than 3 billion for gas (-28.4 per cent) and around 2.4 billion for electricity (-3.4 per cent).
Tax revenues from oil productsIn 2015 total revenues (excises + VAT) from oil products were estimated at 40.2 billion euros2, a decrease of 2.5 per cent from the previous year (1 billion 45 million euros less).
The variation is the result of an increase in excise revenue of approximately 300 million euros (thanks to larger quantities of gasoils), which only partly made up for the sharp loss of VAT revenue, more than 1.3 billion less, as a result of consider-ably lower oil products prices (on average -10.2 per cent for petrol and -12.6 per cent for gasoil).
1 Agenzia delle Dogane e dei Monopoli, Organizzazione, attività e statistica Anno 2015, May 2016.
2 UP estimate based on consumption trend of oil products which does not consider excise reductions and exemp-tions for particular uses and includes estimates of excises and taxes on non-condensable gases, lubricants and bitumens.
Source: Unione Petrolifera on European Commission data, DG Energy
Euro area - Fiscal component on �nal price of fuels (Taxes as a percentage of �nal price per litre on May 9, 2016)
The
Net
herla
nds
Italy
Gree
ce
Portu
gal
Finl
and
Fran
ce
Germ
any
Irela
nd
Belg
ium
Slov
enia
Slov
akia
Aust
ria
Cypr
us
Lith
uani
a
Latv
ia
Mal
ta
Spai
n
Luxe
mbo
urg
Esto
nia
20%
30%
40%
50%
60%
70%
PETROL
Eurozone average 65.6%68,3%
Eurozone average 60.6%
Italy
Slov
enia
Fran
ce
Irela
nd
The
Net
herla
nds
Finl
and
Belg
ium
Portu
gal
Germ
any
Cypr
us
Aust
ria
Mal
ta
Slov
akia
Esto
nia
Latv
ia
Spai
n
Lith
uani
a
Gree
ce
Luxe
mbo
urg
20%
30%
40%
50%
60%
70%
DIESEL
66,5%
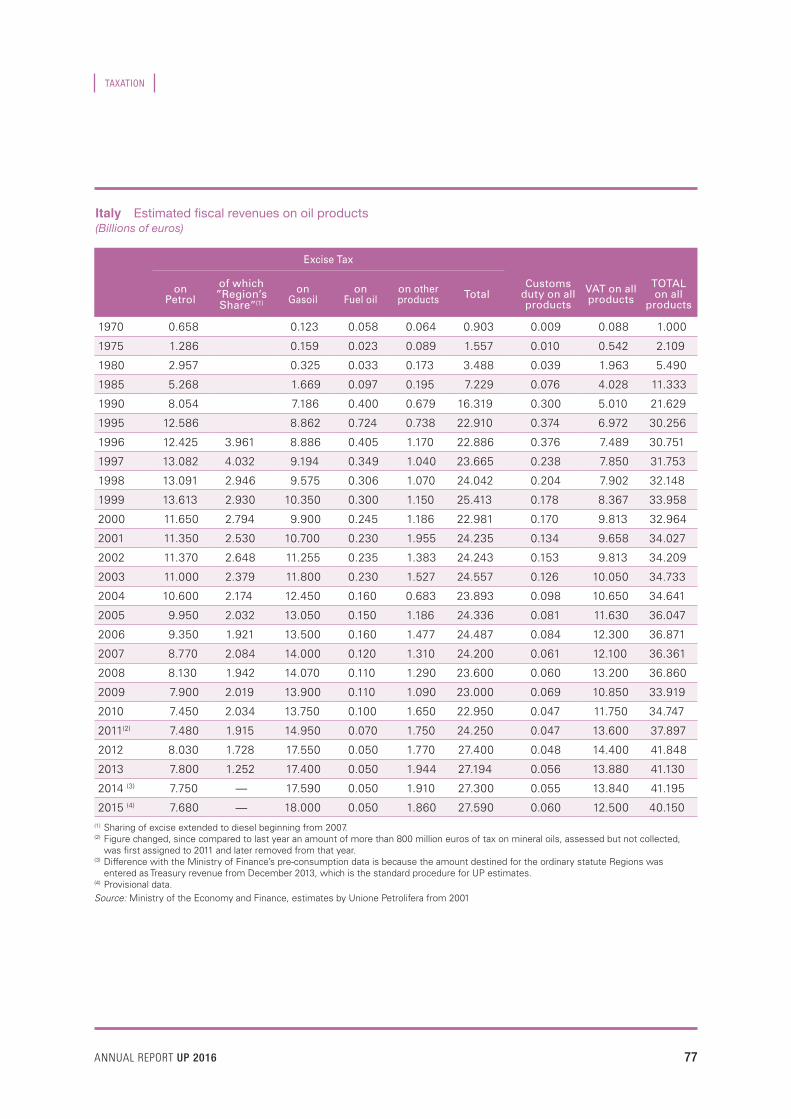
TAXATION
ANNUAL REPORT UP 2016 77
Italy Estimated fiscal revenues on oil products(Billions of euros)
Excise Tax
onPetrol
of which”Region’sShare”(1)
on Gasoil
on Fuel oil
on otherproducts Total
Customs duty on allproducts
VAT on allproducts
TOTALon all
products
1970 0.658 0.123 0.058 0.064 0.903 0.009 0.088 1.000
1975 1.286 0.159 0.023 0.089 1.557 0.010 0.542 2.109
1980 2.957 0.325 0.033 0.173 3.488 0.039 1.963 5.490
1985 5.268 1.669 0.097 0.195 7.229 0.076 4.028 11.333
1990 8.054 7.186 0.400 0.679 16.319 0.300 5.010 21.629
1995 12.586 8.862 0.724 0.738 22.910 0.374 6.972 30.256
1996 12.425 3.961 8.886 0.405 1.170 22.886 0.376 7.489 30.751
1997 13.082 4.032 9.194 0.349 1.040 23.665 0.238 7.850 31.753
1998 13.091 2.946 9.575 0.306 1.070 24.042 0.204 7.902 32.148
1999 13.613 2.930 10.350 0.300 1.150 25.413 0.178 8.367 33.958
2000 11.650 2.794 9.900 0.245 1.186 22.981 0.170 9.813 32.964
2001 11.350 2.530 10.700 0.230 1.955 24.235 0.134 9.658 34.027
2002 11.370 2.648 11.255 0.235 1.383 24.243 0.153 9.813 34.209
2003 11.000 2.379 11.800 0.230 1.527 24.557 0.126 10.050 34.733
2004 10.600 2.174 12.450 0.160 0.683 23.893 0.098 10.650 34.641
2005 9.950 2.032 13.050 0.150 1.186 24.336 0.081 11.630 36.047
2006 9.350 1.921 13.500 0.160 1.477 24.487 0.084 12.300 36.871
2007 8.770 2.084 14.000 0.120 1.310 24.200 0.061 12.100 36.361
2008 8.130 1.942 14.070 0.110 1.290 23.600 0.060 13.200 36.860
2009 7.900 2.019 13.900 0.110 1.090 23.000 0.069 10.850 33.919
2010 7.450 2.034 13.750 0.100 1.650 22.950 0.047 11.750 34.747
2011(2) 7.480 1.915 14.950 0.070 1.750 24.250 0.047 13.600 37.897
2012 8.030 1.728 17.550 0.050 1.770 27.400 0.048 14.400 41.848
2013 7.800 1.252 17.400 0.050 1.944 27.194 0.056 13.880 41.130
2014 (3) 7.750 — 17.590 0.050 1.910 27.300 0.055 13.840 41.195
2015 (4) 7.680 — 18.000 0.050 1.860 27.590 0.060 12.500 40.150(1) Sharing of excise extended to diesel beginning from 2007.(2) Figure changed, since compared to last year an amount of more than 800 million euros of tax on mineral oils, assessed but not collected,
was first assigned to 2011 and later removed from that year.(3) Difference with the Ministry of Finance’s pre-consumption data is because the amount destined for the ordinary statute Regions was
entered as Treasury revenue from December 2013, which is the standard procedure for UP estimates.(4) Provisional data. Source: Ministry of the Economy and Finance, estimates by Unione Petrolifera from 2001
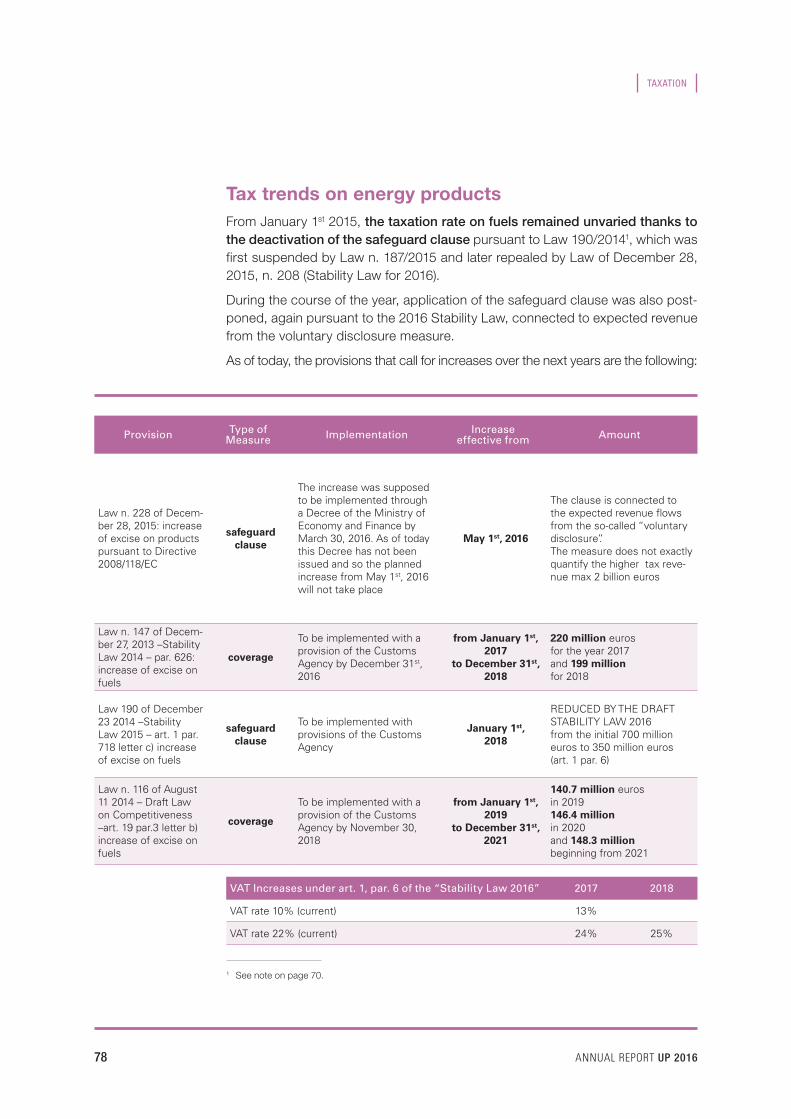
TAXATION
78 ANNUAL REPORT UP 2016
Tax trends on energy productsFrom January 1st 2015, the taxation rate on fuels remained unvaried thanks to the deactivation of the safeguard clause pursuant to Law 190/20141, which was first suspended by Law n. 187/2015 and later repealed by Law of December 28, 2015, n. 208 (Stability Law for 2016).
During the course of the year, application of the safeguard clause was also post-poned, again pursuant to the 2016 Stability Law, connected to expected revenue from the voluntary disclosure measure.
As of today, the provisions that call for increases over the next years are the following:
1 See note on page 70.
Provision Type of Measure Implementation Increase
effective from Amount
Law n. 228 of Decem-ber 28, 2015: increase of excise on products pursuant to Directive 2008/118/EC
safeguard clause
The increase was supposed to be implemented through a Decree of the Ministry of Economy and Finance by March 30, 2016. As of today this Decree has not been issued and so the planned increase from May 1st, 2016 will not take place
May 1st, 2016
The clause is connected to the expected revenue flows from the so-called “voluntary disclosure”. The measure does not exactly quantify the higher tax reve-nue max 2 billion euros
Law n. 147 of Decem-ber 27, 2013 –Stability Law 2014 – par. 626: increase of excise on fuels
coverage
To be implemented with a provision of the Customs Agency by December 31st, 2016
from January 1st, 2017
to December 31st, 2018
220 million euros for the year 2017and 199 million for 2018
Law 190 of December 23 2014 –Stability Law 2015 – art. 1 par. 718 letter c) increase of excise on fuels
safeguard clause
To be implemented with provisions of the Customs Agency
January 1st,2018
REDUCED BY THE DRAFT STABILITY LAW 2016from the initial 700 million euros to 350 million euros (art. 1 par. 6)
Law n. 116 of August 11 2014 – Draft Law on Competitiveness –art. 19 par.3 letter b) increase of excise on fuels
coverage
To be implemented with a provision of the Customs Agency by November 30, 2018
from January 1st, 2019
to December 31st, 2021
140.7 million euros in 2019146.4 million in 2020and 148.3 millionbeginning from 2021
VAT Increases under art. 1, par. 6 of the “Stability Law 2016” 2017 2018
VAT rate 10% (current) 13%
VAT rate 22% (current) 24% 25%
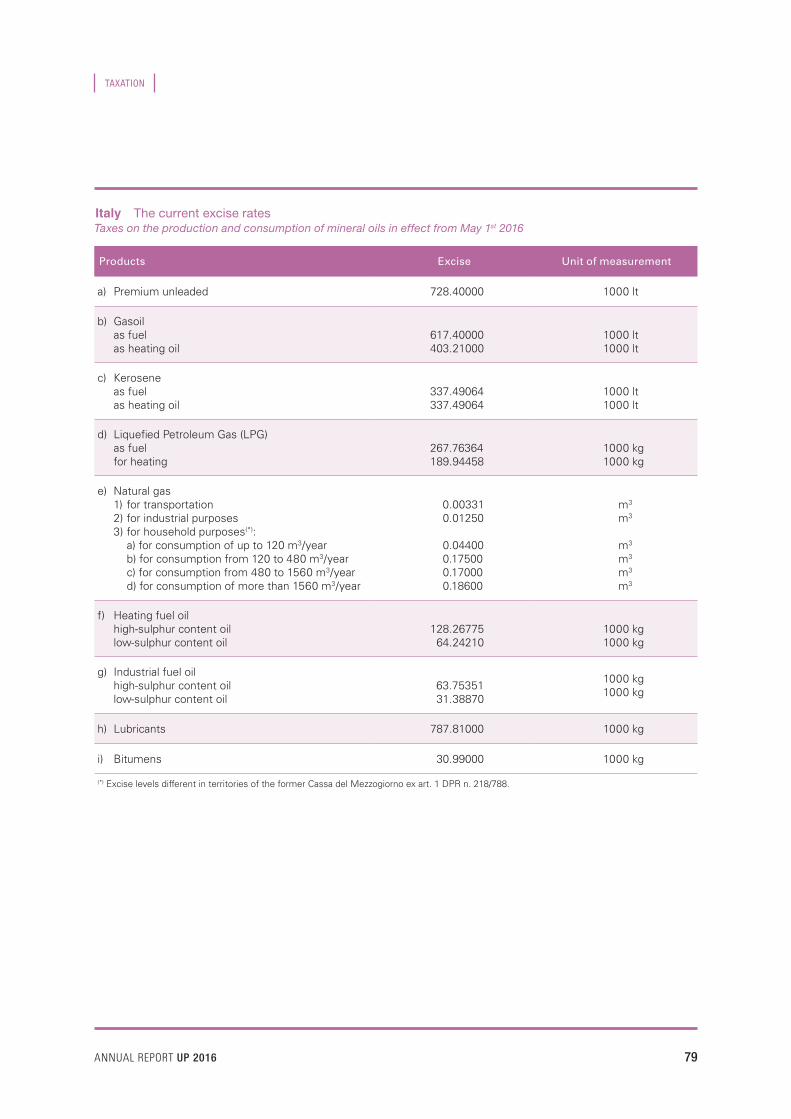
TAXATION
ANNUAL REPORT UP 2016 79
Italy The current excise ratesTaxes on the production and consumption of mineral oils in effect from May 1st 2016
Products Excise Unit of measurement
a) Premium unleaded 728.40000 1000 lt
b) Gasoil as fuel as heating oil
617.40000403.21000
1000 lt1000 lt
c) Kerosene as fuel as heating oil
337.49064337.49064
1000 lt1000 lt
d) Liquefied Petroleum Gas (LPG) as fuel for heating
267.76364189.94458
1000 kg1000 kg
e) Natural gas 1) for transportation 2) for industrial purposes 3) for household purposes(*): a) for consumption of up to 120 m3/year b) for consumption from 120 to 480 m3/year c) for consumption from 480 to 1560 m3/year d) for consumption of more than 1560 m3/year
0.003310.01250
0.044000.175000.170000.18600
m3
m3
m3
m3
m3
m3
f) Heating fuel oil high-sulphur content oil low-sulphur content oil
128.2677564.24210
1000 kg1000 kg
g) Industrial fuel oil high-sulphur content oil low-sulphur content oil
63.7535131.38870
1000 kg1000 kg
h) Lubricants 787.81000 1000 kg
i) Bitumens 30.99000 1000 kg
(*) Excise levels different in territories of the former Cassa del Mezzogiorno ex art. 1 DPR n. 218/788.
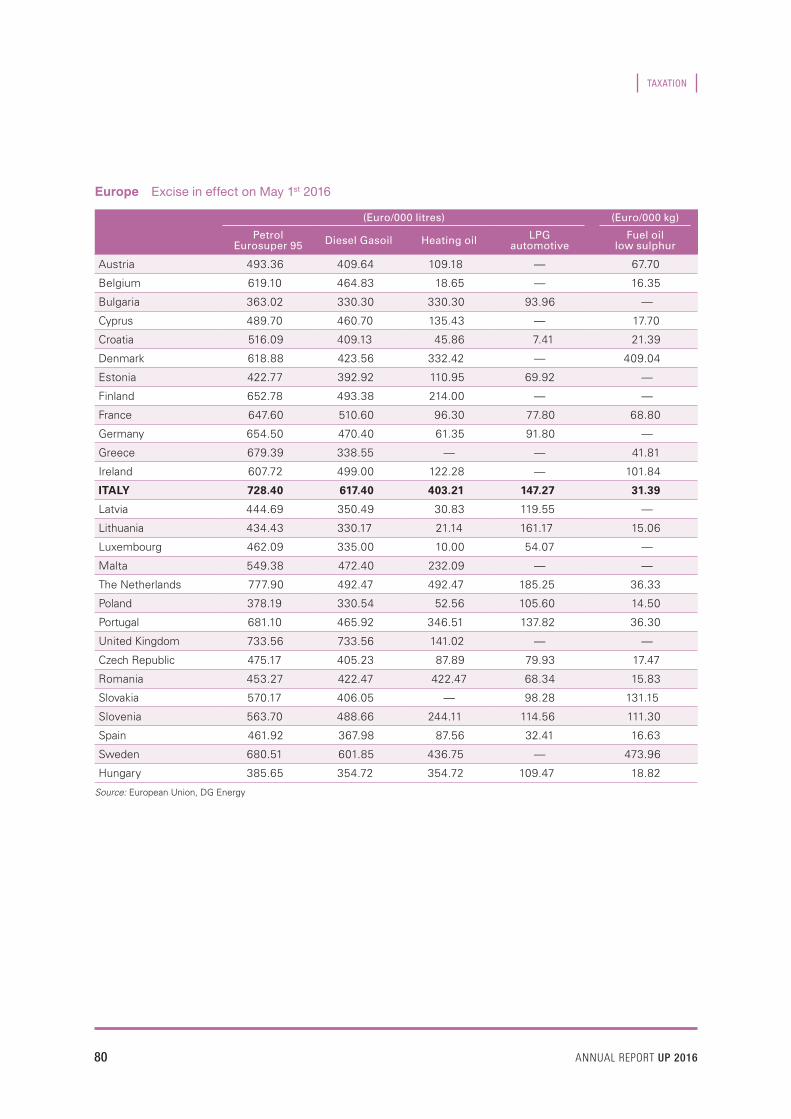
TAXATION
80 ANNUAL REPORT UP 2016
Europe Excise in effect on May 1st 2016
(Euro/000 litres) (Euro/000 kg)
Petrol Eurosuper 95 Diesel Gasoil Heating oil LPG
automotiveFuel oil
low sulphur
Austria 493.36 409.64 109.18 — 67.70
Belgium 619.10 464.83 18.65 — 16.35
Bulgaria 363.02 330.30 330.30 93.96 —
Cyprus 489.70 460.70 135.43 — 17.70
Croatia 516.09 409.13 45.86 7.41 21.39
Denmark 618.88 423.56 332.42 — 409.04
Estonia 422.77 392.92 110.95 69.92 —
Finland 652.78 493.38 214.00 — —
France 647.60 510.60 96.30 77.80 68.80
Germany 654.50 470.40 61.35 91.80 —
Greece 679.39 338.55 — — 41.81
Ireland 607.72 499.00 122.28 — 101.84
ITALY 728.40 617.40 403.21 147.27 31.39
Latvia 444.69 350.49 30.83 119.55 —
Lithuania 434.43 330.17 21.14 161.17 15.06
Luxembourg 462.09 335.00 10.00 54.07 —
Malta 549.38 472.40 232.09 — —
The Netherlands 777.90 492.47 492.47 185.25 36.33
Poland 378.19 330.54 52.56 105.60 14.50
Portugal 681.10 465.92 346.51 137.82 36.30
United Kingdom 733.56 733.56 141.02 — —
Czech Republic 475.17 405.23 87.89 79.93 17.47
Romania 453.27 422.47 422.47 68.34 15.83
Slovakia 570.17 406.05 — 98.28 131.15
Slovenia 563.70 488.66 244.11 114.56 111.30
Spain 461.92 367.98 87.56 32.41 16.63
Sweden 680.51 601.85 436.75 — 473.96
Hungary 385.65 354.72 354.72 109.47 18.82
Source: European Union, DG Energy
TAXATION
ANNUAL REPORT UP 2016 81
New fiscal developments in the 2016 Stability Law Article 1, paragraph 21 of the 2016 Stability Law introduced important new de-velopments with regard to determining cadastral revenues from urban prop-erties destined for special use and those destined for particular use as listed in the cadastral registry under category D (refineries and warehouses) and E (fuel distribution sales points E/3). The Law established which real estate facilities must be considered with a view to determining cadastral revenues.
In this regard, legislators established that for these categories of buildings, ma-chinery, devices and equipment specifically related to production process are to be excluded from the direct estimate. Indeed, as an example, the in-structions contained in Circular 2/E issued to the refineries by the Revenues Agency on February 1st, 2016, specifically refer to the exclusion of pre-heating furnaces, atmospheric and vacuum refining units and those used for conversion processes or product quality improvement, as well as to treatment units for flue gases and waste waters.
In addition, cadastral variations aimed at applying the measures under exam-ination must be submitted by June 15, 2016, in order to be effective for the purpose of reducing the taxable base for the determination of the Municipal Property Tax (IMU1).
Reduction of the IRES rate The IRES rate of 27.56 per cent will go down to 24 per cent on January 1st, 2017.
Super depreciation benefit
The 2016 Stability Law provided for the possibility of an extra depreciation ben-efit operating a cost re-evaluation equal to 140 per cent for investments in de-preciable assets carried out between October 15, 2015 and December 31, 2016.
The measure is aimed at incentivizing investments in new instrumental capital goods by increasing the percentage of the fiscally recognized cost of the assets themselves (140 per cent), in order to allow the deduction of higher amortization rates and finance leases to the taxable period for the purpose of determining IRES and IRPEF.
The benefit regards both purchased instrumental assets and those acquired through leasing.
1 Italian acronym: IMU - Imposta Municipale Unica.
TAXATION
82 ANNUAL REPORT UP 2016
Customs Agency’s circular on transit lossesWith circular 6/D of June 18, 2015 the Customs Agency provided important indi-cations in the area of fuel transit losses. In particular they regarded:
1) differences attributable to thermal variations, when transporting fuels on which excises have been paid, during commercial activities, are not fiscally justifiable for the purpose of reducing excise payments whenever these dif-ferences may be ascribed to variations occurring between the time of loading and unloading and to the precision limits of the measuring instrument.
Thus, without prejudice to the provisions of Legislative Decree 504/951, volu-metric variations of fuels subject to excises, which resulted from temperature changes during transportation, may not be cause for lower excise exaction nor do they affect the level of the excises already paid.
With regard to keeping the charge and discharge registry of fuel distribu-tion facilities, the Circular specified that during verifications at the abovemen-tioned facilities, the inspecting unit, for the purpose of correct record keeping, must necessarily take into account the total amount of discharges the com-panies enter in the registry, including all the discrepancies recorded, even if these exceed the permitted limits;
2) with regard to determining the difference between real quantities stored and accounting stocks in commercial gasoil warehouses the Circular clari-fies that the reference text to be used is article 50, paragraph 2 of Legislative Decree 504/95 (tolerance of 3 per thousand of quantities received) and not the figure given by Ministerial Decree 55/20002 (1 per cent in volume at 15 °C calculated on the effective days of storage);
3) the principle of presumption of acquisition does not apply for the purpose of applying VAT for energy products that exceed the declared quantity limits so that additional excises may not be recovered from them as established by Legislative Decree 441/973.
1 Single Text on Excises..
2 Regulation on the natural and technical losses of merchandise subject to customs duties and excise taxes.
3 Law containing provisions for the reorganization of rules on the presumption of cessions or acquisition.
OIL AND THEENVIRONMENT
ANNUAL REPORT UP 2016 83
The Paris Agreement (COP 21) and its impact on the sectorThe Agreement reached in Paris last December is aimed at strengthening global response to the threat of climate change and engages the international Commu-nity to limit the average increase of global temperature to below 2°C compared to pre-industrial levels. The Agreement has been variously defined as “historic, ambi-tious, fair, sustainable, dynamic, balanced and legally binding”.
Besides a commitment to containing land temperature increases to “well” below 2°C, the agreement also pledged to make every effort to limit this increase to a maximum of 1.5°C.
The reduction strategy is based on national commitments called “INDCs – Intended Nationally Determined Contributions”, or voluntary and specific commitments that each Country promised to reach. These commitments will be subject to review every 5 years with the first stocktaking set for 2023, but with no planned sanctions in case of non-compliance and without any rigorous mechanism to measure and control.
To take effect, the Agreement must be ratified by 55 per cent of the Parties repre-senting at least 55 per cent of global CO2 emissions and it will be open for the Par-ties to sign from April 21, 2016 until April 21, 2017. The hope is that zero net green-house gas emissions will be reached during the second half of the century.
The European Union played an important role in raising the bar in the Paris negotiations, confirming its own commitment to reduce its CO2 emissions in 2030 by 40 per cent compared to 1990 levels and to reach other targets on renewables and energy efficiency.
Nonetheless, according to studies of numerous research Institutes, even if all the Countries did their part based on voluntary commitments, this would not be enough to limit the temperature increase to 2°C, trusting, as it were, in the “good will” of individual States to further cut their emissions, in spite of the lack of sanctions in case targets are not met.
Given this situation, it should be mentioned that China, one of the Countries with the highest emissions with a share of 26 per cent, pledged to begin reducing emissions only after 2030, while India, having declared it would not renounce the use of coal, will not be in a position to make a significant contribution.
This again demonstrates the high degree of asymmetry characterising interna-tional competition, which ends up falling on the shoulders of the Countries of Europe who are called on to make greater efforts and bear most of the environmental costs.
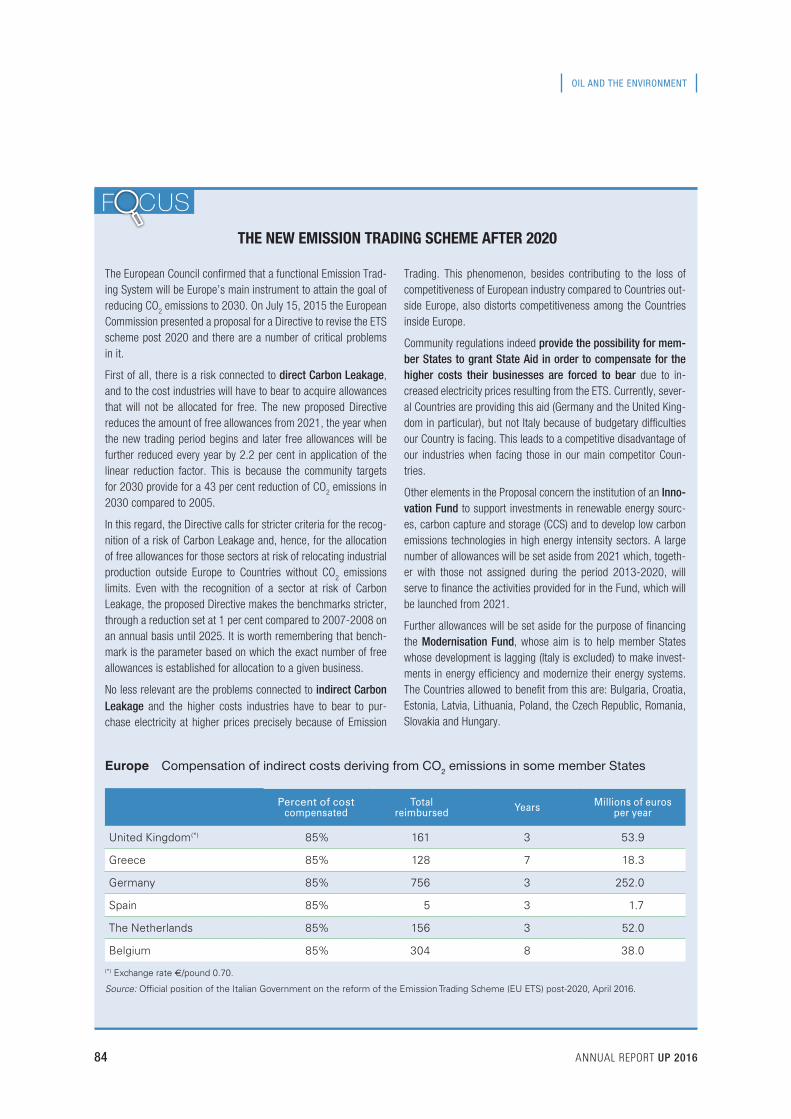
OIL AND THE ENVIRONMENT
84 ANNUAL REPORT UP 2016
The European Council confirmed that a functional Emission Trad-ing System will be Europe’s main instrument to attain the goal of reducing CO2 emissions to 2030. On July 15, 2015 the European Commission presented a proposal for a Directive to revise the ETS scheme post 2020 and there are a number of critical problems in it.
First of all, there is a risk connected to direct Carbon Leakage, and to the cost industries will have to bear to acquire allowances that will not be allocated for free. The new proposed Directive reduces the amount of free allowances from 2021, the year when the new trading period begins and later free allowances will be further reduced every year by 2.2 per cent in application of the linear reduction factor. This is because the community targets for 2030 provide for a 43 per cent reduction of CO2 emissions in 2030 compared to 2005.
In this regard, the Directive calls for stricter criteria for the recog-nition of a risk of Carbon Leakage and, hence, for the allocation of free allowances for those sectors at risk of relocating industrial production outside Europe to Countries without CO2 emissions limits. Even with the recognition of a sector at risk of Carbon Leakage, the proposed Directive makes the benchmarks stricter, through a reduction set at 1 per cent compared to 2007-2008 on an annual basis until 2025. It is worth remembering that bench-mark is the parameter based on which the exact number of free allowances is established for allocation to a given business.
No less relevant are the problems connected to indirect Carbon Leakage and the higher costs industries have to bear to pur-chase electricity at higher prices precisely because of Emission
Trading. This phenomenon, besides contributing to the loss of competitiveness of European industry compared to Countries out-side Europe, also distorts competitiveness among the Countries inside Europe.
Community regulations indeed provide the possibility for mem-ber States to grant State Aid in order to compensate for the higher costs their businesses are forced to bear due to in-creased electricity prices resulting from the ETS. Currently, sever-al Countries are providing this aid (Germany and the United King-dom in particular), but not Italy because of budgetary difficulties our Country is facing. This leads to a competitive disadvantage of our industries when facing those in our main competitor Coun-tries.
Other elements in the Proposal concern the institution of an Inno-vation Fund to support investments in renewable energy sourc-es, carbon capture and storage (CCS) and to develop low carbon emissions technologies in high energy intensity sectors. A large number of allowances will be set aside from 2021 which, togeth-er with those not assigned during the period 2013-2020, will serve to finance the activities provided for in the Fund, which will be launched from 2021.
Further allowances will be set aside for the purpose of financing the Modernisation Fund, whose aim is to help member States whose development is lagging (Italy is excluded) to make invest-ments in energy efficiency and modernize their energy systems. The Countries allowed to benefit from this are: Bulgaria, Croatia, Estonia, Latvia, Lithuania, Poland, the Czech Republic, Romania, Slovakia and Hungary.
THE NEW EMISSION TRADING SCHEME AFTER 2020
Europe Compensation of indirect costs deriving from CO2 emissions in some member States
Percent of cost compensated
Total reimbursed Years Millions of euros
per year
United Kingdom(*) 85% 161 3 53.9
Greece 85% 128 7 18.3
Germany 85% 756 3 252.0
Spain 85% 5 3 1.7
The Netherlands 85% 156 3 52.0
Belgium 85% 304 8 38.0
(*) Exchange rate €/pound 0.70.
Source: Official position of the Italian Government on the reform of the Emission Trading Scheme (EU ETS) post-2020, April 2016.
OIL AND THE ENVIRONMENT
ANNUAL REPORT UP 2016 85
Reform of the European Union“Emission Trading Scheme”
In 2015 the European Commission presented to the European Parliament and the Council proposed legislation to reform the ETS Directive for the period 2020-2030, intending it to be the main instrument to reach the target of at least a 40 per cent reduction of Green House Gas (GHG) emissions by 2030. The other contri-bution regards non-ETS sectors and will be realised by implementing the Effort Sharing Decision.
The reform of the Directive will concern fundamental aspects of the system’s func-tioning, including the definition of new measures for sectors at risk of Carbon Leakage, that is, the methodologies used to allocate free allowances, to compen-sate indirect costs, the destination of proceeds from auctions, the “opt-out” clause1 for small facilities. Many of these measures could give rise to critical problems for various industrial sectors, especially for refining.
Unione Petrolifera, along with Confindustria, is working actively with the Italian Gov-ernment in order to make a substantial revision of all those measures contained in the proposal, that could further compromise the competitiveness of Italian in-dustry without leading to any real environmental benefits. The commitments required of the refining sector could prove to be particularly burdensome and
1 “Opt-out” refers to the possibility for those who emit less than 25,000 tons of CO2 to exit from the ETS scheme.
On the proposed Directive for the reform of the Emission Trading System, the Italian Government recently officialised its position in which it formulates proposals to make changes to the Com-mission’s text, that are necessary to deal with the critical issues illustrated above.
On the question of direct Carbon Leakage, Italy is asking to change the revision criteria for the threshold between allowances to be auc-tioned and allowances allocated freely, in order to increase the latter while guaranteeing that they will be allocated to all the sectors at risk of Carbon Leakage during the fourth trading phase. In this regard, it is also asking that the benchmarks be revised on a realistic basis that reflects the real technological development of the sectors and is not based on pre-established reduction parameters. Still on the topic of allocation, it is asking for the elimination of the tran-sectoral reduction factor, the allocation of allowances based on the companies’ real production data and less stringent criteria for recog-nition of a sector exposed to the risk of Carbon Leakage.
With regard to indirect Carbon Leakage, Italy is asking for the
system compensating indirect costs to be replaced with a mecha-nism harmonized at the European level to avoid intra-European distortions of competitiveness. Finally, it asks that the Directive’s field of application be revised in order to simplify the Emission Trading Scheme and incentivize small emitters by fixing a quota below which they are excluded from the Directive (the figure being discussed is 50,000 tons of CO2 emitted).
The Italian Government’s position, by and large, reflects the views of the oil industry on this proposed measure, whose purpose ought to be to obtain the targeted reductions of CO2 emissions at 2030, at the lowest cost for the population and without creating unjustified burdens that would heavily penalise European in-dustry’s competitiveness in international markets.
In the coming months the proposed Directive will be discussed in the community Institutions (Council and Parliament) and defini-tive approval is expected to come during the course of 2017. It is hoped that on this occasion Italy’s position will be supported by most of the other member States.
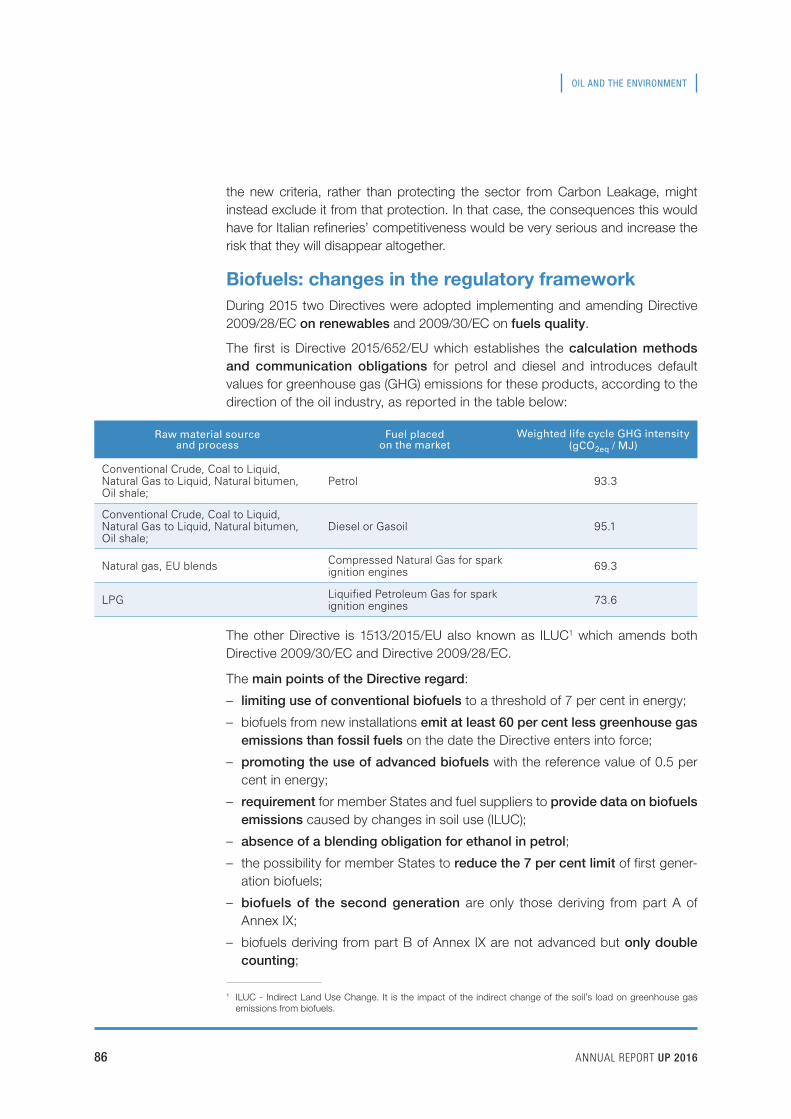
OIL AND THE ENVIRONMENT
86 ANNUAL REPORT UP 2016
the new criteria, rather than protecting the sector from Carbon Leakage, might instead exclude it from that protection. In that case, the consequences this would have for Italian refineries’ competitiveness would be very serious and increase the risk that they will disappear altogether.
Biofuels: changes in the regulatory frameworkDuring 2015 two Directives were adopted implementing and amending Directive 2009/28/EC on renewables and 2009/30/EC on fuels quality.
The first is Directive 2015/652/EU which establishes the calculation methods and communication obligations for petrol and diesel and introduces default values for greenhouse gas (GHG) emissions for these products, according to the direction of the oil industry, as reported in the table below:
The other Directive is 1513/2015/EU also known as ILUC1 which amends both Directive 2009/30/EC and Directive 2009/28/EC.
The main points of the Directive regard:
– limiting use of conventional biofuels to a threshold of 7 per cent in energy;
– biofuels from new installations emit at least 60 per cent less greenhouse gas emissions than fossil fuels on the date the Directive enters into force;
– promoting the use of advanced biofuels with the reference value of 0.5 per cent in energy;
– requirement for member States and fuel suppliers to provide data on biofuels emissions caused by changes in soil use (ILUC);
– absence of a blending obligation for ethanol in petrol;
– the possibility for member States to reduce the 7 per cent limit of first gener-ation biofuels;
– biofuels of the second generation are only those deriving from part A of Annex IX;
– biofuels deriving from part B of Annex IX are not advanced but only double counting;
1 ILUC - Indirect Land Use Change. It is the impact of the indirect change of the soil’s load on greenhouse gas emissions from biofuels.
Raw material source and process
Fuel placed on the market
Weighted life cycle GHG intensity (gCO2eq / MJ)
Conventional Crude, Coal to Liquid, Natural Gas to Liquid, Natural bitumen,Oil shale;
Petrol 93.3
Conventional Crude, Coal to Liquid, Natural Gas to Liquid, Natural bitumen,Oil shale;
Diesel or Gasoil 95.1
Natural gas, EU blends Compressed Natural Gas for spark ignition engines 69.3
LPG Liquified Petroleum Gas for spark ignition engines 73.6
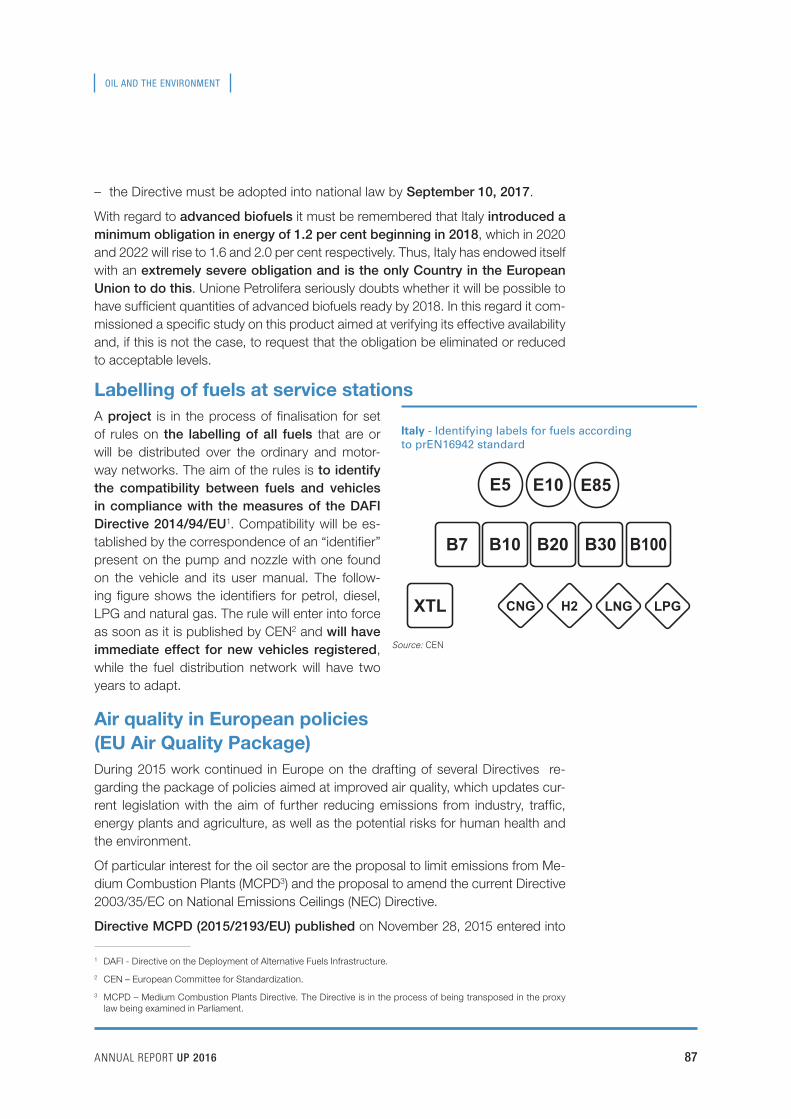
OIL AND THE ENVIRONMENT
ANNUAL REPORT UP 2016 87
– the Directive must be adopted into national law by September 10, 2017.
With regard to advanced biofuels it must be remembered that Italy introduced a minimum obligation in energy of 1.2 per cent beginning in 2018, which in 2020 and 2022 will rise to 1.6 and 2.0 per cent respectively. Thus, Italy has endowed itself with an extremely severe obligation and is the only Country in the European Union to do this. Unione Petrolifera seriously doubts whether it will be possible to have sufficient quantities of advanced biofuels ready by 2018. In this regard it com-missioned a specific study on this product aimed at verifying its effective availability and, if this is not the case, to request that the obligation be eliminated or reduced to acceptable levels.
Labelling of fuels at service stationsA project is in the process of finalisation for set of rules on the labelling of all fuels that are or will be distributed over the ordinary and motor-way networks. The aim of the rules is to identify the compatibility between fuels and vehicles in compliance with the measures of the DAFI Directive 2014/94/EU1. Compatibility will be es-tablished by the correspondence of an “identifier” present on the pump and nozzle with one found on the vehicle and its user manual. The follow-ing figure shows the identifiers for petrol, diesel, LPG and natural gas. The rule will enter into force as soon as it is published by CEN2 and will have immediate effect for new vehicles registered, while the fuel distribution network will have two years to adapt.
Air quality in European policies (EU Air Quality Package)During 2015 work continued in Europe on the drafting of several Directives re-garding the package of policies aimed at improved air quality, which updates cur-rent legislation with the aim of further reducing emissions from industry, traffic, energy plants and agriculture, as well as the potential risks for human health and the environment.
Of particular interest for the oil sector are the proposal to limit emissions from Me-dium Combustion Plants (MCPD3) and the proposal to amend the current Directive 2003/35/EC on National Emissions Ceilings (NEC) Directive.
Directive MCPD (2015/2193/EU) published on November 28, 2015 entered into
1 DAFI - Directive on the Deployment of Alternative Fuels Infrastructure.
2 CEN – European Committee for Standardization.
3 MCPD – Medium Combustion Plants Directive. The Directive is in the process of being transposed in the proxy law being examined in Parliament.
Source: CEN
Italy - Identifying labels for fuels according to prEN16942 standard
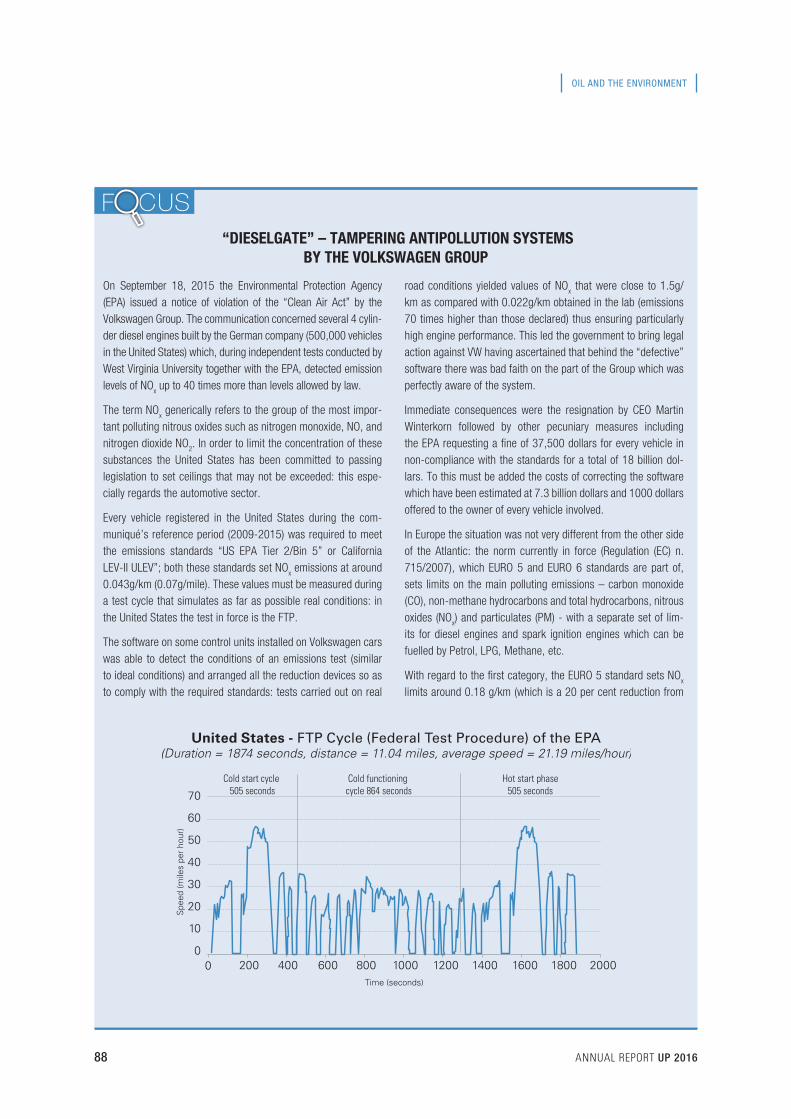
OIL AND THE ENVIRONMENT
88 ANNUAL REPORT UP 2016
“DIESELGATE” – TAMPERING ANTIPOLLUTION SYSTEMS BY THE VOLKSWAGEN GROUP
On September 18, 2015 the Environmental Protection Agency (EPA) issued a notice of violation of the “Clean Air Act” by the Volkswagen Group. The communication concerned several 4 cylin-der diesel engines built by the German company (500,000 vehicles in the United States) which, during independent tests conducted by West Virginia University together with the EPA, detected emission levels of NOx up to 40 times more than levels allowed by law.
The term NOx generically refers to the group of the most impor-tant polluting nitrous oxides such as nitrogen monoxide, NO, and nitrogen dioxide NO2. In order to limit the concentration of these substances the United States has been committed to passing legislation to set ceilings that may not be exceeded: this espe-cially regards the automotive sector.
Every vehicle registered in the United States during the com-muniqué’s reference period (2009-2015) was required to meet the emissions standards “US EPA Tier 2/Bin 5” or California LEV-II ULEV”; both these standards set NOx emissions at around 0.043g/km (0.07g/mile). These values must be measured during a test cycle that simulates as far as possible real conditions: in the United States the test in force is the FTP.
The software on some control units installed on Volkswagen cars was able to detect the conditions of an emissions test (similar to ideal conditions) and arranged all the reduction devices so as to comply with the required standards: tests carried out on real
United States - FTP Cycle (Federal Test Procedure) of the EPA(Duration = 1874 seconds, distance = 11.04 miles, average speed = 21.19 miles/hour)
0 200 400 600 800 1000 1200 16001400 200018000
10
20
30
40
50
60
70
Spee
d (m
iles
per h
our)
Cold start cycle 505 seconds
Cold functioning cycle 864 seconds
Hot start phase505 seconds
Time (seconds)
road conditions yielded values of NOx that were close to 1.5g/km as compared with 0.022g/km obtained in the lab (emissions 70 times higher than those declared) thus ensuring particularly high engine performance. This led the government to bring legal action against VW having ascertained that behind the “defective” software there was bad faith on the part of the Group which was perfectly aware of the system.
Immediate consequences were the resignation by CEO Martin Winterkorn followed by other pecuniary measures including the EPA requesting a fine of 37,500 dollars for every vehicle in non-compliance with the standards for a total of 18 billion dol-lars. To this must be added the costs of correcting the software which have been estimated at 7.3 billion dollars and 1000 dollars offered to the owner of every vehicle involved.
In Europe the situation was not very different from the other side of the Atlantic: the norm currently in force (Regulation (EC) n. 715/2007), which EURO 5 and EURO 6 standards are part of, sets limits on the main polluting emissions – carbon monoxide (CO), non-methane hydrocarbons and total hydrocarbons, nitrous oxides (NOx) and particulates (PM) - with a separate set of lim-its for diesel engines and spark ignition engines which can be fuelled by Petrol, LPG, Methane, etc.
With regard to the first category, the EURO 5 standard sets NOx
limits around 0.18 g/km (which is a 20 per cent reduction from
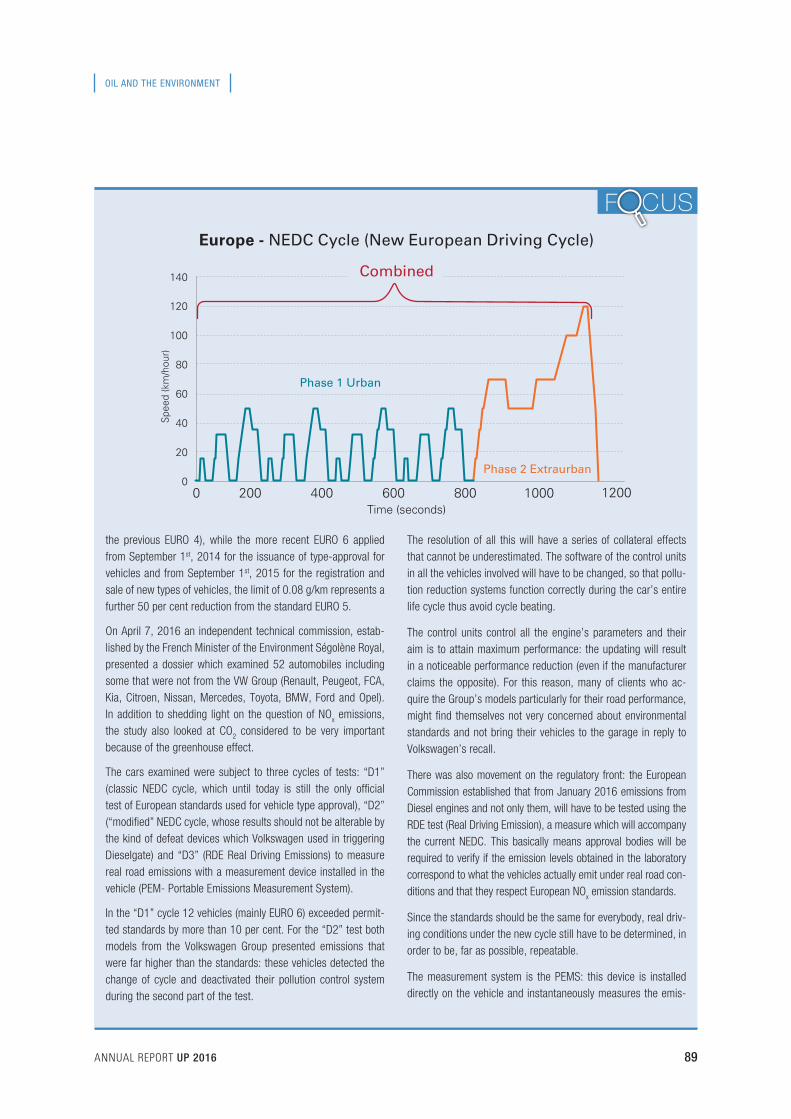
OIL AND THE ENVIRONMENT
ANNUAL REPORT UP 2016 89
Europe - NEDC Cycle (New European Driving Cycle)
0
20
40
60
80
100
120
140
0 200 400 600 800 1000 1200
Phase 1 Urban
Phase 2 Extraurban
Spee
d (k
m/h
our)
Combined
Time (seconds)
the previous EURO 4), while the more recent EURO 6 applied from September 1st, 2014 for the issuance of type-approval for vehicles and from September 1st, 2015 for the registration and sale of new types of vehicles, the limit of 0.08 g/km represents a further 50 per cent reduction from the standard EURO 5.
On April 7, 2016 an independent technical commission, estab-lished by the French Minister of the Environment Ségolène Royal, presented a dossier which examined 52 automobiles including some that were not from the VW Group (Renault, Peugeot, FCA, Kia, Citroen, Nissan, Mercedes, Toyota, BMW, Ford and Opel). In addition to shedding light on the question of NOx emissions, the study also looked at CO2 considered to be very important because of the greenhouse effect.
The cars examined were subject to three cycles of tests: “D1” (classic NEDC cycle, which until today is still the only official test of European standards used for vehicle type approval), “D2” (“modified” NEDC cycle, whose results should not be alterable by the kind of defeat devices which Volkswagen used in triggering Dieselgate) and “D3” (RDE Real Driving Emissions) to measure real road emissions with a measurement device installed in the vehicle (PEM- Portable Emissions Measurement System).
In the “D1” cycle 12 vehicles (mainly EURO 6) exceeded permit-ted standards by more than 10 per cent. For the “D2” test both models from the Volkswagen Group presented emissions that were far higher than the standards: these vehicles detected the change of cycle and deactivated their pollution control system during the second part of the test.
The resolution of all this will have a series of collateral effects that cannot be underestimated. The software of the control units in all the vehicles involved will have to be changed, so that pollu-tion reduction systems function correctly during the car’s entire life cycle thus avoid cycle beating.
The control units control all the engine’s parameters and their aim is to attain maximum performance: the updating will result in a noticeable performance reduction (even if the manufacturer claims the opposite). For this reason, many of clients who ac-quire the Group’s models particularly for their road performance, might find themselves not very concerned about environmental standards and not bring their vehicles to the garage in reply to Volkswagen’s recall.
There was also movement on the regulatory front: the European Commission established that from January 2016 emissions from Diesel engines and not only them, will have to be tested using the RDE test (Real Driving Emission), a measure which will accompany the current NEDC. This basically means approval bodies will be required to verify if the emission levels obtained in the laboratory correspond to what the vehicles actually emit under real road con-ditions and that they respect European NOx emission standards.
Since the standards should be the same for everybody, real driv-ing conditions under the new cycle still have to be determined, in order to be, far as possible, repeatable.
The measurement system is the PEMS: this device is installed directly on the vehicle and instantaneously measures the emis-
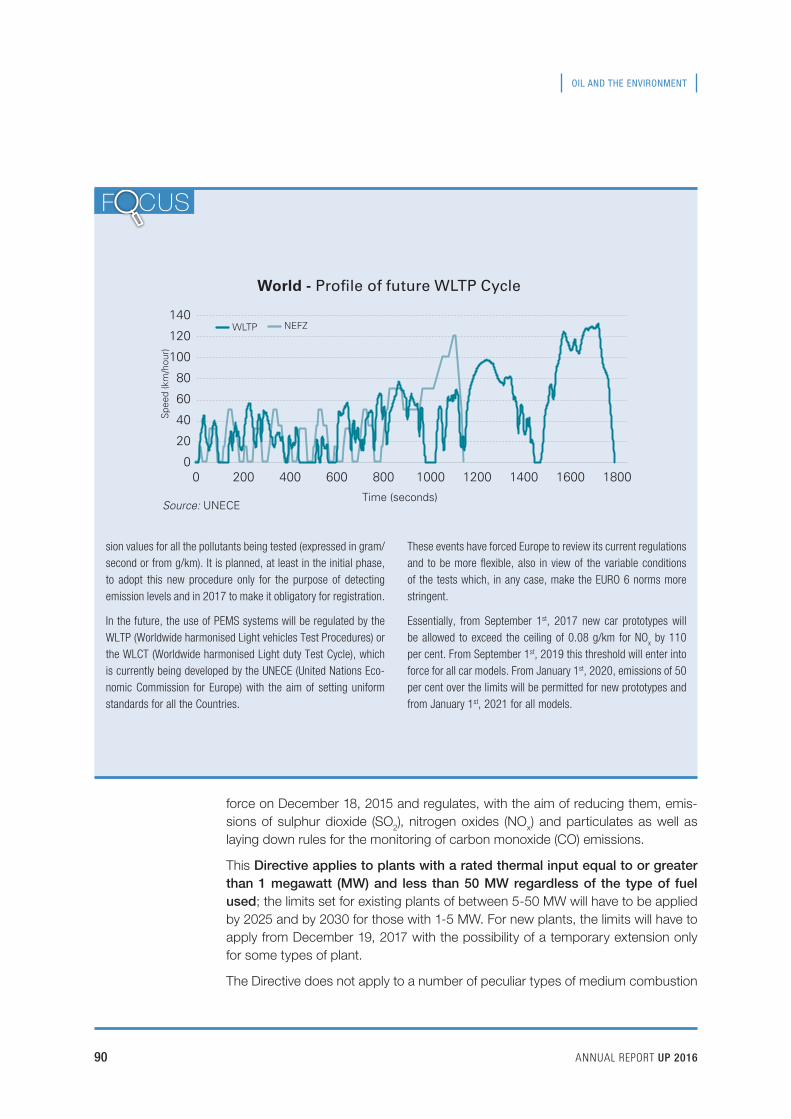
OIL AND THE ENVIRONMENT
90 ANNUAL REPORT UP 2016
force on December 18, 2015 and regulates, with the aim of reducing them, emis-sions of sulphur dioxide (SO2), nitrogen oxides (NOx) and particulates as well as laying down rules for the monitoring of carbon monoxide (CO) emissions.
This Directive applies to plants with a rated thermal input equal to or greater than 1 megawatt (MW) and less than 50 MW regardless of the type of fuel used; the limits set for existing plants of between 5-50 MW will have to be applied by 2025 and by 2030 for those with 1-5 MW. For new plants, the limits will have to apply from December 19, 2017 with the possibility of a temporary extension only for some types of plant.
The Directive does not apply to a number of peculiar types of medium combustion
World - Profile of future WLTP Cycle
0
20
40
60
80
100
120
140
0 200 400 600 800 1000 1200 1400 1600 1800
Spee
d (k
m/h
our)
NEFZWLTP
Source: UNECETime (seconds)
sion values for all the pollutants being tested (expressed in gram/second or from g/km). It is planned, at least in the initial phase, to adopt this new procedure only for the purpose of detecting emission levels and in 2017 to make it obligatory for registration.
In the future, the use of PEMS systems will be regulated by the WLTP (Worldwide harmonised Light vehicles Test Procedures) or the WLCT (Worldwide harmonised Light duty Test Cycle), which is currently being developed by the UNECE (United Nations Eco-nomic Commission for Europe) with the aim of setting uniform standards for all the Countries.
These events have forced Europe to review its current regulations and to be more flexible, also in view of the variable conditions of the tests which, in any case, make the EURO 6 norms more stringent.
Essentially, from September 1st, 2017 new car prototypes will be allowed to exceed the ceiling of 0.08 g/km for NOx by 110 per cent. From September 1st, 2019 this threshold will enter into force for all car models. From January 1st, 2020, emissions of 50 per cent over the limits will be permitted for new prototypes and from January 1st, 2021 for all models.
OIL AND THE ENVIRONMENT
ANNUAL REPORT UP 2016 91
plants including those firing refinery fuels alone or with other fuels for the produc-tion of energy within mineral oil and gas refineries as these are already subject to emission levels associated with the Best Available Techniques (BAT) pursuant to Directive 2010/75/EU (IED).
As regards the amendment of the NEC Directive, in October 2015 the European Parliament voted for the proposed amendments and later, in December, the Coun-cil came to an agreement on its own proposal of a “General Approach”, which will serve as the basis for negotiations with the Parliament and the Commission (known as the Trialogue), which should get underway in the first half of 2016.
The Commission’s original proposal contained new national pledges for emissions reductions, applicable from 2020 and from 2030 for the six main atmospheric pol-lutants: SO2, NOx Volatile Organic Compounds, Ammonia, Particulate Matter (fine dust) and Methane.
The European Council’s general attitude is more realistic and flexible than the significantly more restrictive position of the European Parliament on important aspects like:
– emission limits to 2030, the application of intermediate targets to 2025 (suggested and not binding);
– flexibility mechanisms in case of uncertain future events, like the economic situation and exceptional circumstances;
– the possibility for ex post legislative adjustments to emissions ceilings (re-vision clause), if the member States are not able to meet their pledges to re-duce emissions;
– the exclusion of methane from the Directive’s field of application in consider-ation of potential overlapping with targets to reduce emissions of greenhouse gases.
In view of the upcoming negotiation, Unione Petrolifera, together with the rest of Italian industrial Associations has stressed its strong commitment to reducing its own impacts on air quality, with large investments in innovative technologies for atmospheric emissions reductions, while confirming its willingness to continue in this direction by applying the Best Available Techniques in accordance with the Industrial Emissions Directive (IED).
Implementation of Directive 2010/75/EU on industrial emissions (IPPC1)
In 2015 Italian refineries submitted their applications and obtained decrees for the renewal of Integrated Environmental Authorization IEA) for the operation of Large Combustion Plants (LCP) based on the new and stricter Emission Limit Values (ELV2).
1 IPPC – Integrated Pollution Prevention and Control.
2 The new procedures are provided for in Directive 2010/75/EU transposed in Italy by Legislative Decree 46/2014, which requires the LCP technology with the new ELV to take effect January 1st, 2016 and in any case until the issuing of the larger EIA review provision of the entire installation and not beyond December 31, 2016.
OIL AND THE ENVIRONMENT
92 ANNUAL REPORT UP 2016
All the refineries have met the new ELV and obtained, with regard to their author-izations, some flexibilities allowed for in Directive 2010/75/EU and incorporated into the Legislative Decree n. 152/061.
During 2015 the Ministry of the Environment also developed instructions con-cerning the process of the more detailed review of the existing IEAs of the entire refinery installation based on the BAT Conclusions published with a decision by the European Commission on October 28, 2014 which includes the so-called “Bubble approach” and whose emission limits (ELV) must be met by October 20182. In this regard the Ministry issued:
• in December 2015 a Ministerial Directive to address the most significant as-pects of conducting the IEAs review process on the basis of experience ac-quired over the past decade;
• in March 2016 the forms that refineries operators will have to fill in when pre-senting their IEA application.
Following the issue of the aforementioned instructions, the Ministry in April 2016 formally communicated to the refineries the start of the application process for IEA review, setting a deadline of 60 days for submission.
As this deadline was not sufficient, in view of the complexity of the documentation required and data needed to prepare an effective submission, Unione Petrolifera and the Companies, requested and obtained an extension of the abovemen-tioned deadline.
It should pointed out that while the authorization procedure allows refineries to adopt the “Bubble approach”, it limits the flexibility of how it is applied because of the specific stricter emission limits imposed on the LCPs, even if they fall within the installation’s total emissions.
Moreover it is to be noted and hoped that that the new ELV values will coincide with the less strict values of the corresponding BAT-AELs3 range of the BAT-Con-clusions documents that totally guarantee the Directive’s environmental objec-tives. These limits are, indeed, sustainable even if they will require significant investments.
Stricter limits would result in excessive costs for operators and the potential clo-sure of some plants. Unione Petrolifera, in view of the short time left (October 2018) to comply with the new ELVs, does not exclude the need to request, in some cases, for an extension of the deadline and/or some of the other exemp-tions provided for in Legislative Decree n. 152/06.
1 Points 3.3 and 3.4 of Annex II Part V.
2 BAT Conclusions specify for every sector the best available techniques and performance levels.
3 The BAT-AELs specify value limits for every sector corresponding to the best available technique.
OIL AND THE ENVIRONMENT
ANNUAL REPORT UP 2016 93
Developments in environmental managementsystems (ISO)In 2015 activity proceeded at the ISO TC-207 level to develop international stand-ards, aimed at mitigating the greenhouse effect and aligning various environmental management systems of products, operations and quality1.
Of particular importance was the publication in September 2015 of the new version of EN ISO 14001:2015 (one the most widely used standards) which specifies the requirements of an environmental management system that an organization may use to improve its own environmental performance.
The standard responds to the trend towards sustainable development as a balance between environment, society and economy and represents a way for the organi-zation to help achieve the intended outcome it sets for its environmental manage-ment system. The rule requires the organization to:
• determine the boundaries and applicability of its own management system con-sidering both the internal and external issues (environmental, social, economic) of the context in which it operates;
• determine and face risks and opportunities related to its environmental aspects, to obligations for compliance and other factors identified in the context. This makes it possible to efficaciously manage risks and opportunities by integrating environmental management in its business processes, strategies and decision making, while obtaining financial and operational benefits and improving market position;
• identify the environmental aspects of its activities, products and services which it can control and those which it can influence, and their environmental impacts, in view of the prospect of a life cycle.
A three year transition period after its publication has been set for the standard to enter into force. After this period the former version of ISO 14001:2004, and any certification to it, will be out of date.
The other most significant ISO standards and of particular interest to Unione Petro-lifera are: ISO 14067 published in 2013 “Carbon Footprint of Products” for the quan-tification and communication of greenhouse gases emitted during the entire life cycle of products and the current revision of ISO 14064-1 “Specification with guid-ance at the organization level for quantification and reporting of greenhouse gas emissions and removals”, which will have to include the quantification of indirect emissions connected to the entire life cycle of products and services.
Unione Petrolifera takes an active part in working to develop ISO and UNI stand-ards that concern the oil sector.
1 All the norms regarding management systems must be developed on the basis of an identical structure, named “High Level Structure”, in order to facilitate the most integrated applicative approach possible.
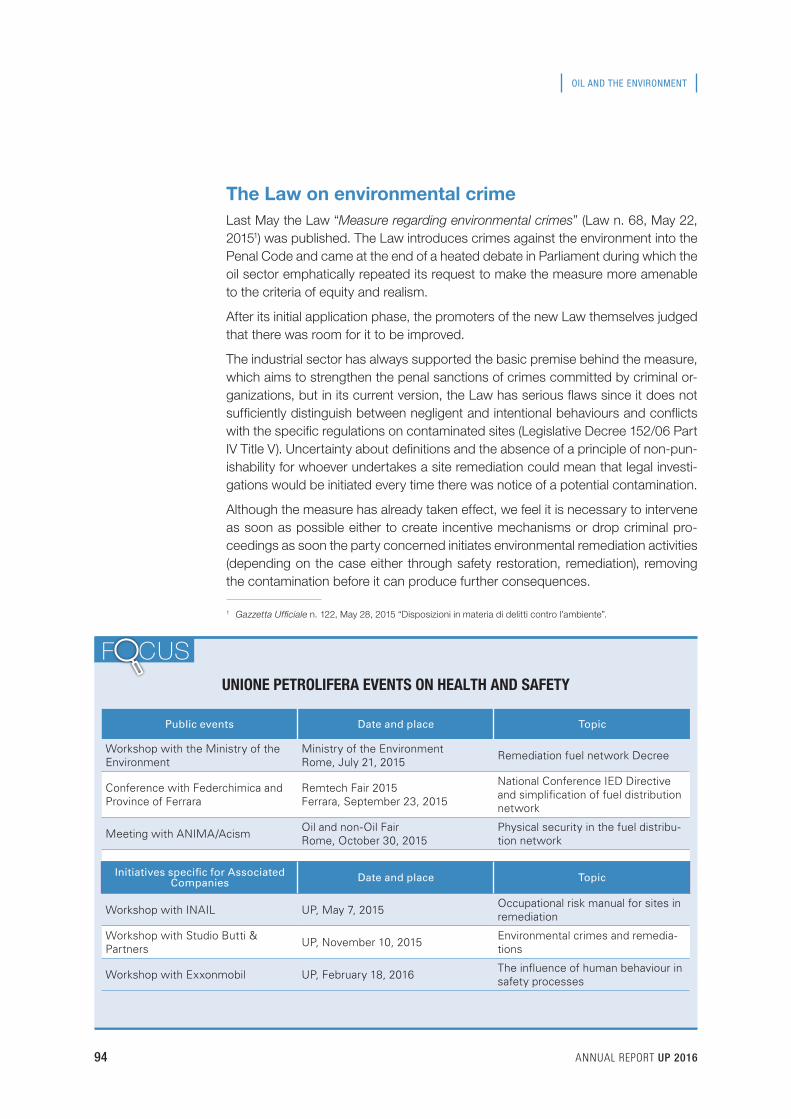
OIL AND THE ENVIRONMENT
94 ANNUAL REPORT UP 2016
The Law on environmental crimeLast May the Law “Measure regarding environmental crimes” (Law n. 68, May 22, 20151) was published. The Law introduces crimes against the environment into the Penal Code and came at the end of a heated debate in Parliament during which the oil sector emphatically repeated its request to make the measure more amenable to the criteria of equity and realism.
After its initial application phase, the promoters of the new Law themselves judged that there was room for it to be improved.
The industrial sector has always supported the basic premise behind the measure, which aims to strengthen the penal sanctions of crimes committed by criminal or-ganizations, but in its current version, the Law has serious flaws since it does not sufficiently distinguish between negligent and intentional behaviours and conflicts with the specific regulations on contaminated sites (Legislative Decree 152/06 Part IV Title V). Uncertainty about definitions and the absence of a principle of non-pun-ishability for whoever undertakes a site remediation could mean that legal investi-gations would be initiated every time there was notice of a potential contamination.
Although the measure has already taken effect, we feel it is necessary to intervene as soon as possible either to create incentive mechanisms or drop criminal pro-ceedings as soon the party concerned initiates environmental remediation activities (depending on the case either through safety restoration, remediation), removing the contamination before it can produce further consequences.
1 Gazzetta Ufficiale n. 122, May 28, 2015 “Disposizioni in materia di delitti contro l’ambiente”.
Public events Date and place Topic
Workshop with the Ministry of the Environment
Ministry of the EnvironmentRome, July 21, 2015 Remediation fuel network Decree
Conference with Federchimica and Province of Ferrara
Remtech Fair 2015Ferrara, September 23, 2015
National Conference IED Directive and simplification of fuel distribution network
Meeting with ANIMA/Acism Oil and non-Oil FairRome, October 30, 2015
Physical security in the fuel distribu-tion network
Initiatives specific for Associated Companies Date and place Topic
Workshop with INAIL UP, May 7, 2015 Occupational risk manual for sites in remediation
Workshop with Studio Butti & Partners UP, November 10, 2015 Environmental crimes and remedia-
tions
Workshop with Exxonmobil UP, February 18, 2016 The influence of human behaviour in safety processes
UNIONE PETROLIFERA EVENTS ON HEALTH AND SAFETY
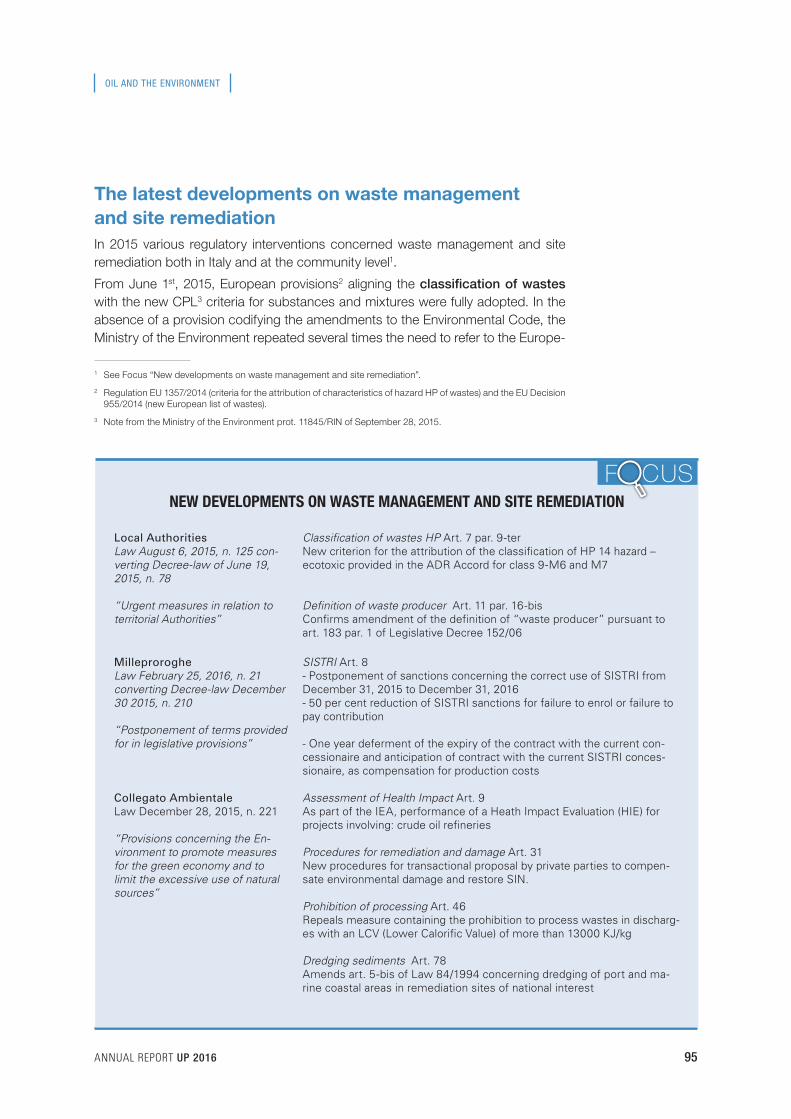
OIL AND THE ENVIRONMENT
ANNUAL REPORT UP 2016 95
The latest developments on waste managementand site remediationIn 2015 various regulatory interventions concerned waste management and site remediation both in Italy and at the community level1.
From June 1st, 2015, European provisions2 aligning the classification of wastes with the new CPL3 criteria for substances and mixtures were fully adopted. In the absence of a provision codifying the amendments to the Environmental Code, the Ministry of the Environment repeated several times the need to refer to the Europe-
1 See Focus “New developments on waste management and site remediation”.
2 Regulation EU 1357/2014 (criteria for the attribution of characteristics of hazard HP of wastes) and the EU Decision 955/2014 (new European list of wastes).
3 Note from the Ministry of the Environment prot. 11845/RIN of September 28, 2015.
NEW DEVELOPMENTS ON WASTE MANAGEMENT AND SITE REMEDIATION
Local Authorities Law August 6, 2015, n. 125 con-verting Decree-law of June 19, 2015, n. 78
“Urgent measures in relation to territorial Authorities”
Classification of wastes HP Art. 7 par. 9-ter New criterion for the attribution of the classification of HP 14 hazard – ecotoxic provided in the ADR Accord for class 9-M6 and M7
Definition of waste producer Art. 11 par. 16-bisConfirms amendment of the definition of “waste producer” pursuant to art. 183 par. 1 of Legislative Decree 152/06
MilleprorogheLaw February 25, 2016, n. 21 converting Decree-law December 30 2015, n. 210
“Postponement of terms provided for in legislative provisions”
SISTRI Art. 8- Postponement of sanctions concerning the correct use of SISTRI from December 31, 2015 to December 31, 2016 - 50 per cent reduction of SISTRI sanctions for failure to enrol or failure to pay contribution
- One year deferment of the expiry of the contract with the current con-cessionaire and anticipation of contract with the current SISTRI conces-sionaire, as compensation for production costs
Collegato Ambientale Law December 28, 2015, n. 221
“Provisions concerning the En-vironment to promote measures for the green economy and to limit the excessive use of natural sources”
Assessment of Health Impact Art. 9 As part of the IEA, performance of a Heath Impact Evaluation (HIE) for projects involving: crude oil refineries
Procedures for remediation and damage Art. 31New procedures for transactional proposal by private parties to compen-sate environmental damage and restore SIN.
Prohibition of processing Art. 46Repeals measure containing the prohibition to process wastes in discharg-es with an LCV (Lower Calorific Value) of more than 13000 KJ/kg
Dredging sediments Art. 78Amends art. 5-bis of Law 84/1994 concerning dredging of port and ma-rine coastal areas in remediation sites of national interest
OIL AND THE ENVIRONMENT
96 ANNUAL REPORT UP 2016
an Regulation and Decision, both in the clarifying note issued last September1 on the classification of wastes and in the instructions appended to the “Single Environ-mental Declaration for the Year 2016”.
The sanctions regarding the correct use of the SISTRI system were postponed again (from December 31, 2015 to December 31, 20162), while awaiting publication of the Decree that will simplify the current system of traceability by introducing what the industrial system has asked for: interoperability, off line registrations, elimination of USB devices and of black boxes. In the meantime, the traditional management requirements and obligations (registries and forms) continue to apply as well as the old sanctions.
Last July the definition of waste producer3 was modified and now refers to legal entities, whose activity produces waste, and legal subjects to whom the above-mentioned production is legally referable. It is feared that this overlapping could create problems at the time of application, doubling the burdens for initial produc-ers both in terms of fulfilling administrative requirements (charge and discharge registries, forms, etc.) and their responsibilities to correctly begin waste processing or recovery. On this point there is not yet any legal consensus opinion.
At the European level, last December 2nd the European Commission published its awaited package of proposals on the circular economy contained in the commu-nication “Closing the Loop: a European Union action plan for the circular economy”, whose contents are expected to be implemented through a series of legislative pro-posals to amend Directives in the following areas: wastes, packaging, packaging wastes, waste electrical and electronic equipment (WEEE) and discharges.
The industrial sector believes that the proposals to amend the above Directives in question, generally represent an attempt to further qualify the current regulatory framework. In particular, the sector appreciated the alignment of definitions among the various Directives and the methods used to calculate waste reutilization and re-cycling targets; the gradual limitation of the use of landfill; the reuse of by-products and promoting the conversion of wastes into resources (i.e “end of waste”). It will closely follow European negotiations in the Parliament and Council for the finaliza-tion of the abovementioned proposals.
With reference to the contamination of sites, the refineries presented their refer-ence report4, as they are facilities subject to IEA by the State by January 7, 2016. Currently the Ministry of the Environment and Confindustria are meeting to identify the criteria to determine the financial guarantees, to be paid along with submission of the reference report, which take into account the potential risk of future contam-ination (for ex. areas near hazardous centres).
1 CLP – Classification, labelling and packaging. Regulation (EC) n. 1272/2008 of the European Parliament and Council of December 16, 2008 on the classification, labelling and packaging of substances and mixtures, amend-ing and repealing Directives 67/548/EEC and 1999/45/EC, and amending Regulation (EC) n. 1907/2006.
2 Decree-law December 30, 2015, n.210 “Extension of deadline by legislative measures”.
3 The measure was provided for by Decree-law of July 4, 2015 n. 92 Urgent Measure concerning wastes and inte-grated environmental authorisation and for the commercial operation of industrial activities of strategic national interest, not converted into law, later inserted in Law n. 125/2016.
4 Photograph of contamination of the water and soils by hazardous substances related to the activity of the installation.
HEALTH ANDSAFETY
ANNUAL REPORT UP 2016 97
Implementation of Directive 2012/18/EU (Seveso III)
Directive 2012/18/EU on the control of accident hazards involving dangerous sub-stances integrally repealed, from June 1st, 2015, the earlier regulations1.
With the exception of a few provisions concerning heavy fuel oils and alternative fuels used for the same purposes, which were transposed by Legislative Decree 48/2014, all the other provisions were transposed by Legislative Decree 2015/1052, which entered into force on July 29, 20153.
The Decree, 2015/105 which resembles a sort of “Single Text”, includes in its an-nexes updates and additions to numerous interrelated implementory technical standards and essentially confirms the approach of the earlier one, even if there are many changes, among which the most significant are:
• changes in the area of application, such as, the elimination of the obligations pursuant to art. 5 par.2 of Legislative Decree 334/99 for certain activities un-der the threshold, repeal of the Ministerial Decree 293/2001 on port activities, amendments to provisions applicable to railway freight yard terminals;
• new and/or amended definitions: new establishment, pre-existing, adjacent, other establishment, intermediate temporary storage, public, public concerned, inspections;
• new or changed institutional duties (Ministry of the Environment, Regions, Min-istry of the Interior, Fire Department) and the creation at the Ministry of the Envi-ronment of a “coordinating body for uniform application in the national territory”;
• new procedures and time-limits for sending notifications and safety reports. Ex-plicit references to accident evaluation scenarios resulting from natural events;
• public consultation and participation in decision-making processes (for projects involving new establishments and significant modifications to existing ones);
• alignment with the Aarhus Convention (so that the public and non-public organi-zations have access to administrative and legal decision making on environmen-tal matters;
• stricter inspections (schedules, procedures, inspections and more timely re-porting).
1 Directives 96/82/EC and 2003/105/EC.
2 Official Gazette, n. 161 of July 14, 2015.
3 Repeals Legislative Decree n. 334/1999 and Legislative Decree n. 238/2005, including the related implementing decrees.
HEALTH AND SAFETY
98 ANNUAL REPORT UP 2016
Unione Petrolifera, taking part in the usual consultations with institutions and asso-ciations, provided its own technical contribution and operational experience. The various Institutions contacted considered useful its numerous recommendations which were then taken into account and adopted.
Regulations on pressure equipment For some time now Unione Petrolifera has been drawing the Ministry of Econom-ic Development’s attention to the need to update Ministerial Decree n. 329 of 01/12/2004: “Regulations for putting into service or use of PED equipment and assemblies pursuant to article 19 of Legislative Decree n. 93 of February 25, 2000”.
The update concerns the need for a simplification of the complex operational and administrative procedures, for clarity and certainty about meeting obligations, about the role of inspections as well as the need to resolve regulatory overlapping and double previsions between Ministerial Decree n. 329 of 01/12/2004 and Legislative Decree n. 81 of April 9, 2008 (Single Text on Health and Safety in the workplace).
The work to update the Ministerial Decree appears imminent and in view of this, Unione Petrolifera would like to stress the importance of being consulted from the earliest stages, so that it can provide its own technical support and consolidated operational experience.
The most important issues and possible solutions have already been raised by the ad hoc working group of the Italian Thermotechnical Committee (CTI) during the numerous meetings and activities that were held in 2014 “National table on prob-lems related the application of Ministerial Decree n. 329/04 and Legislative Decree n. 81/08”.
Safety performance in 2015 The oil industry, in pursuing its efforts of continuous improvement in the area of health and safety in the workplace, intensified actions aimed at preventing risks and safeguarding the health of workers through many interventions on equipment and in the area of safety management systems and also aimed at improving the behaviour of the human factor.
With regard to this latter domain, which is an essential component of prevention, the companies and Unione Petrolifera have for some time intensified information initiatives, the training of personnel at every organizational level, through numer-ous and specially targeted meetings, seminars and workshops on the topics of Safety Human Performance and Safety Leadership intended to create a more widespread safety culture.
This is a policy that derives from the full awareness the oil companies have that they are processing substances classified as hazardous for humans and the en-vironment and, hence, the need to continuously adopt responsible behaviours in order to protect the safety of personnel employed in facilities and the surrounding local communities in which they are operating.
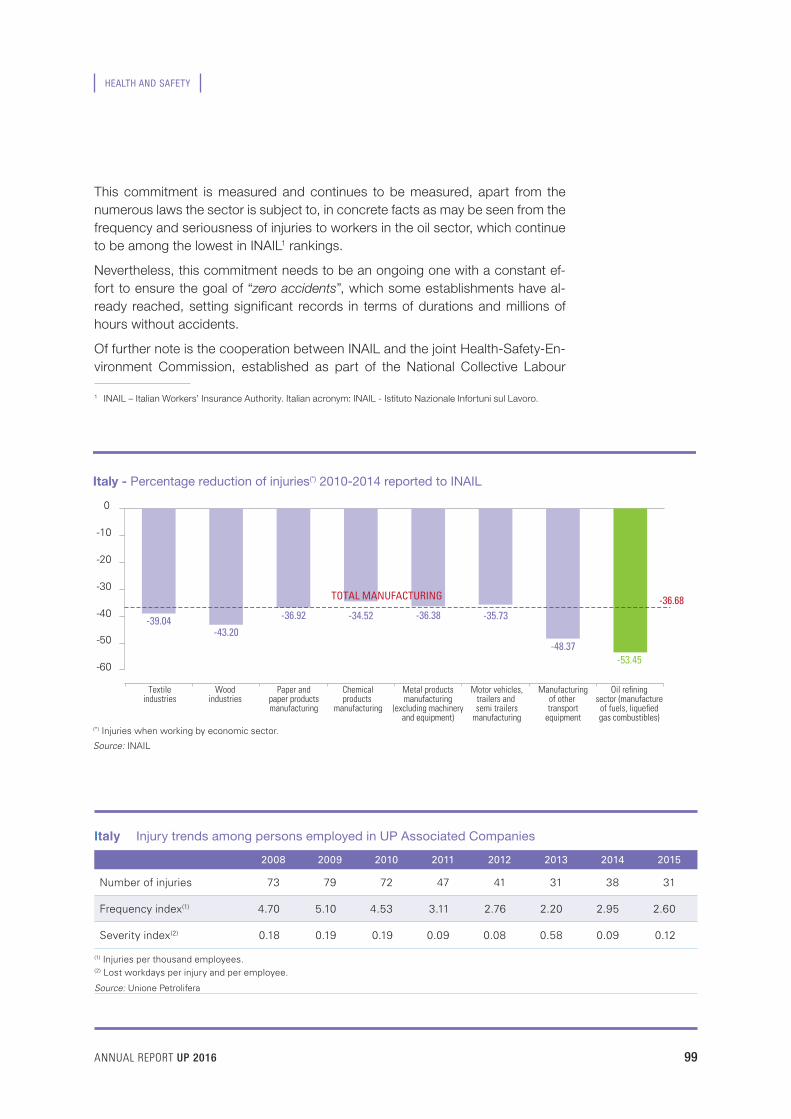
HEALTH AND SAFETY
ANNUAL REPORT UP 2016 99
This commitment is measured and continues to be measured, apart from the numerous laws the sector is subject to, in concrete facts as may be seen from the frequency and seriousness of injuries to workers in the oil sector, which continue to be among the lowest in INAIL1 rankings.
Nevertheless, this commitment needs to be an ongoing one with a constant ef-fort to ensure the goal of “zero accidents”, which some establishments have al-ready reached, setting significant records in terms of durations and millions of hours without accidents.
Of further note is the cooperation between INAIL and the joint Health-Safety-En-vironment Commission, established as part of the National Collective Labour
1 INAIL – Italian Workers’ Insurance Authority. Italian acronym: INAIL - Istituto Nazionale Infortuni sul Lavoro.
Italy Injury trends among persons employed in UP Associated Companies
2008 2009 2010 2011 2012 2013 2014 2015
Number of injuries 73 79 72 47 41 31 38 31
Frequency index(1) 4.70 5.10 4.53 3.11 2.76 2.20 2.95 2.60
Severity index(2) 0.18 0.19 0.19 0.09 0.08 0.58 0.09 0.12
(1) Injuries per thousand employees.(2) Lost workdays per injury and per employee.
Source: Unione Petrolifera
(*) Injuries when working by economic sector.
Source: INAIL
Textileindustries
Woodindustries
Paper andpaper productsmanufacturing
Chemicalproducts
manufacturing
Metal productsmanufacturing
(excluding machineryand equipment)
Motor vehicles,trailers and semi trailers
manufacturing
Manufacturingof other transport
equipment
Oil refiningsector (manufacture
of fuels, liquefiedgas combustibles)
-60
-50
-40
-30
-20
-10
0
-39.04-43.20
-36.92 -34.52 -36.38 -35.73
-48.37-53.45
-36.68TOTAL MANUFACTURING
Italy - Percentage reduction of injuries(*) 2010-2014 reported to INAIL
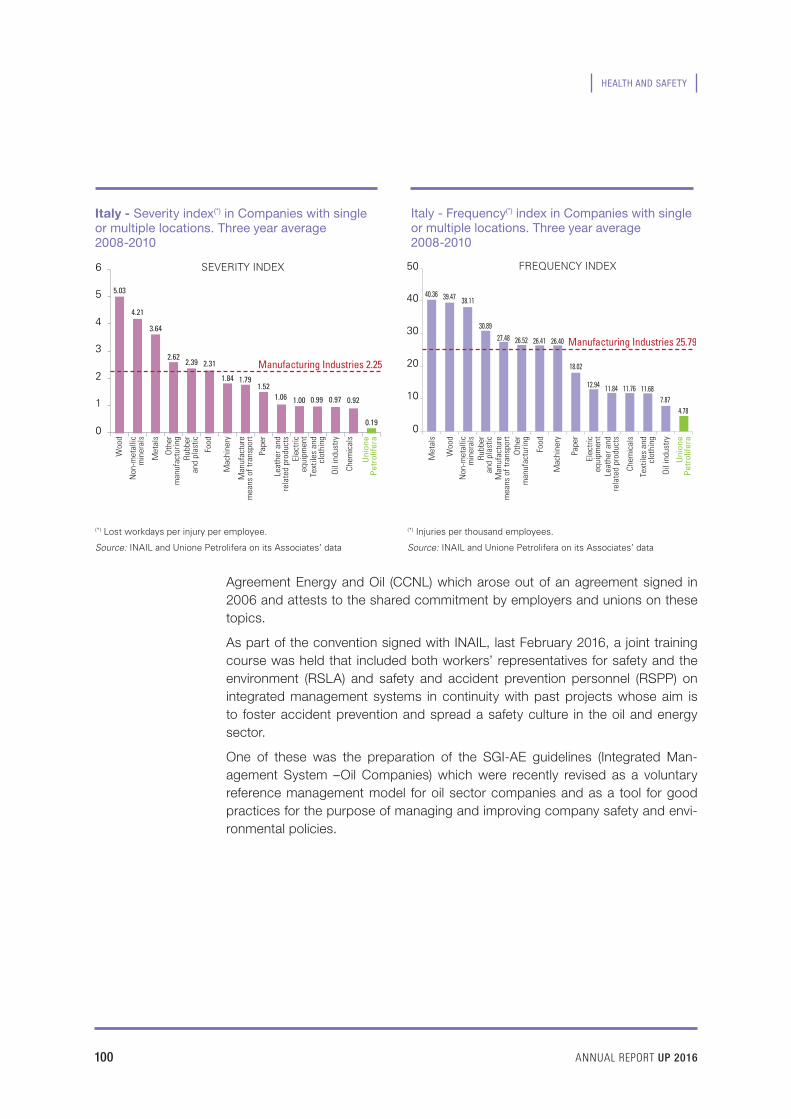
HEALTH AND SAFETY
100 ANNUAL REPORT UP 2016
(*) Lost workdays per injury per employee.
Source: INAIL and Unione Petrolifera on its Associates’ data
Woo
d
Non
-met
allic
min
eral
s
Met
als
Oth
erm
anuf
actu
ring
Rubb
eran
d pl
astic
Food
Mac
hine
ry
Man
ufac
ture
mea
ns o
f tra
nspo
rt
Pape
r
Leat
her a
ndre
late
d pr
oduc
tsEl
ectr
iceq
uipm
ent
Text
iles
and
clot
hing
Oil
indu
stry
Chem
ical
s
Uni
one
Petr
olife
ra
0
1
2
3
4
5
6
5.03
4.21
3.64
2.622.39 2.31
1.521.06 1.00 0.99 0.97 0.92
0.19
Manufacturing Industries 2.251.84 1.79
SEVERITY INDEX
Italy - Severity index(*) in Companies with single or multiple locations. Three year average 2008-2010
(*) Injuries per thousand employees.
Source: INAIL and Unione Petrolifera on its Associates’ data
0
10
20
30
40
50
40.36 39.47
30.8927.48 26.52 26.41 26.40
12.94 11.84 11.76 11.68
4.78
38.11
18.02
7.87
Manufacturing Industries 25.79
FREQUENCY INDEX
Italy - Frequency(*) index in Companies with single or multiple locations. Three year average 2008-2010
Met
als
Woo
d
Non
-met
allic
min
eral
sRu
bber
and
plas
ticM
anuf
actu
rem
eans
of t
rans
port
Oth
erm
anuf
actu
ring
Food
Mac
hine
ry
Pape
r
Elec
tric
equi
pmen
tLe
athe
r and
rela
ted
prod
ucts
Chem
ical
s
Text
iles
and
clot
hing
Oil
indu
stry
Uni
one
Petr
olife
ra
Agreement Energy and Oil (CCNL) which arose out of an agreement signed in 2006 and attests to the shared commitment by employers and unions on these topics.
As part of the convention signed with INAIL, last February 2016, a joint training course was held that included both workers’ representatives for safety and the environment (RSLA) and safety and accident prevention personnel (RSPP) on integrated management systems in continuity with past projects whose aim is to foster accident prevention and spread a safety culture in the oil and energy sector.
One of these was the preparation of the SGI-AE guidelines (Integrated Man-agement System –Oil Companies) which were recently revised as a voluntary reference management model for oil sector companies and as a tool for good practices for the purpose of managing and improving company safety and envi-ronmental policies.
STATISTICALAPPENDIX
2016

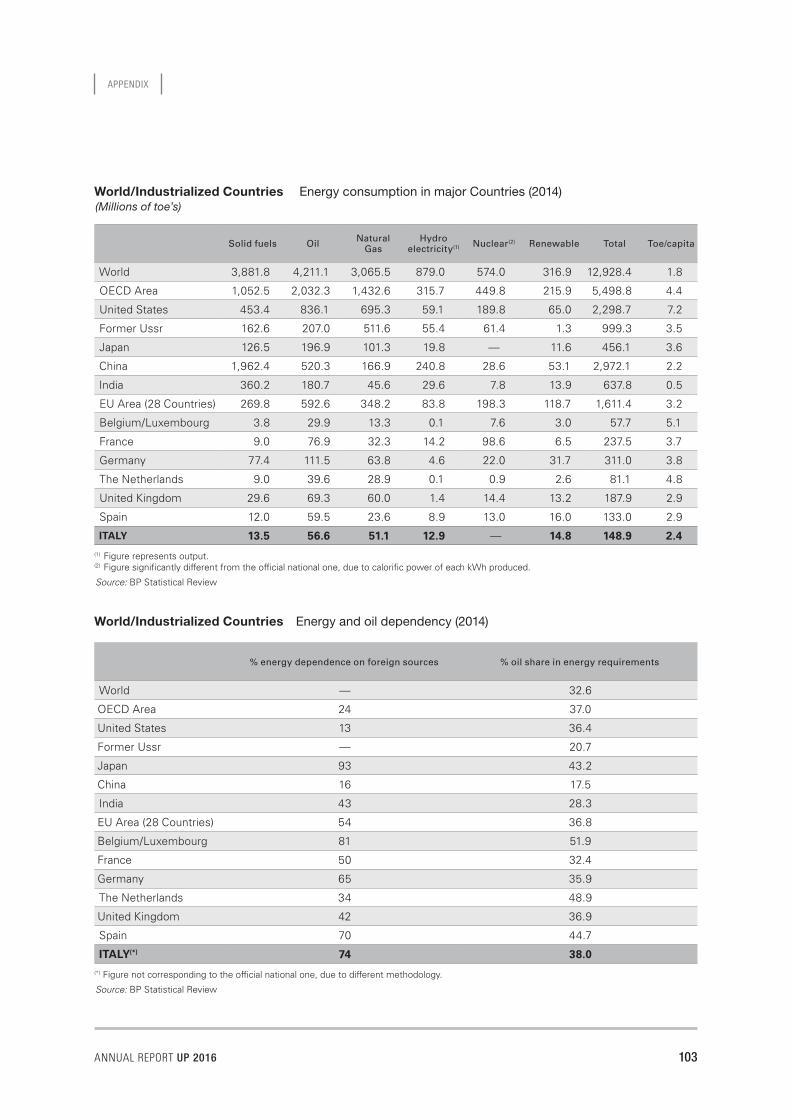
APPENDIX
ANNUAL REPORT UP 2016 103
World/Industrialized Countries Energy and oil dependency (2014)
% energy dependence on foreign sources % oil share in energy requirements
World — 32.6
OECD Area 24 37.0
United States 13 36.4
Former Ussr — 20.7
Japan 93 43.2
China 16 17.5
India 43 28.3
EU Area (28 Countries) 54 36.8
Belgium/Luxembourg 81 51.9
France 50 32.4
Germany 65 35.9
The Netherlands 34 48.9
United Kingdom 42 36.9
Spain 70 44.7
ITALY(*) 74 38.0(*) Figure not corresponding to the official national one, due to different methodology.
Source: BP Statistical Review
World/Industrialized Countries Energy consumption in major Countries (2014)(Millions of toe’s)
Solid fuels Oil Natural Gas
Hydro electricity(1) Nuclear(2) Renewable Total Toe/capita
World 3,881.8 4,211.1 3,065.5 879.0 574.0 316.9 12,928.4 1.8
OECD Area 1,052.5 2,032.3 1,432.6 315.7 449.8 215.9 5,498.8 4.4
United States 453.4 836.1 695.3 59.1 189.8 65.0 2,298.7 7.2
Former Ussr 162.6 207.0 511.6 55.4 61.4 1.3 999.3 3.5
Japan 126.5 196.9 101.3 19.8 — 11.6 456.1 3.6
China 1,962.4 520.3 166.9 240.8 28.6 53.1 2,972.1 2.2
India 360.2 180.7 45.6 29.6 7.8 13.9 637.8 0.5
EU Area (28 Countries) 269.8 592.6 348.2 83.8 198.3 118.7 1,611.4 3.2
Belgium/Luxembourg 3.8 29.9 13.3 0.1 7.6 3.0 57.7 5.1
France 9.0 76.9 32.3 14.2 98.6 6.5 237.5 3.7
Germany 77.4 111.5 63.8 4.6 22.0 31.7 311.0 3.8
The Netherlands 9.0 39.6 28.9 0.1 0.9 2.6 81.1 4.8
United Kingdom 29.6 69.3 60.0 1.4 14.4 13.2 187.9 2.9
Spain 12.0 59.5 23.6 8.9 13.0 16.0 133.0 2.9
ITALY 13.5 56.6 51.1 12.9 — 14.8 148.9 2.4(1) Figure represents output.(2) Figure significantly different from the official national one, due to calorific power of each kWh produced.
Source: BP Statistical Review
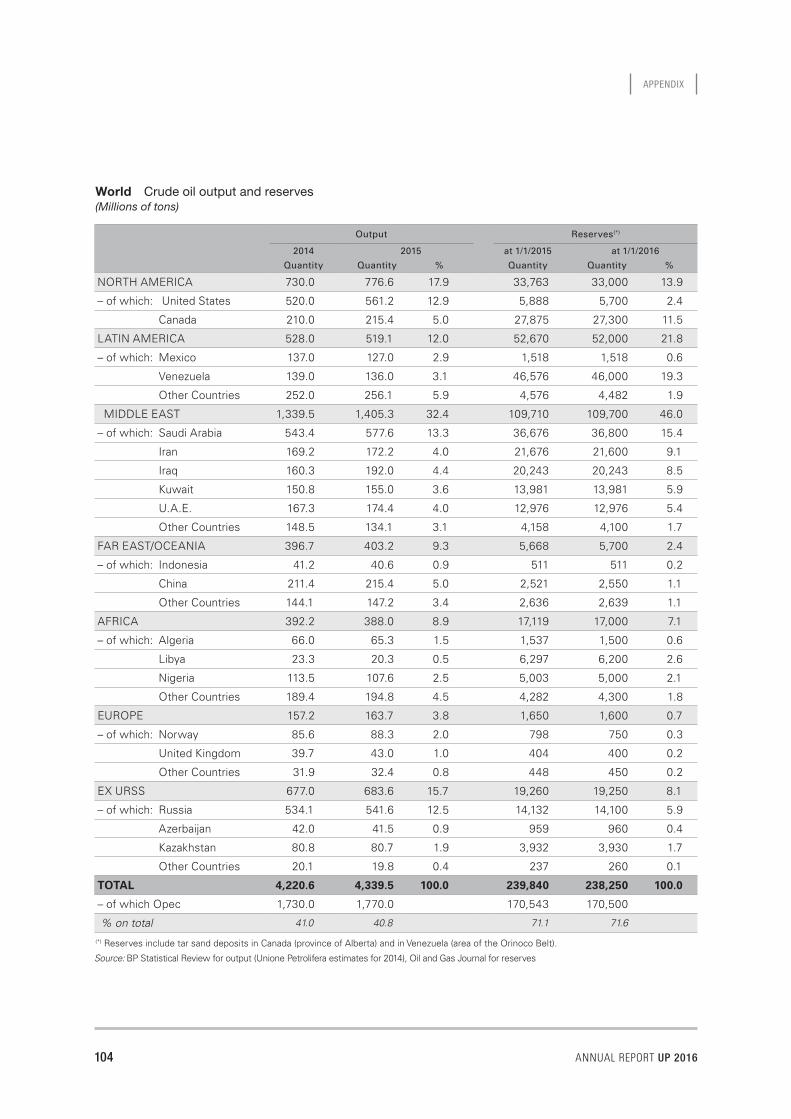
APPENDIX
104 ANNUAL REPORT UP 2016
World Crude oil output and reserves (Millions of tons)
Output Reserves(*)
2014 2015 at 1/1/2015 at 1/1/2016
Quantity Quantity % Quantity Quantity %
NORTH AMERICA 730.0 776.6 17.9 33,763 33,000 13.9
– of which: United States 520.0 561.2 12.9 5,888 5,700 2.4
Canada 210.0 215.4 5.0 27,875 27,300 11.5
LATIN AMERICA 528.0 519.1 12.0 52,670 52,000 21.8
– of which: Mexico 137.0 127.0 2.9 1,518 1,518 0.6
Venezuela 139.0 136.0 3.1 46,576 46,000 19.3
Other Countries 252.0 256.1 5.9 4,576 4,482 1.9
MIDDLE EAST 1,339.5 1,405.3 32.4 109,710 109,700 46.0
– of which: Saudi Arabia 543.4 577.6 13.3 36,676 36,800 15.4
Iran 169.2 172.2 4.0 21,676 21,600 9.1
Iraq 160.3 192.0 4.4 20,243 20,243 8.5
Kuwait 150.8 155.0 3.6 13,981 13,981 5.9
U.A.E. 167.3 174.4 4.0 12,976 12,976 5.4
Other Countries 148.5 134.1 3.1 4,158 4,100 1.7
FAR EAST/OCEANIA 396.7 403.2 9.3 5,668 5,700 2.4
– of which: Indonesia 41.2 40.6 0.9 511 511 0.2
China 211.4 215.4 5.0 2,521 2,550 1.1
Other Countries 144.1 147.2 3.4 2,636 2,639 1.1
AFRICA 392.2 388.0 8.9 17,119 17,000 7.1
– of which: Algeria 66.0 65.3 1.5 1,537 1,500 0.6
Libya 23.3 20.3 0.5 6,297 6,200 2.6
Nigeria 113.5 107.6 2.5 5,003 5,000 2.1
Other Countries 189.4 194.8 4.5 4,282 4,300 1.8
EUROPE 157.2 163.7 3.8 1,650 1,600 0.7
– of which: Norway 85.6 88.3 2.0 798 750 0.3
United Kingdom 39.7 43.0 1.0 404 400 0.2
Other Countries 31.9 32.4 0.8 448 450 0.2
EX URSS 677.0 683.6 15.7 19,260 19,250 8.1
– of which: Russia 534.1 541.6 12.5 14,132 14,100 5.9
Azerbaijan 42.0 41.5 0.9 959 960 0.4
Kazakhstan 80.8 80.7 1.9 3,932 3,930 1.7
Other Countries 20.1 19.8 0.4 237 260 0.1
TOTAL 4,220.6 4,339.5 100.0 239,840 238,250 100.0
– of which Opec 1,730.0 1,770.0 170,543 170,500
% on total 41.0 40.8 71.1 71.6
(*) Reserves include tar sand deposits in Canada (province of Alberta) and in Venezuela (area of the Orinoco Belt).
Source: BP Statistical Review for output (Unione Petrolifera estimates for 2014), Oil and Gas Journal for reserves
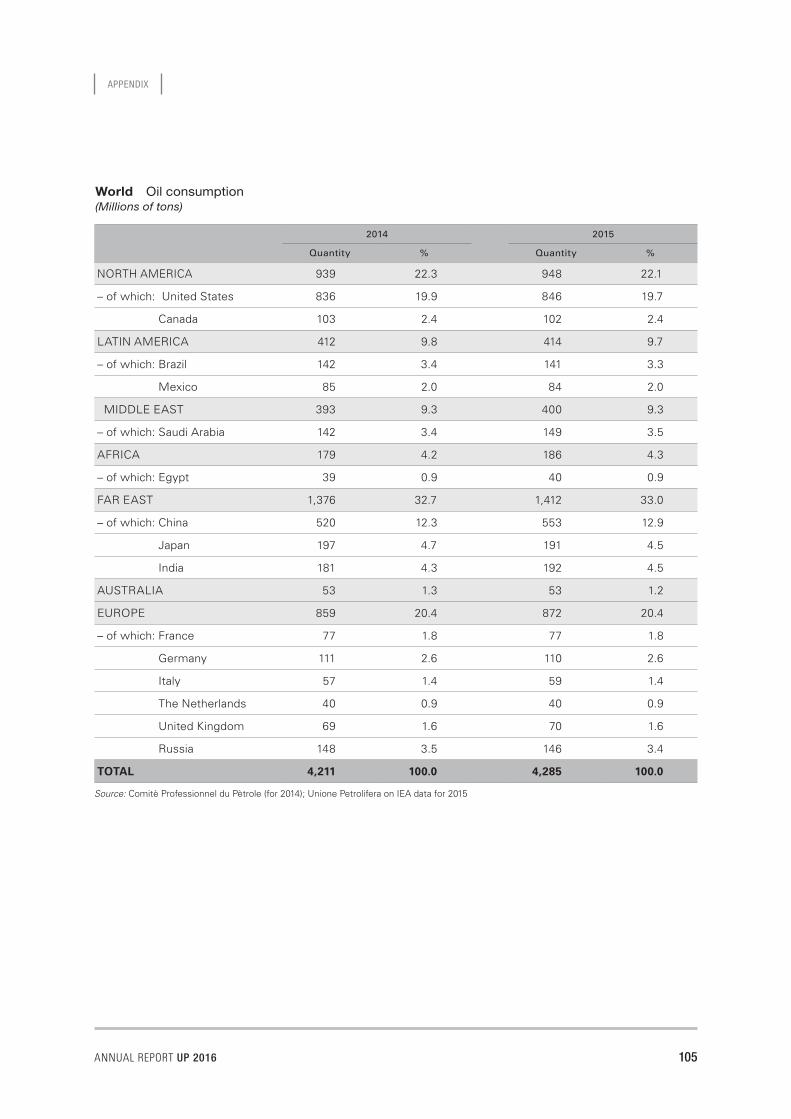
APPENDIX
ANNUAL REPORT UP 2016 105
World Oil consumption (Millions of tons)
2014 2015
Quantity % Quantity %
NORTH AMERICA 939 22.3 948 22.1
– of which: United States 836 19.9 846 19.7
Canada 103 2.4 102 2.4
LATIN AMERICA 412 9.8 414 9.7
– of which: Brazil 142 3.4 141 3.3
Mexico 85 2.0 84 2.0
MIDDLE EAST 393 9.3 400 9.3
– of which: Saudi Arabia 142 3.4 149 3.5
AFRICA 179 4.2 186 4.3
– of which: Egypt 39 0.9 40 0.9
FAR EAST 1,376 32.7 1,412 33.0
– of which: China 520 12.3 553 12.9
Japan 197 4.7 191 4.5
India 181 4.3 192 4.5
AUSTRALIA 53 1.3 53 1.2
EUROPE 859 20.4 872 20.4
– of which: France 77 1.8 77 1.8
Germany 111 2.6 110 2.6
Italy 57 1.4 59 1.4
The Netherlands 40 0.9 40 0.9
United Kingdom 69 1.6 70 1.6
Russia 148 3.5 146 3.4
TOTAL 4,211 100.0 4,285 100.0
Source: Comitè Professionnel du Pètrole (for 2014); Unione Petrolifera on IEA data for 2015
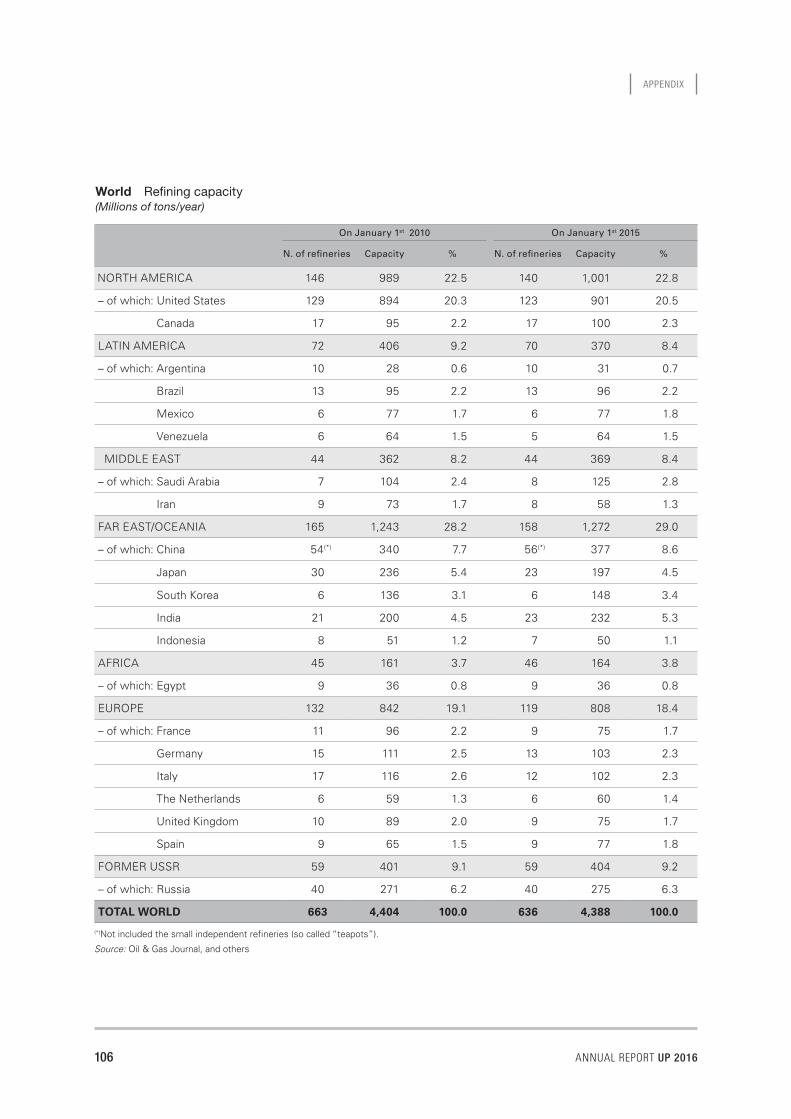
APPENDIX
106 ANNUAL REPORT UP 2016
World Refining capacity (Millions of tons/year)
On January 1st 2010 On January 1st 2015
N. of refineries Capacity % N. of refineries Capacity %
NORTH AMERICA 146 989 22.5 140 1,001 22.8
– of which: United States 129 894 20.3 123 901 20.5
Canada 17 95 2.2 17 100 2.3
LATIN AMERICA 72 406 9.2 70 370 8.4
– of which: Argentina 10 28 0.6 10 31 0.7
Brazil 13 95 2.2 13 96 2.2
Mexico 6 77 1.7 6 77 1.8
Venezuela 6 64 1.5 5 64 1.5
MIDDLE EAST 44 362 8.2 44 369 8.4
– of which: Saudi Arabia 7 104 2.4 8 125 2.8
Iran 9 73 1.7 8 58 1.3
FAR EAST/OCEANIA 165 1,243 28.2 158 1,272 29.0
– of which: China 54(*) 340 7.7 56(*) 377 8.6
Japan 30 236 5.4 23 197 4.5
South Korea 6 136 3.1 6 148 3.4
India 21 200 4.5 23 232 5.3
Indonesia 8 51 1.2 7 50 1.1
AFRICA 45 161 3.7 46 164 3.8
– of which: Egypt 9 36 0.8 9 36 0.8
EUROPE 132 842 19.1 119 808 18.4
– of which: France 11 96 2.2 9 75 1.7
Germany 15 111 2.5 13 103 2.3
Italy 17 116 2.6 12 102 2.3
The Netherlands 6 59 1.3 6 60 1.4
United Kingdom 10 89 2.0 9 75 1.7
Spain 9 65 1.5 9 77 1.8
FORMER USSR 59 401 9.1 59 404 9.2
– of which: Russia 40 271 6.2 40 275 6.3
TOTAL WORLD 663 4,404 100.0 636 4,388 100.0
(*)Not included the small independent refineries (so called “teapots”).
Source: Oil & Gas Journal, and others
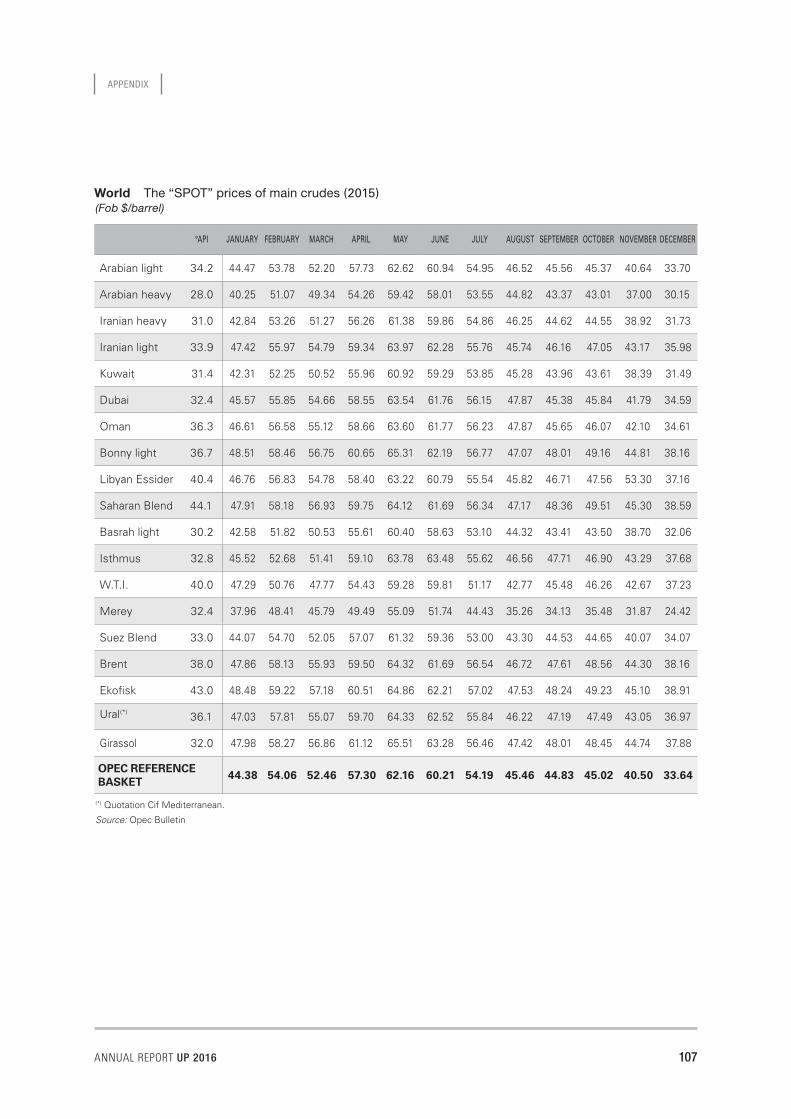
APPENDIX
ANNUAL REPORT UP 2016 107
World The “SPOT” prices of main crudes (2015) (Fob $/barrel)
°API JANUARY FEBRUARY MARCH APRIL MAY JUNE JULY AUGUST SEPTEMBER OCTOBER NOVEMBER DECEMBER
Arabian light 34.2 44.47 53.78 52.20 57.73 62.62 60.94 54.95 46.52 45.56 45.37 40.64 33.70
Arabian heavy 28.0 40.25 51.07 49.34 54.26 59.42 58.01 53.55 44.82 43.37 43.01 37.00 30.15
Iranian heavy 31.0 42.84 53.26 51.27 56.26 61.38 59.86 54.86 46.25 44.62 44.55 38.92 31.73
Iranian light 33.9 47.42 55.97 54.79 59.34 63.97 62.28 55.76 45.74 46.16 47.05 43.17 35.98
Kuwait 31.4 42.31 52.25 50.52 55.96 60.92 59.29 53.85 45.28 43.96 43.61 38.39 31.49
Dubai 32.4 45.57 55.85 54.66 58.55 63.54 61.76 56.15 47.87 45.38 45.84 41.79 34.59
Oman 36.3 46.61 56.58 55.12 58.66 63.60 61.77 56.23 47.87 45.65 46.07 42.10 34.61
Bonny light 36.7 48.51 58.46 56.75 60.65 65.31 62.19 56.77 47.07 48.01 49.16 44.81 38.16
Libyan Essider 40.4 46.76 56.83 54.78 58.40 63.22 60.79 55.54 45.82 46.71 47.56 53.30 37.16
Saharan Blend 44.1 47.91 58.18 56.93 59.75 64.12 61.69 56.34 47.17 48.36 49.51 45.30 38.59
Basrah light 30.2 42.58 51.82 50.53 55.61 60.40 58.63 53.10 44.32 43.41 43.50 38.70 32.06
Isthmus 32.8 45.52 52.68 51.41 59.10 63.78 63.48 55.62 46.56 47.71 46.90 43.29 37.68
W.T.I. 40.0 47.29 50.76 47.77 54.43 59.28 59.81 51.17 42.77 45.48 46.26 42.67 37.23
Merey 32.4 37.96 48.41 45.79 49.49 55.09 51.74 44.43 35.26 34.13 35.48 31.87 24.42
Suez Blend 33.0 44.07 54.70 52.05 57.07 61.32 59.36 53.00 43.30 44.53 44.65 40.07 34.07
Brent 38.0 47.86 58.13 55.93 59.50 64.32 61.69 56.54 46.72 47.61 48.56 44.30 38.16
Ekofisk 43.0 48.48 59.22 57.18 60.51 64.86 62.21 57.02 47.53 48.24 49.23 45.10 38.91
Ural(*) 36.1 47.03 57.81 55.07 59.70 64.33 62.52 55.84 46.22 47.19 47.49 43.05 36.97
Girassol 32.0 47.98 58.27 56.86 61.12 65.51 63.28 56.46 47.42 48.01 48.45 44.74 37.88
OPEC REFERENCE BASKET
44.38 54.06 52.46 57.30 62.16 60.21 54.19 45.46 44.83 45.02 40.50 33.64
(*) Quotation Cif Mediterranean.
Source: Opec Bulletin
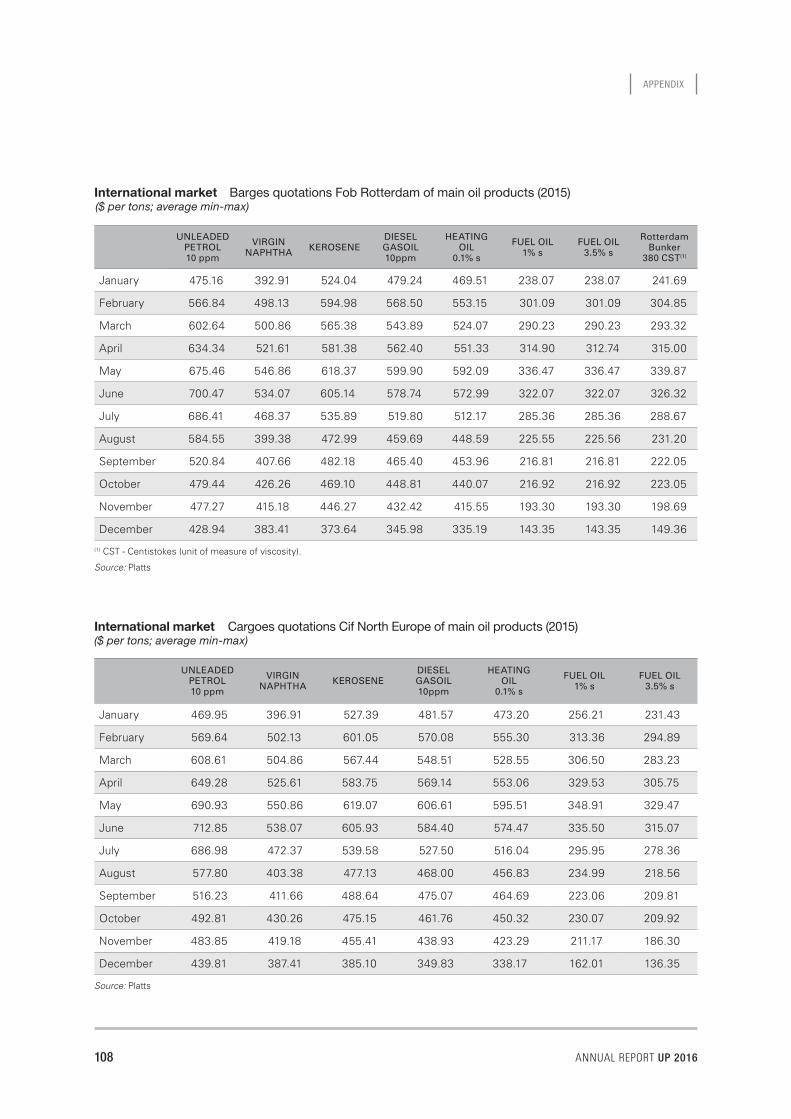
APPENDIX
108 ANNUAL REPORT UP 2016
International market Barges quotations Fob Rotterdam of main oil products (2015) ($ per tons; average min-max)
UNLEADEDPETROL10 ppm
VIRGINNAPHTHA KEROSENE
DIESELGASOIL10ppm
HEATINGOIL
0.1% s
FUEL OIL1% s
FUEL OIL3.5% s
RotterdamBunker
380 CST(1)
January 475.16 392.91 524.04 479.24 469.51 238.07 238.07 241.69
February 566.84 498.13 594.98 568.50 553.15 301.09 301.09 304.85
March 602.64 500.86 565.38 543.89 524.07 290.23 290.23 293.32
April 634.34 521.61 581.38 562.40 551.33 314.90 312.74 315.00
May 675.46 546.86 618.37 599.90 592.09 336.47 336.47 339.87
June 700.47 534.07 605.14 578.74 572.99 322.07 322.07 326.32
July 686.41 468.37 535.89 519.80 512.17 285.36 285.36 288.67
August 584.55 399.38 472.99 459.69 448.59 225.55 225.56 231.20
September 520.84 407.66 482.18 465.40 453.96 216.81 216.81 222.05
October 479.44 426.26 469.10 448.81 440.07 216.92 216.92 223.05
November 477.27 415.18 446.27 432.42 415.55 193.30 193.30 198.69
December 428.94 383.41 373.64 345.98 335.19 143.35 143.35 149.36
(1) CST - Centistokes (unit of measure of viscosity).
Source: Platts
International market Cargoes quotations Cif North Europe of main oil products (2015)($ per tons; average min-max)
UNLEADEDPETROL10 ppm
VIRGINNAPHTHA KEROSENE
DIESELGASOIL10ppm
HEATINGOIL
0.1% s
FUEL OIL 1% s
FUEL OIL3.5% s
January 469.95 396.91 527.39 481.57 473.20 256.21 231.43
February 569.64 502.13 601.05 570.08 555.30 313.36 294.89
March 608.61 504.86 567.44 548.51 528.55 306.50 283.23
April 649.28 525.61 583.75 569.14 553.06 329.53 305.75
May 690.93 550.86 619.07 606.61 595.51 348.91 329.47
June 712.85 538.07 605.93 584.40 574.47 335.50 315.07
July 686.98 472.37 539.58 527.50 516.04 295.95 278.36
August 577.80 403.38 477.13 468.00 456.83 234.99 218.56
September 516.23 411.66 488.64 475.07 464.69 223.06 209.81
October 492.81 430.26 475.15 461.76 450.32 230.07 209.92
November 483.85 419.18 455.41 438.93 423.29 211.17 186.30
December 439.81 387.41 385.10 349.83 338.17 162.01 136.35
Source: Platts
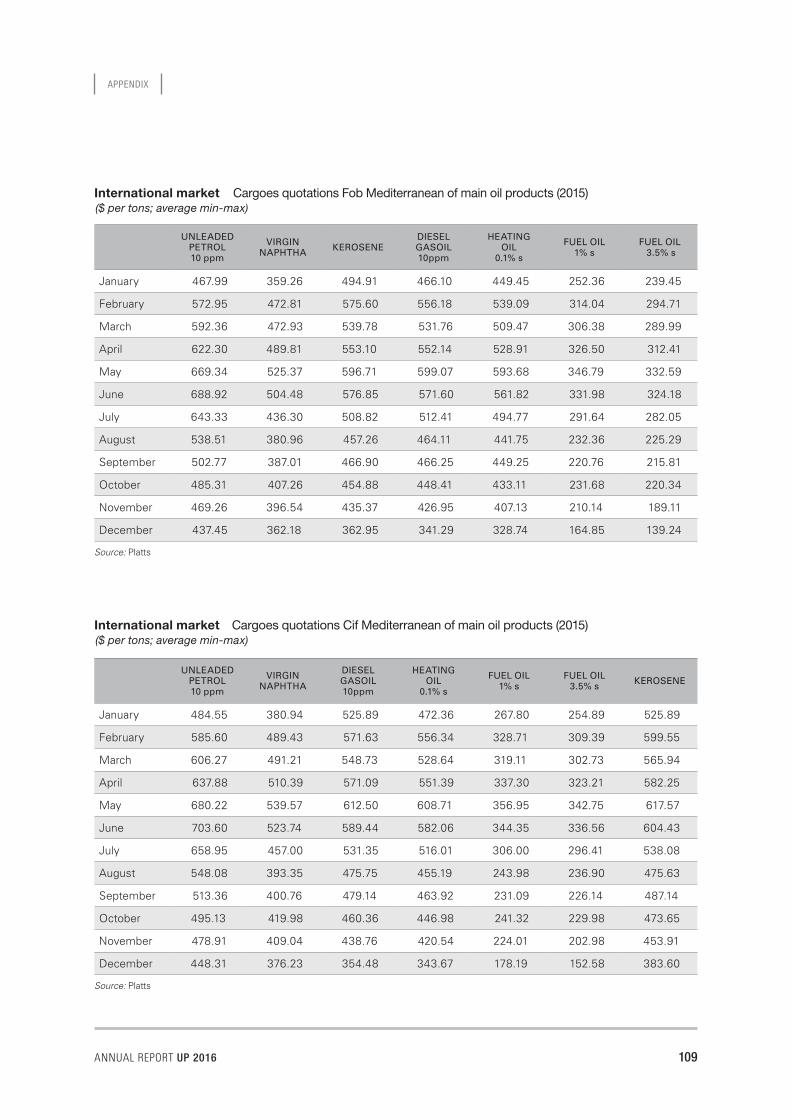
APPENDIX
ANNUAL REPORT UP 2016 109
International market Cargoes quotations Fob Mediterranean of main oil products (2015) ($ per tons; average min-max)
UNLEADEDPETROL10 ppm
VIRGINNAPHTHA KEROSENE
DIESEL GASOIL10ppm
HEATINGOIL
0.1% s
FUEL OIL1% s
FUEL OIL 3.5% s
January 467.99 359.26 494.91 466.10 449.45 252.36 239.45
February 572.95 472.81 575.60 556.18 539.09 314.04 294.71
March 592.36 472.93 539.78 531.76 509.47 306.38 289.99
April 622.30 489.81 553.10 552.14 528.91 326.50 312.41
May 669.34 525.37 596.71 599.07 593.68 346.79 332.59
June 688.92 504.48 576.85 571.60 561.82 331.98 324.18
July 643.33 436.30 508.82 512.41 494.77 291.64 282.05
August 538.51 380.96 457.26 464.11 441.75 232.36 225.29
September 502.77 387.01 466.90 466.25 449.25 220.76 215.81
October 485.31 407.26 454.88 448.41 433.11 231.68 220.34
November 469.26 396.54 435.37 426.95 407.13 210.14 189.11
December 437.45 362.18 362.95 341.29 328.74 164.85 139.24
Source: Platts
International market Cargoes quotations Cif Mediterranean of main oil products (2015) ($ per tons; average min-max)
UNLEADEDPETROL10 ppm
VIRGINNAPHTHA
DIESEL GASOIL10ppm
HEATINGOIL
0.1% s
FUEL OIL1% s
FUEL OIL3.5% s KEROSENE
January 484.55 380.94 525.89 472.36 267.80 254.89 525.89
February 585.60 489.43 571.63 556.34 328.71 309.39 599.55
March 606.27 491.21 548.73 528.64 319.11 302.73 565.94
April 637.88 510.39 571.09 551.39 337.30 323.21 582.25
May 680.22 539.57 612.50 608.71 356.95 342.75 617.57
June 703.60 523.74 589.44 582.06 344.35 336.56 604.43
July 658.95 457.00 531.35 516.01 306.00 296.41 538.08
August 548.08 393.35 475.75 455.19 243.98 236.90 475.63
September 513.36 400.76 479.14 463.92 231.09 226.14 487.14
October 495.13 419.98 460.36 446.98 241.32 229.98 473.65
November 478.91 409.04 438.76 420.54 224.01 202.98 453.91
December 448.31 376.23 354.48 343.67 178.19 152.58 383.60
Source: Platts
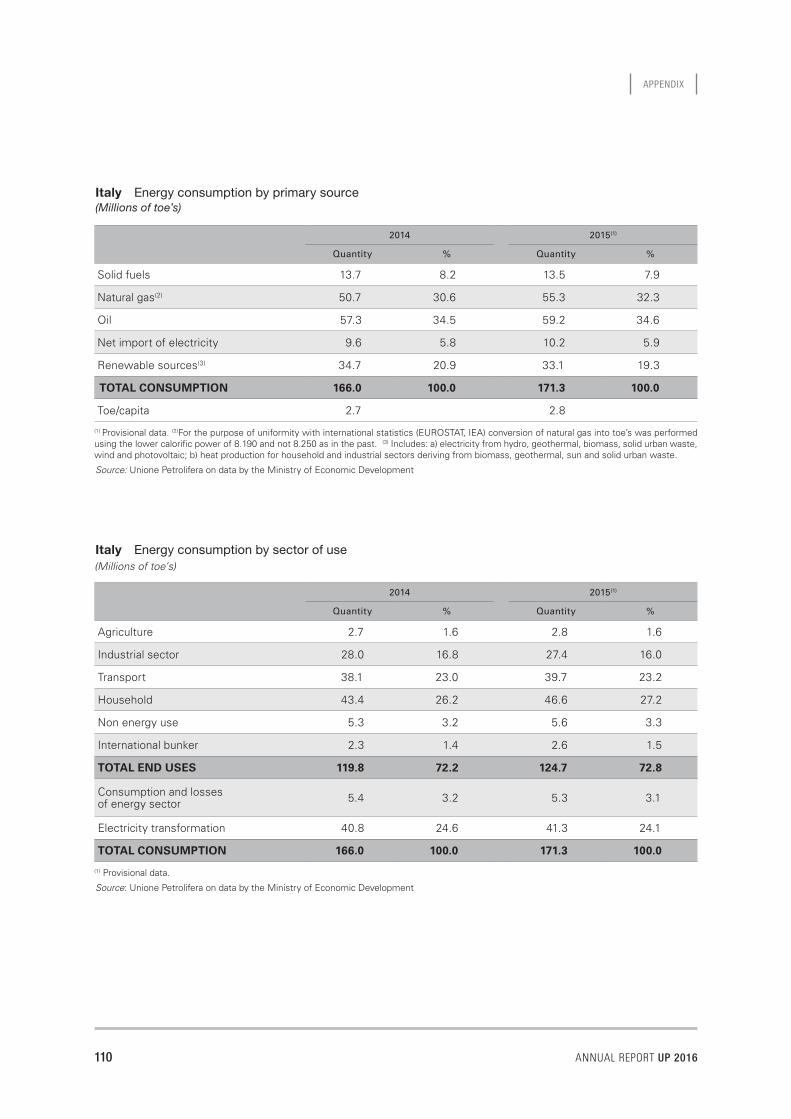
APPENDIX
110 ANNUAL REPORT UP 2016
Italy Energy consumption by primary source (Millions of toe’s)
2014 2015(1)
Quantity % Quantity %
Solid fuels 13.7 8.2 13.5 7.9
Natural gas(2) 50.7 30.6 55.3 32.3
Oil 57.3 34.5 59.2 34.6
Net import of electricity 9.6 5.8 10.2 5.9
Renewable sources(3) 34.7 20.9 33.1 19.3
TOTAL CONSUMPTION 166.0 100.0 171.3 100.0
Toe/capita 2.7 2.8
(1) Provisional data. (2)For the purpose of uniformity with international statistics (EUROSTAT, IEA) conversion of natural gas into toe’s was performed using the lower calorific power of 8.190 and not 8.250 as in the past. (3) Includes: a) electricity from hydro, geothermal, biomass, solid urban waste, wind and photovoltaic; b) heat production for household and industrial sectors deriving from biomass, geothermal, sun and solid urban waste.
Source: Unione Petrolifera on data by the Ministry of Economic Development
Italy Energy consumption by sector of use(Millions of toe’s)
2014 2015(1)
Quantity % Quantity %
Agriculture 2.7 1.6 2.8 1.6
Industrial sector 28.0 16.8 27.4 16.0
Transport 38.1 23.0 39.7 23.2
Household 43.4 26.2 46.6 27.2
Non energy use 5.3 3.2 5.6 3.3
International bunker 2.3 1.4 2.6 1.5
TOTAL END USES 119.8 72.2 124.7 72.8
Consumption and losses of energy sector 5.4 3.2 5.3 3.1
Electricity transformation 40.8 24.6 41.3 24.1
TOTAL CONSUMPTION 166.0 100.0 171.3 100.0
(1) Provisional data.
Source: Unione Petrolifera on data by the Ministry of Economic Development
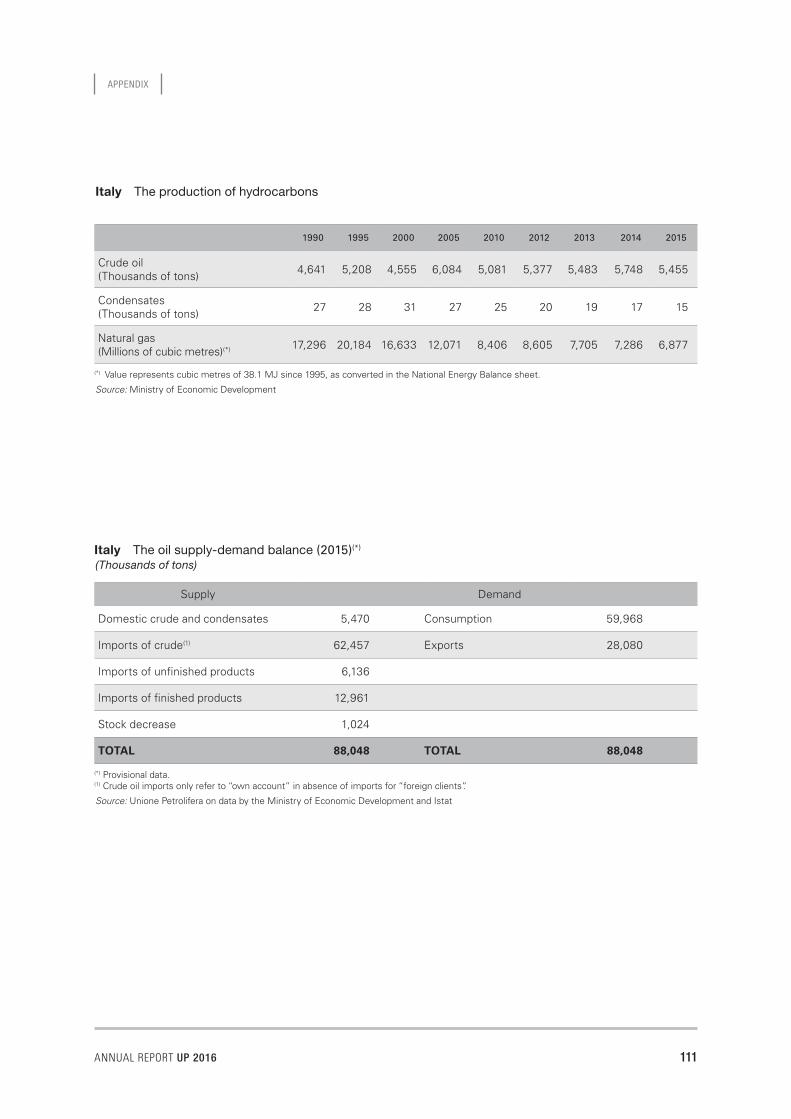
APPENDIX
ANNUAL REPORT UP 2016 111
Italy The production of hydrocarbons
1990 1995 2000 2005 2010 2012 2013 2014 2015
Crude oil (Thousands of tons) 4,641 5,208 4,555 6,084 5,081 5,377 5,483 5,748 5,455
Condensates (Thousands of tons) 27 28 31 27 25 20 19 17 15
Natural gas(Millions of cubic metres)(*) 17,296 20,184 16,633 12,071 8,406 8,605 7,705 7,286 6,877
(*) Value represents cubic metres of 38.1 MJ since 1995, as converted in the National Energy Balance sheet.
Source: Ministry of Economic Development
Italy The oil supply-demand balance (2015)(*) (Thousands of tons)
Supply Demand
Domestic crude and condensates 5,470 Consumption 59,968
Imports of crude(1) 62,457 Exports 28,080
Imports of unfinished products 6,136
Imports of finished products 12,961
Stock decrease 1,024
TOTAL 88,048 TOTAL 88,048
(*) Provisional data. (1) Crude oil imports only refer to “own account” in absence of imports for “foreign clients”.
Source: Unione Petrolifera on data by the Ministry of Economic Development and Istat
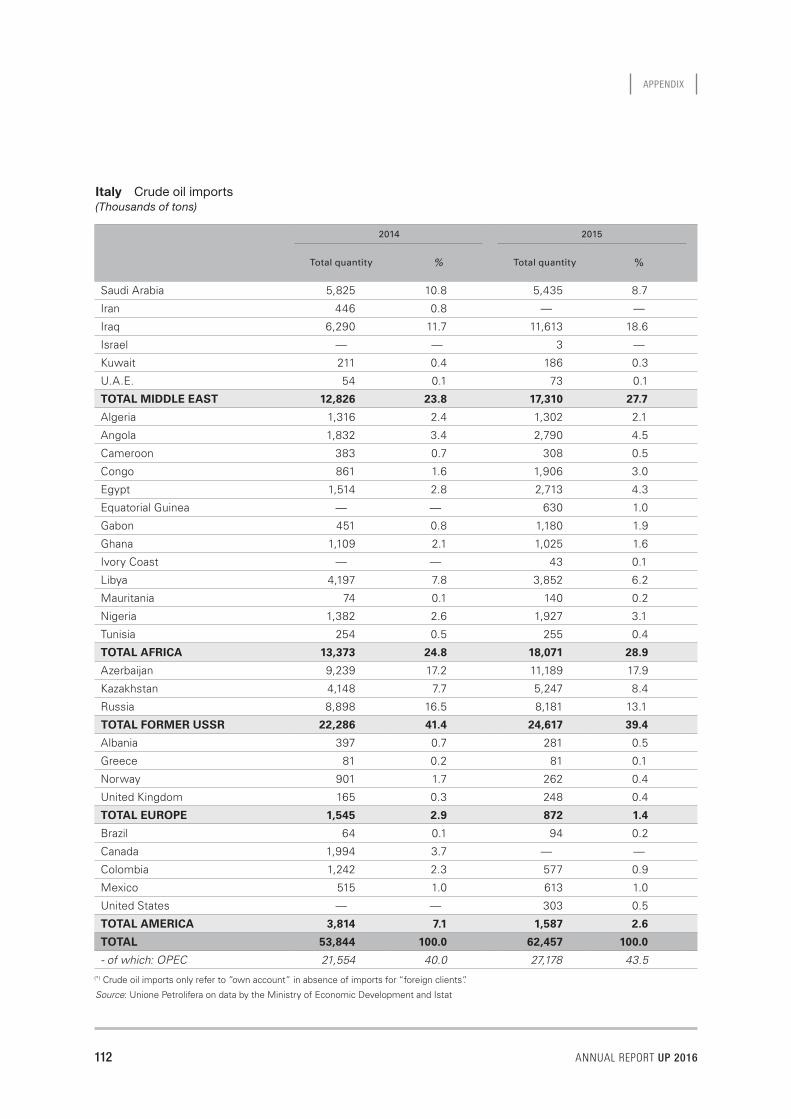
APPENDIX
112 ANNUAL REPORT UP 2016
Italy Crude oil imports(Thousands of tons)
2014 2015
Total quantity % Total quantity %
Saudi Arabia 5,825 10.8 5,435 8.7
Iran 446 0.8 — —
Iraq 6,290 11.7 11,613 18.6
Israel — — 3 —
Kuwait 211 0.4 186 0.3
U.A.E. 54 0.1 73 0.1
TOTAL MIDDLE EAST 12,826 23.8 17,310 27.7
Algeria 1,316 2.4 1,302 2.1
Angola 1,832 3.4 2,790 4.5
Cameroon 383 0.7 308 0.5
Congo 861 1.6 1,906 3.0
Egypt 1,514 2.8 2,713 4.3
Equatorial Guinea — — 630 1.0
Gabon 451 0.8 1,180 1.9
Ghana 1,109 2.1 1,025 1.6
Ivory Coast — — 43 0.1
Libya 4,197 7.8 3,852 6.2
Mauritania 74 0.1 140 0.2
Nigeria 1,382 2.6 1,927 3.1
Tunisia 254 0.5 255 0.4
TOTAL AFRICA 13,373 24.8 18,071 28.9
Azerbaijan 9,239 17.2 11,189 17.9
Kazakhstan 4,148 7.7 5,247 8.4
Russia 8,898 16.5 8,181 13.1
TOTAL FORMER USSR 22,286 41.4 24,617 39.4
Albania 397 0.7 281 0.5
Greece 81 0.2 81 0.1
Norway 901 1.7 262 0.4
United Kingdom 165 0.3 248 0.4
TOTAL EUROPE 1,545 2.9 872 1.4
Brazil 64 0.1 94 0.2
Canada 1,994 3.7 — —
Colombia 1,242 2.3 577 0.9
Mexico 515 1.0 613 1.0
United States — — 303 0.5
TOTAL AMERICA 3,814 7.1 1,587 2.6
TOTAL 53,844 100.0 62,457 100.0
- of which: OPEC 21,554 40.0 27,178 43.5 (*) Crude oil imports only refer to ”own account” in absence of imports for “foreign clients”.
Source: Unione Petrolifera on data by the Ministry of Economic Development and Istat
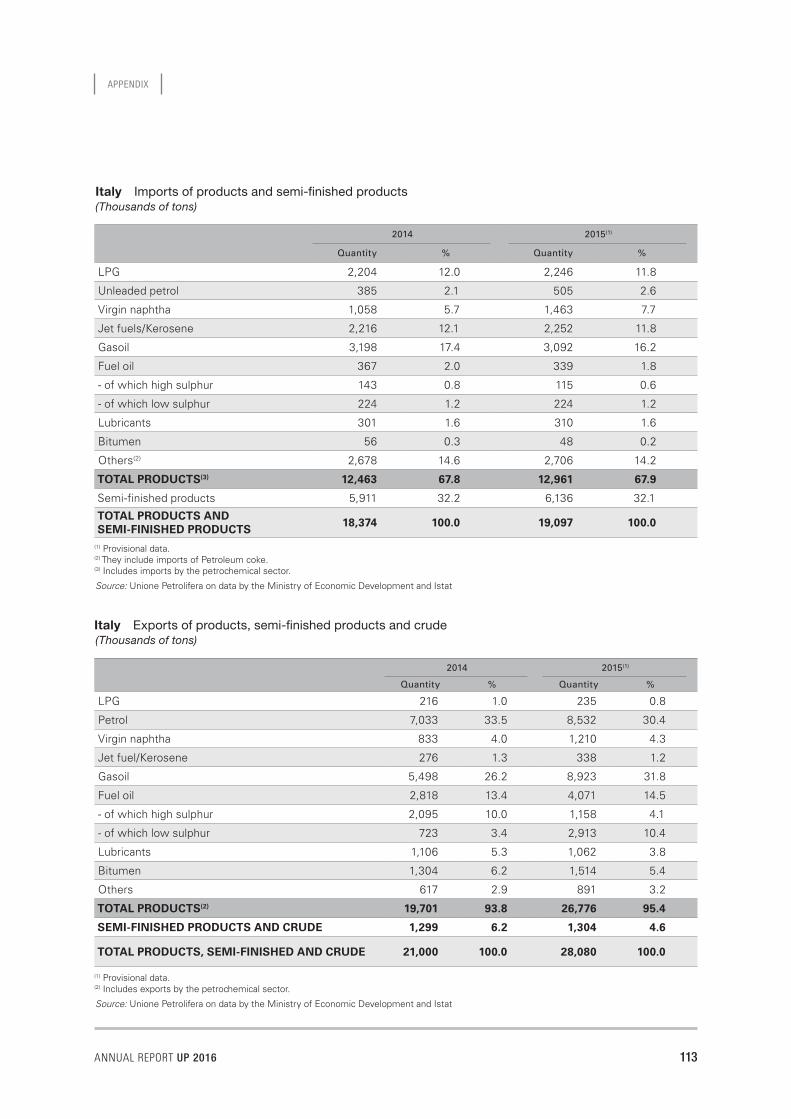
APPENDIX
ANNUAL REPORT UP 2016 113
Italy Exports of products, semi-finished products and crude(Thousands of tons)
2014 2015(1)
Quantity % Quantity %
LPG 216 1.0 235 0.8
Petrol 7,033 33.5 8,532 30.4
Virgin naphtha 833 4.0 1,210 4.3
Jet fuel/Kerosene 276 1.3 338 1.2
Gasoil 5,498 26.2 8,923 31.8
Fuel oil 2,818 13.4 4,071 14.5
- of which high sulphur 2,095 10.0 1,158 4.1
- of which low sulphur 723 3.4 2,913 10.4
Lubricants 1,106 5.3 1,062 3.8
Bitumen 1,304 6.2 1,514 5.4
Others 617 2.9 891 3.2
TOTAL PRODUCTS(2) 19,701 93.8 26,776 95.4
SEMI-FINISHED PRODUCTS AND CRUDE 1,299 6.2 1,304 4.6
TOTAL PRODUCTS, SEMI-FINISHED AND CRUDE 21,000 100.0 28,080 100.0
(1) Provisional data.(2) Includes exports by the petrochemical sector.
Source: Unione Petrolifera on data by the Ministry of Economic Development and Istat
Italy Imports of products and semi-finished products(Thousands of tons)
2014 2015(1)
Quantity % Quantity %
LPG 2,204 12.0 2,246 11.8
Unleaded petrol 385 2.1 505 2.6
Virgin naphtha 1,058 5.7 1,463 7.7
Jet fuels/Kerosene 2,216 12.1 2,252 11.8
Gasoil 3,198 17.4 3,092 16.2
Fuel oil 367 2.0 339 1.8
- of which high sulphur 143 0.8 115 0.6
- of which low sulphur 224 1.2 224 1.2
Lubricants 301 1.6 310 1.6
Bitumen 56 0.3 48 0.2
Others(2) 2,678 14.6 2,706 14.2
TOTAL PRODUCTS(3) 12,463 67.8 12,961 67.9
Semi-finished products 5,911 32.2 6,136 32.1
TOTAL PRODUCTS AND SEMI-FINISHED PRODUCTS
18,374 100.0 19,097 100.0
(1) Provisional data.(2) They include imports of Petroleum coke.(3) Includes imports by the petrochemical sector.
Source: Unione Petrolifera on data by the Ministry of Economic Development and Istat
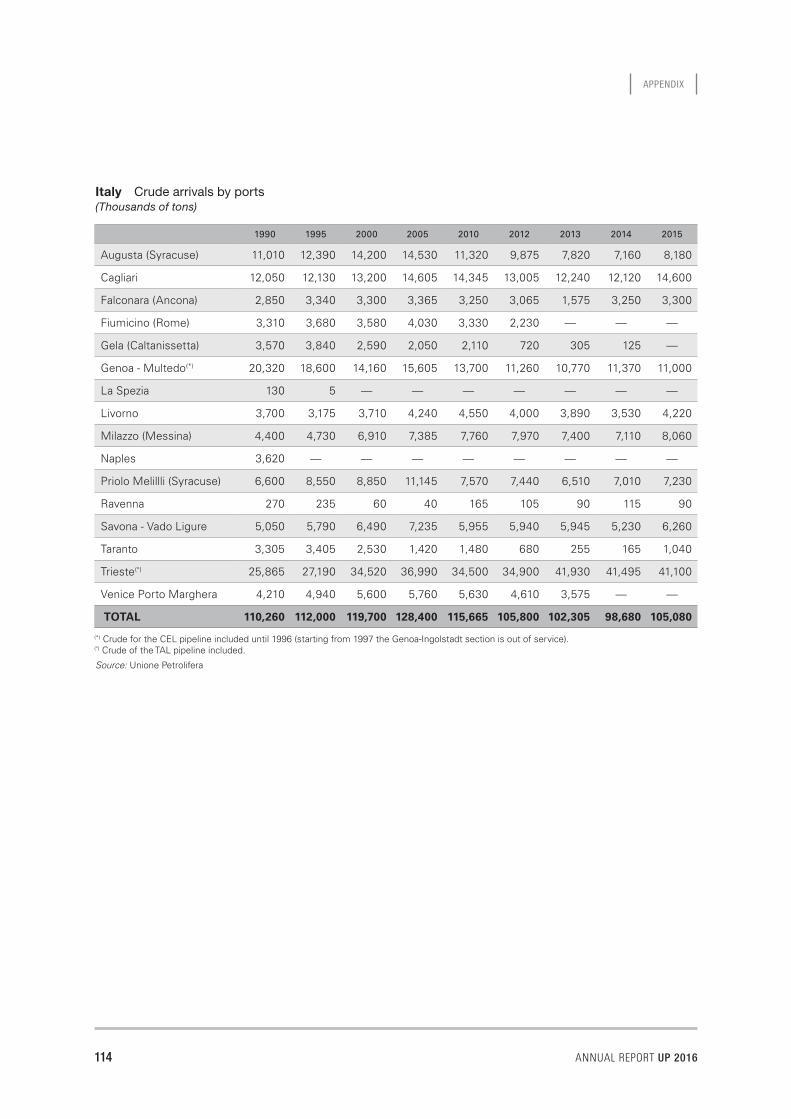
APPENDIX
114 ANNUAL REPORT UP 2016
Italy Crude arrivals by ports(Thousands of tons)
1990 1995 2000 2005 2010 2012 2013 2014 2015
Augusta (Syracuse) 11,010 12,390 14,200 14,530 11,320 9,875 7,820 7,160 8,180
Cagliari 12,050 12,130 13,200 14,605 14,345 13,005 12,240 12,120 14,600
Falconara (Ancona) 2,850 3,340 3,300 3,365 3,250 3,065 1,575 3,250 3,300
Fiumicino (Rome) 3,310 3,680 3,580 4,030 3,330 2,230 — — —
Gela (Caltanissetta) 3,570 3,840 2,590 2,050 2,110 720 305 125 —
Genoa - Multedo(*) 20,320 18,600 14,160 15,605 13,700 11,260 10,770 11,370 11,000
La Spezia 130 5 — — — — — — —
Livorno 3,700 3,175 3,710 4,240 4,550 4,000 3,890 3,530 4,220
Milazzo (Messina) 4,400 4,730 6,910 7,385 7,760 7,970 7,400 7,110 8,060
Naples 3,620 — — — — — — — —
Priolo Melillli (Syracuse) 6,600 8,550 8,850 11,145 7,570 7,440 6,510 7,010 7,230
Ravenna 270 235 60 40 165 105 90 115 90
Savona - Vado Ligure 5,050 5,790 6,490 7,235 5,955 5,940 5,945 5,230 6,260
Taranto 3,305 3,405 2,530 1,420 1,480 680 255 165 1,040
Trieste(°) 25,865 27,190 34,520 36,990 34,500 34,900 41,930 41,495 41,100
Venice Porto Marghera 4,210 4,940 5,600 5,760 5,630 4,610 3,575 — —
TOTAL 110,260 112,000 119,700 128,400 115,665 105,800 102,305 98,680 105,080
(*) Crude for the CEL pipeline included until 1996 (starting from 1997 the Genoa-Ingolstadt section is out of service).(°) Crude of the TAL pipeline included.
Source: Unione Petrolifera
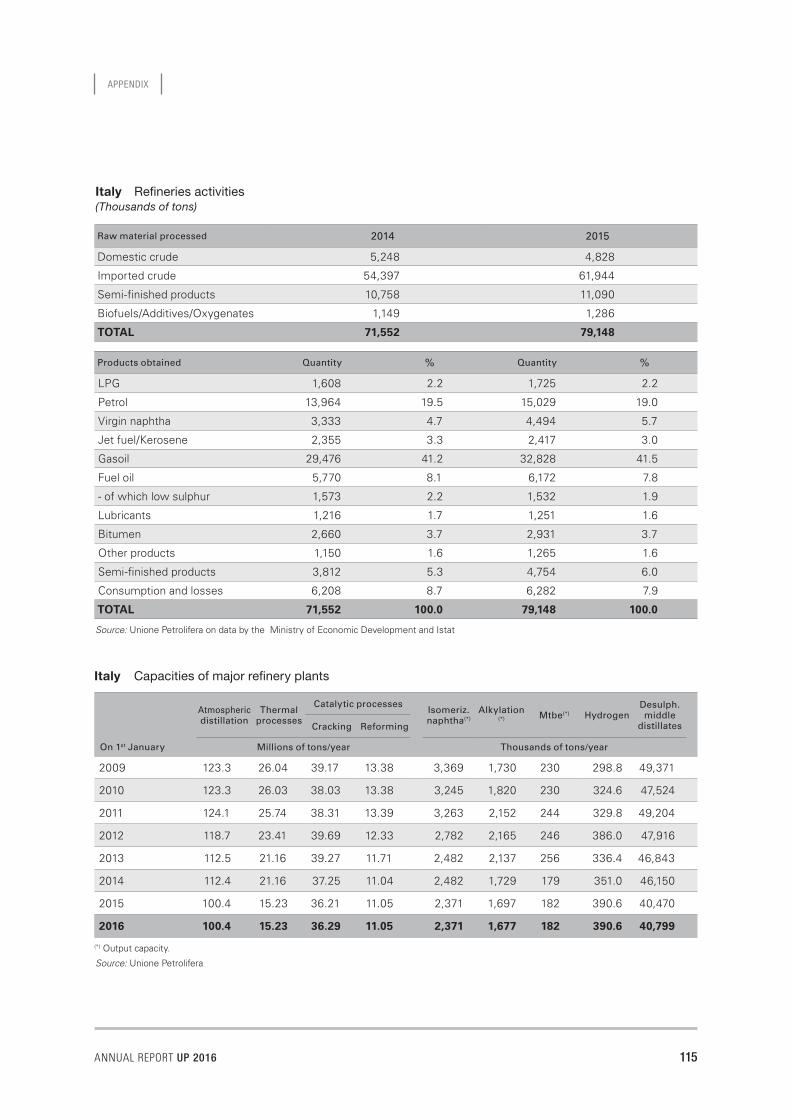
APPENDIX
ANNUAL REPORT UP 2016 115
Italy Refineries activities(Thousands of tons)
Raw material processed 2014 2015
Domestic crude 5,248 4,828
Imported crude 54,397 61,944
Semi-finished products 10,758 11,090
Biofuels/Additives/Oxygenates 1,149 1,286
TOTAL 71,552 79,148
Products obtained Quantity % Quantity %
LPG 1,608 2.2 1,725 2.2
Petrol 13,964 19.5 15,029 19.0
Virgin naphtha 3,333 4.7 4,494 5.7
Jet fuel/Kerosene 2,355 3.3 2,417 3.0
Gasoil 29,476 41.2 32,828 41.5
Fuel oil 5,770 8.1 6,172 7.8
- of which low sulphur 1,573 2.2 1,532 1.9
Lubricants 1,216 1.7 1,251 1.6
Bitumen 2,660 3.7 2,931 3.7
Other products 1,150 1.6 1,265 1.6
Semi-finished products 3,812 5.3 4,754 6.0
Consumption and losses 6,208 8.7 6,282 7.9
TOTAL 71,552 100.0 79,148 100.0
Source: Unione Petrolifera on data by the Ministry of Economic Development and Istat
Italy Capacities of major refinery plants
Atmosphericdistillation
Thermalprocesses
Catalytic processesIsomeriz.naphtha(*)
Alkylation(*) Mtbe(*) Hydrogen
Desulph.middle
distillatesCracking Reforming
On 1st January Millions of tons/year Thousands of tons/year
2009 123.3 26.04 39.17 13.38 3,369 1,730 230 298.8 49,371
2010 123.3 26.03 38.03 13.38 3,245 1,820 230 324.6 47,524
2011 124.1 25.74 38.31 13.39 3,263 2,152 244 329.8 49,204
2012 118.7 23.41 39.69 12.33 2,782 2,165 246 386.0 47,916
2013 112.5 21.16 39.27 11.71 2,482 2,137 256 336.4 46,843
2014 112.4 21.16 37.25 11.04 2,482 1,729 179 351.0 46,150
2015 100.4 15.23 36.21 11.05 2,371 1,697 182 390.6 40,470
2016 100.4 15.23 36.29 11.05 2,371 1,677 182 390.6 40,799
(*) Output capacity.
Source: Unione Petrolifera
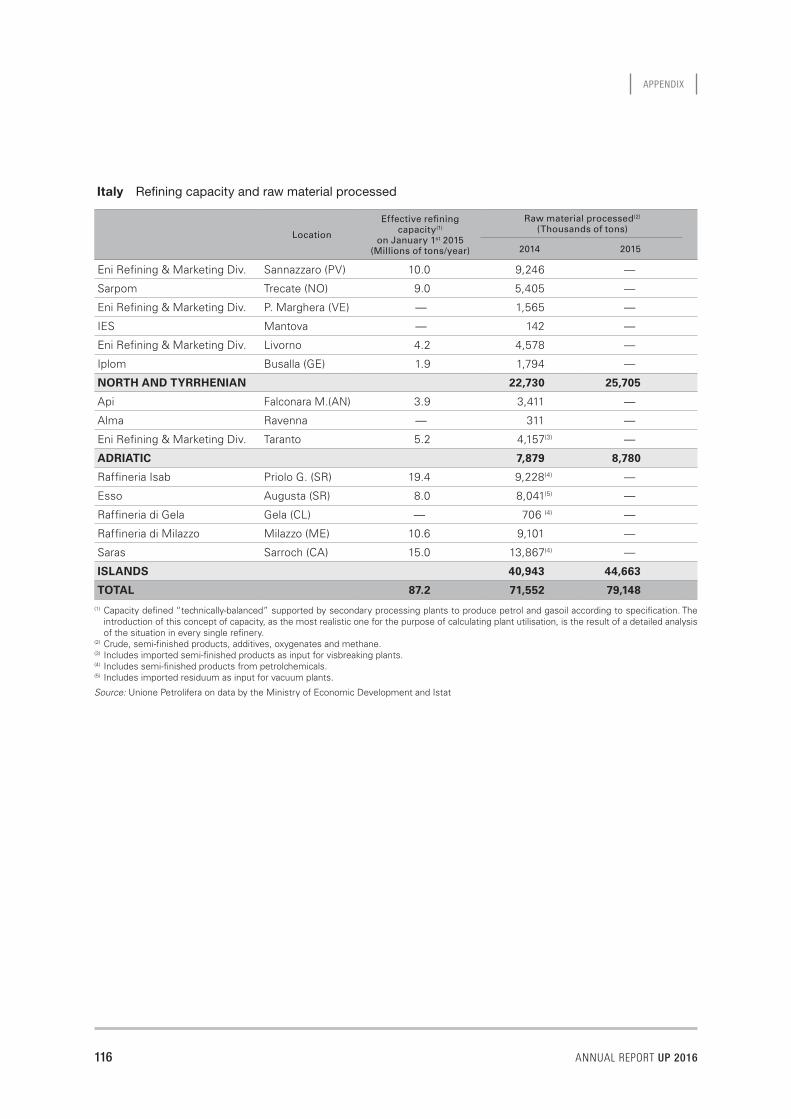
APPENDIX
116 ANNUAL REPORT UP 2016
Italy Refining capacity and raw material processed
Location
Effective refiningcapacity(1)
on January 1st 2015(Millions of tons/year)
Raw material processed(2)
(Thousands of tons)
2014 2015
Eni Refining & Marketing Div. Sannazzaro (PV) 10.0 9,246 —
Sarpom Trecate (NO) 9.0 5,405 —
Eni Refining & Marketing Div. P. Marghera (VE) — 1,565 —
IES Mantova — 142 —
Eni Refining & Marketing Div. Livorno 4.2 4,578 —
Iplom Busalla (GE) 1.9 1,794 —
NORTH AND TYRRHENIAN 22,730 25,705
Api Falconara M.(AN) 3.9 3,411 —
Alma Ravenna — 311 —
Eni Refining & Marketing Div. Taranto 5.2 4,157(3) —
ADRIATIC 7,879 8,780
Raffineria Isab Priolo G. (SR) 19.4 9,228(4) —
Esso Augusta (SR) 8.0 8,041(5) —
Raffineria di Gela Gela (CL) — 706 (4) —
Raffineria di Milazzo Milazzo (ME) 10.6 9,101 —
Saras Sarroch (CA) 15.0 13,867(4) —
ISLANDS 40,943 44,663
TOTAL 87.2 71,552 79,148(1) Capacity defined “technically-balanced” supported by secondary processing plants to produce petrol and gasoil according to specification. The
introduction of this concept of capacity, as the most realistic one for the purpose of calculating plant utilisation, is the result of a detailed analysis of the situation in every single refinery.
(2) Crude, semi-finished products, additives, oxygenates and methane.(3) Includes imported semi-finished products as input for visbreaking plants.(4) Includes semi-finished products from petrolchemicals.(5) Includes imported residuum as input for vacuum plants.
Source: Unione Petrolifera on data by the Ministry of Economic Development and Istat
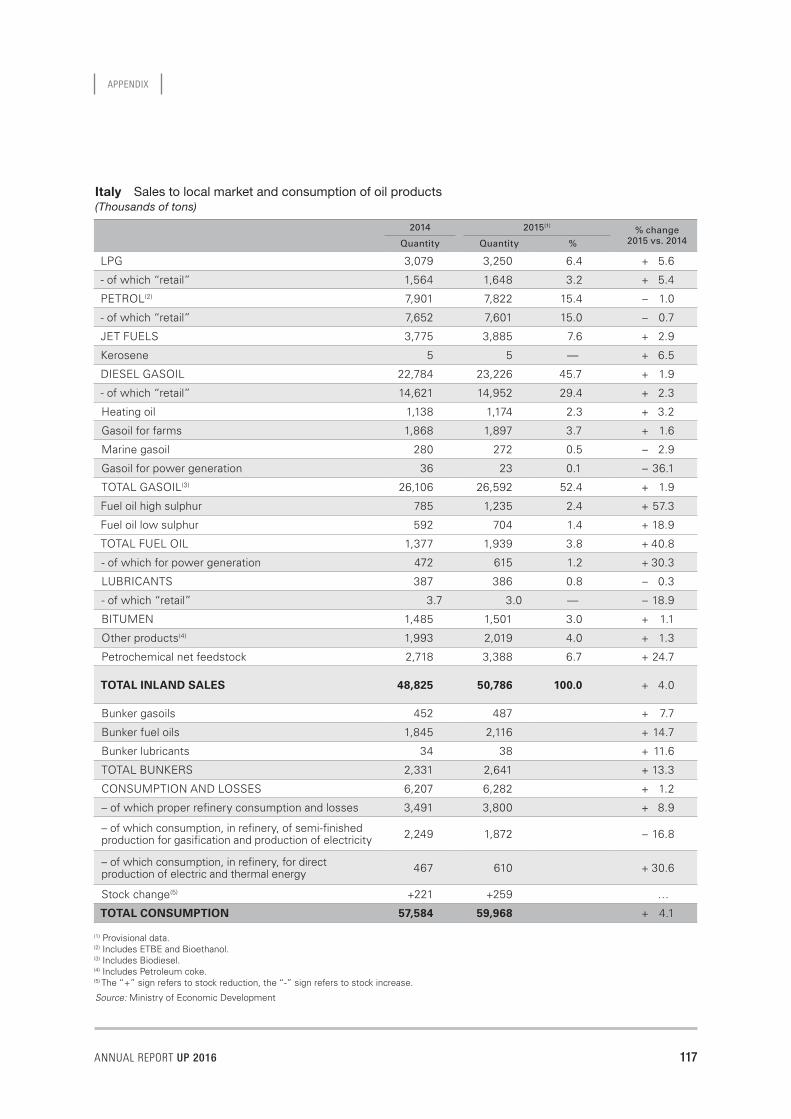
APPENDIX
ANNUAL REPORT UP 2016 117
Italy Sales to local market and consumption of oil products(Thousands of tons)
2014 2015(1)% change
2015 vs. 2014Quantity Quantity %
LPG 3,079 3,250 6.4 + 5.6
- of which “retail” 1,564 1,648 3.2 + 5.4
PETROL(2) 7,901 7,822 15.4 – 1.0
- of which “retail” 7,652 7,601 15.0 – 0.7
JET FUELS 3,775 3,885 7.6 + 2.9
Kerosene 5 5 — + 6.5
DIESEL GASOIL 22,784 23,226 45.7 + 1.9
- of which “retail” 14,621 14,952 29.4 + 2.3
Heating oil 1,138 1,174 2.3 + 3.2
Gasoil for farms 1,868 1,897 3.7 + 1.6
Marine gasoil 280 272 0.5 – 2.9
Gasoil for power generation 36 23 0.1 – 36.1
TOTAL GASOIL(3) 26,106 26,592 52.4 + 1.9
Fuel oil high sulphur 785 1,235 2.4 + 57.3
Fuel oil low sulphur 592 704 1.4 + 18.9
TOTAL FUEL OIL 1,377 1,939 3.8 + 40.8
- of which for power generation 472 615 1.2 + 30.3
LUBRICANTS 387 386 0.8 – 0.3
- of which “retail” 3.7 3.0 — – 18.9
BITUMEN 1,485 1,501 3.0 + 1.1
Other products(4) 1,993 2,019 4.0 + 1.3
Petrochemical net feedstock 2,718 3,388 6.7 + 24.7
TOTAL INLAND SALES 48,825 50,786 100.0 + 4.0
Bunker gasoils 452 487 + 7.7
Bunker fuel oils 1,845 2,116 + 14.7
Bunker lubricants 34 38 + 11.6
TOTAL BUNKERS 2,331 2,641 + 13.3
CONSUMPTION AND LOSSES 6,207 6,282 + 1.2
– of which proper refinery consumption and losses 3,491 3,800 + 8.9
– of which consumption, in refinery, of semi-finishedproduction for gasification and production of electricity 2,249 1,872 – 16.8
– of which consumption, in refinery, for directproduction of electric and thermal energy 467 610 + 30.6
Stock change(5) +221 +259 …
TOTAL CONSUMPTION 57,584 59,968 + 4.1
(1) Provisional data.(2) Includes ETBE and Bioethanol.(3) Includes Biodiesel.(4) Includes Petroleum coke.(5) The “+” sign refers to stock reduction, the “-” sign refers to stock increase.
Source: Ministry of Economic Development
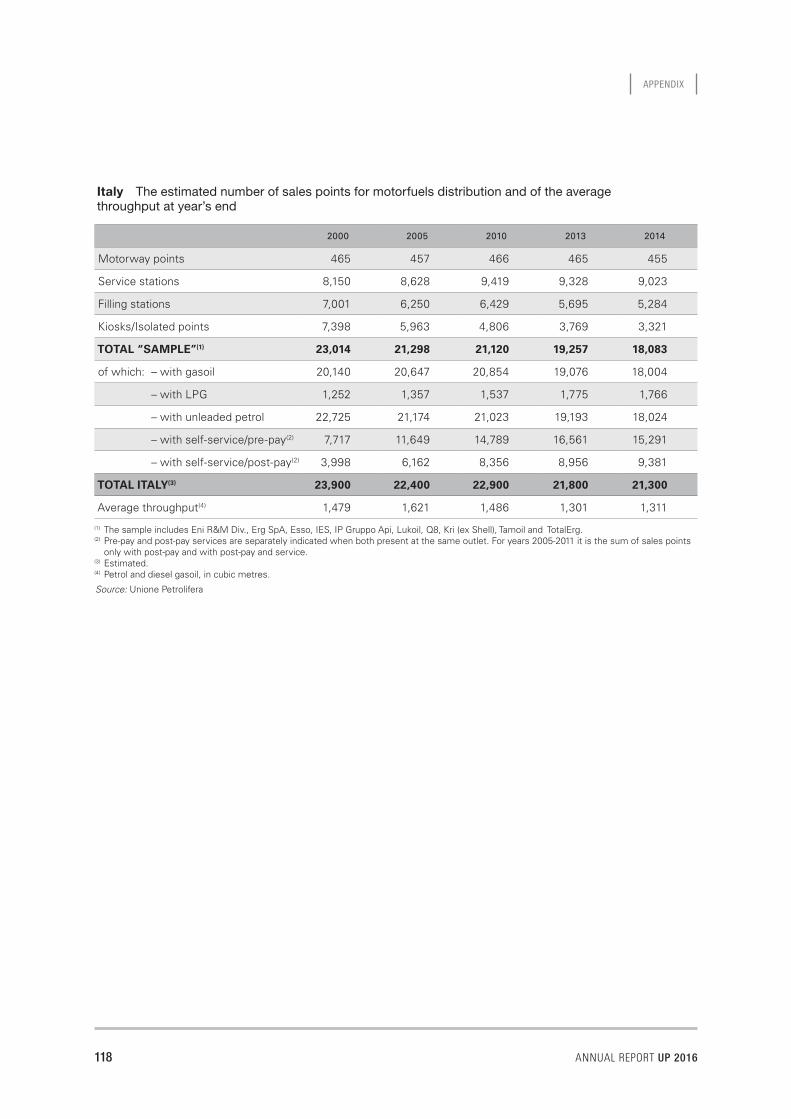
APPENDIX
118 ANNUAL REPORT UP 2016
Italy The estimated number of sales points for motorfuels distribution and of the average throughput at year’s end
2000 2005 2010 2013 2014
Motorway points 465 457 466 465 455
Service stations 8,150 8,628 9,419 9,328 9,023
Filling stations 7,001 6,250 6,429 5,695 5,284
Kiosks/Isolated points 7,398 5,963 4,806 3,769 3,321
TOTAL “SAMPLE”(1) 23,014 21,298 21,120 19,257 18,083
of which: – with gasoil 20,140 20,647 20,854 19,076 18,004
– with LPG 1,252 1,357 1,537 1,775 1,766
– with unleaded petrol 22,725 21,174 21,023 19,193 18,024
– with self-service/pre-pay(2) 7,717 11,649 14,789 16,561 15,291
– with self-service/post-pay(2) 3,998 6,162 8,356 8,956 9,381
TOTAL ITALY(3) 23,900 22,400 22,900 21,800 21,300
Average throughput(4) 1,479 1,621 1,486 1,301 1,311
(1) The sample includes Eni R&M Div., Erg SpA, Esso, IES, IP Gruppo Api, Lukoil, Q8, Kri (ex Shell), Tamoil and TotalErg.(2) Pre-pay and post-pay services are separately indicated when both present at the same outlet. For years 2005-2011 it is the sum of sales points
only with post-pay and with post-pay and service.(3) Estimated.(4) Petrol and diesel gasoil, in cubic metres.
Source: Unione Petrolifera
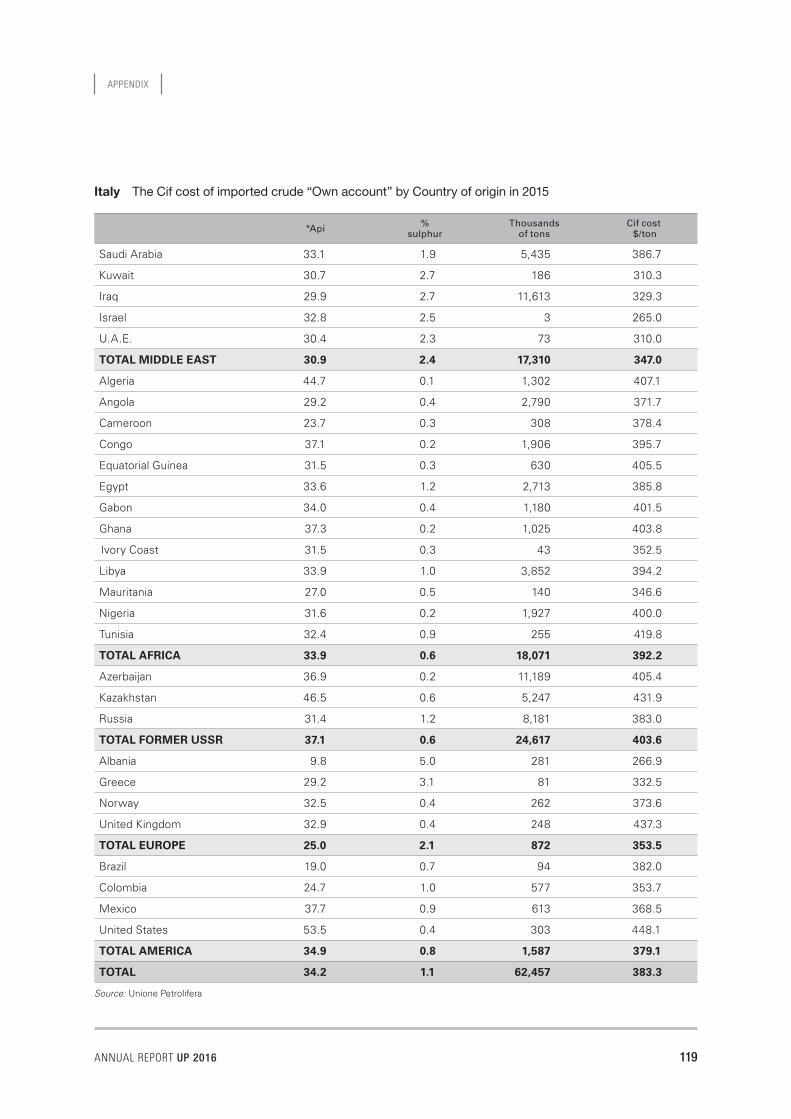
APPENDIX
ANNUAL REPORT UP 2016 119
Italy The Cif cost of imported crude “Own account” by Country of origin in 2015
°Api % sulphur
Thousands of tons
Cif cost $/ton
Saudi Arabia 33.1 1.9 5,435 386.7
Kuwait 30.7 2.7 186 310.3
Iraq 29.9 2.7 11,613 329.3
Israel 32.8 2.5 3 265.0
U.A.E. 30.4 2.3 73 310.0
TOTAL MIDDLE EAST 30.9 2.4 17,310 347.0
Algeria 44.7 0.1 1,302 407.1
Angola 29.2 0.4 2,790 371.7
Cameroon 23.7 0.3 308 378.4
Congo 37.1 0.2 1,906 395.7
Equatorial Guinea 31.5 0.3 630 405.5
Egypt 33.6 1.2 2,713 385.8
Gabon 34.0 0.4 1,180 401.5
Ghana 37.3 0.2 1,025 403.8
Ivory Coast 31.5 0.3 43 352.5
Libya 33.9 1.0 3,852 394.2
Mauritania 27.0 0.5 140 346.6
Nigeria 31.6 0.2 1,927 400.0
Tunisia 32.4 0.9 255 419.8
TOTAL AFRICA 33.9 0.6 18,071 392.2
Azerbaijan 36.9 0.2 11,189 405.4
Kazakhstan 46.5 0.6 5,247 431.9
Russia 31.4 1.2 8,181 383.0
TOTAL FORMER USSR 37.1 0.6 24,617 403.6
Albania 9.8 5.0 281 266.9
Greece 29.2 3.1 81 332.5
Norway 32.5 0.4 262 373.6
United Kingdom 32.9 0.4 248 437.3
TOTAL EUROPE 25.0 2.1 872 353.5
Brazil 19.0 0.7 94 382.0
Colombia 24.7 1.0 577 353.7
Mexico 37.7 0.9 613 368.5
United States 53.5 0.4 303 448.1
TOTAL AMERICA 34.9 0.8 1,587 379.1
TOTAL 34.2 1.1 62,457 383.3
Source: Unione Petrolifera
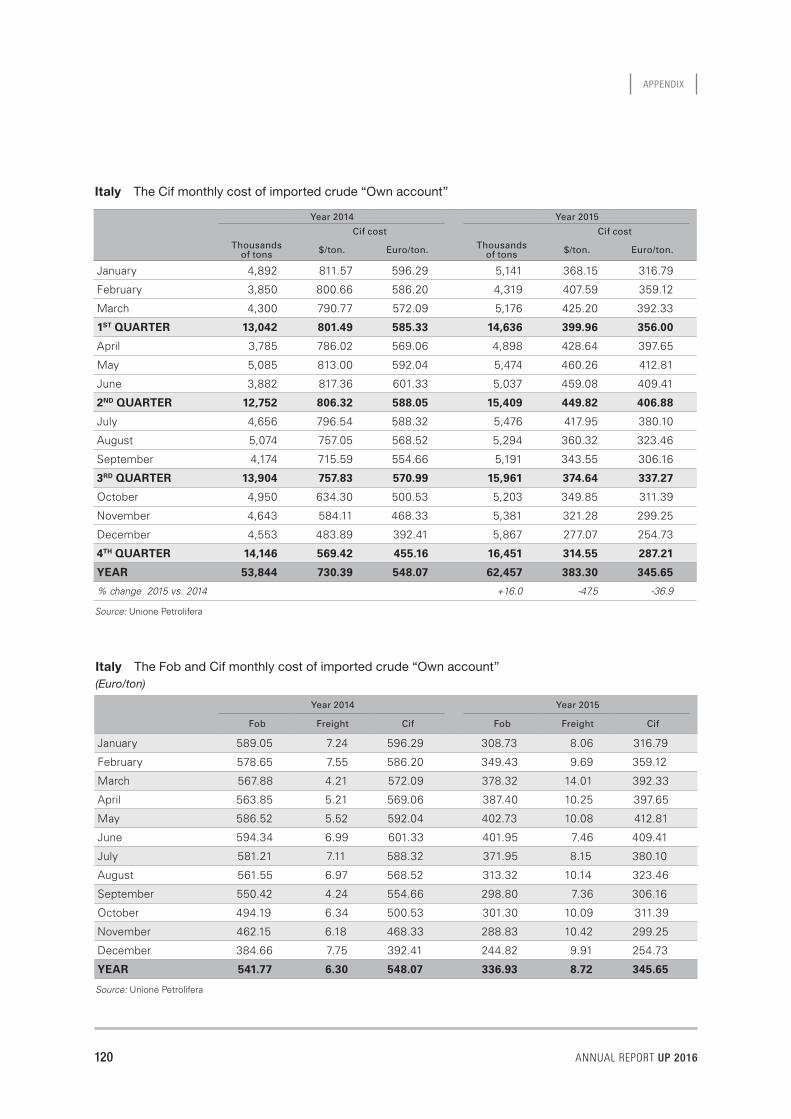
APPENDIX
120 ANNUAL REPORT UP 2016
Italy The Fob and Cif monthly cost of imported crude “Own account”(Euro/ton)
Year 2014 Year 2015
Fob Freight Cif Fob Freight Cif
January 589.05 7.24 596.29 308.73 8.06 316.79
February 578.65 7.55 586.20 349.43 9.69 359.12
March 567.88 4.21 572.09 378.32 14.01 392.33
April 563.85 5.21 569.06 387.40 10.25 397.65
May 586.52 5.52 592.04 402.73 10.08 412.81
June 594.34 6.99 601.33 401.95 7.46 409.41
July 581.21 7.11 588.32 371.95 8.15 380.10
August 561.55 6.97 568.52 313.32 10.14 323.46
September 550.42 4.24 554.66 298.80 7.36 306.16
October 494.19 6.34 500.53 301.30 10.09 311.39
November 462.15 6.18 468.33 288.83 10.42 299.25
December 384.66 7.75 392.41 244.82 9.91 254.73
YEAR 541.77 6.30 548.07 336.93 8.72 345.65
Source: Unione Petrolifera
Italy The Cif monthly cost of imported crude “Own account”
Year 2014 Year 2015
Cif cost Cif costThousands
of tons $/ton. Euro/ton. Thousandsof tons $/ton. Euro/ton.
January 4,892 811.57 596.29 5,141 368.15 316.79
February 3,850 800.66 586.20 4,319 407.59 359.12
March 4,300 790.77 572.09 5,176 425.20 392.33
1ST QUARTER 13,042 801.49 585.33 14,636 399.96 356.00
April 3,785 786.02 569.06 4,898 428.64 397.65
May 5,085 813.00 592.04 5,474 460.26 412.81
June 3,882 817.36 601.33 5,037 459.08 409.41
2ND QUARTER 12,752 806.32 588.05 15,409 449.82 406.88
July 4,656 796.54 588.32 5,476 417.95 380.10
August 5,074 757.05 568.52 5,294 360.32 323.46
September 4,174 715.59 554.66 5,191 343.55 306.16
3RD QUARTER 13,904 757.83 570.99 15,961 374.64 337.27
October 4,950 634.30 500.53 5,203 349.85 311.39
November 4,643 584.11 468.33 5,381 321.28 299.25
December 4,553 483.89 392.41 5,867 277.07 254.73
4TH QUARTER 14,146 569.42 455.16 16,451 314.55 287.21
YEAR 53,844 730.39 548.07 62,457 383.30 345.65
% change 2015 vs. 2014 +16.0 -47.5 -36.9
Source: Unione Petrolifera
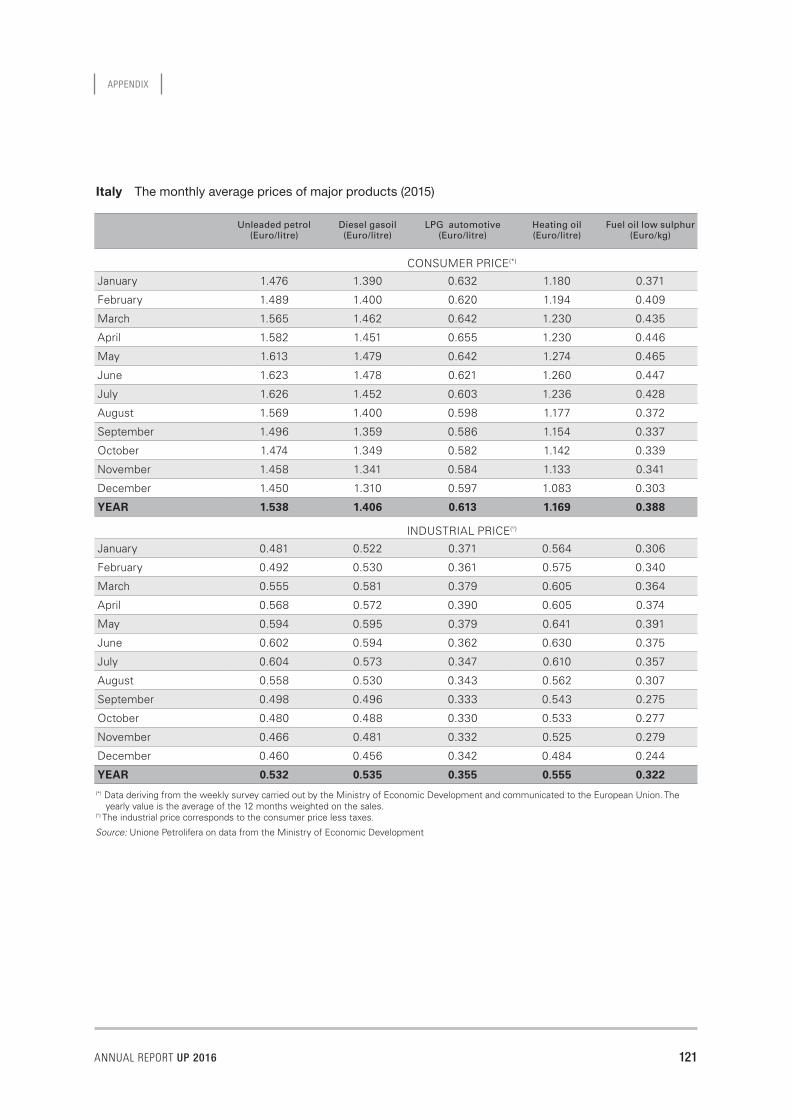
APPENDIX
ANNUAL REPORT UP 2016 121
Italy The monthly average prices of major products (2015)
Unleaded petrol(Euro/litre)
Diesel gasoil(Euro/litre)
LPG automotive(Euro/litre)
Heating oil(Euro/litre)
Fuel oil low sulphur(Euro/kg)
CONSUMER PRICE(*)
January 1.476 1.390 0.632 1.180 0.371
February 1.489 1.400 0.620 1.194 0.409
March 1.565 1.462 0.642 1.230 0.435
April 1.582 1.451 0.655 1.230 0.446
May 1.613 1.479 0.642 1.274 0.465
June 1.623 1.478 0.621 1.260 0.447
July 1.626 1.452 0.603 1.236 0.428
August 1.569 1.400 0.598 1.177 0.372
September 1.496 1.359 0.586 1.154 0.337
October 1.474 1.349 0.582 1.142 0.339
November 1.458 1.341 0.584 1.133 0.341
December 1.450 1.310 0.597 1.083 0.303
YEAR 1.538 1.406 0.613 1.169 0.388
INDUSTRIAL PRICE(°)
January 0.481 0.522 0.371 0.564 0.306
February 0.492 0.530 0.361 0.575 0.340
March 0.555 0.581 0.379 0.605 0.364
April 0.568 0.572 0.390 0.605 0.374
May 0.594 0.595 0.379 0.641 0.391
June 0.602 0.594 0.362 0.630 0.375
July 0.604 0.573 0.347 0.610 0.357
August 0.558 0.530 0.343 0.562 0.307
September 0.498 0.496 0.333 0.543 0.275
October 0.480 0.488 0.330 0.533 0.277
November 0.466 0.481 0.332 0.525 0.279
December 0.460 0.456 0.342 0.484 0.244
YEAR 0.532 0.535 0.355 0.555 0.322(*) Data deriving from the weekly survey carried out by the Ministry of Economic Development and communicated to the European Union. The
yearly value is the average of the 12 months weighted on the sales.(°) The industrial price corresponds to the consumer price less taxes.
Source: Unione Petrolifera on data from the Ministry of Economic Development
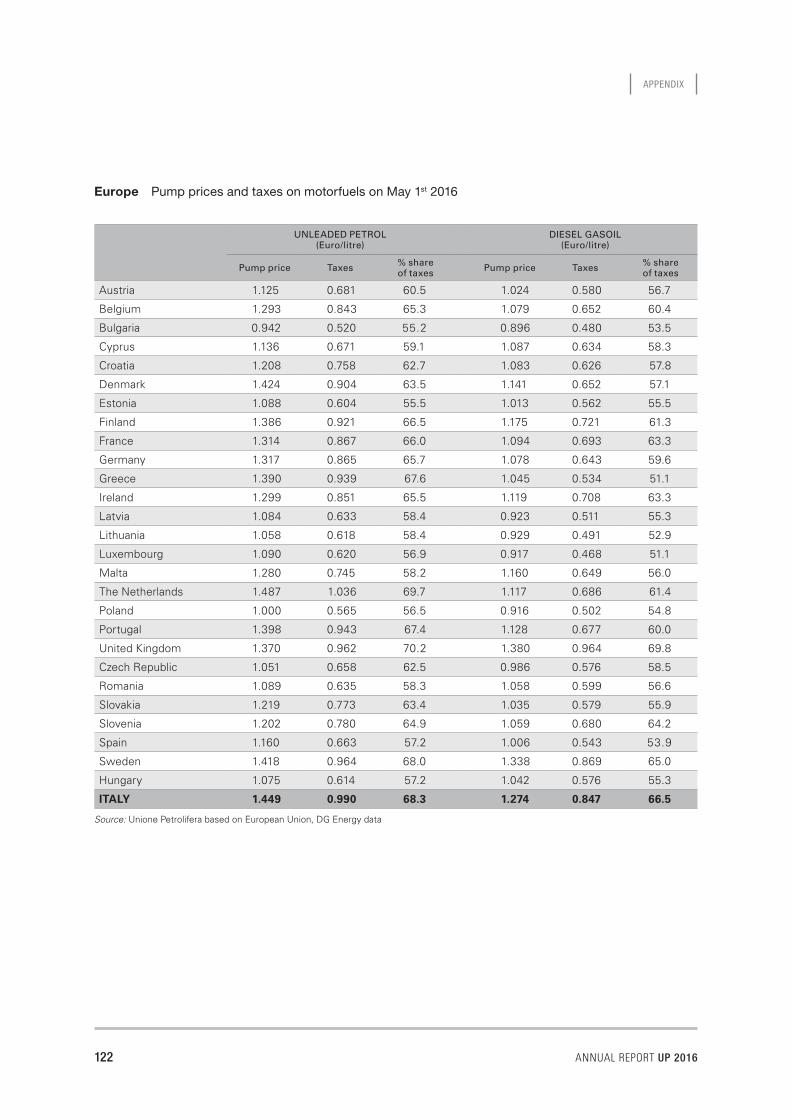
APPENDIX
122 ANNUAL REPORT UP 2016
Europe Pump prices and taxes on motorfuels on May 1st 2016
UNLEADED PETROL(Euro/litre)
DIESEL GASOIL(Euro/litre)
Pump price Taxes % shareof taxes Pump price Taxes % share
of taxes
Austria 1.125 0.681 60.5 1.024 0.580 56.7
Belgium 1.293 0.843 65.3 1.079 0.652 60.4
Bulgaria 0.942 0.520 55.2 0.896 0.480 53.5
Cyprus 1.136 0.671 59.1 1.087 0.634 58.3
Croatia 1.208 0.758 62.7 1.083 0.626 57.8
Denmark 1.424 0.904 63.5 1.141 0.652 57.1
Estonia 1.088 0.604 55.5 1.013 0.562 55.5
Finland 1.386 0.921 66.5 1.175 0.721 61.3
France 1.314 0.867 66.0 1.094 0.693 63.3
Germany 1.317 0.865 65.7 1.078 0.643 59.6
Greece 1.390 0.939 67.6 1.045 0.534 51.1
Ireland 1.299 0.851 65.5 1.119 0.708 63.3
Latvia 1.084 0.633 58.4 0.923 0.511 55.3
Lithuania 1.058 0.618 58.4 0.929 0.491 52.9
Luxembourg 1.090 0.620 56.9 0.917 0.468 51.1
Malta 1.280 0.745 58.2 1.160 0.649 56.0
The Netherlands 1.487 1.036 69.7 1.117 0.686 61.4
Poland 1.000 0.565 56.5 0.916 0.502 54.8
Portugal 1.398 0.943 67.4 1.128 0.677 60.0
United Kingdom 1.370 0.962 70.2 1.380 0.964 69.8
Czech Republic 1.051 0.658 62.5 0.986 0.576 58.5
Romania 1.089 0.635 58.3 1.058 0.599 56.6
Slovakia 1.219 0.773 63.4 1.035 0.579 55.9
Slovenia 1.202 0.780 64.9 1.059 0.680 64.2
Spain 1.160 0.663 57.2 1.006 0.543 53.9
Sweden 1.418 0.964 68.0 1.338 0.869 65.0
Hungary 1.075 0.614 57.2 1.042 0.576 55.3
ITALY 1.449 0.990 68.3 1.274 0.847 66.5
Source: Unione Petrolifera based on European Union, DG Energy data
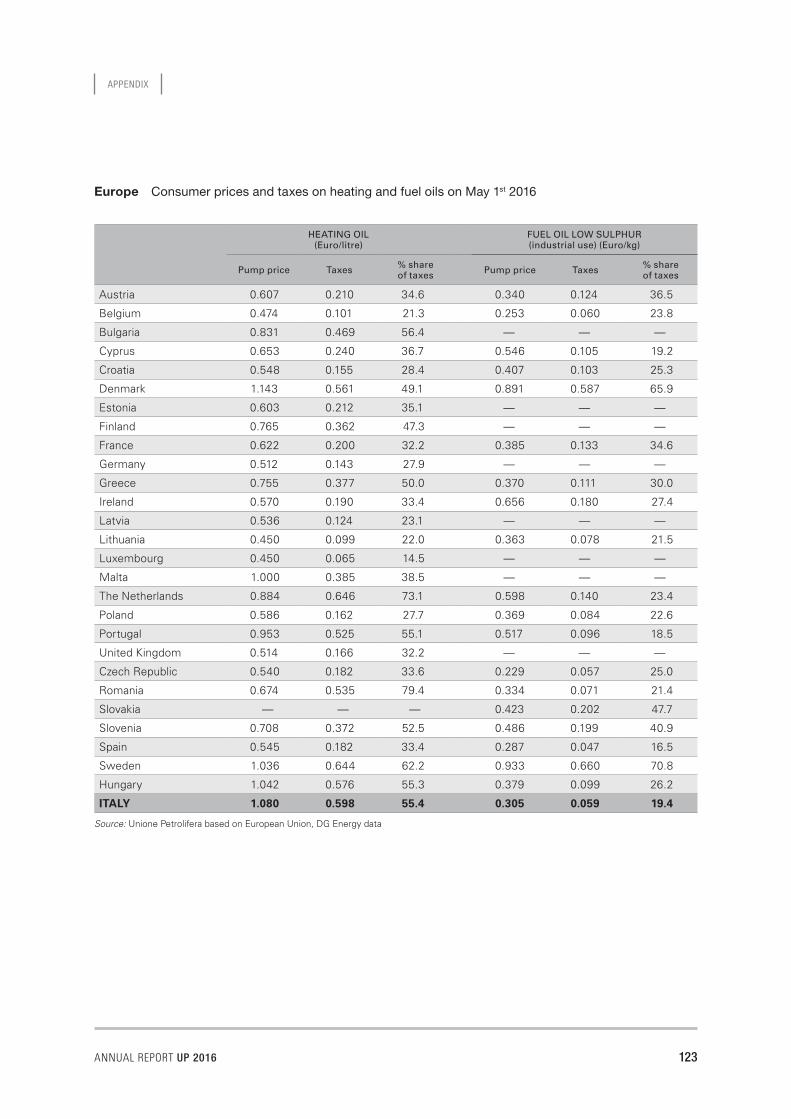
APPENDIX
ANNUAL REPORT UP 2016 123
Europe Consumer prices and taxes on heating and fuel oils on May 1st 2016
HEATING OIL(Euro/litre)
FUEL OIL LOW SULPHUR (industrial use) (Euro/kg)
Pump price Taxes % shareof taxes Pump price Taxes % share
of taxes
Austria 0.607 0.210 34.6 0.340 0.124 36.5
Belgium 0.474 0.101 21.3 0.253 0.060 23.8
Bulgaria 0.831 0.469 56.4 — — —
Cyprus 0.653 0.240 36.7 0.546 0.105 19.2
Croatia 0.548 0.155 28.4 0.407 0.103 25.3
Denmark 1.143 0.561 49.1 0.891 0.587 65.9
Estonia 0.603 0.212 35.1 — — —
Finland 0.765 0.362 47.3 — — —
France 0.622 0.200 32.2 0.385 0.133 34.6
Germany 0.512 0.143 27.9 — — —
Greece 0.755 0.377 50.0 0.370 0.111 30.0
Ireland 0.570 0.190 33.4 0.656 0.180 27.4
Latvia 0.536 0.124 23.1 — — —
Lithuania 0.450 0.099 22.0 0.363 0.078 21.5
Luxembourg 0.450 0.065 14.5 — — —
Malta 1.000 0.385 38.5 — — —
The Netherlands 0.884 0.646 73.1 0.598 0.140 23.4
Poland 0.586 0.162 27.7 0.369 0.084 22.6
Portugal 0.953 0.525 55.1 0.517 0.096 18.5
United Kingdom 0.514 0.166 32.2 — — —
Czech Republic 0.540 0.182 33.6 0.229 0.057 25.0
Romania 0.674 0.535 79.4 0.334 0.071 21.4
Slovakia — — — 0.423 0.202 47.7
Slovenia 0.708 0.372 52.5 0.486 0.199 40.9
Spain 0.545 0.182 33.4 0.287 0.047 16.5
Sweden 1.036 0.644 62.2 0.933 0.660 70.8
Hungary 1.042 0.576 55.3 0.379 0.099 26.2
ITALY 1.080 0.598 55.4 0.305 0.059 19.4
Source: Unione Petrolifera based on European Union, DG Energy data

Prepared by Unione PetroliferaPiazzale Luigi Sturzo n. 31
00144 Rome – Ph. +39.06.542.3651e-mail: [email protected]
website: www.unionepetrolifera.it
Graphic layout and printed by Saro Italia Srl (Rome)
July 2016

ANNUAL
REP
OR
T 20
16
ANNUALREPORT 2016
P i a z z a l e L u i g i S t u r z o , 3 1 - 0 0 1 4 4 R o m e
Ph. +39 06.542.3651 - Fax +39 06.596.029.25
www.unionepetrolifera.it
LET’S GETITALY
MOVING