letter of transmittal 3/18/02 1:59 pm page 1
TRANSCRIPT

letter of transmittal 3/18/02 1:59 PM Page 1

Statutory Requirements
In accordance with section 48 of the Central Bank of Malaysia Act 1958, Bank Negara Malaysiahereby publishes and has transmitted to the Minister of Finance a copy of this Annual Reporttogether with a copy of its Annual Accounts for the year ended 31 December 2001, which havebeen examined and certified by the Auditor-General. The Annual Accounts will also be publishedin the Gazette.
Zeti Akhtar AzizChairman
20 March 2002 Board of Directors
letter of transmittal 3/18/02 1:59 PM Page 2

Board of Directors
Dr. Zeti Akhtar AzizP.S.M., D.K. (Johor), D.P.M.J.Governor and Chairman
Dato’ Huang Sin ChengD.S.P.N., K.M.N., D.J.N.Deputy Governor
Dato’ Mohd Salleh bin Haji HarunD.S.D.K.Deputy Governor
Tan Sri Dato’ Dr. Samsudin bin HitamP.S.M., D.P.M.T., D.P.M.P., S.M.J., J.S.M., K.M.N., A.M.N.Secretary General to the Treasury
Datuk Oh Siew NamP.J.N.
Tan Sri Datuk Amar Haji Bujang bin Mohd. NorD.A., P.S.M., P.N.B.S., J.S.M., J.B.S., A.M.N., P.B.J.
Tan Sri Dato’ Dr. Mohd. Noordin bin Md. SopieeP.S.M., D.I.M.P., D.M.S.M.
Dato’ N. SadasivanD.P.M.P., J.S.M., K.M.N.
Tan Sri Dato’ Muhammad Ali bin Hashim resigned from the Board with effect from 5 December 2001.
letter of transmittal 3/18/02 1:59 PM Page 3

Governor Dr. Zeti Akhtar Aziz
Deputy Governor Dato’ Huang Sin Cheng Deputy Governor Dato’ Mohd Salleh bin Haji Harun
Assistant Governor Datuk Zamani bin Abdul Ghani Assistant Governor Dato’ Mohamad Daud bin Hj. Dol Moin Assistant Governor Datuk Latifah Merican CheongAssistant Governor Mohd Razif bin Abd. Kadir
Secretary to the Board Mohd Nor bin MashorPublic Relations Adviser To Governor Zailah Tun Dr. Ismail
Director/Head of DepartmentMonetary and Financial Policy Ismail bin Alowi Economics V. VijayaledchumyBank Regulation Nor Shamsiah binti Mohd Yunus Islamic Banking and Takaful Bakarudin bin IshakInvestment Operations and Financial Market Muhammad bin IbrahimBank Supervision I Azizan bin Haji Abd Rahman Bank Supervision II Donald Joshua Jaganathan Insurance Regulation Zakaria bin IsmailInsurance Supervision Wong Yew SenInternational Tan Sook PengForeign Exchange Administration Mahdi bin Mohd. Ariffin IT Services Hong Yang SingFinance Abdul Aziz bin Abdul ManafHuman Resource Management Mainor bin Awang Corporate Services Mohd Nor bin Mashor Corporate Communication -Payment Systems Ahmad Hizzad bin BaharuddinLegal Gopala Krishnan SundaramStatistical Services Chan Yan KitInternal Audit Yahaya bin Haji BesahHuman Resource Development Centre Lim Lai Hong Special Investigation Che Sab bin AhmadInformation Systems Supervision Ramli bin SaadRisk Management Teo Kee Tian Currency Management and Operation Hor Weng Keng Property and Services Zulkifli bin Abd RahmanStrategic Planning Mior Mohd Zain bin Mior Mohd TahirSecurity Che Norudin bin Che AlliDFI Regulation Che Zakiah binti Che DinFinancial Intelligence Koid Swee Lian
ManagerLondon Representative Office Lillian Leong Bee Lian New York Representative Office Shamsuddin bin Mohd Mahayiddin
Branch ManagerPulau Pinang Ong Boon TeckJohor Bahru Ahmad bin IsmailKota Kinabalu Yusoff bin YahayaKuching Marlene Margaret ak John NicholKuala Terengganu Md. Daud bin DaharShah Alam Hamzah bin Abu Bakar
letter of transmittal 3/18/02 1:59 PM Page 4

Governor’s Statement
In 2001, the global environment experienced unprecedented events that hadwidespread implications on the world economy. While Malaysia was affected by thesedevelopments, earlier efforts to strengthen the economic base, secure soundmacroeconomic fundamentals as well as restructure and reform the financial sectorenhanced Malaysia’s resilience in weathering the more difficult economic environment.Despite this more challenging environment, Malaysia has avoided a major economicdownturn with growth for the year remaining in positive territory at 0.4% andunemployment being contained at below 4%.
Growth was driven by domestic economic activities. Concerted efforts since thefinancial crisis to promote domestic sources of growth and reduce vulnerabilities toexternal shocks have shown positive results. Private consumption remained resilient,and together with the strong growth in public sector expenditure, cushioned theadverse impact on the domestic economy of the weaker external sector and thecontraction in domestic private investment. These developments contributed to positivegrowth in the domestic sectors of the economy, thus, mitigating the weaker growth inthe export-oriented manufacturing industries.
During the year, the macroeconomic fundamentals have strengthened, with inflationremaining below 2% and the external balance remaining robust with internationalreserves having increased to more than US$30 billion. Strong macroeconomicfundamentals and strengthened corporate and banking sector balance sheets have madeMalaysia well-positioned to tap the emerging global recovery to achieve stronger growthof 3.5% in 2002. Malaysia, nonetheless, is cognisant of the movement towards greatertrade and financial liberalisation in the global market place, which would have an impacton Malaysia’s economic performance. While nations attempt to ride out the currenteconomic slowdown, they are continuing to strengthen the mechanisms for globalintegration. The vicissitudes of global competition and technology continue to feature theemergence of new competitors and the easing of protectionist barriers. As economiesliberalise and adopt international practices, competition for investments will become moreintense. Both foreign direct investments (FDI) and portfolio investments already haveincreased choices following the opening up of new markets, especially those with largedomestic markets and low costs of operation.
The drive to sharpen the nation’s competitive edge takes on added importance as we seekto sustain our growth prospects and raise our standard of living. Structural reforms toachieve the most efficient and effective utilisation of our resources have been intensified.Demand management has aimed not only to provide a positive macroeconomicenvironment but has also focused on structural developments that will improve theenabling environment for businesses. Supply-side policy measures have focused oncapacity and institution building. These include raising the efficiency in the provision ofpublic services, lowering the cost of inputs and reducing the cost of doing business.Efforts have also been put in place to raise the capacity of firms through strengthening theknowledge base, narrowing the skills gap in information and communications technologyand enhancing technological capabilities. Dislocations arising from these adjustments havebeen minimal and business competitiveness has shown signs of improvement.

Malaysia has been a recipient of FDI over several decades, contributing to Malaysia’soverall development in terms of growth, employment, foreign exchange earnings andtransfer of technology. In recent years, FDI flows have become increasingly broad-basedacross all sectors, with the services sector now receiving a significant part of theseflows. The steady inflow of FDI has continued in 2001, in response to the newopportunities that Malaysia offers. There is a distinct shift in the nature of theinvestments towards higher value-added investments in both the manufacturing andservices sectors, which bring new technology and other expertise that contributetowards raising productivity. The Government continues to encourage FDI in all sectorsof the economy with attractive incentive packages that are customised to therequirements of the specific industries and investors.
As an open trade-dependent economy, the stability of the exchange rate is importantin facilitating international trade and investment. Wide swings in the exchange rateand prolonged periods of misalignment are highly destabilising. The peggedexchange rate regime in Malaysia has provided a stable environment for businesses toplan their investments and to undertake their operations. The stable exchange ratehas facilitated a high volume of cross border trade and investment activity. Thestability provided by the exchange rate has also allowed for the effectiveimplementation of the pro-growth policies and for the accelerated pace of bankingand corporate restructuring and reform. The regime has thus, functioned efficientlyand continues to benefit Malaysia.
In the debate on the appropriate exchange rate regime, it needs to be recognised thatthese current more uncertain and turbulent times impose challenges and pressures onexchange rates, regardless of the exchange rate regime. No regime is insulated fromthe demands of the current global environment. The global experience has shown thatwhen exchange rates have failed to perform their function, it was not due to the regimeitself but due to the weaknesses in the economy and the financial system.
Three elements are important in ensuring that a regime continues to operate effectively.Firstly, it needs to be well supported by the domestic fundamentals. Malaysia’sfundamentals have in fact strengthened during the course of the year and are importantfactors in ensuring the sustainability of the peg. Secondly, the economy needs to havethe ability and strength to absorb the external volatility. In terms of external volatility,the strength of the economy, the strength of the banking sector, the strength of thecorporate sector and that of the Government will give the country the ability to ride outthe difficult period. It is our more diversified economy, enhanced mobility of labour andcapital, the growing significance of the domestic economy and the strengthenedbanking sector that have provided Malaysia the increased resilience to external shocks.Also important is the ability and the flexibility for the authorities to respond with policiesto address the situation. While such shocks will continue to affect us, they can bemanaged and their impact minimised.
Thirdly, competitiveness needs to be achieved through efficiency and productivity gainsrather than relying on currency depreciation. As a matter of policy, Malaysia does not

rely on the exchange rate to gain competitive advantage. The Malaysian economy hassufficient flexibility to undertake adjustments in all sectors of the economy to remaincompetitive under these changing circumstances. True competitiveness will be derivednot from exchange rate flexibility but more from increasing efficiency, innovation,marketing strategies and providing quality products and services.
Monetary policy will continue to build on gains from the cumulative monetary easing,initiated since 1998, to ensure that the economic recovery process becomes wellentrenched. A priority of policy is also to ensure that the pegged exchange rate is wellsupported by the underlying economic fundamentals. With low inflation and strongereconomic fundamentals, Malaysia has the ability to exercise greater policy flexibility topreserve longer-term sustainability and stability.
The strengthened banking system, low interest rates and ample liquidity continued tosupport the bank intermediation process. Financing to the private sector has beenforthcoming, which is evident not only in terms of the increased lending activity but alsoin terms of financing via the bond market. The greater access to the bond market hasenabled corporations to undertake restructuring exercises and allowed greater flexibilityin the management of their funding risks. This, in turn, has allowed parallel reforms totake place simultaneously at both the corporate and bank levels. At the same time,financing to the small and medium enterprises (SMEs) has been sustained.
Malaysia remains committed to strengthening the domestic corporate and financialinfrastructure. Significant progress has been achieved in financial restructuringundertaken by Danaharta and Danamodal. Progress in corporate debt and non-debtoperational restructuring under the arrangement of the Corporate Debt RestructuringCommittee (CDRC) progressed at a more rapid pace in 2001 with the implementationof the new framework introduced in August. As part of debt restructuring, a numberof large corporations have undertaken rigorous restructuring exercises in terms ofmanagement and ownership structure, and the disposal of non-core businesses andassets. Most of the restructuring has been market driven. The Government has beeninvolved in the restructuring of a selected number of companies with a high degree ofsocial and national interests. The successful resolution of the large CDRC cases hascontributed towards reducing the NPL in the banking system.
The private sector plays a vital role in the Malaysian economy. While considerableattention has been directed towards strengthening the corporate sector, another area inwhich special focus is being given is to provide an enabling environment for thedevelopment and growth of the SMEs. SMEs are important in providing the linkagesbetween the various sub-sectors within the economy. The SMEs represent a potentialsource of dynamism and driving force in the economy, having greater agility to adjustand adapt to the changing environment, thereby allowing for further diversification ofthe economic base. SMEs also represent indigenous enterprises that have the potentialto grow and evolve into larger and listed companies with the potential to becomeregional or global players. To realise this potential, a holistic approach for theirdevelopment is required. Bank Negara Malaysia has conducted a survey on SMEsthrough the banking system. It is hoped that this database will form the basis for a

comprehensive framework for the development of SMEs across all sectors. The strategywill need to focus on providing the enabling business environment to not only addressthe issue of access to financing but also to enhance their technological capabilities,access to training, access to advisory services, marketing channels and other enablinginfrastructure. This is to enhance their productive efficiency and effectiveness,encouraging production of high quality, differentiated and high value-added productsthat meet world standards.
Amidst a more challenging economic environment, the banking sector has remainedstrong and resilient in 2001. The positive results achieved through the restructuringprocess and enhancements to the regulatory and supervisory framework and processhave minimised the impact of the economic slowdown on the banking system. Thebanking system recorded a pre-tax profit of RM7.5 billion with significant increases inloan disbursements. The significant progress that was achieved in financial reform andrestructuring in 2001 has allowed for the focus of attention to now shift from dealingwith banking sector problems to the medium and long-term issues on developing amore competitive and resilient banking sector.
The consolidation programme for the domestic banking institutions represents a majorstructural enhancement to the banking system. The successful completion of theconsolidation and integration of banking groups in 2001 has benefited the industry andthe banking public. The consolidation process during the year has placed the bankingsector on a stronger footing. Customers now have a wider access to banking servicesand are able to enjoy seamless services from the merged institutions. The mergedbanking groups are now more well-capitalised to meet future calls for capitalexpenditure as well as undertake a wider scope of business activities. The operationalbusiness integration processes and rationalisation exercises have been an important partof the merger to reduce duplication of resources and to attain higher levels ofeconomies of scale and efficiency in the banking institutions. Strategies of the bankinginstitutions are now directed towards establishing themselves as key players in thefinancial sector.
The year 2001 marked a significant period for the Islamic banking industry. Theencouraging achievement by the industry was a manifestation of the collective efforts ofBNM and the industry to realise the potential of the Islamic banking industry in meetingthe economic and financial needs of the country. During the year, several of the specificmeasures in the Financial Sector Masterplan (FSMP) to elevate the performance of theIslamic banking industry were implemented. Today, Islamic banking has proven to beone of the effective financial intermediation channels and has captured an 8.2% marketshare of the total banking assets. Moving forward, enhancing the institutional capacityof Islamic banking institutions through the envisaged “bank within a bank” conceptwould not only provide the strategic focus and autonomy, but also achieve theeconomies of scale, critical mass as well as cost efficiency for the Islamic bankingplayers. On the international front, significant progress was achieved on the twoinitiatives namely, the International Islamic Finance Market (IIFM) and the internationalstandard-setting body. BNM has participated actively in both initiatives. The IIFMcreates a platform for Islamic financial institutions to manage their liquidity as well as

facilitate the trading of Islamic capital market instruments. The standard-setting body, tobe located in Malaysia, will focus on issuing international best practices governing thesupervision and regulation of Islamic financial institutions. These encouragingdevelopments will contribute further to the overall development of the global Islamicfinancial system.
Bank Negara Malaysia will continue to play an active role in developing the financialsector to be an important enabler of the economic transformation and growthprocess in Malaysia. Considerable progress has been achieved in the implementationof the FSMP, notably in the areas of enhancing institutional efficiency andcompetitiveness as well as promoting consumer awareness through a structuredconsumer education programme. Several banking institutions also moved to offera broad range of financial services through new distribution channels. This willbecome increasingly important in securing the competitive edge in the new globalenvironment. New prudential policies were also introduced to enhance riskmanagement practices and corporate governance. The thrust of the banking policiesin the coming year will continue to place emphasis on enhancing the capacity ofbanking institutions, further strengthening the regulatory framework whileproviding a conducive environment for banking institutions to become more efficientand competitive.
Despite the less favourable environment in 2001, the insurance industry recorded stronggrowth of 12.4% in premium income. The strengthened capitalisation of the industrysince 30 September 2001 has built greater financial resilience among insurers, a keyfactor in advancing the consolidation of the industry through mergers and acquisitions.Eight M&As have been completed and seven others involving 13 insurers are currently inprogress. Going forward, the insurance industry has the potential for a quantum leap ingrowth, given the low penetration rate and rising incomes. This growth potential isbeing realised through initiatives under Phase I of the FSMP, which aims at buildingcapacity and efficiency as well as strengthening consumer protection. In the takafulindustry, the growth momentum was maintained in the year 2001 with the combinedtakaful funds reaching RM2.4 billion or 4.6% (2000:2.6%) of the total assets of theinsurance funds.
Development financial institutions (DFIs) are expected to continue to play an importantrole in promoting the development of identified priority sectors in the economy. Withthe enactment of the Development Financial Institutions Act 2002, a new regulatoryand supervisory framework came into force for the DFIs. Bank Negara Malaysia hasbeen empowered to administer the Act. The future focus would be on building theoverall financial and structural capacity of DFIs in meeting their mandated roles.Prudential regulations that will improve the management of assets and liabilities,corporate governance as well as risk management practices of DFIs will be introduced toenhance the soundness of their operations and practices.
Efforts are also being directed at improving the efficiency and reliability of the paymentsystem, while keeping abreast with technological developments. In this respect, aNational Payments Advisory Council has been established in 2001, with membership

including expertise from the Bank of Japan and the Hong Kong Monetary Authority, toformulate developmental policies related to infrastructure needs, new technology andstandards on payment systems.
As the process of globalisation intensifies, regional economies have become increasinglyinter-dependent and integrated. Being highly open economies, the region has in therecent years been confronted with global economic and financial uncertainty withperiodic episodes of turbulence which have tested regional policy makers. In such anenvironment, national policies alone, while vital and necessary, would not be sufficientto secure the regional financial stability and prosperity we aspire to achieve. Regionalco-operation and solidarity can serve as an important anchor during turbulent periods ofuncertainty. Critical first steps have been made in strengthening regional financingfacilities to promote mutual assistance in maintaining financial stability. Work is alsounderway to develop an effective regional surveillance mechanism to complement andsupport the regional financing facilities. Looking forward, the priority would be on thedevelopment of regional markets, including a regional bond market to better serve theneeds of all regional economies. Closer co-operative efforts in the standardisation ofsystems and documentation procedures, would also contribute to enhance greater inter-regional financial and economic activity. Effective co-operation in these areas willaugment the foundations for translating the tremendous potential that this regionpossesses for future growth and prosperity.
Although Malaysia has made significant strides on several fronts, much still needs to bedone and new challenges are emerging. The challenge to achieve sustainable growthand prosperity requires looking beyond the immediate term, beyond our ownimmediate interests and beyond our own boundaries. While immediate concerns needto be addressed to preserve confidence and stability, the core of sustainabledevelopment is derived from the institutional strength and the fundamental structuresand foundations. It is efforts directed towards these goals that will yield the broad-based high quality growth that we aim to achieve.
Zeti Akhtar AzizGovernor
20 March 2002

The MalaysianEconomy in 2001
2-10 Overview10-25 Sectoral Review25-28 Domestic Demand Conditions28-36 Prices and Employment36-51 External Sector51-53 Flow of Funds

2
OVERVIEW
The Malaysian economy remained resilient in 2001 inthe face of a challenging external environment.While the global economic slowdown in 2001 wasmore severe than earlier expectations, Malaysiaavoided economic contraction and growth for theyear remained in positive territory. Unemploymentwas also contained at a low level.
Given the openness of the Malaysian economy, thenegative effects of the US economic slowdown and
global electronics downturn was felt as early asMarch 2001. These were manifested in decliningmanufacturing production and negative exportgrowth. Concerted efforts since the crisis to promotedomestic sources of growth and reduce the over-dependence on exports resulted in real GrossDomestic Product (GDP) expanding by 0.4% in 2001.Fiscal stimulus measures and monetary policy thathad remained accommodative led to higher publicspending and positive growth in privateconsumption. During the year, public investmentexpenditure increased by 15.5%, while public
The Malaysian Economy in 2001
Real GDP growth remained positive in 2001, supported by counter-cyclical measures and diversified economic structure.
Manufacturing16.0%
Construction1.7%
Services25.1%
Imports ofgoods39.7%
Imports ofservices9.6%
Agriculture4.4% Mining
3.5%
Exports ofservices7.8%
Private consumption23.6%
Public consumption6.5%
Private investment1
6.1%
Public investment1
8.7%
Exports of goods47.3%
Trade, etc. 30.7%
Finance, etc. 26.9%
Transport, etc. 16.9%
Government services 14.6%
Utilities 8.0%Others 2.9%
Demand for goods and services (RM414.3 billion)
Supply of goods and services (RM414.3 biilion)
1 Include stocks
Graph 1.1The Economy in 2001 (at 1987 Prices)

The Malaysian Economy in 2001
3
consumption expenditure increased by 11.9%. Thedirect contribution of the public sector (excluding thenon-financial public enterprises) was significant,contributing 3.4 percentage points to GDP growth in2001.
Through policies on several fronts, consumption hasremained resilient despite lower export earnings.While national savings remained high at 34.9% ofGross National Product (GNP), total domesticconsumption accounted for more than half of GDP.This resilience in private consumption together withthe strong growth in public sector expendituremitigated the impact of the external sector on thedomestic economy and the contraction in domesticprivate investment, following the consolidation by thecorporate sector.
On the supply side, weaker growth in the export-oriented manufacturing industries was mitigated bypositive growth in all other sectors, especially theservices sector, domestic demand-oriented industriesin the manufacturing sector and the constructionsector. Overall, the effectiveness of policy measuresand the diversified economic structure of theMalaysian economy moderated the impact of thedecline faced by the export-oriented industries.
Consequently, the unemployment rate was containedbelow 4%. Retrenchment was mainly in industriesaffected by the downturn in the global electronics
-250
-125
0
125
250
-10
-5
0
5
10
% growth RM billion
1997 1998 1999 2000 2001
Real GDP value (RHS) Real GDP growth (LHS)
CPI (LHS)
-10
-5
0
5
10
15
20
-10
-5
0
5
10
15
20
1997 1998 1999 2000 2001
% growth RM ('000)
Nominal GNP per capita (RHS)Nominal GNP (LHS)Real GNP (LHS)
Graph 1.3GNP Growth and Nominal GNP per Capita
Graph 1.2Real GDP and Inflation Rate
-30
-25
-20
-15
-10
-5
0
5
10
15
20
% annualgrowth
1997 1998 1999 2000 2001
GDP Aggregate domestic demand
Graph 1.4Real GDP and Aggregate Domestic Demand
-30
-20
-10
0
10
20
30
-15
-10
-5
0
5
10
15
1997 1998 1999 2000 2001
Graph 1.5Contribution to Real GDP Growth:Domestic Demand and Net Exports
Percentage point % growth
Domestic demand (LHS)
Net exports (LHS)Real GDP growth (RHS)

4
––
Table 1.1: Malaysia: Key Economic Indicators
1999 2000 2001p 2002f
Population (million persons) 22.7 23.3 23.8 24.3Labour force (million persons) 9.2 9.6 9.9 10.2Employment (million persons) 8.9 9.3 9.5 9.8Unemployment (as % of labour force) 3.4 3.1 3.7 3.6Per capita income (RM) 12,304 13,412 12,889 13,272
(US$) 3,238 3,529 3,392 3,493
NATIONAL PRODUCT (% change)
Real GDP 6.1 8.3 0.4 3.5(RM billion) 193.3 209.4 210.2 217.5
Agriculture, forestry and fishery 0.4 0.6 2.5 1.0Mining and quarrying -2.6 3.1 0.2 3.0Manufacturing 13.5 21.0 -5.1 4.2Construction -4.4 1.0 2.3 2.4Services 4.8 4.8 4.9 3.8
Nominal GNP 4.3 11.7 -1.7 5.3(RM billion) 279.5 312.2 306.7 323.1
Real GNP 4.0 5.9 1.1 3.1(RM billion) 179.7 190.3 192.4 198.3
Real aggregate demand1 2.0 14.5 2.3 2.8
Private expenditure1 -3.8 16.0 -2.9 4.2Consumption 3.3 12.2 2.8 5.0Investment -21.8 28.7 -19.7 1.2
Public expenditure1 17.1 11.4 13.9 0.0Consumption 18.5 1.7 11.9 4.1Investment 15.9 19.9 15.5 -3.0
Gross national savings (as % of GNP) 41.1 39.5 34.9 33.8
BALANCE OF PAYMENTS (RM billion)
Goods 86.0 79.2 69.9 73.0Exports (f.o.b.) 319.6 374.0 334.3 349.1Imports (f.o.b.) 233.5 294.8 264.5 276.1
Services balance -10.7 -11.2 -8.4 -11.6(as % of GNP) -3.8 -3.6 -2.7 -3.6
Income -20.9 -28.6 -25.9 -27.5(as % of GNP) -7.5 -9.1 -8.5 -8.5
Current transfers -6.6 -7.5 -8.1 -8.4Current account balance 47.9 32.0 27.4 25.5
(as % of GNP) 17.1 10.2 8.9 7.9Bank Negara Malaysia reserves, net2 117.2 113.5 117.2 -
(as months of retained imports) 5.9 4.5 5.1 -
PRICES (% change)
CPI (2000=100) 2.8 1.6 1.4 1.8PPI (1989=100) -3.3 3.1 -5.0 2.6
Average wages in the manufacturing sector 3.0 5.0 1.5 -
Note: Figures may not necessarily add up due to rounding
1 Exclude stocks2 Arising from the fixing of the ringgit/US dollar exchange rate in September 1998, all assets and liabilities in foreign currencies have been revalued into ringgit at rate
of exchange ruling on the balance sheet data and the cumulative gain/loss has been reflected accordingly in the Bank’s current year account. The US dollar
equivalent of intrenational reserves as at 31 December 1999 was US$30.9 billion.
p Preliminary
f Forecast

The Malaysian Economy in 2001
5
Table 1.2: Malaysia: Financial and Monetary Indicators
1999 2000 2001pFEDERAL GOVERNMENT FINANCE (RM billion)Revenue 58.7 61.9 79.6Operating expenditure 46.7 56.5 63.7Net Development expenditure 21.5 25.0 34.2Overall balance -9.5 -19.7 -18.4Overall balance (% of GDP) -3.2 -5.8 -5.5Public sector net development expenditure 46.4 50.4 68.2Public sector overal balance (% of GDP) 2.3 0.7 -4.9
EXTERNAL DEBTTotal debt (RM billion) 161.1 157.7 169.8
Medium and long-term debt 138.7 140.3 146.4Short-term debt 22.4 17.5 23.3
Debt service ratio (% of exports of goods and services)Total debt 6.1 5.3 6.2Medium and long-term debt 5.7 4.9 5.8
Change in 1999 Change in 2000 Change in 2001RM billion % RM billion % RM billion %
MONEY AND BANKINGMoney supply M1 19.3 35.7 4.8 6.5 2.5 3.2
M2 40.7 13.7 17.6 5.2 7.8 2.2M3 33.1 8.3 21.9 5.0 13.0 2.8
Banking system deposits 20.4 4.7 14.6 3.2 8.6 1.8Banking system loans 0.6 0.1 23.6 5.5 16.4 3.6Manufacturing 0.4 0.6 2.2 3.3 ... 0.1Broad property sector 3.4 2.3 8.6 5.6 12.6 7.7Fianace, insurance and business services -4.1 -10.7 0.4 1.3 0.9 2.7
Loan-deposit ratio (end of year) 83.1% 84.3% 85.9%
1999 2000 2001% % %
Interest rates (average rates at end of year) 3.18 3.25 3.273-month interbank
Commercial banksFixed deposits 3-month 3.33 3.48 3.21
12-month 3.95 4.24 4.00Savings deposit 2.76 2.72 2.28Base lending rate (BLR) 6.79 6.78 6.39
Finance companiesFixed deposits 3-month 3.49 3.52 3.22
12-month 4.13 4.27 4.01Savings deposit 3.50 3.44 2.94Base lending rate (BLR) 7.95 7.95 7.45
Treasury bill (3-month) 2.71 2.98 2.73Government securities (1-year) 3.37 3.36 2.93Government securities (5-year) 5.21 4.80 3.18
1999 2000 2001% % %
Movement of Ringgit (end-period)
Change against composite -1.3 3.2 3.5Change against SDR 2.7 5.2 3.8Change against US$1 0.0 0.0 0.0
1 Ringgit was pegged at RM3.80=US$1 on 2 September 1998
p Preliminary

6
cycle. More flexible labour market practices alsohelped to moderate the number of retrenchments.An increased number of workers accepted pay cutsand shorter working hours in 2001 as companiesrationalised operations to maintain margins. Thisflexibility in the labour market remains a keyfundamental strength of the Malaysian economy.Such flexibility allows for adjustments to adversedevelopments in the external environment.
Inflationary pressures remained muted with prices, asmeasured by the Consumer Price Index (CPI),increasing moderately by 1.4% (2000: 1.6%). Themoderation in inflation was due mainly to theprevalence of excess capacity in several sectors of theeconomy, the moderate appreciation of the ringgitvis-a-vis non-US dollar currencies, as well as lowerimported inflation. The lower inflation was alsoconsistent with the widening output gap, estimatedat 5.6% of the potential output level (details of thepotential output estimation are presented in thewhite box).
The external position remained robust in 2001. Theglobal economic slowdown affected exportperformance, but imports of goods and services forexport production also declined. Hence, the currentaccount remained in surplus, estimated at about8.9% of GNP. In the financial account, the flowshave been relatively stable. Long-term flowscontinued to dominate. Inward direct foreigninvestment flows were increasingly channelled to theservices sector. These inflows were smaller in averagedollar size and low in import content but havebrought technology and other expertise thatcontribute towards raising productivity in Malaysia.Outward investments by Malaysian companies weresmaller on a net basis, as Malaysian companiesaffected by the global slowdown repatriated proceedsof their disinvestment abroad in the second half-year.
The trade surplus and continued inflows of long-termcapital resulted in higher international reserves. Thereserves level fluctuated in early 2001 followingvolatility in foreign exchange markets. Reserveswhich declined in early 2001, reversed to a risingtrend from end June following stronger fundamentalsand lower interest rates abroad. By end-2001,international reserves of Bank Negara Malaysia (BNM)was higher at RM117.2 billion or US$30.8 billion(US$4.9 billion higher than the lowest level in 2001).Subsequently, reserves increased further to RM119.6billion or US$31.5 billion as at 28 February 2002.This level is adequate to finance 5.2 months of
retained imports and cover 5.1 times the short-termexternal debt.
While the external debt increased during the year, theoutstanding amount remained relatively low, at about55.4% of GNP (previous peak after the Asian crisiswas 64%). The overall debt service ratio continued toremain low at 6.2%, despite the decline in exportvalue. The debt profile also remained healthy withshort-term debt accounting for only 13.7% of totaldebt.
The banking system demonstrated greater resiliencedespite adverse economic conditions. In 2001, therisk-weighted capital ratio (RWCR) remained above12% throughout the year, whilst the increase in thelevels of non-performing loans (NPLs) during the yearwas contained within manageable levels. Theincrease in the level of NPLs of banking institutionsduring the second half of 2001 was withinexpectations. As at end-2001, the net NPL ratio on a6-month basis was 8.1% (11.5% on a 3-monthclassification basis). Recent measures to acceleratecorporate restructuring have improved the balancesheet of the corporate sector, contributing to greaterresilience of the banking system. The resolution ofthe debt restructuring schemes for companies in thetransport sector in the final quarter of 2001 reducedthe level of NPLs by 0.7 percentage points. As atend-2001, the banks’ risk-weighted capital ratiostood at 12.8%, well above the Basel Capital Accordrequirement of 8%. The capital position will furtherstrengthen following the strong profits of RM7.4billion recorded in 2001.
With improvements in the economy, Danamodal, thespecial purpose vehicle set up in 1998 to recapitaliseviable banking institutions, received repaymentsamounting to RM2.3 billion in 2001 of the RM4.4billion that was outstanding at the end of 2000. As aresult, the outstanding investment in the remainingthree recapitalised banking institutions amounted toRM2.1 billion. Since its inception, Danamodal hasinjected a total of RM7.1 billion into ten bankinginstitutions.
With increases in NPLs remaining withinmanageable limits, Danaharta, the assetmanagement company set up in 1998 to acquireNPLs from financial institutions, has shifted its focusto asset management and recovery in 2001. As atend-2001, the cumulative amount of NPLsrestructured or approved for restructuringamounted to RM47.7 billion or 99.9% of the total

The Malaysian Economy in 2001
7
Potential Output of the Malaysian Economy
BNM’s latest estimates of potential output indicate that output gap has widened in 2001 as actual outputexpanded at a slower pace of 0.4%, compared with an increase of 3.3% in potential output. Hence, theoutput gap increased to 5.6% of potential output in 2001 (peak: 12.3% of potential output in the thirdand fourth quarters of 1998).
As indicated in the previous studies, potential output has been expanding at a moderate rate since 1999.As shown in Table 1.3, potential output grew by 2.8% in the period 1999 - 2001, as against 4.9% GDPgrowth recorded in the same period. In 2001, the moderation in growth in potential output to 3.3% wasattributed to the marginal decline in investment (-2.1%) and slower growth in labour (2.4%).
As in the previous studies, the short-run elasticity of labour is still much higher than that of capital;implying changes in employment have greater impact on output. Firms attain higher output in the shortrun by hiring more labour but not by engaging in capital investment. The low elasticity of capital in theshort run could also be explained by the significant investment in infrastructure projects, which have longgestation periods spanning over more than a decade and where the return is realised only after a timeperiod.
However, the long-run elasticity of capital (0.5) is higher compared to 0.4 in the previous study, implyingthat the return to capital was higher in the year 2001. This could be caused by an increase in utilisation ofcapital stock put in place previously, as the investments in infrastructure during the 1990s begin tocontribute to higher output.
Table 1.3Actual GDP and Potential Output
1992-1997 9.2 8.2 14.1 3.9 -1.3
1998 –7.4 3.2 –43.0 –2.1 –10.9
1999 6.1 1.3 –5.9 3.7 –6.8
2000 8.3 4.0 24.1 4.3 –2.8
2001 0.4 3.3 –2.1 2.4 -5.6
Actual GDP Potential output Labour Output gap
(% of potential output)Annual change in %
PeriodInvestment
-30
-20
-10
0
10
20
30
40
50
60
-15
-10
-5
0
5
10
15
20
25
30RM billion
% of potentialoutput
Potential output
Actual output (GDP)
Output gap
92 93 94 95 96 97 98 99 00 01
Graph 1.6Actual Output and Potential Output

8
NPLs in Danaharta’s portfolio. Danaharta expectsan average recovery rate of 56%, assuming a zerorecovery rate on defaulted cases.
The market-driven corporate restructuring exercisesgained momentum in 2001, moving beyondfinancial restructuring towards greater operationalrestructuring. Generally, corporate restructuringcontributed to the improved financial position ofcorporates and the overall competitiveness of theeconomy. During the year, major institutionalchanges were effected. Institutional changesincluded a revamp of the CDRC guidelines tohasten the pace of restructuring of companiesunder its purview. Changes to the restructuringguidelines of the CDRC included improvements inthe framework and approach to acceleraterestructuring efforts, the establishment of a timelinefor restructuring and more comprehensivedisclosure and reporting. With the new initiatives,the restructuring of several large and complex caseswere completed. The CDRC aims to complete therestructuring of the outstanding debts by July 2002.At the corporate level, the restructuring of debtswas accompanied by operational restructuring inthe form of disposal of non-core assets.Professional management was put in place byshareholders. The separation of ownership andmanagement can be expected to further enhancecorporate governance.
Macroeconomic ManagementIn 2001, macroeconomic policy was focused onmanaging the downside risks arising from theslowdown in the major industrial countries. Economicpolicies were targeted at creating an enablingenvironment for domestic demand to support growth.Given that there was considerable uncertainty over theseverity of the slowdown in 2001, there was greaterrecognition that economic policies would need toaddress short-term cyclical risks that emerged duringthe course of the year, with the objective of minimisingthe adverse effects on the Malaysian economy.
The initial assessment was for Malaysia’s GDP growthto show a moderating trend in the first two quartersof 2001, with a recovery in the second half-year.However, as the downturn in the global economybecame more severe during the course of the year,policies turned more expansionary. The strengthenedeconomic fundamentals provided Malaysia the policyflexibility to implement additional pro-growth policiesin response to external shocks, without creatingimbalances in the economy.
Given the increased prospects that the stimulus fromthe external sector would be relatively subdued in2001, the overall budget deficit for 2001 announcedin October 2000, was projected to remain large, atRM16.5 billion or –4.7% of GDP. The assessmentwas that a premature consolidation of the fiscalposition in the face of a more challenging externalenvironment would have a damaging impact on theeconomy. Consequently, as the downside risks facingthe world economy increased in early 2001, theGovernment announced on 27 March, a fiscalstimulus package of RM3 billion. Following theheightened uncertainty after September 11, anadditional stimulus package of RM4.3 billion wasannounced on 25 September.
In the Budget for 2002 announced in October 2001,the overall deficit of the Federal Government for2001 increased to RM22.4 billion or –6.5% of GDP,an increase of RM5.9 billion from the originalallocation announced a year earlier. This additionalstimulus was equivalent to 2.2% of GDP. To ensuremaximum impact from the increased expenditure,efforts were intensified to improve policyimplementation, particularly to reduce project delaysand increase efficiency for disbursements.
The 2001 Budget and the two additional fiscalpackages announced in March 2001 and afterSeptember 11 not only included significant increasesin both public consumption and capital outlays butalso tax incentives to increase disposable income andreduce business costs. Measures to increasedisposable income of households included higher taxrebates, higher allowances for civil servants in specificcategories and a temporary reduction in theemployees’ Employees Provident Fund contributionrate. The announcement effect of the new measuresto increase household income in the 2002 Budgetalso boosted private consumption. These measuresincluded a reduction in personal income tax ofbetween 1-2 percentage points and the 10% salaryadjustment for civil servants, effective 1 January 2002.
Monetary conditions during the year also supportedthe expansion in private sector activities. Interestrates were already at historical lows at the end of2000 with the aggressive reductions in interest ratesby a total of 550 basis points in the period 1998 to1999. Up to September 2001, the policy rateremained unchanged as the earlier interest ratereductions had been effective in promoting banklending. Following September 11, BNM reduced itsintervention rate on 20 September by 50 basis

The Malaysian Economy in 2001
9
points to 5% as a pre-emptive measure to addressthe heightened risks biased towards furtherweakness. As a result, the average base lendingrates (BLR) of the commercial banks and financecompanies declined further to 6.39% and 7.45%respectively (6.78% and 7.95% respectively atend-2000).
Low interest rates and the initiatives to improveaccess to financing resulted in loans outstanding ofbanking institutions expanding by 3.6%. Togetherwith private debt securities (PDS) issued by the privatesector, total financing expanded by 6%. Efforts werealso intensified in 2001 to ensure that selectedsectors, especially the small and medium enterprises(SMEs), continued to have access to financing. Thesize and scope of several selected special funds wereexpanded and lending rates were lowered. As aresult, loans extended to the SMEs by the bankingsystem rose by 3.1% in 2001.
In pursuing the more expansionary demandmanagement policies in 2001, care was taken thatfiscal and monetary measures would not undulyincrease risks of creating imbalances therebyjeopardising the long-term growth potential, pricestability as well as the gains made in achieving arobust balance of payments. In particular,strengthening foreign direct investment inflowsremained a priority. Incentives addressed the need forforeign direct investment inflows to be morediversified, in terms of location as well as sector.While attracting new investments, it was essential tocreate a more favourable environment to existinginvestors to expand operations in Malaysia.
The policy to allow 100% foreign equity ownership inpromoted manufacturing industries, irrespective ofexport levels, was extended to 2003. As a measureto accelerate the development of the Eastern Corridorof Peninsular Malaysia, Sabah and Sarawak, PioneerStatus and Investment Tax Allowance that had beengranted and expired on 31 December 2000 wereextended for another five years. Effective 25 April2001, the Foreign Investment Committee’s guidelineson the acquisition of property by foreigners were alsoliberalised.
The incentive structure for investors, both domesticand foreign, is designed to attract quality investmentsthat promote technology transfers, and not justexpand production capacity. An important changemade to the incentive scheme in the 2002 Budgetwas to extend the period for which the reinvestment
allowance would remain in effect. Manufacturingcompanies and producers of food products wouldnow enjoy the allowance for 15 consecutive years,commencing from the year the first investment ismade, instead of the five years given previously.
Overall, the improved macroeconomic fundamentalsreduced the risks that inflationary pressure wouldemerge over the medium term or that a significantmisalignment in the exchange rate would occur.While Malaysia has pursued an expansionary fiscalstance for four consecutive years, the FederalGovernment debt was contained at 43.8% of GDP.The high domestic savings rate gave the flexibility tofinance the deficit mainly from non-inflationarydomestic sources of growth. The ample liquidity inthe system, supported by strong surpluses in thebalance of payments, allowed domestic financing ofthe deficit without crowding out the private sector.
The actual outturn of the financial position of theGovernment was better than expected. The overallfinancial position of the Federal Governmentregistered a lower overall deficit of RM18.4 billionor -5.5% of GDP. As the shortfall on bothoperating and development expenditures was lowat less than 5% each, the improvement was largelydue to the better-than-expected revenueperformance, emanating largely from higher incometax collection.
The thrust of policies introduced in 2001 to addresslonger-term structural issues focused on increasingdomestic capacity, institution building and skillsupgrading. The Government launched the ThirdOutline Perspective Plan (OPP 3) in April 2001,which documented the framework and strategiesfor economic development over the next ten years,2001-2010. At the same time, the Governmentlaunched the Eighth Malaysia Plan, 2001-2005,which set out the first phase of implementation ofOPP 3. Within the new framework for the economy,BNM and the Securities Commission took steps todevelop longer-term strategies for the developmentof the financial sector and the capital marketrespectively.
The primary objective of the OPP 3 is to build aresilient and competitive nation by strengtheningMalaysia’s ability to meet the challenges arisingfrom the rapid pace of globalisation and advancesin information and communications technology.The Plan also takes into account the need tostrengthen Malaysia’s economic, financial and social

10
resilience to withstand external shocks. Specifically,the OPP 3 aims to:• Develop Malaysia into a knowledge-based
economy where knowledge, creativity and innovation would increase productivity growth in all sectors;
• Generate domestic sources of growth by strengthening domestic investment in new areas of growth, while continuing to attract foreign direct investment in strategic areas;
• Re-orientate the strategies for human resource development to support a knowledge-based economy.
To advance the policy to increase the knowledgecontent of the economy, a masterplan for thetransition towards a knowledge-based economy wascompleted in 2001.
Accordingly, the 2001 Budget as well as the 2002Budget accorded priority to human resourcedevelopment. Expenditure for education, trainingand skills development accounted for 23% of theBudget and 6.1% of GDP. Measures were initiatedto promote computer literacy amongst students andemployees, as well as improve teaching and learningmethods. The existing curricula in schools andinstitutions of higher learning are being reviewed tomeet the changing requirements of the economy.The restriction on tax deductions on bonuspayments which was limited to two months, wasalso abolished in order to provide employers theflexibility to offer remuneration which wascommensurate with workers’ productivity. Whileemphasis has been placed on intensifying advancedskills development through training, retraining andapprenticeship schemes, efforts to pull the besttalents from Malaysia and abroad have also beenintensified. Incentives were provided in the 2001Budget to attract highly skilled Malaysian citizensworking abroad to return to Malaysia.
The Financial Sector Masterplan (FSMP), launched inMarch 2001 outlines the medium and long-termstrategies for the development of the financialsector. The objective of the FSMP is to develop acompetitive, resilient and dynamic financial system,based on international best practices, which wouldprovide an enabling environment for long-termeconomic expansion. Phase one of the FSMP, whichbegan in 2001 and covers a period of three years,focuses on enhancing domestic capacity andcapabilities. Under the second phase, domesticcompetition would be intensified and in the third
phase, the pace of integration with internationalmarkets will be enhanced.
A FSMP Secretariat and a FSMP Steering Committee(FSMP SC) have been set up in BNM, responsible forformulating mechanisms to effectively implementthe FSMP recommendations. As at end-2001, outof the total 119 recommendations, nine of therecommendations were fully implemented andanother 22 recommendations are beingimplemented on an ongoing basis.
The Capital Market Masterplan was launched inFebruary 2001 with the objective of setting thestrategic position and future direction for theMalaysian capital market. Of the 152recommendations outlined in the Masterplan, 14recommendations have been fully implemented,another 24 have been partially completed while 48more are being addressed. Progress was made in thearea of the consolidation of the stockbroking industryand the stock exchange, disclosure-based regulationand corporate bond market development.
Overall, Malaysia concluded the year 2001 in astronger position with signs of stabilisation in theeconomy supported by the gradual recovery inexport demand, strengthened economicfundamentals and significant progress made inaddressing the long-term structural issues. Theindex of leading indicators which provides an earlysignal of the direction of the economy, has beenrising for five consecutive months since July 2001,supporting the prospects for a recovery in theeconomy in 2002.
SECTORAL REVIEW
Manufacturing Sector The overall performance of the manufacturing sectorwas affected by the slowdown in major industrialcountries and the downturn in the global electronicscycle. While production in the export-orientedindustries declined, industries that were dependenton domestic demand continued to expand, benefitingfrom the positive effects of the fiscal stimulusprogramme and low interest rates. Domestic demandfor passenger cars and construction-related materialsremained strong throughout the year. As a result,capacity utilisation in the domestic-oriented industriesremained high at close to 80%. The strength in thedomestic-oriented sector had mitigated, to someextent, the more severe contraction in the export-ledmanufacturing activities.

The Malaysian Economy in 2001
11
The production of export-oriented industries, whichwas relatively resilient in the first quarter of 2001,was affected more by the pronounced slowdown inexternal demand in the subsequent quarters.Nevertheless, with the emerging signs ofimprovements in the external environment towardsthe end of the year, the declines in manufacturingactivities moderated in the fourth quarter of 2001,with both the exports and production ofmanufactured goods registering smaller declines.Given these developments, the decline in the overallmanufacturing production and value added for 2001as a whole was contained at a single-digit rate of6.4% and 5.1% respectively (2000: +25% and +21%respectively).
While operating in a slower business environmentduring the year, some manufacturers had taken theopportunity to consolidate and streamline theiroperations in order to better position themselves inthe increasingly competitive global market. This wasevident in the relocation of the labour-intensiveindustries and lower-end operations from Malaysia tolower cost producing countries such as Thailand. Atthe same time, some manufacturers also transferredtheir higher-end operations to Malaysia to takeadvantage of the existing well-developedmanufacturing facilities, competitive incentivestructure as well as a workforce that is well-trainedand proficient in the English language.
In addition, there were increasing efforts by exportersto explore export opportunities in niche markets.During the year, Malaysia’s exports of manufactured
goods to the Middle-East increased by 20.4%, withthe share of total manufactured exports increasing to2.4% from 1.8% in 2000. Major products thatwere exported included electronics, electricalproducts, wood products and furniture, foodproducts and chemical products. At the same time,Malaysia’s manufactured exports to the People’sRepublic of China have also been on an upwardtrend, growing significantly by 41.2% to account fora higher share of 3.9% of total manufacturedexports in 2001 (2000: 2.5%). The bulk ofmanufactured goods exported to the People’s
Table 1.4Manufacturing Sector: Value Added andProduction
Value-added(Constant prices) 21.0 -5.1
Overall Production 25.0 -6.4
Export-oriented industries 25.7 -10.2of which:Electronics 44.8 -20.1Electrical products 28.7 -1.9Chemicals and chemical products 15.1 -7.6Wood and wood products 4.0 1.3Textiles and wearing apparel 8.7 -8.5Rubber products 4.0 3.3Off-estate processing 11.7 7.7
Domestic-oriented industries 22.1 7.4 of which:Transport equipment 19.1 20.6Petroleum products 19.9 19.3 Construction-related products 18.6 5.0 Fabricated metal products 33.8 4.0 Food products 16.2 4.4
20012000Annual change in %
Output (LHS)
Manufactured exports (RHS)
Export-oriented industries (LHS)Domestic-oriented industries (LHS)
Index % yoy
0
50
100
150
200
250
-30
-20
-10
0
10
20
30
1Q 2Q 3Q 4Q 1Q 2Q 3Q 4Q2000 2001
Graph 1.7Manufactured Production and Exports
60
65
70
75
80
85
-15
-10
-5
0
5
10
15
20
25
30
1995 1996 1997 1998 1999 2000 2001p
Capacity Utilisation (LHS) Output (RHS)
p Preliminary
% % yoy
Graph 1.8Capacity Utilisation in the Manufacturing Sector

12
The strength in the domestic-oriented sector mitigated thecontraction in the export-oriented industries. Growth was mostpronounced in the transport-related industries.
100
80
60
40
20
0
68
77
86
77
%
2000 2001p
p Preliminary
Electronics Electricalproducts
Chemicaland chemical
products
Textiles andwearingapparel
Graph 1.9Capacity Utilisation of Export-OrientedIndustries
0
20
40
60
80
100
120
Transportequipment
Food, beveragesand tobacco
products
Non-metalicmineralproducts
Petroleumproducts
%
8076
80
98
2000 2001p
p Preliminary
Graph 1.10Capacity Utilisation of Domestic-OrientedIndustries
Republic of China comprised electronics andelectrical products, chemical products, woodproducts and metal products.
The electronics industry was the most affected bythe slowdown in global demand in 2001. Duringthe year, most electronics manufacturers drewdown inventories accumulated from a year ofstrong capacity expansion in 2000. As thedownturn in the global IT sector became morepronounced since the second quarter of 2001, theelectronics manufacturers undertook measures torationalise operations. These included wage cutsand shorter working hours to improve costeffectiveness as well as retraining of workers tomove into higher-end operations. An encouragingdevelopment in the second half-year was theincrease in demand from niche markets forproducts such as disk drives for the video gamesystems and personal video recorders. Thissupported the operations of disk drive makersbased in Malaysia.
The production of electrical products was moreresilient in the first half of 2001 and only began tomoderate in the second half of the year, as externaldemand for audio-visual products andcommunication products declined. Exports to themajor markets, especially the US, Japan, Singapore,
-60
-40
-20
0
20
40
60% yoy
J2000
J2001
J D J D
Production of electronics in MalaysiaElectronics exports of MalaysiaWorldwide sales of semiconductors
Graph 1.11Production and Exports of the Electronics Industry

The Malaysian Economy in 2001
13
Hong Kong SAR and Europe declined, due to lowerdemand for consumer durables, such as digitalvideo disc (DVD) players, video compact discs (VCD)players and flat screen televisions. Nevertheless,exports to some countries in the region such as thePeople’s Republic of China, Thailand, Indonesia andthe Middle-East continued to be sustained.
Performance of the textiles and wearing apparelindustry was adversely affected by the weak externaldemand conditions. During the year, both theproduction and exports of textiles and wearingapparel declined due to lower demand from themajor buyers, namely, the US, Hong Kong SAR,Singapore and Europe.
About 50% of output of the chemical productsindustry are linked to the production of electronicsand electrical products. Consequently, the lowerdemand for resins and plastic products as well aslower usage of industrial gases in the electronics andelectrical products industries affected the productionof chemical products. At the same time, slowerexternal demand for resins, toiletries andpharmaceutical products also contributed to thedecline in output of this industry. While theproduction of the more export-oriented chemicalproducts declined, products which have strongerlinkages with the domestic-oriented activitiescontinued to experience output growth. Theseproducts included paints, varnishes and lacquers foruse in car production and construction activities.
During the year, output of off-estate processedproducts increased, in line with the sustaineddemand and higher production of crude palm oil. Therubber products industry benefited from higher
external demand for gloves, especially from the US,following the threat of the anthrax scare. Despite theincreased production, export proceeds of rubberproducts declined further during the year, due tocontinued low export prices for gloves arising fromcompetition from Thailand. Gloves accounted forabout three quarters of total production and exportsof rubber products. Output of tyres and tubes wasalso affected by competition from cheaper importsfrom Thailand and Indonesia as well as better qualitytyres from Japan.
The production of wood products was sustained in2001, reflecting mainly the strong saw millingactivities in the early part of the year. Productiondeclined towards the middle of the year whenexternal demand deteriorated further. Like the rubberproducts industry, the increased volume of woodproducts did not translate into higher export receipts,as prices of plywood and sawn timber remained lowin the global market amidst sluggish demand fromJapan and the US. Similarly, lower external demandalso resulted in the decline in exports of furniture andparts in 2001.
Supported by the sustained strong domesticdemand, most of the industries producing for thedomestic market continued to register positivegrowth in 2001. In particular, output from thetransport equipment and petroleum productsindustries continued to record double-digitexpansion. The production of transport equipment,including passenger cars as well as motor vehicleparts and accessories expanded by 20.6% duringthe year. Higher demand was stimulated bymeasures to raise disposable income and favourablefinancing conditions. The strong outputperformance of the transport equipment industryhad a favourable impact on domestic demand forpetroleum products. The export earnings ofpetroleum products increased further albeit at aslower pace, reflecting mainly the lower crude oilprices towards the middle of the year.
The positive effects of the fiscal stimulus programmewere reflected in the continued output expansion ofconstruction-related materials to meet demandfrom the construction sector. The production ofiron and steel products as well as non-metallicmineral products, including cement and concreteproducts, tiles and ceramic products expanded furtherduring the year. Nevertheless, exports of the non-metallic mineral products declined, reflecting to alarge extent, the intense price competition,
70
50
30
10
-10
-30
% yoy
1Q 2Q 3Q 4Q 1Q 2Q 3Q 4Q2000 2001
Electronics
Electrical products
Chemical products
Overall export-oriented industries
Graph 1.12Output Performance of SelectedExport-Oriented Industries

14
particularly from Indonesia for tiles and ceramicproducts as well as other structural clay products inthe international markets. These products accountedfor about 28% of total exports of the non-metallicmineral products industry.
Output of all sub-sectors in the fabricated metalproducts industry increased, except for the copperand aluminium sub-sector which was affected bylower demand from the electronics industry.Meanwhile, the production of sub-sectors likestructural and fabricated metal products, wireproducts and tin cans was sustained by continuedactivities in the construction sector and the beveragesindustry.
Output of the paper and paper products industrygrew marginally, affected primarily by the decline inthe production of containers, paper boxes andpaperboard, as packaging activities especially in theexport-oriented products industries slowed down.Supported by the strong sustained consumerspending, output of the food, beverages andtobacco products industries continued to sustain apositive growth during the year.
Construction SectorThe fiscal stimulus programme, privatisation ofinfrastructure projects and housing developmentcontributed to a stronger growth of 2.3% in the
construction sector. Construction activity in thenon-residential sub-sector consolidated further due tothe large overhang of office and retail space.
The civil engineering sub-sector benefitedsignificantly from Federal Government developmentexpenditure on construction-related projects,especially projects in the transportation, educationand health sub-sectors. Growth in constructionactivity also emanated from commencement of fourprivatised road projects and one independent powerplant. The former included the Kajang Ring Road,Ipoh-Lumut Highway, Guthrie Corridor Expresswayand the Butterworth Outer Ring Road while theindependent power plant was the TechnologyTenaga in Perlis. Construction activity was alsoundertaken for ongoing works related to airports,rail, ports, waste disposal, water and sewerageprojects. Among the major ongoing projects duringthe year were the New Pantai Expressway, ExpressRail Link, the Kuala Lumpur Monorail System andthe development of Putrajaya. Given theimportance of infrastructure project financing tosupport growth of the civil engineering sub-sector,Bank Pembangunan dan Infrastruktur MalaysiaBerhad’s loan approvals totalled RM7.4 billion in2001, compared with RM7.6 billion in 2000. TheBank increased its loan disbursement to RM4.4billion (2000: RM2.7 billion).
Measures undertaken by the Government to supporteconomic growth and increase disposable income ledto a positive growth of the residential sub-sector in2001. Growth was supported by strong underlyingdemand for residential units, particularly affordableand conventional housing in choice locations withgood accessibility. The low interest rate environmentwith financial institutions offering competitivehousing loan packages with lower marginrequirements and longer tenure provided additionalimpetus. Other incentives included withdrawals ofEPF funds for the purchase of a second houseprovided the first house has been sold; exemptionfrom stamp duties; lifting limitations for financialinstitutions to finance the construction of residentialproperties priced above RM250,000 each and shophouses within residential areas; and allowing proceedsfrom private debt securities to be used to finance thedevelopment of such properties provided they achievebreak-even sales in value terms.
In 2001, demand in choice locations strengthenedwhile sales performance of new launches ofhousing schemes in poor locations showed a
Construction-related material
Fabricated metal products
Transport equipment
Petroleum products
Overall domestic-oriented industries
% yoy50
40
30
21
10
0
-10 1Q 2Q 3Q 4Q 1Q 2Q 3Q 4Q2000 2001
Graph 1.13Output Performance of SelectedDomestic-Oriented Industries

The Malaysian Economy in 2001
15
declining trend during the latter half, with the take-up rate declining from 53% in the first quarter to40% during the third quarter. The value andnumber of residential property transactions also fellmarginally. Nevertheless, government measures toreduce the property overhang by granting stampduty exemptions for the purchase of completedproperties from developers resulted in a total of6,100 units of properties valued at RM1.7 billionbeing sold during 2001. This represented about aquarter of the 24,000 units of properties valued atRM7.7 billion that were offered by developersregistered with the Real Estate & HousingDevelopers’ Association of Malaysia (REHDA).
Indicators of optimism of rising demand in theresidential sub-sector included increase in newdevelopers’ licences issued with more unitsapproved for construction in Peninsular Malaysia;
new sales and advertising permits as well asrenewals of such permits; and increase in loans forresidential properties. Mortgage loans granted bythe banking system rose by 17.2% (RM12.8 billion).Similarly, loans approved by other housing creditinstitutions also increased during the year. Inparticular, loans by the Treasury Housing LoansDivision increased significantly due to higher loaneligibility for civil servants and the ability to utilisethe balance of loan eligibility to purchase a secondhouse. In line with higher approvals, total housingloans outstanding increased in 2001.
Prices of residential properties rose marginallyduring 2001 after appreciating by 15.4% since thefirst half of 1999. The Malaysian House Price Indexrose at an annual rate of 0.9% during the first halfof 2001. However, prices declined marginallycompared with the preceding six months. Prices ofterraced and semi-detached houses recordedincreases, while the detached and high-rise unitsregistered price declines. Although the indexremained below the peak level recorded in 1997,house prices in several states exceeded the pre-crisislevels. Generally, all states registered price
Table 1.5Residential Property Indicators
Residential property transactionsNumber 170,932 165,309Value (RMb) 21.9 20.8
Approvals1 214,290 227,260Developers’ licences
New 997 1,095Renewals 416 413
Sales and advertising permitsNew 969 1,014Renewals 1,249 1,461
Loans by banking system- value (RMb)
Outstanding 74.3 87.1Approvals 24.9 27.1
1 Units approved for construction by private developers in Peninsular Malaysia
Source: NAPIC, Valuation and Property Services Department, Ministry of Housing and Local Government and Bank Negara Malaysia
20012000
Number
Growth in the construction sector was supported by fiscal stimulusprogramme and low interest rates.
Residential (units) 35,203 4.9 477,693 342,972 471,835 359,077
Purpose-builtoffice (‘000 s.m.) 2,528 8.8 2,540 1,951 2,453 1,917
Shoppingcomplexes (‘000 s.m.) 1,449 9.3 1,508 1,718 1,509 1,715
Retail shops (units) 7,817 2.2 25,154 25,351 25,339 26,180
Industrialproperties (units) 3,295 1.3 8,254 23,170 8,395 23,017
Source : NAPIC, Valuation and Property Services Department
Units/ ’000 s.m. Value (RMb)
Overhang
June-01 June-01 Sept-01
Units/ ’000 s.m. Units/ ’000 s.m.
In-comingSupply
In-comingSupply
Planned SupplyPlanned Supply
Table 1.6Property Overhang, Incoming Supply and Planned Supply

16
increases, except for Selangor and Kelantan whereprices declined marginally. In particular, terracedhouses in Kuala Lumpur recorded the highest priceincrease of 20.5%.
The property overhang situation improved primarilydue to the sales of residential properties. As at end-June 2001, data compiled by the National PropertyInformation Centre (NAPIC) of the Valuation andProperty Services Department showed that the
overhang of residential properties improved by 31.4%to 35,203 units, while the improvement in valueterms was 26.5% to RM4.9 billion. The remainingunsold units were located mainly in poor locations.Demand for residential units was more resilient in thewell-established locations.
Several measures were introduced during the year toreduce the property overhang. With the liberalisationof the FIC guidelines effective 25 April 2001, foreignpurchases of commercial properties increased by 14%to RM634 million. However, sale of residentialproperties to foreigners declined.
The large overhang and low occupancy rates ofoffice and retail space continued to restrain growthof the non-residential sub-sector. Construction ofpurpose-built office and retail space during2001 was supported mainly by ongoing projects.Overall, with the decline in incoming supply, theaverage occupancy rate for office space and retailcomplexes in the Klang Valley stabilised in 2001.Commercial property transactions adjusteddownwards by 5% in terms of value and 11% involume terms.
Arising from higher demand, rentals of prime officeand retail space edged upwards during the year,although the rental rates remained lower than pre-crisis levels. Rentals for office and retail space insecondary locations were most affected by the excess
0
10
20
30
40
50
60
0
50
100
150
200
250
300
1997 1998 1999 2000 2001
RM/sq.m RM/sq.m
Prime office space (LHS)Prime retail space (RHS)
1 Refers to Kuala Lumpur and SelangorSource: BNM, CH Williams Talhar & Wong Sdn. Bhd.
0
100
200
300
400
500
600
700
60
70
80
90
1999 2000 2001(Jan.-Sept.)
2002e
Occupancy Rate2 (%)
1 Refers to Kuala Lumpur and Selangor2 Refers to end of period e Estimates by BNM
Net lettable area(thousand sq.m)
OccupancyRate (%)
Source: NAPIC, Valuation and Property Services Department
Graph 1.14New Supply of Purpose-Built Office Space in theKlang Valley1: 1999-2002
0
50
100
150
200
250
300
60
70
80
90
1999 2000 2001(Jan.-Sept.)
2002e
1 Refers to Kuala Lumpur and Selangor2 Refers to end of period e Estimates by BNM
Occupancy Rate2 (%)
Net lettable area(thousand sq.m)
OccupancyRate (%)
Source: NAPIC, Valuation and Property Services Department
Graph 1.15New Supply of Retail Space in the Klang Valley1:1999-2002
Graph 1.16Average Monthly Rentals for Prime Officeand Retail Space in Klang Valley1

The Malaysian Economy in 2001
17
supply situation, as tenants became more selective,favouring commercial space in more strategiclocations. Although the incoming supply of newoffice and retail space was on a declining trend, itwas estimated that it would take five years to fullyutilise existing office space, and 4.4 years for retailspace. This was based on the assumption of anaverage annual take-up rate of 535,000 squaremetres for office space and 327,000 square metresfor retail space as recorded during the period of1992 to September 2001.
In the development of hotels, new hotels completedduring the year increased to 288, which provided6,344 rooms. The occupancy rate of hotels improvedmarginally to 59% as tourist arrival for the year roseto a record level of 12.8 million from 10.2 millionin 2000.
Agriculture sector Value added in the agriculture, forestry andfishery sector (agriculture) expanded by 2.5% in2001 due primarily to higher crude palm oilproduction and, to a lesser extent, higher output oflivestock, fruits and vegetables. The latter reflectedthe initial signs of the positive impact of theGovernment’s measures to increase domesticsources of growth through higher food production.Production of other major agricultural commoditiesincluding rubber, saw logs and cocoa declinedduring the year, reflecting mainly weaker global
demand. Consequently, commodity prices, exceptfor cocoa prices, fell in 2001. As a result of thedecline in export prices as well as volume, theexport earnings of the agriculture sector for 2001declined by 13.2%.
Production of crude palm oil, which accounts for35% of total value added in the agriculture sector,increased by 8.9% in 2001. The increase was onaccount of two factors: firstly, the area with newlymatured trees particularly in Sabah was higher; andsecondly, the volume of oil extracted was higher inline with favourable weather conditions. However,due to ample global supplies of vegetable oils, theexport price of Malaysian palm oil remained belowRM1,000 per tonne during January-July 2001.Thereafter, the price breached the RM1,000 level inAugust 2001 and remained above this level for therest of the year. This turnaround was driven mainly bylower supplies of palm oil, particularly since August2001, as external demand from Malaysia’s traditionalbuyers was sustained. For 2001 as a whole, palm oilprices averaged RM944 per tonne (2000: RM1,122).
The low palm oil prices in the first half of the yearprompted the Government to introduce incentives toreduce the supply of palm oil. This was done byreducing existing stocks and encouraging replanting.To reduce stocks and to promote exports, theGovernment allowed a full waiver of export duties onone million tonnes of crude palm oil and abolished
Table 1.7Office and Retail Space-Unoccupied Space, Incoming Supply and Planned Supply by State(as at end-September 2001)
Kuala Lumpur 1,388 1,376 1,037 320 767 738Selangor 460 422 164 194 121 0Johor 230 262 431 272 178 859Pulau Pinang 189 141 47 277 290 22Negeri Sembilan 29 62 140 53 60 64Perak 43 68 6 62 47 0Melaka 10 15 0 41 0 0Kedah 16 23 16 72 18 25Pahang 13 13 56 48 2 6Terengganu 7 7 0 5 7 0Kelantan 13 0 20 2 19 0Perlis 5 34 0 8 0 0Sabah 224 3 0 44 0 0Sarawak 64 26 0 34 0 0
Total 2,692 2,453 1,917 1,432 1,509 1,715
Source : NAPIC, Valuation and Property Services Department
Office Space Retail Space
UnoccupiedSpace
IncomingSupply
PlannedSupply
UnoccupiedSpace
IncomingSupply
PlannedSupply
(’000 square metres)

18
the 5 percent duty on exports of semi-processed palmoil. To encourage replanting, the oil palm replantingscheme, which aimed to reduce 200,000 hectares ofland planted with oil palm trees older than 25 yearswas introduced in March 2001. A total of RM200million was allocated for the scheme. However, aspalm oil prices improved in the latter half of 2001,the response to the replanting scheme, particularlyamong the smallholders, was not encouraging. As atend-2001, only 58,600 hectares or almost 30% ofthe area with old oil palm trees have been replanted.This has prompted the Government to extend theapplication period for the scheme to the end ofJune 2002.
In 2001, the contraction in palm oil exportsmoderated to 0.7% due to the higher volume ofexports (18.1%) and a more moderate decline in
export prices (-15.9%). In particular, the higherexport volume of palm oil was mainly on account ofhigher imports from major buyers, namely India, theEuropean Union, the People’s Republic of China andPakistan. These markets accounted for 60% ofMalaysia’s total palm oil exports. Favourable exportdemand throughout the year coupled with lowerproduction since September 2001 led to a reductionin total stocks of palm oil to 1.2 million tonnes at theend of the year (end-2000: 1.4 million tonnes).
As part of efforts to further expand and diversifyMalaysia’s export markets, the Malaysian Palm OilPromotion Council together with the TechnicalAdvisory Services (TAS) unit of the Malaysian Palm OilBoard undertook promotional activities. The TAS unitfocused on market development through theprovision of technical support to create greater
Table 1.8Agriculture Sector: Value Added, Production and Exports
2000 2001p
Volume Annual Volume Annual and change and change
Value (%) Value (%)
Value Added (RM million at 1987 prices) 17,687 0.6 18,129 2.5
Production 1
of which:Crude palm oil 10,842 2.7 11,804 8.9Rubber 615 -20.0 546 -11.2Saw logs 23,076 5.9 19,554 -15.3Cocoa beans 70 -16.0 58 -17.9
Exports (RM million) 23,014 -16.8 19,966 -13.2of which:
Palm oil(‘000 tonnes) 8,863 -1.1 10,466 18.1(RM/tonne) 1,122 -30.5 944 -15.9(RM million) 9,948 -31.3 9,876 -0.7
Rubber(‘000 tonnes) 978 -0.6 822 -16.0(sen/kilogramme) 263 10.4 230 -12.7(RM million) 2,571 9.7 1,886 -26.6
Saw logs(‘000 cubic metres) 6,484 -3.8 4,834 -25.5(RM/cubic metre) 384 -2.9 315 -17.9(RM million) 2,489 -6.5 1,523 -38.8
Sawn timber(‘000 cubic metres) 2,876 2.1 2,411 -16.2(RM/cubic metre) 1,050 5.4 943 -10.2(RM million) 3,020 7.6 2,273 -24.7
1 All in ‘000 tonnes, except for saw logs in ‘000 cubic metres.
p Preliminary
Source: Department of Statistics, MalaysiaMalaysian Palm Oil BoardForestry Departments (Peninsular Malaysia, Sabah and Sarawak)Malaysian Cocoa Board

The Malaysian Economy in 2001
19
awareness of the technical attributes of the Malaysianpalm oil in overseas markets. As a result, several newexport markets such as in Ecuador, Liberia, Armeniaand Palau were established. Meanwhile, research anddevelopment (R&D) activities on palm oil continuedin 2001. Generally, such R&D activities can begrouped into innovative products, lipid technologyand the oil and fats technology. The Oil and FatsTechnology Centre continued to focus its R&D on theformulation of new palm-based food products thathave potential for commercialisation by the relevantindustrial sectors.
The stronger growth in the agriculture sector in 2001was also the result of higher production of the otheragriculture group, which comprised mainly thelivestock, fishery, fruits and vegetables sub-sectors.This increase was in line with efforts to increasedomestic food production. Livestock productionrose by 7.4% while the production of fish remainedvirtually unchanged from the preceding year’s level.To further encourage cultivation of vegetables andfruits, the Ministry of Agriculture has established thePermanent Food Production Parks through thedevelopment of lands allocated by StateGovernments. By end-2001, 800 hectares of suchland had been developed. Consequently, productionof fruits and vegetables grew by 10.2% and15.7% respectively.
-30
-20
-10
0
10
20
Valueadded
Crudepalm oil
Rubber Saw logs Cocoa
2000 2001
% yoy
Graph 1.17Agriculture Production
-50
-40
-30
-20
-10
0
10
20
% yoy
TotalAgriculture
Exports
Palm oil Saw logs Sawntimber
Rubber
2000 2001p
P Preliminary
Graph 1.18Agriculture Exports
0
2
4
6
8
10
12
14
0
500
1,000
1,500
2,000
2,500
3,000
3,500
1997 1998 1999 2000 2001p
Production in million tonnes (RHS)Mature area in '000 hectares (LHS)
Yield of CPO in tonnes/mature hectare (RHS)
p Preliminary for mature area and yield
Hectares Tonnes
Graph 1.19Oil Palm: Area, Production and Yield
0
500
1000
1500
2000
2500
0
200
400
600
800
1000
1200
1400
1600
1Q 2Q 3Q 4Q 1Q 2Q 3Q 4Q 1Q 2Q 3Q 4Q 1Q 2Q 3Q 4Q
1998 1999 2000 2001
CPO Local delivered price
Stocks
Price(RM/tonne)
Stocks('000 tonnes)
Graph 1.20Palm Oil Prices and Stocks

20
In 2001, Malaysian natural rubber (rubber)production declined to a record low of 546,180tonnes, or 11.2% lower than in 2000. The declinewas due mainly to the low rubber price, whichcontinued to discourage tapping activities, particularlyamong the rubber smallholders. Smallholderscontribute 82% to Malaysia’s total rubber output. Theproduction of rubber was also affected by thecontinuous conversion of areas planted with rubberto other crops or use. During the year, more than16,000 hectares of rubber smallholdings werereplanted with other crops. Taking cognisance thatthe incomes of most rubber smallholders wereadversely affected by the prolonged period of lowprices, the Government introduced monetaryincentives of 30 sen per kilogramme for latex and 15sen per kilogramme for cuplumps in the second halfof 2001. These incentives were also aimed atencouraging tapping activities. Besides the monetaryincentives, smallholders were encouraged to usemodern and labour-saving tapping technology knownas the Low-Intensity Tapping Systems (LITS) - agaseous stimulation that can help raise treeproductivity. For this purpose, the Government hasallocated a total of RM180 million. Generally, LITS areencouraged for use in rubber plantations, primarily toease the labour shortage and improve productivity.
Reflecting lower export prices and export volume,total earnings from rubber exports (including re-exports), declined by 26.6% in 2001. Rubber prices,which picked up in 2000, were unsustainable in2001 as global supply exceeded consumption. Theaverage price of rubber (as measured by RRS 1prices) fell to RM2.27 per kilogramme. Prolongedlow international rubber prices amidst an oversupplyin the international markets, prompted the threemajor rubber producing countries, namelyThailand, Indonesia and Malaysia (which togetheraccount for 85% of the world’s total natural rubberoutput), to co-operate to revive rubber pricesthrough supply management. This Government-to-Government co-operation culminated in theestablishment of the International Tripartite RubberOrganisation (ITRO) in July 2001. ITRO is responsibleto a governing council, the International TripartiteRubber Council. Among the initial arrangementsunder ITRO endorsed in December 2001, was anannual natural rubber production cutback of 4%and a reduction in exports by 10%, to commence inJanuary 2002.
Arising from poor external demand, production ofsaw logs fell by 15.3% in 2001. In particular,
demand from Japan, Taiwan, Hong Kong and Koreawas lower in tandem with the global economicslowdown. In 2001, Malaysia’s tropical logs continuedto face stiff competition from softwoods particularlyfrom Russia, Europe, Chile and New Zealand. Asexport demand was lower, export prices of saw logsfell to RM315 per cubic metre in 2001. Similarly,sawn timber also posted poor export performancewith earnings declining by 24.7%. Lower exportvolume, particularly to major traditional buyers in theAsia-Pacific region, and lower prices contributed tothe decline.
The Malaysian Timber Certification Council (MTCC),which was set up in January 1999 with the objectiveof operating a voluntary national timber certificationscheme for Malaysia, officially launched itscertification scheme in January 2002. The certificationscheme is to be implemented in two phases. Underthe first phase, the Malaysian Criteria, Indicators,Activities and Standards of Performance for forestmanagement Certification (MC & I) would be used asthe standard to assess forest management practices inthe permanent forest estates at forest managementunit levels. The MTCC certification scheme providesbuyers of Malaysian timber products the assurancethat the products are sourced from sustainablymanaged forests. In order to ensure a wider marketacceptance of its scheme and certified products,MTCC has been working closely with the ForestStewardship Council (FSC) and local stakeholdersthrough the National Steering Committee to designan FSC-compatible certification standard that can beused under the second phase of the MTCC scheme.Based on the current progress in the implementationof the certification scheme, MTCC-certified timberproducts are expected to be available in the marketby mid-2002.
Production of cocoa beans contracted by 17.9% in2001 as yields were affected by unfavourable weatherconditions. In addition, production was affected bycontinued conversion of cocoa cultivated land toother crops. Nonetheless, the Malaysian Cocoa Boardintensified its efforts to increase cocoa productivitythrough rehabilitation programmes in selected areas.A significant development for the cocoa sector in2001 was the marked pick up in international cocoaprices. This was brought about mainly by lowerglobal supplies as production in major producingcountries declined significantly. Malaysian cocoaprices rose to RM3,494 per tonne in 2001 (2000:RM2,879) leading to a 73.3% increase in total foreignearnings from cocoa exports.

The Malaysian Economy in 2001
21
Mining sector In 2001, the mining sector grew moderately by0.2%. The growth was driven primarily by higherproduction of natural gas, which increased by3.2% in response to higher demand, particularlyfrom the domestic power generation sub-sector. Incontrast, production of crude oil and tin declined.Total crude oil production of 581,000 barrels perday (bpd.) was 2.3% lower than that of theprevious year in response to lower externaldemand particularly by traditional markets in theregion. It was also marginally below the 600,000bpd. production target set for the year under theNational Depletion Policy which aims to sustain theexploitation of the nation’s crude oil reserves.Malaysia’s total earnings from mineral exports
were lower by 12.6% (2000: +55.9%) primarilydue to weaker crude oil prices.
In 2001, amidst ample supply and weak global oildemand that worsened further following theSeptember 11 incident, the price of crude oil inthe international oil markets trendeddownwards. International oil prices, benchmarkedto Brent price, ranged between US$25-US$28 perbarrel in the first nine months of the year, beforedeclining further to US$21.36, US$19.19 andUS$18.80 in October, November and Decemberrespectively. For 2001 as a whole, the averageBrent price was US$25 per barrel, lower byUS$4.00 than the average oil price in the previousyear. Oil prices declined despite efforts by theOrganisation of Petroleum Exporting Countries tosupport oil prices through three crude oilproduction cutbacks totalling 3.5 million bpd. Inline with the trend in global oil markets, the priceof Malaysian crude oil exports was lower at anaverage of US$25.53 per barrel in 2001 (2000:US$29.58). Combined with lower export volume,export proceeds from crude oil declined by 21.9%(2000: +53%).
Production of natural gas increased in 2001. Theincrease was driven mainly by higher domesticdemand, particularly from the power generationsub-sector, accounting for about 72% of the totaldomestic utilisation of natural gas. The districtcooling system sub-sector, another maindomestic user which utilises natural gas toproduce chilled water for air-conditioningsystems and generate electricity for several newbusiness and administration centres in and aroundKuala Lumpur, also recorded an increase indemand for gas. External demand for liquefiednatural gas (LNG) also increased, albeit marginallyby 0.4%. In tandem with lower crude oil prices,LNG prices also declined in 2001. With a marginalincrease in export volume and a decline in price,export earnings from LNG declined by 0.7%in 2001.
In December 2001, a new gas field locatedoffshore in Terengganu commenced operations tocater for the projected future increase in demandfor gas. A total of 34 exploration wells and 56development wells were drilled during the year, inaddition to the 438,702 line kilometres of seismicdata acquired for exploration and developmentpurposes. In 2001, only one new production-sharing contract was signed.
-10
-5
0
5
10
15
20
Natural gas
Value added
Crude oil
% yoy
1997 1998 1999 2000 2001
m
-30
-20
-10
0
10
20
30
40
50
60
70
80
-10
-30
-20
-10
0
10
20
30
40
% yoy US$/barrel
1997 1998 1999 2000 2001p
Total mineral exports (LHS) Crude oil exports (LHS)LNG exports (LHS) Crude oil export price (RHS)
p Preliminary
29.5825.53
Graph 1.22Mineral Exports
Graph 1.21Mining Production

22
Services SectorIn a moderating growth environment, pro-growthpolicies to stimulate domestic activities resulted ingrowth of the services sector being sustained at ahigh level of 4.9% in 2001 (2000: 4.8%). Growthcontinued to be broad-based, with the intermediateservices group expanding at a faster rate than thefinal services group. Supported by the stronggrowth, the contribution of the services sector toGDP rose to 55.8% (53.4% in 2000 and 51.9% in1997).
Intermediate services, comprising transport,storage and communication; and finance, insurance,real estate and business services recorded strongergrowth of 6.5% in 2001. The strong expansion inthe transport, storage and communication sub-sector was primarily due to the rapid growth in the
Table 1.9Mining Sector: Value Added, Production and Exports
Value Added (RM million at 1987 prices) 14,416 3.1 14,444 0.2
Production
Crude oil and condensates 681,000 -1.5 668,000 -1.9(barrels per day)
of which:Crude oil (barrels per day) 595,000 -2.2 581,000 -2.3
Natural gas – net(million standard cubic feet) 1,598,325 10.8 1,649,490 3.2
Tin-in-concentrates(tonnes) 6,307 -14.1 4,900 -22.3
Exports (RM million) 26,811 55.9 23,445 -12.6of which:
Crude oil (‘000 tonnes) 16,672 -5.9 15,077 -9.6(US$/barrel) 29.58 62.7 25.53 -13.7(RM million) 14,241 53.0 11,118 -21.9
Liquefied natural gas(‘000 tonnes) 15,430 2.3 15,492 0.4(RM/tonne) 740 75.9 732 -1.1(RM million) 11,422 79.9 11,342 -0.7
Tin(‘000 tonnes) 21 -14.2 27 32.3(RM/tonne) 21,089 3.3 16,900 -19.9(RM million) 435 -11.4 461 6.0
p Preliminary
Sources: PETRONASDepartment of Statistics, MalaysiaDepartment of Minerals and Geosience, Malaysia
2000 2001p
Volumeand
Value
Volumeand
Value
Annualchange
(%)
Annualchange
(%)
Table 1.10Malaysia: Crude Oil and Natural Gas Reserves 1
2000 2001
Crude oil Reserves (billion barrels) 3.43 3.39Reserve/Production (year) 16 15
Natural gasReserves
(trillion standard cubic feet) 84.4 82.5Reserve/Production (year) 30-40 30-40
1 The National Depletion Policy (NDP) was introduced in 1980 to safeguard the exploitation of the national oil reserves by postponing the development and control the production of major oil fields (with reserves of 400 million barrels or more).
Source: PETRONAS
As at 1 January

The Malaysian Economy in 2001
23
In year 2001, PTP managed a throughput of 2.04million TEUs (20-ft equivalent units) with a total of2,283 container vessels, calling at the port. Thisrepresented an increase of about five times over the424,924 TEUs registered in 2000.
In terms of capacity expansion, Westport in PortKlang has increased its capacity from 1.8 million TEUsto 2.5 million TEUs with the construction of anadditional 600 metres of berth length and aninvestment of more than RM100 million onequipment. Northport, in turn, has invested RM1.3million to develop Phase I of the Wireless ApplicationProtocol service designed for the logistics andtransportation industry. Northport also invested in 10
Table 1.11Growth in the Services Sector at Constant 1987 Prices
2000 2001p 2000 2001p
Annual change % % share of GDP
Services 4.8 4.9 53.4 55.8
Intermediate services 5.9 6.5 20.5 21.7Transport, storage and communication 7.3 5.2 8.0 8.4Finance, insurance, real estate and 5.1 7.3 12.5 13.4
business services
Final services 4.1 3.9 32.9 34.1Electricity, gas and water 7.5 5.6 3.8 4.0Wholesale and retail trade, hotels 5.8 3.3 14.8 15.2
and restaurantsGovernment services 1 1.4 5.4 6.9 7.2Other services 2 1.5 2.9 7.5 7.7
1 Include general public services (general public administration, external affairs and public order and safety),defence, health, education, and others.
2 Include imputed rent from owner-occupied dwellings; community, social and personal services; productsof private non-profit services to households; and domestic services of households.
p Preliminary
Source: Department of Statistics, Malaysia
-8
-6
-4
-2
0
2
4
6
8
10
12
OverallServices
FinalServices
IntermediateServices
1998 1999 20012000
1Q 2Q 3Q 4Q 1Q 2Q 3Q 4Q 1Q 2Q 3Q 4Q 1Q 2Q 3Q 4Q
% yoy
8
3Q 4Q
Graph 1.23Services Sector: Quarterly Annual Growth
mobile phone and Internet services segment of thetelecommunications industry and the increase in thelocal ports’ transhipment activities. The market sizefor fixed telephones increased to 4.7 million as atend-2001 (2000: 4.6 million) while that for cellulartelephones was 7.5 million (2000: 5.1 million). Theprepaid service of the cellular telephone servicesalso expanded in 2001 as it appealed to theyounger generation and casual users. Demand forother value-added services with additionalapplications and features, such as the ShortMessaging Services (SMS), also increased in 2001.
Government initiated programmes to enhance andexpand the domestic shipping and ports servicessub-sector contributed to the increase in cargotranshipment activities as well as in the handlingcapacity of cargo at local ports. With thecontinuous flow of new investment and withimprovement in services provided by the portauthorities nationwide, the activities of Malaysianports expanded further in 2001. Containerthroughputs at six major ports recorded an increaseof 43.5%.
The strong performance of the Port of TanjungPelepas (PTP) and Port Klang was the result ofconcerted plans by the Government to promoteMalaysian ports as regional trade and shippinghubs. Port Klang has made significant progress inthe past few years. In 2000, it was ranked 12thamong the world’s container ports, up two notchesfrom the 14th position in 1999.

24
new straddle carriers and has ordered another sevencarriers to complement the existing fleet.
The performance of the air transport industry wasless favourable in 2001, due largely to theslowdown in international trade. Shipment ofelectronics and other goods from Malaysia wereaffected by the slowdown in electronics exports.Global passenger traffic also declined,
particularly after the September 11 incident whenpassengers became more risk averse. Currentmeasures to increase flight frequency from KLIAinclude open sky policy agreements for passengerand cargo services with several developedcountries, bilateral agreements and strategicalliances with other airports to allow additionalinternational landing rights, flight frequencies andnew destinations.
Rail transport recorded a higher revenue in 2001,attributed mainly to the cargo business sector. Theopening of the landbridge linking Thailand and PortKlang by rail has increased KTM Berhad’s cargorevenue. In the case of the LRT, the total ridershipfor the year increased by 16.5% with 85 millionpassengers.
In the finance, real estate and business servicessub-sector, value added growth was also higher. The
increase reflected mainly higher collection ofinsurance premium income as well as the strongerperformance of the banking institutions. Strongpick-up in activity in the stock market in the secondhalf-year has contained the negative contribution ofthis sub-sector.
Growth in the final services group, whichcomprised utilities; wholesale and retail trade, hotels
and restaurants; government services and otherservices was sustained at 3.9% in 2001 (2000:4.1%). The utilities sub-sector recorded a highergrowth despite weakening demand from lowermanufacturing activities. Value added of electricitygeneration increased further due to higher demandby the domestic-oriented industry and thecommercial sector. Growth in the sub-sector was alsosupported by an increase in the consumption ofwater, which rose by 7% in 2001.
The wholesale and retail trade, hotel andrestaurants sub-sector recorded a positiveperformance in 2001, supported mainly by the fiscalstimulus measures that raised disposable incomes ofthe household sector. Higher tourist arrivals alsocontributed to positive performance of this sub-sector. In addition, Malaysia also benefited from thehosting of the South East Asia (SEA) Games inSeptember.
Table 1.12Selected Indicators for the Services Sector
2000 2001p
Annual change %
Cargo throughput at five major ports1 14.9 10.4Container throughput at six major ports2 30.3 43.5KLIA passenger 11.9 -1.3KLIA cargo 21.6 -13.7LRT ridership3 81.1 16.5Insurance premiums 28.6 12.4KLSE (turnover, volume) –19.7 –27.3Tourist arrivals 28.9 25.0Hotel occupancy rate 57.7 58.6Electricity production index 6.1 8.6
1 Include Port Klang, Johor Port, Penang Port, Sabah Ports and Bintulu Port.2 Include Port Klang, Johor Port, Port of Tanjung Pelepas, Penang Port, Sabah Ports and
Bintulu Port.3 Include STAR and PUTRAp Preliminary
Sources: Relevant port authorities; Sistem Transit Aliran Ringan Sdn Bhd (STAR); ProjekUsahasama Transit Ringan Automatik Sdn Bhd (PUTRA);Kuala Lumpur Stock Exchange (KLSE); Bank Negara Malaysia; Malaysia Tourism Promotion Board; and Department of Statistic, Malaysia
Growth in the services sector was sustained at a high level, withincreased activity in new growth sectors.
1997 1999 2000 20011998
Value added of sub-sector (LHS)
Tourist arrivals (RHS)
Private consumption (RHS)
% yoy % yoy
-20
-10
0
10
20
30
40
50
-4
-2
0
2
4
6
8
10
Graph 1.24Wholesale and Retail Trade, Hotels andRestaurants, Private Consumption and TouristArrivals

The Malaysian Economy in 2001
25
expenditure remained strong at 15.5% in 2001(2000: 19.9%). The higher capital spending allocatedin the Budget and the first stimulus package wasmainly for education and training, as well asinfrastructure and industrial development, with theobjective of stimulating economic growth in theimmediate term, enhancing human resourcedevelopment and capacity building in the longerterm. The capital spending allocated under thesecond stimulus package was mainly for smallprojects for which funds could be disbursedimmediately.
During the year, total capital expenditure of theNon-Financial Public Enterprises (NFPEs) was higher,attributed to the modernisation and expansionprogrammes of several major NFPEs, notably,Petroleum Nasional Berhad (PETRONAS), TenagaNasional Berhad (TNB), Putrajaya Holdings Sdn.Bhd., as well as Telekom Malaysia Berhad (TMB).Capital expenditure by PETRONAS included theimplementation of the Malaysia Liquefied NaturalGas Tiga (MLNG 3) project, the integratedpetrochemical complexes in Kertih and Gebeng aswell as acquisition of new LNG tankers. Capitaloutlays by TNB were mainly for expansion andupgrading of power generation, transmission and
-60
-40
-20
0
20
40
91 92 93 94 95 96 97 98 99 00 01p
% yoy
Aggregate domestic demand (excl. stocks)
Private consumptionPublic consumption
Private investmentPublic investment
p Preliminary
Graph 1.25Real Domestic Demand Aggerates
increased by 2.8% during the year. Low interestrates and the Government’s measures to increasehousehold disposable income through a temporaryreduction in employee’s EPF contribution rate,higher tax rebates and the increase in the taxable
Public sector expenditure provided the main impetus to containthe slowdown in domestic demand.
In the Government services sub-sector, value addedwas higher in 2001. The increase reflected mainlyhigher expenditure on emoluments arising from thebonus payment of half month salary or at leastRM1,000 to all civil servants.
DOMESTIC DEMAND CONDITIONS
In 2001, measures to promote domestic demand ledto a stronger expansion in public sector spending andsustained growth in private consumption. As a result,the slowdown in real aggregate domestic demand(excluding stocks) was contained at 2.3% in 2001(2000: 14.5%).
Public sector expenditure registered a strongergrowth of 13.9% in 2001, supported by theexpansionary budget and two additional fiscalstimulus packages. Efforts to improve efficiency ofproject implementation resulted in theimplementation shortfall being contained at less than5%. Consequently, growth in public investment
distribution networks to ensure adequatesupply of electricity to meet longer-termdemand. TMB continued to channel its capitalspending in information and communicationtechnology. Capital outlays by Putrajaya HoldingsSdn. Bhd. were mainly for the new administrativecentre in Putrajaya. Meanwhile, the two waferfabrication plants, namely, First Silicon in Kuchingand Silterra in Kulim, continued to expand theircapacity.
The strong growth in public consumptionexpenditure of 11.9% in 2001 was due mainly toprocurement of office supplies related toe-Government flagship applications, payments forprofessional services and bonus payments for theyear 2001.
In an environment of low external demand, fiscalstimulus measures played an instrumental role incontributing to the positive growth in privateconsumption. Private consumption, as such,

26
income bracket for the low- and medium-incomegroups contributed positively to growth inconsumer spending. Major indicators forconsumption, including sales of new passengercars, sales and service tax collections as well asloans disbursed for both consumption purposesand general commerce, confirmed thatconsumption spending was sustained in 2001.
Reflecting the effect of lower external demand andexcess capacity in selected sectors of the economy,particularly in the export-oriented industries,private investment declined by 19.7% in 2001.This trend was also reflected in several keyinvestment indicators, including lower imports ofcapital goods and lower applications received forinvestment in the manufacturing sector.
Table 1.13Private Consumption Indicators
Sales of passenger cars (incl. 4WD)
‘000 units 296.6 76.5 81.8 91.8 93.2 343.3Annual change (%) 15.9 16.2 7.8 18.9 19.9 15.7
Imports of consumption goods
US$ billion 4.5 1.1 1.2 1.1 1.3 4.6Annual change (%) 14.9 5.0 1.5 –5.8 11.4 3.0
Tax collection (AG)Sales tax(RM billion) 6.0 1.1 2.1 1.4 2.8 7.4Service tax(RM billion) 1.7 0.3 0.6 0.4 0.7 1.9
Loans disbursed by banking system
Consumption credit(excl. passengercars)
(RM billion) 26.8 7.2 7.7 7.8 8.3 31.0Wholesale, retail,restaurants & hotels(RM billion) 62.9 16.7 17.0 16.6 15.7 65.9
MRA retail salesAnnual change (%) 10.6 4.8 -1.6 1.6 0.7 1.7
Credit card operationTurnover spending(RM billion) 19.3 5.2 5.6 6.1 6.5 23.4Annual change (%) 39.5 23.2 20.5 20.9 20.0 21.0
MIER ConsumerSentiments Index – 105.7 96.2 98.7 93.8 –
20011Q 2Q 3Q 4Q Year
2000
Table 1.14Private Investment Indicators
Sales of commercial vehicles (incl. 4WD)
‘000 units 46.6 11.1 12.8 15.4 13.8 53.1Annual change (%) 42.7 12.9 5.0 20.4 17.1 14.0
Imports of capital goodsUS$ billion 11.6 3.2 2.8 2.6 2.9 11.5Annual change (%) 38.6 42.4 –5.2 –24.4 –2.6 -1.1
Applications to MITINo. of projects 974 168 201 197 146 712Capital investment(RM billion) 46.2 3.6 4.9 3.9 3..4 15.8Foreign 30.2 2.4 3.6 2.4 2.4 10.8Local 16.0 1.2 1.3 1.5 1.0 5.0
Approvals by MITINo. of projects 805 240 210 222 141 813Capital investment(RM billion) 33.6 11.1 5.3 4.6 3.7 24.7Foreign 19.8 8.1 3.7 3.5 3.0 18.3Local 13.8 3.0 1.6 1.1 0.7 6.4
Loans disbursed by banking system
Manufacturing sector(RM billion) 94.1 25.1 27.3 25.6 26.0 103.9
Construction sector(RM billion) 23.6 5.8 5.5 4.6 4.9 20.9
Private Debt Securities
Total fund raised 22.5 5.2 4.9 7.8 12.6 30.6(RM billion)
MIER BusinessConditions Survey
Business ConditionsIndex 46.3 44.0 42.6 42.3
Capacity Utilisation Rate 79.2 77.4 79.4 79.6
20011Q 2Q 3Q 4Q Year
2000
– –
––
Capital investment in the manufacturing sectorwas estimated to decline by 24.1% in 2001. Theoverall capacity utilisation in the export-orientedindustries in the manufacturing sector was below80% throughout 2001. New investment activitiesin the manufacturing sector were mainly sustainedby ongoing petrochemical projects, electrical andelectronics projects approved in 2000 and 2001,as well as capacity expansion in the non-metallicmineral products industry where producers werealready operating at high capacity.
The total value of investment in themanufacturing sector approved by the Ministryof International Trade and Industry (MITI)amounted to RM24.7 billion in 2001 (2000:RM33.6 billion). Of the total investment approved,

The Malaysian Economy in 2001
27
projects approved were in the electrical andelectronic products industry (51.4%); paper,printing and publishing industry (16.8%) and non-metallic mineral products industry (8.7%). The topfive sources of foreign investment during the yearwere the United States, Japan, China, Singaporeand the Netherlands. These countries togetheraccounted for 76% of total foreign investmentapproved by MITI.
Capital spending in the construction sector in2001 was supported by the construction of severalhighway projects, including SPRINT Highway andElevated Highway (completed in 2001) as well as
Others23.5%
Manufacturing37.8%
Construction20.1%
Services18.6%
Graph 1.26Private Investment by Sector, 2001 (% share)
0
5
10
15
20
25
30
35
0
200
400
600
800
1000
1200
1400
RM billion No. of projects
91 92 93 94 95 96 97 98 99 00 01
Domesticinvestment
Foreigninvestment
No. ofprojects
Graph 1.27Approved Investment in the ManufacturingSector
eight large projects, each with capital investmentexceeding RM500 million, accounted for RM11.5billion or 46.4% of the total investment approved.The electrical and electronic products industrycontinued to account for the highest share of41.2% of total investment approved in 2001. Thiswas followed by the paper, printing andpublishing industry (20.3%); non-metallic mineralproducts industry (8%) and chemicals andchemical products industry (4.5%).
The value of foreign investment approved in themanufacturing sector in 2001 was RM18.3 billion(2000: RM19.8 billion). The bulk of the new
U.S.A18.0%
Japan17.9%
China16.2%
TheNetherlands
11.8%
Others24.2%
Singapore11.9%
Transportequipment
4.5%
Others21.5%
Electrical andelectronicproducts41.2%
Paper, printingand publishing
20.3%
Non-metalicmineralproducts
8.0%
Chemicals andchemicalproducts
4.5%
Graph 1.28Approved Manufacturing Investmentby Industry, 2001 (% share)
Graph 1.29Foreign Participation in Approved ManufacturingInvestment by Country, 2001 (% share)

28
Kajang Ring Road, SPRINT Highway (Package C),Kajang-Seremban Expressway and Guthrie CorridorExpressway. Investment in the residential sub-sector continued to be high, due mainly to theconstruction activities for affordable housing andselected high-cost housing in strategic locations.
In the services sector, capital investment in theutilities sub-sector was lower, due to thedeferment of several power plant projects,including those in Sepang, Jimah and Johor.Nevertheless, investment in this sub-sectorcontinued to be supported by construction ofongoing power plants and water supply projects,including TNB Janamanjung, Nur Generation andSungai Selangor water supply projects. Capitalspending in the transport sub-sector wassupported by the ongoing construction of theExpress Rail Link and KL Monorail projects. Thecontinuous capacity expansion of Malaysian ports,including the West Port and Port of TanjungPelepas, also contributed to the investment in thetransport sub-sector. Investment in thetelecommunications sub-sector was supported bysustained capital spending in mobile line services,particularly for upgrading of network.
Capital outlays in the mining and agriculturesectors increased in 2001, albeit at a marginalrate. Investment in the mining sector wasestimated to increase by 2%, due mainly tocontinuous expansion in the oil and gas sub-sector. Investment in the agriculture sectorexpanded in 2001, attributable to the positiveeffects of the Government’s incentives, whichencouraged private sector participation on abigger scale, modern and integrated mixedfarming activities in food production, as well ashigher allocation for this sector under the NationalAgricultural Policy.
In 2001, savings of both the public and privatesectors were lower. Public sector savings declined by15.1%, attributed to the higher growth in publicconsumption and a slower growth in public sectorrevenue as a result of lower revenue from theNFPEs. In the private sector, the Government’spolicies to increase disposable income and lowerinterest rates were effective in encouragingconsumers to draw down on their past high savingsto maintain a positive growth in consumption.Overall, the share of gross national savings toGNP declined to 34.9%. Nevertheless, given theconsolidation in investment activities, the savings-
investment balance remained in surplus for thefourth consecutive year, recording a surplus ofRM27.4 billion or 8.9% of GNP in 2001 (2000:RM32 billion or 10.2%).
PRICES AND EMPLOYMENT
Consumer PricesConsumer price inflation or headline inflation1
remained low in 2001. The Consumer Price Index(CPI) moderated further to 1.4% in 2001 (1.6% in2000). Core inflation2 or underlying inflationcomputed by BNM, also displayed a similar trend,moderating to 1% (1.5% in 2000). Whileconsumer spending was sustained, the prevalenceof excess capacity in several sectors of theeconomy led to downward pressure on prices. Inaddition, the moderate appreciation of the ringgitagainst non-US dollar currencies during the year,as well as lower inflation abroad, also contributedto lower inflation in 2001.
Table 1.15Savings-Investment Gap
Public gross domestic capital formation 45,686 47,094
Public savings 56,522 47,986
Deficit / surplus 10,836 892
Private gross domestic capital formation 45,569 32,657
Private savings 66,691 59,172
Deficit / surplus 21,122 26,515
Gross domestic capital formation 91,255 79,751(% of GNP) 29.2 26.0
Gross national savings 123,213 107,158(% of GNP) 39.5 34.9
Balance on current account 31,958 27,407(% of GNP) 10.2 8.9
p Preliminary
Source: Department of Statistics, Malaysia and Bank Negara Malaysia
(RM million)
2001p2000
1 Headline inflation refers to the rate of change in the Consumer Price Index(CPI) for all items in the basket of goods and services published by theDepartment of Statistics, Malaysia.
2 Core inflation is a measure of the underlying inflation that excludes price-controlled items and price-volatile items, as well as items that are subject toone-off price adjustments from the original CPI basket. There are, however,several alternative measures of core inflation ( refer to Box article II in AnnualReport 2000).

The Malaysian Economy in 2001
29
The moderation in the rate of inflation during theyear largely reflected lower increases in the priceof food. Food, which accounts for more than athird of the total CPI basket, rose by a slower rateof 0.7% in 2001 (1.9% in 2000). While demandremained moderate, food production and suppliesincreased during the course of the year followingfavourable weather conditions and continuedGovernment measures to increase domestic foodproduction. Imported food prices were also lower,concomitant with the moderate appreciation ofthe ringgit.
Despite the prevalence of excess capacity, pricesfor beverages and tobacco; transport andcommunication; as well as medical care and healthexpenses registered higher rates of increase. Theselargely reflected the impact of one-off priceadjustments arising from:
• Higher bus fares (10-30%) which were introducedin July-October 2000;
• Higher prices for several petroleum products (7.6-9.4%) from October 2000;
• Higher sales tax on alcoholic beverages (5%), andcigarettes and tobacco products (10%) as announced in the 2001 Budget, effective November 2000;
• Higher prices for several pharmaceutical products (10-20%), with effect from March 2001;
• Higher domestic airfares (51.8%) from August 2001; and
• A further price adjustment for petrol prices (8.3%)and higher import and excise duties on cigarettesand tobacco products (20%), which took effect inmid-October 2001, following the 2002 Budgetpresentation.
These goods and services accounted for only 9% ofthe total CPI basket and the higher prices for thesegoods and services contributed about 0.64% to totalCPI inflation in 2001. Meanwhile, price increases forother sub-groups also remained relatively stable,
Graph 1.30Inflation: Annual Rate of Change
0
1
2
3
4
5
6
J F M AM J J A S O N D J F M AM J J A S O N D J F M AM J J A S O N D
1999 2000 2001
% Change
Measures of Consumer Price Inflation
-20
-15
-10
-5
0
5
10
15
20
J F M AM J J A S O N D J F M AM J J A S O N D J F M AM J J A S O N D
1999 2000 2001
Commodityrelated
Non commodity related
Overall
Producer Price Index
% change
-2
0
2
4
6
8
10
12
J F M AM J J A S O N D J F M AM J J A S O N D J F M AM J J A S O N D
1999 2000 2001
% change
Food
Transport and communication
Beverage andtobacco
Medical care andhealth expenses
Consumer Price Index
Overall
Headline
Core Inflation
Table 1.16One-off Price Adjustments
Sub-groups
Beverages and tobaccoAlcoholic beverages 0.29 2.45 0.01Cigarettes and tobacco 1.72 7.11 0.12
Medical care and health expenses
Medical and pharmaceutical products 0.58 1.79 0.01
Transport and communicationBus fares 1.10 6.20 0.07MAS domestic airfares 0.39 10.75 0.04Petroleum products 4.96 7.82 0.39
Total 9.04 0.64
Increase(%)
Weights(%)
Contribution(%)

30
except for clothing and footwear, where pricescontinued to decline during the year.
The upward price adjustment for the bus fares,domestic airfares, pharmaceutical products andpetroleum products were allowed in order to reflect theunderlying market conditions such as higher importedprices, production costs and commodity prices. Inparticular, crude petroleum prices had increasedsignificantly since early 1999. It was necessary for retailprices for petroleum products to be adjusted as andwhen the underlying market conditions changed inorder to gain long-run economic efficiency andcompetitiveness. The adjustment to retail prices ofpetroleum products during a period where inventoriesand excess capacity in several sectors prevailed had, tosome extent, minimised the pass-through effects onprices for other consumer products, in particular, foodprices.
Producer PricesProducer prices declined in 2001 amidst thegenerally weak commodity prices. The ProducerPrice Index (PPI) registered a decline of 5% in 2001compared to an increase of 3.1% in 2000. Thedecline in producer prices reflected mainly lowerprices charged by local producers. This was onaccount of lower prices for commodity-relatedproducts, namely inedible crude materials; mineralfuels, lubricants and related materials; and animaland vegetable oil and fats. Lower prices of theseproducts were concomitant with the generallyweak prices of crude palm oil, rubber as well ascrude petroleum in 2001. Meanwhile, prices forgoods paid by importers were relatively stablethroughout the year amidst the stable ringgitexchange rate. Overall, excluding commodity-related products, non-commodity related producer
-0.2 0.0 0.2 0.4 0.6 0.8 1.0 1.2 1.4 1.6 1.8Percentage point
2001
Clothing and footwear
Furniture, furnishings and household equipment and operation
Recreation, entertainment, education and cultural services
Food
Transport and communication
Gross rent, fuel and power
Beverages and tobacco
Miscellaneous goods and services
Medical care and health expenses
Overal CPI
2000
Graph 1.31Contribution to Annual Change in the Consumer Price Index
prices were stable in 2001. This, in turn,contributed to stable consumer prices duringthe year.
Table 1.17Price Indicators
Weights 2000 2001
Consumer PriceIndex (2000=100) 100.0 1.6 1.4
of which:Food 33.8 1.9 0.7Beverages and tobacco 3.1 2.8 4.8Clothing and footwear 3.4 -1.7 -2.6Gross rent, fuel and power 22.4 1.5 1.4Furniture, furnishings and household equipment and operation 5.3 0.0 0.1
Medical care and health expenses 1.8 2.0 2.9
Transport and communication 18.8 2.1 3.6Recreation, entertainment, education and cultural services 5.9 0.5 -0.1
Miscellaneous goods and services 5.5 0.9 0.7
Consumer Price Index by RegionPeninsular Malaysia 81.6 1.7 1.5Sabah 8.9 0.6 0.6Sarawak 9.5 1.5 0.8
Producer Price Index (1989=100) 100.0 3.1 -5.0
of which:Local Production 79.3 3.6 -6.1Imports 20.7 1.1 -0.3
House Price Index (1990=100) 4.7 0.91
of which:Klang Valley 12.4 -0.41
Johor Bahru 2.8 -2.31
Penang Island 8.3 -3.71
1 January-JuneSource: Department of Statistics, Malaysia
NAPIC, Department of Valuation and Property Services
Annual change(%)

The Malaysian Economy in 2001
31
Labour Market DevelopmentsIn 2001, the impact of the slowdown in economicactivity was felt by the labour market, particularlyin terms of retrenched workers in themanufacturing sector. However, given theflexibility accorded by the labour market,alternative measures that were adopted byemployers such as pay cuts and temporary layoffshelped contain the number of workers retrenched.During the year, the slower growth environmentresulted in both the total employment and labourforce expanding at more moderate rates of 2.6%to 9.5 million workers and 3.2% to 9.9 millionpersons, respectively. Amidst low inflation andexcess capacity, the slack labour market conditionscontributed to some moderation in wage increasesin 2001.
Given the labour market conditions during theyear, the unemployment rate edged upwards from3.1% in 2000 to 3.7% in 2001, with the numberof unemployed increasing by 63,500 to 364,800persons. The unemployment rate, however,remained below the 4% deemed as fullemployment level.
On a sectoral basis, the slower growth inemployment in 2001 was due mainly to apronounced decline in employment registered bythe manufacturing sector, given declining demandfor manufactured products, particularly forelectronics and electrical products. As such, themanufacturing sector which accounted for asignificant number of new jobs in 2000 (156,100)registered the largest contraction in employment(29,900). However, the decline in employment inthe manufacturing sector was more than offset bythe continued robust employment by the servicessector which registered the majority of the totalnumber of new workers employed (90.2% or217,300 persons). Within the services sector, thenew jobs created were concentrated mainly in the‘other services’ sub-sector which include socialservices, private services, non-profit services ofhouseholds and domestic services of households(41.5%) and the wholesale and retail trade, hotelsand restaurants sub-sector (24.1%). The bankinginstitutions’ merger programme saw minimaldisruption as employment in the banking sub-sector declined only marginally by 2% to 93,314persons as at end-2001. Meanwhile, in theconstruction sector, 55,500 new jobs weregenerated, consonant with the increase inresidential housing and public infrastructureprojects.
Table 1.18Labour Market Indicators
Labour force (‘000) 9,039 8,849 9,178 9,573 9,877(annual change in %) 4.6 –2.1 3.7 4.3 3.2
Employment (annual change in %) 4.7 –2.9 3.5 4.6 2.6Unemployment rate (% of labour force) 2.4 3.2 3.4 3.1 3.7Labour productivity (GDP/Employment)
(annual change in %) 2.5 –4.6 2.5 3.5 –2.1Real wage per employee in manufacturing sector
(annual change in %) 6.0 –2.4 3.0 5.0 1.5
Source: Economic Planning UnitDepartment of Statistics, MalaysiaBank Negara Malaysia
19981997 1999 2000 2001
0
1,000
2,000
3,000
4,000
5,000
('000 persons)
Agriculture,forestry and
fishing
Manufacturing Construction Services
1999 2000 2001
Source: Economic Planning Unit
Graph 1.32Total Employment by Sector

32
In order to contain the contraction in earnings,employers reduced their workforce as part of theoverall rationalisation process to lower productioncosts. The following provides an assessment ofretrenchment in 2001:
• A total of 38,116 workers were retrenched (2000:25,236), with 75.6% from the manufacturingsector. The electronics and electrical products sub-sector accounted for almost half (45.7%) of thetotal number of workers retrenched.
• The number of employers involved inretrenchment increased by 55.2% to 1,380.
• Total retrenchment in 2001 accounted for45.4% of the retrenchment recorded during thefinancial crisis in 1998.
• Almost half (48%) of the total number of workersretrenched was due to the decline in the demandfor products.
• By job category, production and related workers comprised the majority retrenched (63.6%). The retrenchment of professional, technical and related workers increased significantly by 54.8% in 2001 (2000: -36.2%), indicating that cost cutting measures affected both the high-end and low-end workers.
• Local workers accounted for the majority (86.9%) of the total number of retrenched workers.
• In terms of location, West Malaysia accounted for 96.9% of retrenched workers, with Penang, a major producer of electronics recording 23% of total retrenchment, followed by Johore (20.6%) and Selangor (15.5%).
• BNM’s Company Survey findings indicated that the magnitude of layoffs during the year differed based on the type of company ownership. The majority of locally-owned companies that retrenched workers implemented layoffs across alljob categories, hence, halting production completely. On the other hand, the majority of
-8
-6
-4
-2
0
2
4
6
8
10
12
-8
-6
-4
-2
0
2
4
6
8
10
12
GDP Total Employment Labour Force Unemployment Rate
Source: Economic Planning Unit Bank Negara Malaysia
% annual change % of labour
1997 1998 1999 2000 2001 1997 1998 1999 2000 2001
Graph 1.33Output and Employment
0
10,000
20,000
30,000
40,000
50,000
60,000
70,000
80,000
90,000
1998 1999 2000 2001
Total RetrenchmentRetrenchment in manufacturing sectorRetrenchment in services sectorRetrenchment in agriculture sectorRetrenchment in construction sector
Number ofworkers
Source: Ministry of Human Resources
Graph 1.34Retrenchment by Sector

The Malaysian Economy in 2001
33
foreign-owned companies that retrenched, laid offonly a proportion of their production and sales staff, thus, allowing production to continue, subject to shorter working hours. Also, layoffs were found to be higher for companies thatexport the bulk of their products to the US andJapan, compared to Europe.
• Retrenchment peaked in September 2001 with 5,828 workers laid off. In the fourth quarter of 2001, however, retrenchment declined by 40%, compared with the preceding quarter. The improvement in the labour market situation towards end-2001 indicated that the impact ofthe US economic slowdown on businesses inMalaysia had somewhat stabilised and that mostcompanies were in the midst of businessconsolidation.
During the year, an increased number of employers(941; 2000: 144) took alternative measures, ratherthan retrenchment, to contain the impact of theslowdown on their workers. Hence, salaries of36,294 workers were cut, while 91,915 workerswere temporarily laid off. Also, 27,756 workersaccepted the Voluntary Separation Scheme (VSS)during the year. In the banking sector, 4,240employees had accepted the VSS as at end-December 2001.
Excluding expatriate workers, the Governmentapproved the recruitment of 258,578 new foreignworkers (2000: 230,608), increasing the total numberof registered foreign workers by 5% to 769,566. Theforeign workers were employed mainly in themanufacturing, agriculture and domestic servicessectors. In 2001, the majority (73.7%) originatedfrom Indonesia.
Labour demand as measured by the number of jobvacancies increased more moderately by 6.5% to131,459 in 2001 (2000: 14%). The number of jobvacancies could have been under-reported as it is notcompulsory for firms to report vacancies to theManpower Department of the Ministry of HumanResources. The vacancies were concentrated mainlyin the manufacturing (46%), agriculture, forestry andfishing (27.6%) and services (15.7%) sectors.Sarawak continued to account for more than half ofthe job vacancies. Penang registered the largestcontraction in vacancies (46.2%), compared with thepreceding year.
The total number of active job seekers1 registeredwith the Manpower Department increased by 22.9%to 34,200 as at end-2001 (end-2000: -12.6%).Compared with the previous year, the more moderateincrease in demand for labour resulted in thewidening of the ratio of vacancies to job seekers from1:0.23 at end-2000 to 1:0.26 at end-2001. In
0
2,000
4,000
6,000
8,000
10,000
12,000
14,000
16,000
18,000
20,000
1 2 3 4 5 6 7 8
Number ofemployees
Source: Ministry of Human Resources
2000
2001
1 Closure of companies2 Sale of companies3 Relocation to foreign countries4 Relocation locally5 High production cost6 Reduction in demand for products7 Company reorganisation and automation8 Others
Graph 1.35Reasons for Retrenchment
Graph 1.36Retrenchment of Workers vs. AlternativeMeasures
0
20,000
40,000
60,000
80,000
100,000
120,000
Number ofemployees
Pay cuts Temporarylayoffs
Voluntaryseparationschemes
Retrenchment
Source: Ministry of Human Resources
2000
2001
1 Data is under-estimated as it is not compulsory for job seekers to register withthe Manpower Department.

34
particular, the ratio for the professional andadministrative related group widened from 1:1.40 to1:2.15, whilst that of the clerical related groupincreased from 1:1.18 to 1:1.72. As at end-2001, themajority of the unemployed2/ consisted of those withsecondary school qualifications (65.7%). Whilst mostjob vacancies were for production operators (67%), alarge part of the jobs sought was clerical related(45%). Although a significant portion ofunemployment was cyclical during the year, ananalysis using the Beveridge (Unemployment-Vacancy3/) Curve illustrates the mismatch betweenlabour supply and demand in 2001, as shown by theupward and rightward shift in the curve from 2000 to2001.
With the retrenchment of workers and the reductionin salaries experienced by selected sectors during theyear, wage pressures generally eased:
• Data from the Monthly Survey of Manufacturing Industries conducted by the Department of Statistics indicated that on an annual basis, real
wage per employee increased marginally by 1.5% in 2001 (2000: 4.9%), while labour productivity as measured by real sales value of products (SVP) per employee declined by 2.1% (2000: 16%). Labour productivity, as measured by the ratio of GDP to total employment also declined by the same magnitude. The poor productivity results in 2001 reflected the reduction in output due to the decline in external demand.
• The Malaysian Employers Federation’s (MEF) Salary and Fringe Benefits Survey showed that the increase in the average private sector salary had stabilised at 6.9% in 2001 (2000: 7%). The average minimum salary offered to those with a basic degree increased marginally by 0.5% to RM1,671 in 2001. On a sectoral basis, the averagesalary increase in the non-manufacturing sector was higher (7.1%) than the manufacturing sector (6.7%).
The Government continued to closely monitor theemployment situation and adopt pre-emptivemeasures to address emerging problems arising fromthe economic slowdown. Amongst others, job fairswere held nationwide to provide a platform for jobseekers to obtain information on vacancies availablefrom potential employers. The Electronic LabourExchange Project which was launched on 19September 2001 is expected to be operational onlinein 2002. The project is designed to match job seekerswith vacancies beyond geographical boundaries, thus,improving the mobility of human resources. Ofsignificance, the Government had, under the twofiscal stimulus packages announced in March andSeptember 2001 as well as under the 2002 Budget,allocated funds towards the further development ofhuman resources. In this regard, policy measureshave been directed mainly at intensifying theapplication of information technology, upgradingskills of workers, strengthening learning and trainingprogrammes, developing various institutions oflearning and improving education facilities.
A new wage agreement between the MalayanAgricultural Producers Association (MAPA) and theNational Union of Plantation Workers (NUPW)resulted in a guaranteed minimum monthly wage ofRM325 to be paid, with effect from 1 January 2001,to oil palm harvesters and oil mill workers.
As a measure to expedite Malaysia’s transition to theknowledge-based economy, a programme toencourage Malaysian citizens with special expertise
2 No. of unemployed at the end of the last quarter does not equal the totalno. for the year as nos. for all end-quarters in a year are smoothened out toobtain the yearly no.
3 Unemployment rate used pertain to the data from the Economic PlanningUnit. Vacancy rate= (no. of job offers- no. of placements) / (no. of joboffers- no. of placements + no. of employees).
0
0.2
0.4
0.6
0.8
1
1.2
1.4
3 3.1 3.2 3.3 3.4 3.5 3.6 3.7 3.8
1998
19992000
2001
Vacancy rate (%)
Unemployment rate (%)
Source: Economic Planning Unit Ministry of Human Resources Department of Statistics, Malaysia
••
••••
••
Graph 1.37Beveridge Curve for Malaysia (1998-2001)

The Malaysian Economy in 2001
35
who are employed overseas, to return to Malaysiacame into effect on 1 January 2001. On 1 July 2001,amendments to the list of expertise, in terms of thefield of expertise, eligibility and years of experiencetook effect. The revision was done to ensure that thequality of expertise approved under the programmecommensurates with the requirements of the countryfor the identified fields of expertise.
In the financial industry, a ‘Staff Re-Skilling Project’ or‘StaRs Project’ was launched on 23 March 2001 withthe objective of enhancing the mobility of staff,particularly those who accepted the VSS. The project,administered by the Institute of Bankers Malaysia andfunded by the financial institutions’ contributionstowards the Staff Training Fund, incorporates a seriesof training programmes on competencies catering tothe needs of a more knowledge-based economy, anda support infrastructure system to assist separatingstaff to seek new employment. In 2001, a total of 64programmes was conducted, benefiting about 1,300trainees.
In order to upgrade the skills of unemployedgraduates and school leavers as well as retrenchedworkers, the RM4.3 billion stimulus package whichwas introduced in September 2001, included anallocation of RM300 million for the establishment ofthe Special Scheme that consists of programmes ontraining in IT, mathematics and languages;commercial agriculture entrepreneurship; furtherstudies; and attachments with government agencies,public universities, private professional firms andsmall- and medium-scale enterprises.
Since its inception in 1993, the Human ResourceDevelopment Council (HRDC) which administers theHuman Resource Development Fund (HRDF) for theretraining and skills upgrading of workers hasapproved a total of 3.1 million training places,involving a total expenditure of RM1 billion. Inenhancing the efficiency of services provided, theHRDC which was officially corporatised on 16 May2001 has been renamed ‘Pembangunan SumberManusia Berhad (PSMB)’. As at end-December 2001,the number of employers registered with the PSMBincreased to 7,690, with the majority (71.6%) fromthe manufacturing sector and the remainder from theservices sector.
Given lower corporate earnings during the year, on 1November 2001, the levy imposed by the PSMB wasreduced by half from 1% of the companies’ monthlywage bills to 0.5%. During the year, the HRDF levy
collection increased further to RM209.1 million fromRM188.3 million in 2000. Effective for a year from1 November 2001, the financial assistance providedto employers was raised from 85% to 100% of thecost of selected training programmes conducted bylocal trainers, including training on supervision,strategic management, financial management, humanresource management and safety and health ofworkers.
In 2001, a total of 420,057 training places wasapproved by the PSMB with financial support ofRM189.8 million. The PSMB was also appointed asone of the coordinating agencies for two of the nineprogrammes under the Special Scheme that was setup for retrenched workers and unemployedgraduates. These were the ‘Training Scheme forRetrenched Workers II’ and ‘Graduate TrainingSchemes’, which benefited a total of 5,519 traineeswith an accumulated financial assistance of RM36.1million.
A Skills Development Fund (SDF) established by theMinistry of Human Resources with an allocation ofRM140 million became operational on 2 January2001. The Fund aimed to provide soft loans fortechnical and vocational training offered byinstitutions that are accredited by the NationalVocational Training Council. In 2001, about 20,000applications were approved and RM24.2 million wasdisbursed.
Overall, the adjustments observed in the domesticlabour market during the year indicated that allparties concerned, including the Government,
0
100,000
200,000
300,000
400,000
500,000
600,000
1993 1994 1995 1996 1997 1998 1999 2000 2001
Number oftraining places
Source: Pembangunan Sumber Manusia Berhad
Graph 1.38Number of Training Places Approved by PSMB

36
employers and workers had demonstrated flexibility ina more difficult economic environment. Goingforward, productivity improvements will continue todominate the agenda on transforming the economyto one that is more knowledge-based. In this regard,efforts will include the need to address skillmismatches and the further enhancement of labourmobility.
EXTERNAL SECTOR
Balance of PaymentsThe overall balance of payments turned around to asurplus position in 2001. The improvement was dueto lower outflows in the financial account. Thecurrent account surplus narrowed in 2001, butnevertheless the surplus remained large at RM27.4billion or equivalent to 8.9% of GNP. This reflected amoderate decline in the trade account andimprovement in the income and services accounts.
The impact of the global slowdown on exports hasbeen significant as exports of both manufacturedgoods and commodities declined during the year.At the same time, demand for imports ofintermediate inputs used in the production ofexports also declined. This contained the decline inthe trade surplus. Given the lower exportearnings during the year, repatriation of profitsand dividends was also lower in 2001, resulting inan improvement in the income account. Theservices deficit also declined, reflecting not onlylower payments related to export activities but alsothe marked improvement in the travel accountsurplus.
The improvement in the financial account in 2001emanated mainly from lower short-term outflows inmost major components of the short-term capital
account. Net long-term inflows moderated. Onbalance, inflows were mainly longer-term capital(foreign direct investments and external loans).
Portfolio investors were already underweight in theMalaysian market and hence outflows moderated.Gross inflows of portfolio investment, which wasmoderate in the first half-year, picked up in the thirdquarter as market sentiment turned more positive
following the accelerated pace of corporaterestructuring which strengthened the longer-termoutlook for Malaysia. This trend reversed followingSeptember 11, with profit-taking activities in the finalquarter of 2001. During the year, there was also less
incentive for the placement or retention of fundsabroad as interest rate differentials shifted inMalaysia’s favour since September 2001. This wasreflected in the lower trade credits extended toforeign importers and the decline in the net externalassets of the banking institutions in the second half ofthe year following the unwinding of foreign currencyinter-bank placements as importers undertookreduced hedging activities.
Table 1.19Balance of Payments
Goods 334,326 264,472 69,854Trade account 334,420 280,692 53,728
Services 54,929 63,295 -8,366
Balance on goods and services 389,255 327,767 61,488
Income 6,678 32,626 -25,948
Current transfers 2,059 10,192 -8,133
Balance on current account 397,992 370,585 27,407% of GNP 8.9
Capital account –
Financial account -14,841Direct investment 1,017Portfolio investment -2,489Other investment -13,369
Balance on capital and financial account -14,841
Errors and omissions -8,904of which:
Exchange revaluation loss -4,061
Overall balance 3,662
Bank Negara Malaysiainternational reserves, net 117,203
(US$ million) 30,843
e Estimate
Source: Bank Negara Malaysia and Department of Statistics, Malaysia
Item2001e
RM million+ - Net
The external position has remained robust. Large current accountsurplus and lower short-term outflows led to surplus in the overallbalance of payments. Reserves has been on a rising trend.

The Malaysian Economy in 2001
37
Long-term capital inflows reflected mainly drawdownof long-term external loans by the FederalGovernment to maintain regular market presence, toestablish a benchmark rate for Malaysian corporationsand to take advantage of lower interest rate abroad.A significant portion of borrowings by NFPEs was torefinance the more expensive existing offshore loans.
While Malaysia continued to receive inflows offoreign direct investment (FDI) in 2001, FDI forexpansion and new investments were lower becauseof excess capacity, amidst the slowdown in the globaleconomy. The FDI inflows were mainly new equityfunds for strategic business alliances in thetelecommunications and financial services sector andto a lesser extent in the manufacturing sector. For theyear as a whole, the net inflow of FDI was small,mainly due to one large transaction in the privatesector involving the acquisition of controlling interestsby a Malaysian company from non-resident partnersas part of its corporate restructuring exercise. Thepurchase was financed by the issuance of long-termdebt securities to the non-resident investors and anoffshore loan. As the outflows were to finance achange in ownership, it had no impact on reserves ortotal investment activities in Malaysia. Directinvestment abroad remained high in the first quarterof 2001 but subsequently declined as companiesadopted a cautious approach in their investmentplans abroad following the global economicslowdown. Overall, the financial account recorded asubstantially lower outflow of RM14.8 billion in 2001.
Errors and omissions amounted to –RM8.9 billion.Of this total, an unrealised exchange loss fromrevaluation of reserves due to the appreciation ofringgit against selected major currencies amounted toRM4.1 billion. Excluding this book loss, the errors andomissions of RM4.8 billion reflects the normal errorsand inconsistencies that occur in the course ofcompilation of the balance of payments statistics. Thisrepresented less than one percent of Malaysia’s totaltrade, well within the accepted norm of 5% of totaltrade. After adjusting for the errors and omissions,the overall balance of payments recorded a surplusposition of RM3.7 billion or US$964 million.Consequently, the net international reserves of BankNegara Malaysia stood at RM117.2 billion or US$30.8billion at end-2001 and increased further to RM119.6billion or US$31.5 billion as at 28 February 2002.This level of reserves represented 5.2 months ofretained imports and was 5.1 times larger than theshort-term external debt. Including the scheduledamortisation of medium- and long-term debts falling
-100
-50
0
50
100
150
200
250
300
350
400
0
10
20
30
40
50
60RM billion RM billion
1999 2000 2001
Current Account
Goods exports Goods imports
Balance on services and income
Current account balance (RHS)
RM billion
Capital and Financial Account
Direct investment Portfolio investment
Official long-term capital
Balance on capital and financial account
Other investment–private sector
-40
-20
0
20
40
60
80
100
120
1999 2000 2001
RM billion
Net International Reserves
Balance on capital and financial accountNet international reserves
Balance on current account
-40
-30
-20
-10
0
10
20
30
40
1999 2000 2001
Graph 1.39Malaysia: Balance Of Payments

38
Compilation of the Balance of Payments based on BPM 5
Since the first quarter of 2001, Malaysia’s balance of payments is compiled in conformity with theguidelines set forth in the Fifth Edition of the Balance of Payments Manual (BPM 5) of theInternational Monetary Fund. The major changes are summarised below:
Previous format BPM 5 format
Merchandise
Services• Freight & insurance• Other transportation• Travel and education• Investment income• Other services• Government transactions, nie
Balance on goods and services
Transfers
Balance on current account
Long-term capital account• Official sector
Federal GovernmentNFPEsOther
• Private sector
Basic balance
Private short-term capital
Errors and omissions
Overall balance
Goods
Services• Transportation• Travel• Other services • Government transactions, nie
Balance on goods and services
Income• Compensation of employees• Investment income
Current transfers
Balance on current account
Capital account• Capital transfers• Acquisition/disposal of non-produced,
non-financial assets
Financial account• Direct investment• Portfolio investment• Other investment
- Official sector- Private sector
Balance on capital and financial account
Errors and omissions
Overall balance

The Malaysian Economy in 2001
39
due in the next 12 months, the reserves level is morethan three times the short-term debt. Malaysia’sreserves are usable and unencumbered.
The impact on Malaysia of the downturn in theelectronics cycle and the slowdown in the globaleconomy was transmitted through the exportchannel. Growth in gross exports, which hadremained positive since 1987, declined by 10.4% in2001. Exports contracted in all sectors, manufacturingas well as primary commodities. Nevertheless, giventhe existing structure of high import content inexports, imports also declined by 9.9%. The tradesurplus, therefore narrowed, but remained large atRM53.7 billion (US$14.1billion). Adjusted for
valuation and coverage on the balance of paymentsbasis, the goods account recorded a large surplus ofRM69.9 billion (US$18.4 billion). The contraction inboth exports and imports started in March 2001,reached its peak in September and moderated in thefourth quarter. More moderate declines in exportsand sharper improvement in imports supported otherindicators that, by the end of 2001, the economy wasin the early stages of recovery.
Exports of manufactured goods, whichaccounted for 85.3% of total exports of Malaysia,declined by 10.3% in 2001. The decline was mostpronounced in the electronics sector (-16.3%).Exports of electrical goods were more resilient in thefirst half-year, and only contracted in the secondhalf-year. For the manufacturing sector as a whole,the decline in prices (-6.1%) was more pronouncedthan the decline in volume (-4.1%) as firms reducedprices aggressively to retain market share in anenvironment of weak demand and excess stocks.Reflecting signs of more positive developments inthe external environment towards year-end, the rateof decline in earnings from manufactured exportsmoderated significantly to 12.4% during the fourthquarter from the 20.4% contraction in the thirdquarter. On a preceding quarter basis,manufactured exports recorded an increase of 2% inthe fourth quarter, the first quarterly increase inmore than a year.
While manufacturers and exporters were continuingto move up the value chain and improve productquality to enhance their international competitiveness,efforts were also undertaken to explore export marketopportunities. In 2001, the Malaysian External TradeDevelopment Corporation (MATRADE) hadsuccessfully organised the participation of Malaysian
Table 1.20External Trade
2000 2001 2000 2001
RM billion US$ billion
Gross exports (f.o.b) 373.3 334.4 98.2 88.0Annual change (%) 16.1 -10.4 16.1 -10.4
Annual change (%)
Volume1 11.6 -3.3 11.6 -3.3Prices 1 6.2 -7.7 6.2 -7.7
Gross imports (c.i.f) 311.5 280.7 82.0 73.9Annual change (%) 25.3 -9.9 25.3 -9.9
Annual change (%)
Volume1 15.5 -3.0 15.5 -3.0Prices 1 8.5 -7.1 8.5 -7.1
Trade balance 61.8 53.7 16.2 14.1
1 Volume and prices are estimates.
Source : Department of Statistics, Malaysia and Bank Negara Malaysia
In terms of the current account, the major change is the redesignation of investment income (previously acomponent of the services account) as a new account named the Income account.
Under BPM 5, the former capital account has been expanded and redesignated as the capital andfinancial accounts• The capital account consists of two categories, i.e. capital transfers and acquisition/disposal of non-
produced, non-financial assets. • The financial account is classified according to type of investment or by functional breakdown i.e. direct
investment, portfolio investment and other investment. Under the previous compilation, the capitalaccount was classified according to original contractual maturity of more than one year (long-term) orone year or less (short-term).
The balance of payments data for 1999 and 2000 have been reclassified in accordance with the BPM 5format.

40
-30
-20
-10
0
10
20
30
1Q 2Q 3Q 4Q
2000 2001
1Q 2Q 3Q 4Q
Export value Export pricesExport volume
% yoy
Graph 1.40Export Performance of the ManufacturingSector
-30
-20
-10
0
10
20
30
1Q 2Q 3Q 4Q 1Q 2Q 3Q 4Q
Manufactured exports
Non-electronicsElectronics
2000 2001
% yoy
Graph 1.41Export Performance of Electronics andNon-electronics Industries
Table: 1.21Gross Exports
2001p
RM million Annual change (%) % share
Manufactured goods 285,316 -10.3 85.3of which:
Electronics, electrical machinery and appliances 200,307 -13.1 59.9Electronics 139,632 -16.3 41.8
Semiconductor 60,530 -14.9 18.1Electronic equipment and parts 79,102 -17.3 23.7
Electrical machinery and appliances 60,675 -4.7 18.1Consumer electrical products 23,591 -10.9 7.1Industrial and commercial electrical products 23,518 -0.6 7.0Electrical industrial machinery and equipment 12,462 -1.0 3.7Household electrical appliances 1,104 22.3 0.3
Textiles, clothing and footwear 9,054 -13.2 2.7Chemicals and chemical products 14,879 -0.9 4.4Wood products 6,017 -11.5 1.8Manufactures of metal 8,692 0.9 2.6Transport equipment 2,427 -16.4 0.7Rubber products 4,466 -4.9 1.3Optical and scientific equipment 7,802 14.3 2.3
Agricultural commodities 19,966 -13.2 6.0of which:
Palm oil 9,876 -0.7 3.0Sawn timber 2,273 -24.7 0.7Rubber 1,886 -26.6 0.6Saw logs 1,523 -38.8 0.5
Minerals 23,445 -12.6 7.0of which:
Crude oil 11,118 -21.9 3.3LNG 11,342 -0.7 3.4Tin 461 6.0 0.1
Other exports 5,693 2.8 1.7
Total 334,420 -10.4 100.0
p Preliminary
Source : Department of Statistics, Malaysia

The Malaysian Economy in 2001
41
exporters in 26 international trade fairs in thetraditional markets such as the United States, theUnited Kingdom and Germany, the Asia Pacificdestinations such as Australia, Hong Kong, India,Indonesia, Thailand, the Philippines and Brunei andthe newer markets of the Middle Eastern countries,South African countries and Vietnam. Reflecting theGovernment’s commitment in promoting Malaysianproducts in new markets, MATRADE had organised atrade fair in Madagascar. Meanwhile, under theASEAN Promotion Centre Technical AssistanceProgramme, Malaysian exporters took part in anothersix international trade fairs held in Japan.
In the primary commodity sector, export earningsdeclined by 12.9% to RM43.4 billion following lowerexports of all major commodities, except cocoa.Export volume for palm oil expanded as demand frommajor buyers, namely, India, The People’s Republic ofChina, Pakistan and the European Union increasedduring the year. However, export earnings for palmoil declined as an oversupply in the global vegetableoils market led to a decline in export prices.
Export earnings from minerals declined due to bothlower export prices and volume. In particular, crudeoil exports declined, reflecting mainly weaker oilprices, given that the price per barrel fell by US$4 toUS$25.53 in line with the global trend, as well aslower export volume. Exports of LNG also declinedin 2001 as prices fell in tandem with lower oil prices,while export volume increased marginally.
The decline in gross imports was reflected in bothlower import volume and prices. Imports ofintermediate goods which account for 72% of total
imports declined by 13.3%. The primary source of thedecline was the decline in imports of electroniccomponent parts (comprising 65% of imports of partsand accessories of capital goods and 27% of totalimports) and industrial supplies which are primarilyused as component parts in the production ofmanufactured exports. The electronics industryexperienced a large contraction in output and exportsorders in 2001. Most electronics manufacturers drewdown on inventories accumulated from the strongcapacity expansion in 2000.
A notable development was the continued increase inintermediate imports that were related to themanufacture of goods for the domestic market,supported by the positive effects of the fiscal stimulusprogramme and low interest rates. Imports of primaryand processed materials used by the food andbeverages industry increased, reflecting sustainedconsumer spending on food and beverage items.Imports of parts and accessories of transportequipment also increased significantly by 31.3%, inline with the strong performance of the motorassembly industry and passenger car sales. Thiscontributed to increased domestic demand for fueland lubricants but the value of these imports declineddue to lower crude oil prices.
The postponement of private investment plansfollowing the slowdown in economic growth andexcess capacity in the domestic economy led to a1.1% decline in imports of capital goods. Whileinvestment in the manufacturing sector moderated,capacity expansion in the services sector mitigatedthe decline in imports of capital goods. Big valuecapital imports used mainly in the manufacturingsector which declined included industrial machineryand equipment and generators, electrical motorsand turbines for power generation. On the otherhand, reflecting the upgrading and modernisationof businesses and the continued strength of theservices sector, imports of office equipmentincreased strongly. Imports of telecommunicationequipment also increased substantially,underpinned by ongoing efforts to upgrade andmodernise the telecommunications system. Withfirms producing transport equipment operating at95% capacity, imports of transport equipment forindustrial purposes also increased substantially.Among these were imports of commercial vehiclesand buses, as well as railway locomotives andcoaches, following completion of the constructionof the Express Rail Link connecting KLIA and KualaLumpur Sentral.
-30
-10
10
30
50
70
Annual change (%)
1Q 2Q 3Q 4Q 1Q 2Q 3Q 4Q2000 2001
CapitalImports
IntermediateImports
ConsumptionImports
Graph 1.42Imports

42
In tandem with sustained private consumer spending,imports of consumption goods increased further by3% in 2001. The growth in consumption importswas due mainly to higher imports of food andbeverages, namely milk and dairy products, fish,beverages, meat and vegetables. Imports of durableand non-durable consumer goods were also higherduring the year. Imports of consumption goodsaccounted for a small share of 6.3% of total imports.
During the year, the relative importance of Malaysia’smajor trade partners, namely the United States,Japan, Singapore and the European Union remainedgenerally unchanged. These countries accounted for62.6% of Malaysia’s total trade. The United Statescontinued to be Malaysia’s largest trade partner witha share of 18.3% of total trade. Imports from the US
declined by 13.3% while US demand for Malaysiangoods also declined by 11.6% in tandem with slowgrowth in the US economy. The bilateral surplus inMalaysia’s favour, although still large, declined furtherto RM22.8 billion.
Japan maintained its position as the second largesttrade partner with a slightly lower share of 16% oftotal trade. Japan remained Malaysia’s mostimportant source of imports, although its marketshare declined to 19.2% of total imports. This partlyreflected the cheaper cost of imports from Japan dueto the valuation impact from a weaker yen. Importsfrom Japan comprised mainly machinery, electronicsand electrical components and parts and accessoriesof transport equipment. Exports to Japan alsodeclined by 8.7%, reflecting to some extent lower
Table 1.22Gross Imports by End Use
Capital goods 43,675 –1.1 15.6Capital goods (except transport equipment) 41,000 –2.1 14.6
Industrial machinery and equipment 12,253 –19.1 4.4Office equipment 6,567 75.1 2.3
Telecommunication equipment 4,602 33.9 1.6Transport equipment 2,675 17.7 1.0
Intermediate goods 201,753 –13.3 71.9Food and beverages, mainly for industry 4,179 8.9 1.5Industrial supplies, n.e.s. 63,105 –6.5 22.5
Metals and metal products 17,083 –6.5 6.1Chemicals 7,043 –9.9 2.5
Fuels and lubricants 11,659 –3.6 4.2Parts and accessories of capital goods(except transport equipment) 117,391 –18.6 41.8
Electronics 76,341 –19.1 27.2Parts and accessories of telecommunication equipment 7,239 –19.7 2.6
Parts and accessories of transport equipment 5,418 31.3 1.9
Consumption goods 17,555 3.0 6.3Food and beverages, mainly for household consumption 7,174 11.1 2.6Transport equipment, non-industrial 121 25.4 0.0Consumer goods, n.e.s. 10,259 –2.1 3.7
Consumer durables 2,225 10.0 0.8Consumer semi-durables 3,604 –17.5 1.3Consumer non-durables 4,431 8.2 1.6
Dual use goods 5,843 –8.6 2.1Motor spirit 2,462 –0.3 0.9Passenger motor cars 3,381 –13.8 1.2
Others 5,074 9.1 1.8
Re-exports 6,791 4.2 2.4
Gross Imports 280,691 –9.9 100.0
p Preliminaryn.e.s: Not elsewhere specified
Source: Department of Statistics, Malaysia
RM million
2001p
Annualchange (%)
% share

The Malaysian Economy in 2001
43
export receipts from mineral fuels due to lower crudeoil prices as well as weaker demand due to therecession in Japan. Consequently, the traditional tradedeficit with Japan narrowed by nearly one - half toRM9.5 billion.
Singapore remained Malaysia’s third major tradepartner, accounting for a lower share of 15% of totaltrade. Reduced intra regional trade and the increasingimportance of Malaysian ports as regionaltranshipment hubs contributed towards a lower shareof exports bound for Singapore. As a result, the tradesurplus with Singapore narrowed to RM21.4 billion.Meanwhile, trade with the European Unionincreased to 13.3% of total trade. The trade surplusin Malaysia’s favour was substantially reduced toRM9.4 billion as exports to EU declined but the valueof imports sourced from EU (mainly Germany)increased in 2001.
Reflecting the slowdown in economic growth in theregional countries, the trade pattern with the EastAsian countries (except China) displayed a decliningtrend. Bilateral trade with several Asean countries,except Brunei Darussalam, declined in 2001.Reflecting the substitution of imports from lower
cost suppliers, Malaysia continued to experiencebilateral trade deficits with the Philippines andIndonesia. Similarly, bilateral trade with severaldeveloped Asian countries were also lower duringthe year, due to significant declines in both exportsand imports.
A notable development was the significant increase intrade with the People’s Republic of China, whichhas become Malaysia’s fourth largest single tradingpartner with an increased share of 4.7% of totaltrade. While exports to the major industrial countries,other major destinations in the Far East region (HongKong, Taiwan and South Korea) and ASEAN declinedin 2001, exports to China increased strongly by26.2%, reflecting China’s sustained strong economicgrowth.
For the fourth consecutive year, the sustained largesurplus in the goods account generated sufficientforeign exchange earnings to finance the deficits inthe services, income and current transfers accounts.In 2001, the net outflow in the current transfersaccount increased to RM8.1 billion. The increasereflected higher remittances by foreign workers,including one-time repatriations as some workers
Table 1.23Direction of External Trade
Selected South-East-Asian countries 83,107 24.9 63,168 22.5 19,939Singapore 56,669 16.9 35,313 12.6 21,356Thailand 12,768 3.8 11,121 4.0 1,647Indonesia 5,940 1.8 8,517 3.0 -2,577Philippines 4,893 1.5 6,989 2.5 -2,097Other ASEAN countries 2,838 0.9 1,228 0.4 1,610
European Union 45,462 13.6 36,075 12.9 9,387United Kingdom 8,779 2.6 6,872 2.4 1,907Germany 7,767 2.3 10,415 3.7 -2,648Netherlands 15,429 4.6 2,466 0.9 12,964Other EU countries 13,487 4.1 16,322 5.9 -2,836
United States 67,672 20.2 44,841 16.0 22,832Japan 44,503 13.3 54,002 19.2 -9,499People’s Republic of China 14,520 4.3 14,457 5.2 63Hong Kong SAR 15,299 4.6 7,191 2.6 8,108Taiwan 12,117 3.6 15,932 5.7 -3,815South Korea 11,157 3.3 11,240 4.0 -83India 5,993 1.8 2,935 1.0 3,058Australia 7,798 2.3 5,944 2.1 1,854Rest of the world 26,792 8.1 24,906 8.8 1,885
Total 334,420 100.0 280,691 100.0 53,729
p Preliminary
Source: Department of Statistics, Malaysia
RM million
2001p
Exports Imports Trade balance
% share RM million % share RM million

44
Table 1.24Services and Income Account
Services AccountTransportation -11.4 10.4 21.8 -11.4Travel 10.0 26.1 9.9 16.1Other Services -9.9 17.9 31.1 -13.2Government services n.i.e. 0.1 0.5 0.5 …
RM billion -11.2 54.9 63.3 -8.4US$ billion -3.0 14.5 16.7 -2.2% of GNP -3.6 -2.7
Income AccountCompensation of employees -0.6 1.4 2.4 -1.0Investment income -27.9 5.3 30.2 -24.9
RM billion -28.6 6.7 32.6 -25.9US$ billion -7.5 1.8 8.6 -6.8% of GNP -9.1 -8.5
e Estimate
Source : Department of Statistics, Malaysia and Bank Negara Malaysia
2000 2001eSubsector RM billion
Net + - Net
returned to their home countries followingconsolidation of activities in the export-orientedmanufacturing industries. There was a total of769,566 registered foreign workers in the country in2001.
The services account deficit narrowed significantlyby 25.4% to RM8.4 billion or 2.7% of GNP. Theimprovement reflected the exceptionally strongincrease in the travel account surplus and lowerpayments related to export and import activities.
The net surplus in the travel account increased by62% to RM16.1 billion. The exceptionally strongperformance of the travel account reflected themarked increase in tourist arrivals (25% to 12.8 million
visitors) and excursionists (46.2% to 10.2 million daytrippers). Benefiting from the record number offoreign visitors and higher per capita spending (11.8%to RM1,896), tourist (including excursionist) receiptsincreased to an unprecedented level of RM25.8 billion,representing the second largest source of foreignexchange earnings after electronics and electricalexports. The 47.5% increase in tourist receiptsexceeded the Eighth Malaysia Plan target of anaverage annual growth of 9.5%. The exceptionalperformance reflected the success of well targetedpromotional strategies and policies, in particular thediversification of promotional efforts to niche areasand new markets in Eastern Europe, West Asia, India,and China. The tourism industry also benefited fromthe strategy to provide a wider variety of products forthe tourism market including eco-tourism, agro-tourism and yachting tourism and the hosting ofinternational conventions and major sporting eventssuch as the Formula One Race and Le Tour deLangkawi, and events catering for shoppers such asMega Sale Carnivals and the Langkawi InternationalMaritime and Aviation (LIMA) exhibition. Mega SalesCarnivals, in particular, contributed towards thesignificant increase in the number of excursionists.
Meanwhile, efforts to establish Malaysia as aneducational regional hub continued. However, in2001, the uncertainty besetting the regionaleconomies and increased competition from thePhilippines, Singapore and Thailand affected thenumber of foreign students studying in Malaysia. Asa result, the total number of foreign students at alllevels of education (comprising tertiary, secondary andprimary education) in both public and privateinstitutions declined by 23.5% to 20,384 students.This was reflected in a decline in education receiptsby 10.1%. Students from Indonesia and China
Governmenttransactions
1%
Other services49%
Transportation34%
Travel16%
Other services33%
Governmenttransactions
1%
Transportation19%
Travel47%
Graph 1.432001: Components of Gross Paymentsin the Services Account (% share)
Graph 1.442001: Components of Gross Receiptsin the Services Account (% share)

The Malaysian Economy in 2001
45
continued to account for the bulk of the foreignstudents in Malaysia. On the payments front, higherexpenditure on travel and education abroad reflectedincreased business travel and a larger number ofstudents studying abroad.
The transportation account deficit was contained atRM11.4 billion as the reduction in receipts was offsetby a decline in payments. Gross payments abroadrecorded a modest decline associated with lowerfreight payments on account of the lower volume oftrade and freight charges. Gross receipts alsodeclined due mainly to lower earnings on passengerfares and air cargo services provided by the nationalairline, reflecting lower demand from neighbouringcountries. Receipts from charter services were alsolower. Despite the decline in external trade, earningsfrom cargo services provided by major domesticshipping companies and port-related activitiescontinued to register increases during the year. Theincrease in shipping capacity as well as improvementand expansion of port facilities and services resultedin container throughput of the six major portsincreasing by 43.5% to 7.3 million TEUs in 2001. Theincrease in volume handled was underpinned by thegrowth in transhipment trade, in particular,transhipment handled by Port Klang and the Port ofTanjung Pelepas (PTP). Strategic business alliancesand management expertise provided by foreignpartners helped to improve efficiency and handlingcapacity at the port resulting in a higher volume ofactivity.
The other services account posted a higher netoutflow of RM13.2 billion. The deteriorationstemmed mainly from a sharp decline in export
earnings due to lower foreign demand for contractand professional services offered by Malaysiancompanies. Meanwhile, payments for importedservices declined modestly due mainly to lowerdemand for construction and engineering servicesduring the year. However, payments in areas relatingto communication services and computer andinformation services (ICT enhancement) and mergersand restructuring exercises in the corporate, bankingand financial services sectors remained substantial.The payments in other services account also partlyreflected the increase in strategic business allianceswhich usually led to higher imports of other servicessuch as professional, business and technical services.
The income account deficit fell by 9.1% to RM25.9billion or 8.5% of GNP in 2001. The improvementreflected lower repatriation of profits and dividendsaccruing to foreign direct investors, given lowerexport earnings of the export-oriented electronicsand electrical industries. Repatriation of profits anddividends of foreign direct investors contributed90% of the net outflow in the income amount.However, the actual outflow of investment incomewas considerably lower as a significant portion ofthe profits and dividends were reinvested in thecountry. Net outflow of profits and dividendsaccruing to portfolio investments was alsosignificantly lower. However, the other investmentscomponent (mainly interest income) of the incomeaccount reverted to a deficit position, as lowerinterest rates abroad led to lower returns from theexternal assets of BNM and the corporate sector(including commercial banks).
The financial account of the balance of paymentsturned more favourable in 2001, with a lower netoutflow of RM14.8 billion. The improvement wasattributed mainly to the lower net outflow of short-term capital and, to a lesser extent, higher externalborrowings by the Federal Government and the non-bank private sector.
Reflecting the continued commitment by foreigninvestors to undertake new projects as well asexpansion and diversification of existing projects inMalaysia, the value of proposed foreign investmentsin manufacturing projects approved by the Ministry ofInternational Trade and Industry remained significantin 2001, amounting to RM18.3 billion. In terms ofactual direct investment in Malaysia, inflows fornew and expansion projects were lower in 2001.Lower inflows of direct investment in themanufacturing sector reflected the ongoing
0
2
4
6
8
10
12
14
0
5000
10000
15000
20000
25000
30000
1994 1995 1996 1997 1998 1999 2000 2001p
Tourist arrivals Tourist receipts
p Preliminary
Tourist arrivalsin million
Receipts inRM billion
Graph 1.45Tourist Arrivals and Tourist Receipts

46
consolidation by major multinational corporationsfollowing the decline in global demand and excesscapacity. Nevertheless, inflows of new equity for thesetting up of strategic alliances with Malaysianpartners, particularly in the telecommunications andfinancial services sectors, were significant in the firstthree quarters of 2001. These inflows, which aresmaller in average dollar size and low in importcontent, bring technology and other expertise thatcontribute towards raising productivity in Malaysia.
On a net basis, direct investment in Malaysiaamounted to RM5.2 billion in the first three quartersof 2001. The sale of strategic interests in one servicescompany to Malaysian residents in the fourth quarterlargely offset this net inflow. As a result, net inflow ofdirect investment in Malaysia moderated to RM2.1billion for 2001 as a whole.
The sale of strategic interests by non-residentinvestors in the fourth quarter of 2001 reflected thedecision by a Malaysian company to acquire thestake of its non-resident partners. The move was toenable the Malaysian company to regain controlover the subsidiary company, as part of itscorporate restructuring exercise. The acquisition wasfinanced by the issuance of long-term debtsecurities to the non-resident investors as well as byraising an offshore loan. Hence, the transaction,which merely resulted in the change of ownershipof the subsidiary, had no impact on internationalreserves or domestic economic activities as the
outflow of direct investment was offset by the inflowof funds from the debt securities issued to non-residents (portfolio investment) and offshore loans.
The Government remains committed to providing acost-competitive business and investmentenvironment for both foreign and domestic investors.In this regard, the Government continued to providethe Special Pre-Package Incentives that are customisedto meet the specific needs of individual investorsbringing in quality investment to the promotedsectors of the economy. Several existing incentiveswere also improved in order to attract the hightechnology and high value-added investment,consistent with Malaysia’s growth strategies. Toencourage existing foreign investors to continuouslyundertake expansion projects or diversify into higherquality investment, the period for the reinvestmentallowance was extended from 5 to 15 years in the2002 Budget. The Foreign Investment Committee(FIC) guidelines on property acquisition by foreignerswere further liberalised in April 2001.
Direct investment abroad or overseas investmentby Malaysian corporations continued to remain highat RM1.1 billion in the first quarter of 2001,reflecting the strategic business decisions to providegreater synergy to Malaysian corporate activities. Asignificant share of investment abroad during thisperiod was attributed to the acquisition of palm oilplantations in Indonesia. Towards mid-year, directinvestment abroad declined as companies began toadopt a more cautious approach in their investmentplans abroad following the severe global economicslowdown. As part of corporate restructuringexercise, some companies also liquidated theirbusinesses overseas, particularly towards the end of2001, and repatriated the proceeds to Malaysia,thus partly offsetting the large outflows in early2001. For the year as a whole, direct investmentabroad recorded a significantly lower net outflow ofRM1.1 billion. The non-financial public enterprises(NFPEs) continued to undertake investmentsoverseas, particularly in the agriculture and oil andgas sectors, mainly in Indonesia and China.
Portfolio investment recorded a significantlylower net outflow of RM2.5 billion in 2001, aboutone-quarter of the amount recorded in the previousyear. Although there were uncertainties in theglobal financial markets, outflows of portfolioinvestment were significantly lower as portfolioinvestors were already underweight in theMalaysian market. In the second half of the year,
Table 1.25Balance of Payments: Financial Account
Financial Account -23.8 -14.8 -6.3 -3.9
Direct Investment 6.7 1.0 1.8 0.3In Malaysia (foreign
direct investment) 14.4 2.1 3.8 0.6Abroad (overseas investment) -7.7 -1.1 -2.0 -0.3
Portfolio Investment -9.4 -2.5 -2.5 -0.7
Other Investment -21.1 -13.4 -5.6 -3.5Official sector 3.9 7.1 1.0 1.9
Federal Government (net) 0.9 6.3 0.2 1.7Gross borrowing 4.8 7.0 1.3 1.8Repayment 3.9 0.7 1.0 0.2
NFPEs (net) 3.1 0.9 0.8 0.2Gross borrowing 6.9 10.7 1.8 2.8Repayment 3.8 9.8 1.0 2.6
Private sector -25.1 -20.5 -6.6 -5.4
e Estimates
Source: Department of Statistics, Malaysia and Bank Negara Malaysia
RM billion US$ billion
20002001e2000 2001e

The Malaysian Economy in 2001
47
the accelerated pace of corporate restructuringhelped to improve sentiments on the Kuala LumpurStock Exchange, thus attracting new inflows offunds, particularly in the third quarter. However,the uncertainty following September 11 led toprofit-taking activities that resulted in some netoutflows in the fourth quarter, reversing the trendin the third quarter. With the release of moreindicators supporting economic recovery, portfolioinvestments have strengthened to record netinflows in the first two months of 2002.
The other investment account recorded asignificantly lower net outflow of RM13.4 billion in2001. The official sector account recorded ahigher net inflow of RM7.1 billion, comprisingmainly drawdown of long-term external loans bythe Federal Government. Repayments were lowerduring the year.
While maintaining the prudent policy of keepingthe debt level low, the Federal Government,nevertheless, took advantage of favourable marketconditions and low interest rates to access theinternational capital markets in order to maintain amarket presence and to establish a benchmark ratefor Malaysian corporations. Proceeds from theissuance of the US$1 billion Notes in July, asyndicated loan of US$540 million in December aswell as the drawdown of loans under the MiyazawaInitiative totalled RM7 billion. Although the grossborrowings by NFPEs increased significantly in 2001,a large part of the new borrowings was used torefinance the more expensive existing offshoreloans.
The private sector recorded a lower net outflow ofRM20.5 billion due mainly to lower net outflow ofother short-term capital. As interest rates abroadwere reduced to support economic activities, therewas less incentive for residents to place or retainfunds abroad. Interest rate differentials moving inMalaysia’s favour since September encouraged theearly repatriation of export proceeds, while tradecredits extended to foreign importers also declined.The net external assets of the banking institutionsalso declined in the second half of the yearfollowing the unwinding of foreign currency inter-bank placements as importers reduced hedgingactivities. In addition to lower short-term outflows,there was a net inflow of external borrowings bythe non-bank sector, mainly to finance the purchaseof non-resident assets as part of a corporaterestructuring exercise.
External Debt Prudent external debt management remained anintegral element of public policy in 2001. In themanagement of risk and liquidity exposure, Malaysiamaintained an external debt management strategywhich has already incorporated the internationalguidelines that were proposed for adoption byemerging market economies for effective debtmanagement following the Asian crisis. Corporationssourcing external funds for operations in Malaysiawere required to have foreign exchange income torepay the debt. At the same time, they wereencouraged to raise loans with longer maturity,while short-term borrowing by the non-bank privatesector to finance long-term investment were notencouraged. The policies were effective in keepingthe nation’s external debt low with only a smallshare of short-term debt, and a debt profile that isbiased towards the longer end. About two-thirds ofthe medium and long-term debt have remainingmaturities of more than three years. Overall, thisactive debt management strategy has servedMalaysia well in strengthening the underlyingfundamentals and reducing vulnerability to externalshocks.
As a result of these policies and an efficient debtmonitoring system, the nation’s external debt positionremained contained at a relatively low level. The totalexternal debt outstanding increased moderately by
Table 1.26Outstanding External Debt
Total debt 157,720 41,505 169,778 44,678Medium and
long-term 140,266 36,912 146,437 38,536 Short-term 1 17,454 4,593 23,341 6,142
As % of total debt 11 11 14 14As % of international
reserves 15.4 15.4 19.9 19.9
As % of GNPTotal debt 50.5 50.5 55.4 55.4Medium and
long-term debt 44.9 44.9 47.7 47.7
As % of exports of goods and services
Total debt 36.4 36.4 42.9 42.9Medium and
long-term debt 32.3 32.3 37.0 37.0
Debt service ratio (%) 5.3 5.3 6.2 6.2
1 Refers to bank and non-bank private sector short-term debt.p Preliminary
RMmillion
2000 2001p
RMmillion
US$million
US$million

48
7.6% to RM169.8 billion (US$44.7 billion) at the endof 2001. The ratio of external debt to GNP increasedto 55.4% (peak of 64% in 1997 following the Asiancrisis). The external debt service ratio (excludingprepayments) remained low at 6.2%. The globaltrend toward lower interest rates has had a positiveeffect in terms of reduced interest payments onMalaysia’s existing external loans. Nevertheless, totaldebt servicing increased in absolute terms by 6.1% toRM24.4 billion, reflecting the maturity of several bondissues that were raised in the mid-1990s as well asthe early retirement of some of the more expensivebonds by the non-financial public enterprises.
The new loan drawdowns were mainly by the publicsector (RM7.2 billion) and to a lesser extent theprivate sector (RM2.8 billion), reflecting lower privateinvestment during the year. An exchange revaluationgain of RM3.8 billion moderated the increase in theexternal debt level in ringgit terms. As a result, the
medium and long-term external debt increased by4.4% to RM146.4 billion (US$38.5 billion) at the endof 2001.
In terms of currency composition, the bulk of themedium and long-term external debt wasdenominated in United States dollars with a largeshare of 77% of debt outstanding at end-2001.The share of yen denominated debt was lower at15%, reflecting the increased drawdown of USdollar loans, some diversification of borrowing intoeuro loans, the maturity of yen bonds during theyear, as well as the depreciation of the yen. Theremaining 8% of the debt was accounted for byother international currencies, including the euro,Singapore dollar and pound sterling. In the case ofprivate sector loans, the currency composition ofliabilities generally corresponds closely with thecurrency composition of earnings, thereby providinga natural hedge against currency risks. As theexternal debt is diversified in terms of majorcurrencies, the depreciation of the yen and euro hasled to an exchange revaluation gain, reducing theexternal debt in ringgit terms.
Public sector external debt: The FederalGovernment’s external debt increased to RM24.3billion at the end of 2001. It continued to account fora small share (14%) of total external debt. As inprevious years, the Federal Governmentís financingrequirements were primarily met from domestic non-inflationary sources. Nevertheless, taking advantageof the favourable market conditions and the nation’slow external debt position, the Government tappedthe international capital markets, partly to maintain amarket presence as well as to take advantage of lowerUS interest rates to set a benchmark rate to facilitatethe corporate sector’s access to the US, European andother international markets. In July, the FederalGovernment issued US$1 billion 10-year Notes due2011. Reflecting the demand for quality debt papers,these Notes were three times oversubscribed andpriced at 228 basis points above the 10-year USTreasuries. In December, it raised a syndicated loan ofUS$540 million from offshore banks in Labuan. TheGovernment also drew down loans committed underthe Miyazawa Initiative as well as project loans frommultilateral sources such as the World Bank, IslamicDevelopment Bank and Asian Development Bank. InMarch 2002, the Federal Government reopened itsUS$1 billion 7.5% Notes due 2011 by an additionalUS$750 million. The reopening was priced at thecomparable US Treasuries plus 175 basis points toyield 6.8% with a reoffer price of US$104.769.
0
20
40
60
80
100
120
140
160
180
0
10
20
30
40
50
60
70
1989 1991 1993 1995 1997 1999 2001
1989 1991 1993 1995 1997 1999 2001
Outstanding external debt
Debt servicing
RM billion
RM billion
%
%
Fed Govt NFPEs Private Sector
Short-term Debt/GNP (RHS)
Interest payment Repayment DSR (RHS)
0
1
2
3
4
5
6
7
8
9
10
0
5
10
15
20
25
Graph 1.46External Debt

The Malaysian Economy in 2001
49
Based on the US$500 million initially issued, the Noteswere oversubscribed by more than seven times.
Reflecting Malaysia’s strong fundamentals, theinterest spread on Malaysia’s benchmark securitiestightened in 2001. The spread on Malaysian US$1.5billion Notes due 2009 narrowed to 148 basis pointsat end-2001, while the spread on the US$1 billion 10-year Notes due 2011 narrowed to 167 basis points.The interest in Malaysia’s US dollar bond issues hadalso increased since May 2001 with the removal ofthe exit levy and the announcement of a shift inpolicy by Moody’s which could allow companies to berated higher than the sovereign rating. In a movereflecting the strengthening of the country’s externalposition, Standard & Poor’s revised the outlook onMalaysia’s long-term sovereign foreign currency debtrating from stable to positive on 4 March 2002, whilereaffirming Malaysia’s BBB rating.
The NFPEs also took advantage of the low interestrate environment to access long-term funds from theinternational capital markets to refinance their moreexpensive existing offshore loans. This was reflected inincreased gross borrowing of RM10.7 billion in 2001.The new borrowings included the US$600 million 10-year Notes launched by Tenaga Nasional Berhad, andthe US$250 million Floating Rate Notes raised by 1stSilicon (Malaysia) Sdn. Bhd. Other major borrowerswere Petronas and Silterra Malaysia Sdn. Bhd. Inaddition, Tenaga Nasional Berhad and BankPembangunan continued to draw down loans offeredunder the Miyazawa Initiative for the development ofpower plants and transportation infrastructureprojects.
The NFPEs as a group recorded a small net inflow ofexternal borrowing of RM0.9 billion as repaymentsmore than doubled, reflecting the refinancing of loansto take advantage of better interest rate spreads aswell as the maturity of bonds issued in mid-1990s.Due partly to the reclassification of Malaysia AirlineSystem Berhad (MAS) and its external debt as part ofthe public sector in 2001, the outstanding debt of theNFPEs increased by 13.3% to RM66.5 billion at theend of 2001.
Private sector external debt: Private sector debtcontinues to account for the bulk of the Malaysiaexternal debt, at 47% of total debt in 2001. Duringthe year, the private sector recorded net externalborrowing of RM2.8 billion in 2001. The higherborrowing reflected mainly the issuance of debtsecurities to finance the purchase of non-resident
assets in Malaysia as part of a corporate restructuringexercise. The non-resident controlled companiescontinued to account for a large share of the loans,sourcing the borrowing largely from offshoreshareholders and parent and associate companies.Such loans were generally provided on flexible terms,including longer maturity and at concessionaryinterest rates. These loans are also naturally hedged,with foreign currency earnings to service the debt.After taking into account the reclassification of MASexternal debt as an NFPE debt and the exchangerevaluation gain, private sector external debtoutstanding declined by 11.4% to RM55.6 billion atend-2001.
Short-term external debt (maturity of one year orless) comprises mainly short-term borrowing by thebanks related to their trade financing activities,revolving credits and inter-company loans. In 2001,short-term external debt increased to RM23.3 billion(US$6.1 billion), largely reflecting the increase inborrowing by the commercial banks. As a prudentmeasure, the commercial banks are required toobserve the external open position limit. As at theend of 2001, the banks’ net open position was wellbelow the total approved limit.
The share of short-term debt remained well withinprudential limits at 13.7% of total external debt and19.9% of the international reserves of Bank NegaraMalaysia. Including medium and long-term debtfalling due within 12 months, short-term debt wouldamount to RM38.5 billion (US$10.1 billion), less thanone third the level of international reserves.
International ReservesThe net international reserves held by BNM(comprising gold and foreign exchange holdings, IMFreserve position and holdings of Special DrawingRights (SDR)) increased by RM3.7 billion or US$964million in 2001 to RM117.2 billion or US$30.8 billionas at end-2001. The reserves level increased further toRM119.6 billion or US$31.5 billion as at 28 February2002. This level of reserves is sufficient to finance 5.2months of retained imports and to cover 5.1 timesthe short-term external debt. The strengthening ofthe reserves position reflected the build-up in foreignexchange holdings from trade and long-term capitalinflows.
During the course of 2001, there was greatervariability in the net international reserves of BNM.Under a fixed exchange rate regime, greater variabilityin reserves would indeed occur as reserves changes

50
reflect the supply and demand conditions in theforeign exchange market. Between January to mid-April, Malaysia’s net international reserves declined toRM99.8 billion (US$26.3 billion) as at 15 April 2001,from RM113.5 billion (US$29.9 billion) at end-2000.Subsequently, the reserves level stabilised and beganto steadily increase from end-June. By end-year, thereserves exceeded the level at end-December 2000.At its lowest point, the reserves level had remainedhigh and was equivalent to 3.9 months of retainedimports and 5.5 times the short-term external debt.Reserves were at all times unencumbered and usableas Malaysia did not engage in forward contracts.
In 2001, when the yen depreciated above ¥125 levelagainst the US dollar in late March and early April,there were some sentiment driven outflows during thisperiod of unstable market conditions. A substantialshare of the reserves decline, however, reflected tradeand investment-related demand for foreign exchangeby the Malaysian corporate sector. There was alsorepayment of external debt to reduce leverage ofcorporations given the availability of the significantlylower cost of domestic sources of funds. Suchrepayment of debt reduced Malaysia’s external debtand strengthened the external position of Malaysia.This period also saw outflows of overseas investmentsby Malaysian corporations which reflected strategicbusiness decisions to provide greater synergy toMalaysian corporate activities. These investments alsoenhanced prospects for future exports of goods andservices as well as income and profit repatriation toMalaysia. During the period March-April, the largedemand for trade payments reflected ‘pre-emptive’outflow as the ‘cheaper’ US dollar (due to forward
discounts arising from interest rate differentials) createdincentives to pay forward for imports.
In March 2001, the exchange revaluation loss fromthe quarterly revaluation of external reserves holdingsalso led to an unrealised decline of US$0.9 billion inreserves. As the central bank reserves are diversifiedin terms of the major currencies, the appreciation ofthe US dollar led to an unrealised revaluation loss onEuro and yen denominated assets. In the thirdquarter, a revaluation gain of RM3 billion or US$0.8billion was recorded as US dollar depreciated againstEuro and yen. For 2001 as a whole, the totalquarterly revaluation loss amounted to RM4.1 billionor US$1.1 billion.
In 2001, Bank Negara Malaysia stepped up its effortsto enhance transparency and explained in greaterdetail the nature of the flows. This aimed to increaseunderstanding on the movement of the reserves, inparticular that which reflected structural adjustmentsin the corporate sector that have contributed toMalaysia’s long-term economic fundamentals.
Reserves stabilised in the region of RM98.8 billion(US$26 billion) in the period mid-April to end-June2001. Since end-June, net international reservesincreased by RM18.4 billion or US$4.8 billion. Interestrate differentials that moved in Malaysia’s favour fromSeptember encouraged the early repatriation ofexport proceeds. While exports declined followingthe global economic slowdown, this decline was
Graph 1.47Net International Reserves
85
90
95
100
105
110
115
120
0
1
2
3
4
5
6
7
D J F M A M J J A S O N D
RM billion Months/Times
Reserves (LHS)Import cover (RHS)Reserves/Short-term external debt (RHS)
2000 2001
Table 1.27Net International Reserves
As at end Change
1999 2000 2001 2001
RM million
SDR holdings 330.3 418.7 487.8 69.1IMF reserve position 3,168.2 3,310.9 3,193.5 -117.4Gold and foreign
exchange 113,766.0 109,835.4 113,542.3 3,706.9
Gross International Reserves 117,264.5 113,565.0 117,223.6 3,658.6
Less BNM external liabilities 21.0 23.7 20.7 -3.0
Net International Reserves 117,243.5 113,541.3 117,202.9 3,661.6
US$ equivalent 30,853.6 29,879.3 30,842.9 963.6Months of retained
imports 5.9 4.5 5.1Reserves/Short-termexternal debt (times) 5.1 6.5 5.0

The Malaysian Economy in 2001
51
cushioned by a corresponding reduction in imports,resulting in a sustained large trade surplus. The largertrade-related flows was also a reflection of lowerimport obligations arising from earlier forwardpayments made in the first half of 2001. There werealso continued inflows of foreign direct investmentduring this period, reflecting inflows from strategicbusiness alliances. Meanwhile, the drawdown ofFederal Government external loans, including theUS$1 billion 10-year Notes and a syndicated loan ofUS$540 million from offshore banks in Labuan, morethan offset the Government loan repayments duringthe year. With improved market sentiment, portfoliocapital registered a net inflow during a major part ofthe third quarter. Nevertheless, this trend reversedsince the second half of September following theuncertainties associated with September 11 as well asprofit-taking activities, resulting in a net outflow ofportfolio capital during the fourth quarter. Theseflows, however, reversed again to show a steadyuptrend in January - February 2002.
Malaysia’s holdings of reserves in the form of SpecialDrawing Rights (SDR) increased by RM69.1 millionto RM487.8 million at the end of 2001. The increasewas mainly on account of the receipts ofremuneration from the IMF arising from Malaysia’s netcreditor position with the Fund. During the year,Malaysia’s reserve position with the IMF remainedunchanged. In ringgit terms, however, the reserveswith the IMF registered a decline of RM117.4 million
to RM3.2 billion at the end of 2001 on account of anexchange revaluation loss during the year.
FLOW OF FUNDS
The economy registered a smaller resource surplus ofRM27.4 billion or 8.9% of GNP in 2001 (a surplus ofRM31.9 billion or 10.2% of GNP in 2000). In terms ofthe balance of payments, the smaller resource surplusreflected the larger decline in exports of goods andservices relative to imports. Whilst exports declined by8.8%, imports deteriorated by 8.7% in 2001. From thesavings-investment gap perspective, the smaller resourcesurplus largely reflected the smaller net savings position.Although net savings of the private sector were higher,these were somewhat offset by lower net savings of thepublic sector. The flow of funds between various sectorsof the economy in 2000 and 2001 is summarised inTables 1.24 and 1.25 respectively.
While the public sector had a lower disposableincome during the year, the fiscal stimulusprogramme by the Government to support economicactivity resulted in higher public investment andconsumption expenditures. Consequently, theresource surplus of the public sector was significantlylower at RM0.9 billion in 2001 (RM10.8 billion in2000). The resource surplus reflected entirely thesurplus from the NFPEs of RM12.1 billion. This largelyoffset the resource gap of the general government ofRM11.2 billion. The bulk of the resource gap of the
BNM’s Reserves Management and Reporting Policy
The objectives of reserve management of BNM are to ensure capital preservation and liquidity of reserveswhilst optimising returns. BNM has formulated a customised benchmark to serve as a guide for itsinvestment decisions, taking into account the need to ensure the safety of reserves and to meet liquidityrequirements as well as the level of tolerance for risk in investment decisions. The benchmark portfolio andBNM’s international reserves are made up of the major foreign currencies and gold. The reserves are held inthe form of foreign currency deposits or invested in high investment grade sovereign papers. BNM does notengage in options in foreign currencies vis-a-vis ringgit and there are no foreign currency loans withembedded options. There are also no undrawn, unconditional credit lines provided by or to other centralbanks, international organisations, banks and other financial institutions. Reserves are usable andunencumbered.
BNM releases a press statement on international reserves together with the statement of assets and liabilitiesfortnightly with a one-week lag. As part of the measures to enhance transparency in the internationalfinancial system and to facilitate an assessment of the foreign exchange risk exposure, BNM publishesdetailed disclosure of international reserves at the end of each month (with a one-month lag) in line withthe requirements of the reserves data template under the IMF’s Special Data Dissemination Standard (SDDS).This includes the release of forward-looking information on the size, composition and usability of the officialreserves and other foreign currency assets and the future and potential (contingent) inflows and outflows offoreign exchange over the next 12 months.

52
Table 1.28Flow of Funds: 2000
Disposable Income -304.5 92.7 211.8 0Consumption 181.4 -36.2 -145.2 0Investment 87.1 -43.6 -43.5 0Change in Stocks 4.1 -2.1 -2.0 0
Exports of Goods and Non-Factor Services 427.5 -427.5 0Imports of Goods and Non-Factor Services -359.5 359.5 0Net Factor Payment Abroad -28.6 28.6 0Net Transfers -7.5 7.5 0
Non-Financial Balance 0.0 10.8 21.1 0.0 -31.9 0
Foreign FinancingDirect Investment 6.7 -6.7 0Net Foreign Borrowings 3.9 -28.7 24.8 0Net Change in Foreign AssetsBNM 3.7 -3.7 0Banking System -5.7 5.7 0
Domestic financingChange in Credit 4.4 26.0 -30.4 0Change in Money Supply, M3 -21.9 21.9 0Net Borrowings from Non-Bank Sector -19.1 19.1 0
Net Errors and Omissions -22.3 10.5 11.8 0
Sum 0 0 0 0
Domestic EconomyNationalAccounts Private
Sector
RM billion
PublicSector
BankingSystem
Restof theWorld
Sum
Table 1.29Flow of Funds: 2001
Disposable Income -298.5 88.7 209.8 0Consumption 191.4 -40.7 -150.7 0Investment 83.3 -49.2 -34.1 0Change in Stocks 3.6 2.1 1.5 0
Exports of Goods and Services 389.8 -389.8 0Imports of Goods and Services -328.4 328.4 0Net Factor Payment Abroad 25.9 25.9 0Net Transfers 8.1 8.1 0
Non-Financial Balance 0.0 0.9 26.5 0.0 -27.4 0
Foreign FinancingDirect Investment 1.0 -1.0 0Net Foreign Borrowings 7.1 -23.0 15.9 0Net Change in Foreign Assets
BNM -3.7 3.7 0Banking System 0.1 -0.1 0
Domestic financingChange in Credit -1.5 20.4 -18.9 0Change in Money Supply, M3 -13.0 13.0 0Net Borrowings from Non-Bank Sector -6.5 6.5 0
Net Errors and Omissions -18.4 9.5 8.9 0
Sum 0 0 0 0
Domestic EconomyNationalAccounts Private
Sector
RM billion
PublicSector
BankingSystem
Restof theWorld
Sum

The Malaysian Economy in 2001
53
general government was financed through netdomestic borrowings (RM13.4 billion). Nonetheless,together with net foreign borrowing of RM7.1 billionand the resource surplus of the NFPEs, a total ofRM6.5 billion was transferred to the private sectorduring the year, mainly in the form of loans andgrants.
With slower economic growth, private sectordisposable income contracted slightly to RM209.8billion in 2001 (RM211.8 billion in 2000). However,with low interest rates, availability of credit and theGovernment’s policies to encourage domesticconsumption spending, private consumptionexpenditure was higher in 2001. Consequently,private sector savings declined to RM59.2 billion(RM66.7 billion in 2000). However, reflecting thestrong decline in private investment expenditure andonly a marginal decline in private savings, theresource surplus of the private sector increased toRM26.5 billion (RM21.1 billion in 2000). In addition,
part of the investment expenditure in 2001 wasfinanced by inflows of FDI. On the whole, togetherwith net borrowings from the banking system(RM20.4 billion) and transfers from the public sector(RM6.5 billion), the resource available to the privatesector amounted to RM54.4 billion (RM72.9 billion in2000).
The bulk of these excess resources of the privatesector were seen in net placements of deposits ofRM13 billion with the banking system (including theholdings of currency). Some of the excess also leakedfrom the domestic economy, mainly in the form ofoverseas investment (RM20.5 billion) and portfoliooutflows (RM2.5 billion). Meanwhile, net externalassets of the banking system remained relativelystable. The continued current account surplus andinflows of FDIs were more than sufficient toaccommodate these outflows, and net internationalreserves of BNM rose by RM3.7 billion to RM117.2billion as at the end of 2001.

Monetary and FiscalDevelopments
56-62 Monetary Policy in 200162-69 Monetary Developments69-70 Exchange Rate Developments71-81 Fiscal Policy and Operations

MONETARY POLICY IN 2001
The overall objective of monetary policy in 2001 wasto create a positive environment to promote domesticactivity to mitigate the effects of the global economicslowdown. To achieve this objective, interest ratesthat had been reduced in 1998 and 1999 were keptunchanged in 2000 and during the first eight monthsof 2001. The stability provided by the peggedexchange rate regime and the absence of inflationarypressures allowed monetary policy to reinforce thecounter-cyclical macroeconomic policy measuresimplemented to promote domestic economic activity.Nonetheless, the September 11 incident hadincreased the risks of further weaknesses in the globaleconomic outlook and a delay in the prospects forrecovery. On September 20, BNM reduced itsIntervention Rate by 50 basis points to 5.00%,as a pre-emptive measure to address the potential forweaker economic growth and to enhance businessand consumer confidence. During the year, emphasiswas also placed on improving access to financingat reasonable cost to the private sector, in particularSMEs and the agricultural sector.
With the Intervention Rate at 5.50% and 3-monthinterbank rate at 3.22%, the stance of monetarypolicy at the beginning of the year was finelybalanced between the need to promote consumptionand investment without discouraging savings, andavoiding macroeconomic imbalances. As the globaleconomic slowdown was relatively moderate, the fulleffects of the expansionary fiscal and monetarypolicies were expected to have their impact ondomestic aggregate demand given that the inflationsituation was expected to remain subdued.
The easing of monetary policy in several steps in 1998and 1999 led to ample liquidity and a low level ofinterest rates. The 3-month BNM Intervention Rate,
which is the policy rate, was rapidly reduced by atotal of 550 basis points during this period. Giventhat monetary policy works with a lag, a rapid andsignificant rate adjustment was initiated in the earlypart of the recovery cycle. This early easing ofmonetary policy resulted in lending rates in Malaysiafalling to amongst the lowest in the region. Withample liquidity and strengthening competition amongbanking institutions, interest rates for retail loans inparticular, were significantly lower than the quotedBLR. The prevailing low level of interest rates led tostrong growth in financing activities, whichconsequently had positive impact on economicgrowth, particularly on domestic consumption.
Against this background, monetary policy remainedneutral during the first three quarters of 2001. Thedecision to maintain the prevailing monetary policystance was supported by several considerations. First,the progressively sharper slowdown experienced inthe domestic economy was mainly caused by theweaker performance in the export-oriented industriesarising from poor external demand. The benefit of afurther lowering of interest rates was thereforeexpected to be marginal, given that the export sectorgenerally relies on internally-generated funds.Demand indicators also showed that the low level ofinterest rates resulted in significant increases in newloans, especially for purchases of residential property,motor vehicles and consumer durables. Second,consideration was also given to the need to maintainfinancial and macroeconomic stability. During thisperiod, deposit rates in Malaysia were generally lowerthan foreign rates, especially US interest rates.Lowering rates beyond a certain threshold couldpotentially lead to capital outflows.
Third, in a situation of economic slowdown, whereemployment and demand prospects remaineduncertain and excess capacity was prevalent, fiscal
56
Monetary and Fiscal Developments
Monetary policy remained accommodative, providing a positiveenvironment for private consumption and investment and overalldomestic economic activity. The pegged exchange rate regimewhich was well supported by economic fundamentals continued tobenefit the economy.

Monetary and Fiscal Developments
57
policy would play a crucial role in directly stimulatingdomestic economic activity. As such, fiscal measureswere aimed at enhancing disposable income to boostconsumption, and implementing projects withhigh-spillover effects, low import content and shortgestation period. In addition to the Budget 2001allocation, the pre-emptive package of RM3 billionannounced in March, was aimed at furtherstimulating domestic demand.
An important consideration in the conduct of monetarypolicy was to maintain a positive real rate of return todepositors, especially individuals and organisationswhose income stream was highly dependent on thereturns from bank deposits. Unlike other countries,households in Malaysia, being mainly net savers, wouldbe more adversely affected by lower interest rates,in contrast to net debtors. Therefore, interest rates thatare too low would have an impact on the income ofcertain sectors with adverse implications onconsumption. In January 2002, BNM launched a thirdseries of Bon Simpanan Malaysia worth RM1 billionas an alternative savings instrument for senior citizensand charity organisations.
During the course of the year, an issue that emergedwas the market perception that interest rates wereused as a means to sustain financial institutions’profitability. However, this does not figure as an issuein the formulation of monetary policy. Indeed, it is nota policy consideration to sustain banks’ profitabilityat the expense of borrowers, depositors andeconomic growth. In fact, the prevailing ampleliquidity situation and competition for new loansduring the first eight months had led banks to lowercosts and improve efficiency. Banks’ interest ratemargins had also narrowed during the period, mainlythrough the reduction in lending rates. This, hadin turn, benefited borrowers without having adverseeffects on returns for depositors.
On the whole, the accommodative monetary policytogether with the expansionary fiscal policy havecontributed to alleviating the impact of the sharpcontraction in the export-oriented manufacturing sectoron the domestic economy. This outcome was evident inseveral monetary and real sector indicators. In the firsteight months, total banking system loans rose byRM14.4 billion compared to RM13 billion in thecorresponding period of high growth in 2000. This loangrowth occurred despite the moderation in economicgrowth in 2001. The increase in outstanding loans wasalso broad-based and most apparent in the case ofinterest-sensitive loans such as those for housing and
consumption including loans for the purchase ofpassenger cars and credit card facilities. Other sectorsthat registered higher loans include transport vehicles;transport, storage and communications; finance,insurance and business services; manufacturing; andwholesale trade. The year also saw continued recourseto the PDS market as a major source of funding.Including loans extended by the banking system andthe issuance of PDS, total financing in the first eightmonths grew by 8.2% at end-August, despite theslowdown in economic growth. In addition, indicatorsfor private consumption such as sales of new passengercars (+12.7% in the first eight months), sales taxcollection (+19.6%) and loans approved and disbursedfor consumption credit (+20.3% and +24.7%respectively) also registered continued expansion.
The low inflation environment has provided theflexibility to pursue an accommodative monetarypolicy. As the year progressed, inflation moderatedin line with expectations. The headline inflationmoderated to 1.4% in 2001 (1.6% in 2000), whilecore inflation moderated to 1% from 1.5% duringthe same period. The lower underlying inflation wasattributed to demand remaining relatively weakamidst inventory accumulation and excess capacityin several sectors of the economy. These domesticconditions were further supported by the relativelystable exchange rate and lower imported inflation.
However, the subsequent September 11 incidentheightened the macroeconomic risks towards furthereconomic weakness and significantly dampened theglobal growth outlook. Although Malaysia’s economicfundamentals have remained strong, with subduedinflationary conditions and a strong external balance,as an open economy, Malaysia is not insulated fromexternal developments. Following thesedevelopments, BNM lowered the Intervention Rate by50 basis points to 5.00% on 20 September. This,together with further fiscal measures was aimed atpromoting domestic demand and mitigating thepotential risks of adverse external developments.The average BLRs of commercial banks and financecompanies declined to 6.39% and 7.45%respectively. In addition, the lending rates of thespecial funds for SMEs and Bumiputera entrepreneurswere lowered, while the scope and eligibility criteriafor selected funds were liberalised in October.
The reduction in lending rates contributed toproviding a positive environment for the privatesector. Financing activity in the last four monthscontinued to remain resilient. Total financing through
Monetary and Fiscal Developments
loans extended by the banking system and PDS issuedby the private sector rose by a further RM9.8 billion inthe last four months or 6% as at end-2001. Similarly,both loan approvals (RM39.7 billion for September toDecember) and loan disbursements (RM124.7 billion)by the banking system were also sustained.
With the reduction in the Intervention Rate, BNMliquidity operations continued to maintain interbankrates at the prevailing levels, moderating thereduction in the deposit rates. Consequently,depositors continued to earn a positive real rate ofreturn on deposits placed with banking institutions.
During the year, the management of monetary policycontinued to focus on managing liquidity flows inorder to maintain stable interbank rates. Liquidityoperations undertaken by BNM were largelyexpansionary in the first half of 2001. BNM injectedRM15.5 billion into the system through the interbankmoney market to offset the contractionary impact ofnet outflow of funds from the domestic economy.During this period, amidst the continued inflow offoreign direct investment and trade surpluses, therewere higher payments for imports and repayments ofexternal debt as well as higher overseas investment.In addition, there were also sentiment-driven capitaloutflows, particularly in March and early April whenthe financial markets were unstable.
However, liquidity operation turned contractionary inthe second half of the year following the net inflow offunds during the period. The inflows exerted anexpansionary impact on liquidity and exerted downwardpressures on interest rates. To maintain stable interbankrates, BNM mopped up RM12 billion of excess fundsfrom the interbank market in the second half of theyear. At the end of 2001, total net funds locked in withBNM amounted to RM46.1 billion (RM49.6 billion atend-2000). This essentially reflects the ample liquidityenvironment in the financial system.
Another important measure included the New LiquidityFramework (NLF), which was implemented in early 1999and came into full compliance in 2001. The NLF wouldenable banking institutions to minimise the maturitymismatch in their balance sheets, thereby allowinggreater flexibility in managing the investment portfolio.This NLF represents an important step in the ongoingprocess towards developing a more market-orientedmonetary policy framework. A more flexible assetscomposition will render banks’ balance sheets moresensitive to changes in interest rates, making thetransmission of monetary policy more effective.
Efforts were also intensified in 2001 to ensureselected sectors, especially the small and mediumenterprises and the agriculture sector, continued tohave access to financing. These were undertaken inaddition to a series of measures implementedincluding improving the loan approval process inbanking institutions, promoting alternative sources offinancing including venture capital, setting up of adedicated unit to monitor loan complaints in eachbanking institution and to manage problem loans,and the setting up of the Bumiputera DevelopmentUnit which provides financial advisory services toBumiputera entrepreneurs.
In April 2001, the size and scope of selected specialfunds were expanded, and their lending rates werelowered. In July, the Entrepreneurs Rehabilitation andDevelopment Fund (ERDF) with an allocation ofRM500 million was established to assist Bumiputeraentrepreneurs to address the problem of NPLs as wellas to provide working capital. Following thereduction in the Intervention Rate, the maximumlending rates of selected funds were also reduced inOctober. Their eligibility criteria and scope were alsoliberalised (see box on Monetary Measures). As aresult of these initiatives, the overall banking systemloans extended to the SMEs rose by RM2.2 billion or3.1% in 2001. The loans were mainly channelled tothe broad property, wholesale and retail trade,electricity and transport sectors.
The monetary policy framework in 2001 continued tooperate under a pegged exchange rate regime. Theringgit remained fixed at RM3.80=US$1, anarrangement that has been effective since 2 September1998. Given the volatile environment in theinternational foreign exchange market in 2001, thefixed exchange rate regime continued to providepositive benefits to the Malaysian economy. The stabilityaccorded by the ringgit peg provided an environment ofcertainty for decision making, encouraged confidence inthe ringgit and discouraged speculation, conferredefficiency gains in the form of lower hedging andtransactions costs, while allowing the restructuring ofthe banking system and the corporate sector to achievean advanced stage of progress.
Foreign exchange markets, especially regionalmarkets, remained volatile in 2001. Depreciation ofyen exchange rate was, from time to time, followedby depreciation of regional currencies. The ringgit inthis environment continued to be supported by strongfundamentals of low inflation, strong current accountsurplus, low external debt, high savings rate, and a
58

59
Monetary and Fiscal Developments
3F 4.0 3.75 -0.25 1.0 0.25 -0.75
NEF 6.0 5.5 -0.5 4.0 2.0 -2.0
FSMI 2 6.5 5.5 -1.0 4.0 2.0 -2.0
1/ Charged by lending institutions to borrowers.2/ Charged by Government on lending institutions.
Funds
Maximum Lending Rates1/ Funding Rates2/
(% p.a.) (% p.a.)
Previous New Change Previous New Change
Monetary Measures in 2001
Monetary measures introduced in 2001 were aimed at stimulating domestic demand amid a lessfavourable external environment. With the global economic slowdown, exacerbated by the September11 incident in the US, there was further easing of monetary policy, with a reduction in the InterventionRate, to provide further support for domestic economic activity. Measures were also introduced toimprove access to financing, at reasonable cost, to a wider group of small and medium enterprises (SMEs)and the agriculture sector. These measures were as follows:
• In March 2001, together with the unveiling of the fiscal stimulus package, several financial measureswere announced and implemented in stages:
(i) The size and scope of existing special funds were expanded while their lending rates werereduced. The allocations for the Fund for Food (3F) and the New Entrepreneur’s Fund (NEF) wereraised from RM1 billion and RM1.25 billion to RM1.3 billion and RM1.5 billion respectively. TheFund for Small and Medium Industries 2 (FSMI 2) was doubled to RM400 million while itseligibility criteria was expanded to include the non-export sector. With effect from 16 April 2001,the funding and lending rates of the 3F, NEF and FSMI 2 were reduced as follows:
(ii) The tax of RM50 on credit cards introduced in 1997 was abolished to promote greater use ofcredit cards.
(iii) In July 2001, the Entrepreneur Rehabilitation and Development Fund (ERDF) was established withan allocation of RM500 million to assist viable small and medium Bumiputera entrepreneurs. Ofthis total allocation, RM120 million was set aside for the resolution of NPLs not exceeding RM1million and the remainder to assist these businesses to continue their activities through theprovision of working capital.
• On 20 September 2001, BNM announced the reduction of the 3-month BNM Intervention Rate by 50 basis points to 5.00%. Accordingly, the ceiling base lending rates of commercial banks and finance companies declined to 6.42% and 7.46% respectively. The reduction in the Intervention Rate was aimed at addressing the increased risks biased towards weaker domestic economic growth in the aftermath of the September 11 incident in the US. In particular, the reduction in the Intervention Rate served to contain the implications of the more adverse external environment on domestic business and consumer activity.
• With the reduction in the 3-month Intervention Rate, BNM announced the further reduction in lending rates and liberalization of eligibility criteria of several special funds:
(i) With effect from 15 October 2001, the lending rates applicable to existing and new borrowers ofthe Rehabilitation Fund For Small and Medium Industries (RFSMI), FSMI 2 and NEF were reducedby 0.5 percentage points. The funding rates of these funds were also reduced by 0.5 percentage points each. This was the second rate reduction, following the first in April, to further lower the

60
Fund Criteria/conditions Previous New
Fund for Food (3F)
Rehabilitation Fund forSmall and MediumIndustries (RFSMI)
Fund for Small andMedium Industries(FSMI 2)
Maximum financing per customer 90% of total project costor RM3 million, whicheveris lower
90% of total project costor RM5 million, whicheveris lower
Maximum financing for land cost 20% of the total projectcost
30% of the total projectcost
Financing for food processing anddistribution
Not eligible Eligible, provided the rawmaterials are fromdomestic sources
Maximum limit for loanrefinancing/restructuring
30% of the total loanamount approved
40% of the total loanamount approved
Purpose of financing Working capital only Working capital andcapacity expansion
BumiputeraEntrepreneur ProjectFund (BEPF)
Maximum financing 30% of contract amount 60% of contract amountor RM3 million,whichever is lower
EntrepreneurRehabilitation andDevelopment Fund(ERDF)
Borrower’s NPL Limit RM1 million Exceed RM1 million,provided the total NPL canbe reduced to RM1 millionwithin two months afterapproval of the facility byERF Sdn. Bhd.
Maximum financing for contractbelow RM100,000
RM30,000 RM60,000
Turned NPL from 1 January1998 to 30 June 2001
Extended to 31December 2001
Maximum financing per customer RM1 million RM3 million
Wages Not eligible Eligible
RFSMI 5.0 4.5 -0.5 1.0 0.5 -0.5
FSMI 2 5.5 5.0 -0.5 2.0 1.5 -0.5
NEF 5.5 5.0 -0.5 2.0 1.5 -0.5
1/ Charged by lending institutions to borrowers.2/ Charged by Government on lending institutions.
Funds
Maximum Lending Rates1/ Funding Rates2/
(% p.a.) (% p.a.)
Previous New Change Previous New Change
cost of doing business. The changes in the lending and funding rates of RFSMI, FSMI 2 and NEF areas follows:
(ii) To further enhance access to the financing schemes, with effect from 15 October 2001, theeligibility criteria and scope of the following special funds were also liberalised:

61
Monetary and Fiscal Developments
• On 27 November 2001, BNM announced the removal of the restriction on the provision of bridgingfinance for development of residential properties above RM250,000 per unit as well as fordevelopment of shop houses exceeding RM250,000 per unit located within residential areas. Theupliftment of the financing restriction for this specific sub-sector was in response to the reduction inunsold properties in the residential sub-sector. As the overhang (in value and units of unsoldproperties) still remains large for the other sub-sectors of the property market, the bridging financerestriction for development of commercial properties and projects involving shop houses priced morethan RM250,000 per unit, which are not located within residential areas, remained unchanged.
• On 18 December, BNM announced the Bon Simpanan Malaysia Siri 03 (BSM03) issue. A total of RM1billion of BSM03 was offered for sale during the period 2 - 31 January 2002, of which RM500 millionwould be issued based on Islamic principles. The bonds have a maturity period of 2 years and a rateof return of 5% per annum. Only senior citizens that are not employed on a full time basis, andcharitable organisations registered with the Registrar of Societies are eligible to purchase the bonds.The BSM03 was issued by BNM to mitigate the impact of the current low interest rate environmenton incomes of senior citizens and charitable organizations, primarily dependent on income fromdeposits placed with the banking institutions, thereby sustaining their spending ability.
more resilient financial sector. Reserves also resumedits rising trend in the second half of the year.Malaysia’s external liquidity position remained strongas reserves rose to cover more than 6 times short-term external debt.
Under these circumstances, the strategy was to put inplace policies that will facilitate adjustments in thedomestic economy to strengthen the nation’scompetitive position. These policies aimed to ensurethat the Malaysian economy has the flexibility to deliverthe necessary internal adjustments to support theexchange rate peg. The Malaysian economy has arelatively diversified economic base and a flexible andmobile labour force. The on-going corporate sectorrestructuring would also result in further flexibility inprice adjustments.
Public perception and confidence are also an importantfactor in exchange rate sustainability. Through thedissemination of more detailed information, regulardialogues with various segments of the private sectorincluding exporters, manufacturers and members of themedia, BNM has sought to highlight issues regardingthe exchange rate and factors influencing itssustainability. These have contributed to a greaterawareness of the exchange rate developments onprivate sector balance sheet conditions as well asallowing greater appreciation of the macroeconomicrationale of the exchange rate strategy.
The pegged exchange rate has, for more than threeyears, effectively and efficiently facilitated international
trade and investment without resulting in macro-economic imbalances. As an open economy that ishighly dependent on international trade, a stableexchange rate that is consistent with economicfundamentals is of great importance. While it may betempting to manipulate the exchange rate to gaincompetitive advantage, it is recognised that such apolicy may only provide temporary benefits. Long-terminternational competitiveness cannot be achievedthrough exchange rate manipulation. Malaysia has,therefore, chosen to maintain a stable exchange rate,and commit itself to ensuring that policies and domesticeconomic fundamentals remain consistent with theexchange rate peg. In addition to policies aimed atkeeping inflation low, the external balance strong,external debt at low and at prudent levels, reserve levelscomfortable and banking sector strong and resilient;efforts are also being directed to continue to buildgreater flexibility in markets to adjust to external anddomestic developments. The stronger macroeconomicfundamentals in a more diversified economy, enhancedmobility of labour and capital, a more resilient bankingsystem and the growing significance of the domesticeconomy had indeed provided Malaysia with theincreased resilience to tolerate and cope with externalshocks to the domestic economy.
During the year, the Bank continued to undertake anumber of measures that were aimed at enhancingthe efficiency and transparency of monetary policymanagement. A priority of policy was to ensure thatadequate information continue to be made availableto the public and the market. To achieve this, more

62
frequent statements and dialogues were held withmarket participants. There were also regular sessionsand interviews with both the local and foreignjournalists to enable market participants and themedia to have a better understanding of monetarypolicy objectives in Malaysia and its measures. At thesame time, there was also a further enhancement ofdata published through BNM’s bulletins. The Bankalso hosted a number of international conferencesand summits, so that the Malaysian experience and itsperspective in managing the economy and financialsector could be better known and appreciated.
MONETARY DEVELOPMENTS
The overall monetary conditions in 2001 wereconsistent with BNM’s monetary policy objectives inpromoting domestic economic activity. The low interestrate environment together with the ample liquiditysituation contributed towards sustained bank lendingactivity. Higher financing for the private sector coupledwith expansionary external operations contributed to
the expansion in monetary aggregates during the year.Inflation continued to remain low in this environment.
The 3-month BNM Intervention Rate was reduced by 50basis points to 5.00% on 20 September to addressheightened risks biased towards weakness in thedomestic economy following the September 11 incidentin the US. Meanwhile, the interbank rates remained
relatively stable throughout the year. The overnight and3-month interbank rate stood at 2.76% and 3.27%respectively at the end of 2001 (2.77% and 3.25%respectively at end-2000). Consequently, the
divergence between the 3-month interbank rate andthe Intervention Rate narrowed to 173 basis points from225 basis points at the end of 2000.
The retail interest rates offered by the bankinginstitutions were generally stable for the first ninemonths of the year. The average base lending rate(BLR) of the commercial banks (CBs) and finance
Monetary conditions remained conducive to support domesticeconomic activity amidst low inflation. The low interest rateenvironment, ample liquidity conditions and strengthened bankingsystem contributed to higher financing and expansion in monetaryaggregates.
2.0
2.5
3.0
3.5
4.0
4.5
5.0
5.5
6.0
J F M A M J J A S O N D J F M A M J J A S O N D
%
3-MthIntervention
3-Mth 1-Mth 1-Week Overnight2000 2001
Graph 2.1Interbank Rates (average for the month)
2
4
6
8
D J F M A M J J A S O N D J F M A M J J A S O N D
%
2
4
6
8
D J F M A M J J A S O N D J F M A M J J A S O N D
%Finance Companies (average rates at end-month)Commercial Banks (average rates at end-month)
Savings 1-m FD 3-m FD BLR12-m FD ALR Savings 1-m FD 3-m FD BLR12-m FD ALR
1999 2000 2001 1999 2000 2001
Graph 2.2Interest Rates of Banking Institutions

63
Monetary and Fiscal Developments
companies (FCs) remained at 6.79% and 7.95%respectively, virtually unchanged since August 1999.Following the 50 basis points reduction in theIntervention Rate on 20 September, the BLRs of bothgroups of banking institutions adjusted downwardsby 39 and 50 basis points respectively to a historicallow of 6.39% and 7.45% respectively by the end ofSeptember 2001. Thereafter, the rates remainedunchanged. Lending rates in Malaysia are thesecond lowest in the region.
Similarly, the average fixed deposit (FD) rates offeredby CBs and FCs, which had remained relativelystable in the first nine months of the year, adjusteddownwards following the policy rate reduction byBNM. The average quoted FD rates of CBs and FCs,for the one to 12-month maturities fell to 3.20-4.00% and 3.22-4.03% respectively by the end ofSeptember (3.45-4.24% and 3.46-4.27%respectively at end-2000). At the same time, BNMcontinued to direct its liquidity operations tomaintain interbank rates at the prevailing levels,resulting in the smaller reduction in the depositsrates. For the CBs, the quoted FD rates with one to12-month maturities declined by 24-36 basis points,
while the rates for FCs declined by 26-50 basispoints. Consequently, the term structure of FD ratesbecame steeper than that at end-2000.
The savings rates of both the CBs and FCs moved in asimilar trend as the FD rates. The savings rates weregenerally unchanged during the first nine months andsubsequently declined in October. As at end 2001,the average savings rates of CBs and FCs stood at2.28% and 2.94% (2.72% and 3.44% respectively atend-2000). Given an inflation rate of only 1.4% in2001, depositors continued to enjoy a positive realrate of return of 0.88% and 1.54% for deposits withcommercial banks and finance companies respectivelyfor savings deposits and 1.81% for 3-month FD forboth groups of institutions.
During the year, the gross interest margin of bankinginstitutions narrowed further to 3.86% and 6.31%respectively at the end of 2001. This reflected thelarger reduction in the average lending rate (ALR) vis-à-vis the average cost of funds (ACFs). Reflecting theslower declines in FD rates and the relatively stable
Table 2.1Interest Rates of Banking Institutions (%)
Commercial 3-month FD 3.47 3.21 –0.26Banks Savings deposit 2.72 2.28 –0.44
Base lending rate 6.78 6.39 –0.39
Finance 3-month FD 3.52 3.21 –0.31Companies Savings deposit 3.44 2.94 –0.50
Base lending late 7.95 7.45 –0.50
2000As at end 2001 Difference
4.404.304.20
4.104.00
3.903.80
3.703.60
3.503.40
3.303.20
3.103.00
%
1 mth 3 mth 6 mth 9 mth 12 mth
2000 2001
4.404.304.204.10
4.003.903.803.703.603.503.40
3.303.203.103.00
%
1 mth 3 mth 6 mth 9 mth 12 mth
2000 2001
Graph 2.3Fixed Deposit Term Structure of CommercialBanks (average as at end–period)
Graph 2.4Fixed Deposit Term Structure of FinanceCompanies (average as at end–period)
Table 2.2Interest Margins of Banking Institutions (%)
Commercial Avg. lending rate Banks (ALR) 7.46 6.67 –0.79
Less Avg. cost of funds (ACF) 3.16 2.81 –0.35
Interest Margin 4.30 3.86 –0.44
Finance Avg. lending rate Companies (ALR) 11.14 10.24 0.90
Less Avg. cost of funds (ACF) 4.06 3.93 0.13
Interest Margin 7.08 6.31 0.77
2000As at end 2001 Difference

money market rates, the ACFs of CBs and FCsdeclined at slower rates of 35 and 13 basis points to2.81% and 3.93% at the end of 2001. The ALR, onthe other hand, declined by 79 basis points and 90basis points to 6.67% and 10.24% for both CBs andFCs respectively at end-2001, underpinned by themore severe competition among banking institutionsto attract borrowers amidst an environment of ampleliquidity and moderating economic growth.Competitive interest rates were particularly evident formortgage and hire purchase loans reflecting therelatively strong demand for credit in these sectors.
In terms of international comparison of nominalinterest rates, the negative differential betweenMalaysia and the United States (-315 basis points atend-2000) turned positive since September 2001(+139 basis points at end-2001), following a series ofreductions in the US rates throughout the year. Thedifferential widened further in the later part of 2001,following the aggressive cuts in the US rates after theSeptember 11 incident. Comparison with rates inSingapore showed that the interest rates differentialscontinued to be positive in favour of Malaysia.
Money supply continued to expand in 2001 at arelatively stable pace for the greater part of the year.In the first eleven months, the annual growth in M1,M2 and M3 averaged 6.7%, 4.2% and 4.9%respectively. However, the annual growth ratesmoderated to 3.2%, 2.2% and 2.8% respectively atend-December due mainly to the high base ofDecember 2000, as well as the build-up inGovernment deposits in December 2001.
The slower rate of increase in narrow money or M1(currency in circulation and demand deposits) of
3.2% in 2001 reflected a marginal decline in currencyin circulation (-0.5%). Demand deposits also increasedat a slower rate of 4.7% (15.0% in 2000). Themoderate demand for transaction balances partlyreflected the weaker economic activities as well as theoptimisation of such balances with the increasedutilisation of credit cards. Credit card transactions as aproportion of total private consumption expenditurerose from 8.7% in 2000 to 10.8% in 2001. Theslower rate of increase in demand deposits alsoreflected the performance of the Kuala Lumpur StockExchange. As stock market transactions are generallyconducted through checking accounts held withbanking institutions, the trend in demand depositstends to be affected by developments on the KLSE.
The continued rise in broad money or M3, albeit at amore moderate pace (2.8%; 5.0% in 2000) generallyreflected the overall economic conditions. In terms ofcomponents, there were increases in savings deposits,repos and demand deposits. The increase in repos, to
64
6.40
3.293.013.043.003.273.25
3.283.283.00 1.390.810.65
0.692.85 2.85
3.27-0.18-0.39-0.84-0.70-1.33
-1.84-2.05-2.15
-3.15
5.425.05 4.88
4.343.99 3.84
3.67
2.592.20 2.04 1.88
3.46
1.52.02.53.03.54.04.55.05.56.06.57.0
D J F M A M J J A S O N D
%
Nominal rates in MalaysiaNominal rates in the United States
Malaysia vs. United States
2000 2001
3.25 3.273.00 3.04 3.01
3.293.00
3.28 3.28 3.28
2.85 2.85
3.27
2.221.91
2.24
1.160.820.791.060.89
0.430.87 1.03 1.19
1.532.82
2.38
1.942.25 2.19 2.13 2.13 2.25
2.09
0.630.94 1.03
1.75
0.00
0.50
1.00
1.50
2.00
2.50
3.00
3.50
D J F M A M J J A S O N D
%
Nominal rates in MalaysiaNominal rates in Singapore
2000 2001
Malaysia vs. Singapore
0.00
3.28
Graph 2.5Nominal Interest Rate Differentials
0
5
10
15
20
25
30
35
J F M AM J J A S O N D J F M AM J J A S O N D2000 2001
M1 = 3.2M2 = 2.2M3 = 2.8
M1
M2
M3
%
Graph 2.6Money Supply: Annual Growth

Monetary and Fiscal Developments
some degree, was indicative of the higher demandfor liquidity. Repos provide flexibility for the corporatesector to manage their cash flows. Foreign currencydeposits also increased by RM1.3 billion on accountof trade-related placements by business enterprises.Despite the large placements by individuals, fixeddeposits declined marginally, attributable to thewithdrawals by business enterprises and non-bankfinancial institutions. The latter development partlyreflected the shift by these entities to other types ofdeposits, namely repos and, to a lesser extent, NIDs.While the gap between interest rates on fixeddeposits, and NID and repo rates remained relativelystable, the flexibility accorded by NIDs and repos, interms of tradability and liquidity respectively, weregenerally more attractive to institutional depositors.
By holder, the higher deposits were almost entirelydue to increased deposits by individuals (RM14.3billion, compared to RM10.7 billion in 2000). Thisstronger increase in deposits of individuals reflectedseveral factors. The increase in salaries of civilservants, reduction in employees’ share of EPFcontribution as well as higher tax rebates contributedto higher disposable incomes and, hence, higherdeposits. While the propensity to consume wasrelatively high among those who benefited from taxrebates and higher incomes, there was also some riskaversion amid the weak economic expansion.Consequently, although private sector consumptionwas sustained, there were some increases in savingsand fixed deposits. The higher deposits, to someextent, also reflected the relatively stable and positivereal deposit rates amid low inflation.
Meanwhile, the lower deposits by businesses wereattributable to a combination of factors. Firstly, itreflected generally lower profitability of somebusinesses. Secondly, businesses with cash surplusesalso repaid their loans amid a situation of excesscapacity. Finally, rates on large deposits tendedto be lower than quoted rates, which created anincentive among corporations with large deposits toinvest their funds in higher yielding papers, such asprivate debt securities.
While deposits of individuals and businesses accountedfor the most significant portion of changes in thecomponents of broad money, deposits by non-bankfinancial institutions and non-residents contracted duringthe year (-RM1.5 billion and -RM1.4 billion respectively).The former reflected to some extent, the placement ofdeposits by a non-bank financial institution with BNM aswell as purchases of MGS during the year.
In terms of determinants, the impetus to growth inM3 emanated from higher claims on the privatesector (+RM20.3 billion) and expansionary externaloperations (+RM7.6 billion). Reflecting thesignificance of domestic-led economic activity, whichis more dependent on domestic sources of financing,bank lending remained resilient (+RM16.8 billion),with loans extended primarily to the householdsector, amid a particularly supportive environment ofcompetitive lending rates. In addition, holdings ofsecurities by the banking institutions also increased byRM3.2 billion.
Net external operations (pre-revaluation) alsocontributed further to the expansion in M3, rising byRM7.6 billion. In the first six months of the year, netexternal operations of the non-bank sector recordedan increase of RM1.6 billion. Although BNM’sinternational reserves recorded a decline of RM10billion (excluding net revaluation losses) during thisperiod, the net external assets of the banking systemrose by RM11.6 billion. Banking institutions sought tohedge the increase in forward purchases undertakento cover exchange rate risk on import payments, inthe wake of volatility in the foreign exchangemarkets, especially during March and April 2001. Inaddition, as foreign interest rates were higher duringthis period, there were some interest rate arbitrageactivities. This situation reversed in the secondhalf-year when net external operations of thenon-bank sector recorded an increase of RM6 billion.
65
Table 2.3Broad Money, M3
Change (RM billion)
2000 2001
M3 21.9 13.0
Currency1 –1.9 –0.1Demand deposits 7.6 2.9Broad quasi-money 16.2 10.2
Fixed deposits 8.2 –0.4Savings deposits 6.4 4.5NIDs –0.9 0.6Repos –0.3 4.2Foreign currency deposits 2.9 1.3
DeterminantsNet claims on Government 4.4 –1.5Claims on private sector 26.0 20.3
Loans 21.6 17.1Securities 4.4 3.2
Net external operations 7.3 7.6BNM2 1.6 7.7Banking system 5.7 –0.1
Other influences –15.8 –13.4
1 Excludes holdings of banking institutions.2 Pre-revaluation.

The increase in BNM’s international reserves ofRM17.7 billion (excluding net revaluation gains) waspartly offset by the decline in net external assets ofthe banking system of RM11.7 billion following theunwinding of forward purchases, as well as thenon-rollover of balances previously placed abroad asnominal interest rate differentials had turned inMalaysia’s favour beginning September 2001.
Government operations were mildly contractionary onmoney supply (-RM1.5 billion) as the increase indeposits (+RM5.7 billion) offset higher claims on theGovernment (+RM4.2 billion). There were largewithdrawals of Government deposits from BNM atthe beginning of the year. Subsequently, significantincrements in deposits were registered at the end ofevery quarter arising mainly from the receipts of threereopenings and one new issue of MGS, totalingRM21.5 billion for the year as a whole. Two new
foreign loans, namely the US$1 billion 10-year Notesissued in June and the US$540 million syndicatedloan raised in December also contributed to theincrease in deposits with BNM. The increase inGovernment deposits with BNM also reflected thebetter-than-expected revenue performance.
Other influences were also contractionary on moneysupply. These included higher provisions for loanlosses; higher profits of the banking institutionsduring the year; as well as the placement of depositsby a non-bank financial institution with BNMamounting to RM1.5 billion.
Financing activities expanded further in 2001 amidan environment of low interest rates and ampleliquidity. In aggregate, financing through loansextended by the banking system (includingIslamic banks) and PDS issued by the privatesector increased by RM33.5 billion or 6% in 2001.Loans extended by the banking institutions(including loans sold to Cagamas and Danaharta)increased by 3.6% for the year as a whole. Whileloan growth was relatively stronger in the first ninemonths (+3.5%), it moderated in the remainingmonths of the year (+0.1%). The slower pace ofcredit growth in November and December wasmainly due to the large loan repayments inconnection with the restructuring of non-performingloans as well as the refinancing of banking systemloans through the issuance of PDS. Excluding theselarge repayments, credit would have increased byRM20.6 billion or 4.5% in 2001. Including bankinginstitutions’ holdings of PDS, total financing by thebanking system increased by 5.2% in 2001.
Financing through the PDS market (excludingCagamas, Danaharta and Danamodal bonds)
66
0
1
2
3
4
5
6
7
8
9
1998 1999 2000 2001-20
-10
0
10
20
30
40(%) RM billion
Net Claims on Government
Claims on the Private Sector
Net External OperationsOther InfluencesM3 Growth (LHS)
Graph 2.7M3 Determinants
Table 2.4 Financing through Banking System Loans1 and PDS
Financing by Banking System 472.1 496.6 30.0 24.6 6.8 5.2 Loan outstanding (1) 454.0 470.4 23.5 16.4 5.5 3.6 Holding of PDS 18.1 26.2 6.5 8.2 56.1 45.1
Total PDS outstanding 2 (2) 100.8 118.0 22.4 17.1 28.6 17.0
Total (1) + (2) 554.9 588.4 46.0 33.5 9.0 6.0
1 Including Islamic banks2/ Refers to total PDS issued by the private sector with original maturity period of more than one year. Exclude debt securities issued by banking institutions,
Khazanah, BNM, Cagamas, Danaharta and Danamodal.Note: Total may not add-up due to rounding
Outstanding
RM bilion %
Change
2000 2001 2000 2001
Annual growth
2000 2001

Monetary and Fiscal Developments
continued to increase strongly, expanding by 17%in 2001. This has been a positive development as itnot only reduces the over dependence on thebanking system for financing, but also diversifiesfurther the risks associated with long-term financingdirectly to investors in the PDS market. Of the totalgross funds raised from the PDS market, a higherproportion of 41% was to finance new activities,while the remainder was for refinancing (38%) andrestructuring (21%). In contrast, in 2000, one-half ofthe PDS issuance was for restructuring purposes.
During the year, loan approvals were lower, amountingto RM125.6 billion (RM134.8 billion respectively in2000). Approvals were granted mainly for the purchaseof residential properties and passenger cars as well as tothe manufacturing sector. Nevertheless, the higher loandisbursements of RM371.8 billion (RM360.7 billion in2000) were broad-based, channelled mainly tomanufacturing; wholesale and retail trade, restaurantsand hotels; finance insurance and business services; andconstruction sectors; as well as for the purchase ofresidential properties and passenger cars. However, thehigher disbursements were almost matched by equallyhigh repayments, amounting to RM364 billion(RM347.1 billion in 2000). As a result, outstandingloans increased by 3.6%.
Overall, credit growth in the banking system reflectedthe higher loans extended to the household sector forthe purchase of residential properties and passengercars. Loans to business enterprises were lower duemainly to the lower loans for the utilities; transport,storage and communication and construction sectors.However, reflecting the many measures to promotelending to the small and medium enterprises (SMEs),loans to this group expanded further by 3.1% or RM2.2billion (4.3% in 2000).
By borrower, loans to the household sector rosemarkedly by 14% in 2001 (12.4% in 2000). Thestrong demand for loans by the household sector wasattributable to several factors:
• Response to monetary and fiscal measures undertaken to raise domestic demand. The disposable income of households wasenhanced through the reduction of the mandatory contribution to the Employees Provident Fund (EPF) and the increase in individual income tax rebates. Other measures also included the reinstatement of incentives offered in the house ownership campaign such as stamp duty exemption and processing fee waivers, as well as the abolition of the RM50 tax on credit cards.
• Amid ample liquidity, banking institutions were more active in promoting consumer loans as reflected by the more competitive interest rates and attractive packages for housing and hire purchase loans as well as credit card facilities. There was also some refinancing of mortgage loans in view of the low interest rate environment.
67
5
10
15
20
25
30
35
40
1Q 2Q 3Q 4Q 1Q 2Q 3Q 4Q 0
20
40
60
80
100
120
Disbursements Repayments Approvals
Approvals Disbursements, Repayments
2000 2001
Graph 2.8Loan Approvals, Disbursements andRepayments (RM billion)
Manufacturing27.9%
Broad property16.9%
Wholesale and retailtrade, restaurants and hotels
17.7%
Finance, insurance and business services
7.7%
Consumption credit14.7%
Purchase ofsecurities
1.9%
Others13.2%
(RM371.8 billion)
Manufacturing11.1%
Broad property33.2%
Wholesale and retailtrade, restaurants and hotels
7.3%
Finance, insurance andbusiness services
5.8%
Consumption credit23.6%
Purchase ofsecurities
4.0%
Others15.0%
(RM125.6 billion)
Loan Approvals in 2001
Graph 2.9Loan Disbursements in 2001

• Banking institutions continued to aggressively promote credit card facilities by selectively offering annual fee waivers and free gifts to widen their customer base. As a result, the number of credit cards in circulation increased by 625,801 or 22.2% to 3.4 million as at end-2001. Correspondingly, the outstanding balanceof credit card debt also increased by RM1.5 billion or 21% during the year (+RM1.8 billion or 33.2% in 2000) to RM8.9 billion as at end-2001. The bulk of the credit card transactions was mainly for purchases of goods and services (89.2%) as opposed to cash advances (10.8%).
With the aggressive promotion of credit cards bybanking institutions in recent years, BNM hascontinued to closely monitor credit carddevelopments. In terms of the quality of credit carddebt, the overdue balances as a percentage of totaloutstanding balances remained low at 13.3% in2001, compared with 23.5% in 1998. In addition,the share of total outstanding balance of credit carddebt to total loans outstanding remained low, at2.1% in 2001 (1.8% in 2000).
Loans outstanding extended to business enterpriseswere lower (-1.6%) during the period reflecting thehigh rate of repayments as a result of refinancing,which to some extent was part of the debtrestructuring process, and also the more moderateeconomic expansion in 2001:
• Although loan disbursements to business enterprises remained high in 2001, they were
68
Table 2.5Banking System1: Loans Outstanding by Sector
Agriculture, hunting, forestry and fishing 12.0 12.4 0.4 2.6Mining and quarrying 1.7 1.5 –0.2 0.3Manufacturing 68.4 68.4 … 14.5Electricity, gas and water supply 7.8 5.3 –2.5 1.1Wholesale and retail trade, restaurants and hotels 38.1 38.9 0.8 8.3Broad property sector 163.2 175.8 12.6 37.4
Construction 41.1 40.1 –1.1 8.5Purchase of residential property 74.3 87.1 12.8 18.5Purchase of non-residential property 29.4 29.7 0.3 6.3Real estate 18.5 19.0 0.6 4.0
Transport, storage and communication 13.9 12.5 –1.5 2.7Finance, insurance and business services 34.5 35.4 0.9 7.5Consumption credit 59.7 69.4 9.7 14.8
of which:Credit cards 7.4 8.9 1.5 1.9Purchase of passenger cars 37.5 45.5 8.0 9.7
Purchase of securities 33.6 30.4 –3.2 6.5Purchase of transport vehicles 1.7 2.4 0.7 0.5Community, social and personal services 6.3 6.2 –0.1 1.3Others 13.1 11.8 –1.3 2.5
Total loans outstanding 2 454.0 470.4 16.4 100.0
Plus: Holdings of PDS 18.1 26.2 8.2
Total Financing 472.1 496.6 24.6
1 Including Islamic banks2 Including loans sold to Cagamas and NPLs sold to Danaharta
Numbers may not add-up due to rounding
As at end
2000
Change2001
Share of total2001
RM billion %
2001
0
1,000
2,000
3,000
4,000
5,000
6,000
Q1 Q2 Q3 Q4 Q1 Q2 Q3 Q40.0
0.5
1.0
1.5
2.0
2.5
3.0
3.5
4.0
Purchases Cash advances
No. of cards in circulation (RHS)
RM millionduring the quarter
million unit as atend-period
2000 2001
Graph 2.10Number of Credit Cards and Volume of Transaction

Monetary and Fiscal Developments
matched by equally high repayments. This in part reflected refinancing of loans to take advantage of the historical low interest rates and borrowing for short-term working capital requirements as opposed to borrowing for long-term investment purposes.
• The successful completion of the debt restructuring scheme for the light rail transit companies by the Corporate Debt RestructuringCommittee (CDRC), also led to some non-performing loans (RM2.9 billion) being taken offthe loan books of the banking institutions.
• There were also some refinancing of loans via the PDS market to reduce the operating costs ofcompanies.
• An increased number of corporations raised funds through the capital market during the year. This was evidenced by the higher gross issuance of private debt securities for financing new activities, amounting to RM13.9 billion or 41% (RM9.2 billion or 32% in 2000) to lock in the low long-term fixed rates.
• There continued to be excess capacity in severalindustries amid increased uncertainties about the prospects of the global economy and its adverse implications on Malaysia.
Consequently, new loans approved for businessenterprises were lower by 12.5% in 2001 andaccounted for a smaller share of total new loansapproved (50.9%; 54.2% in 2000).
Meanwhile, several measures that were introducedto improve access to credit for the SMEs and theagriculture sector resulted in higher loans to thesegroups. Loans extended to the SMEs rose furtherby RM2.2 billion or 3.1% in 2001 (+RM2.9 billion
or 4.3% in 2000). The loans to the SMEs werebroad based, the bulk of which were channelled tothe broad property sector, wholesale and retailtrade, as well as the utilities and transport sectors.Loans to the agriculture sector also expandedfurther by RM435 million or 3.6%. Overall, loansextended to SMEs as a proportion of total loansoutstanding remained high at 17.7% at end-2001(17.8% at end-2000).
Amongst the many measures implemented topromote SMEs lending were improvement to theloan approval process in banking institutions andpromotion of alternative sources of financingincluding venture capital; establishment of adedicated unit in BNM to monitor loan complaintsand a unit in each banking institution to manageproblem loans; and establishment of theBumiputera Development Unit in BNM whichprovides financial advisory services to Bumiputeraentrepreneurs. The additional measures that wereintroduced in 2001 included measures on specialfunds introduced in April, July and October, toexpand the scope and size of funds; reduce lendingrates, and liberalise the eligibility criteria andconditions of selected special funds (see Box onMonetary Measures in 2001). These measuresgenerated positive results as reflected by theincrease in the number of applications approvedunder the Fund for Food (3F), New EntrepreneurFund (NEF) and Fund for SMI 2 (FSMI 2)by 26.4%, 23.1% and 291.7% respectively(+5.2% and +13.8% for 3F and NEF respectively in2000). Disbursements of these funds were alsohigher, amounting to RM183 million, RM225 millionand RM169 million respectively in 2001 (RM81million, RM132 million and RM43 millionrespectively in 2000).
EXCHANGE RATE DEVELOPMENTS
The Malaysian ringgit exchange rate remainedpegged to the US dollar at the rate ofUS$1=RM3.80 in 2001. Bilateral exchange rateswith other currencies are determined throughcross-rates based on the movements of the USdollar against these currencies in the foreignexchange markets.
The international foreign exchange marketexperienced significant volatility in 2001. TheJapanese yen depreciated sharply against the USdollar earlier in the year following increasedconcerns over growth prospects for the Japanese
69
-2.6
-0.6
1.4
3.4
5.4
7.4
Mar Jun Sept Dec Mar Jun Sept Dec0.0
3.0
6.0
9.0
12.0
15.0
2000 2001
Annual growth (%)Annual growth (%)
Households (RHS)
Total loans outstanding (LHS)
Domestic business enterprises (LHS)
Graph 2.11Loans Extended to Households andBusiness Enterprises

economy. Subsequently, the Japanese yenappreciated against the US dollar from mid-July dueto market concerns over weakness in the USeconomy, which were further exacerbated by theSeptember 11 incident. Towards the end of the year,
the Japanese yen again experienced a weakeningtrend. Similarly, the euro exchange rate alsoexhibited volatility during the year.
The ringgit appreciated against the Japanese yen(14.4%), the euro (5.0%) and pound sterling (2.7%)in tandem with the movements of the US dollar inthe foreign exchange markets. However, given thefixed exchange rate to the US dollar, the Malaysianeconomy was reasonably insulated from theextremes in currency movements. Given that themajority of Malaysia’s external transactions areconducted in US dollars, the ringgit peg continuedto provide stability to the domestic foreign exchangemarket in an environment of volatile internationaland regional foreign exchange markets. The stabilityaccorded reduced the element of uncertainty in thedecision making process of domestic manufacturersand service providers.
On the regional front, the ringgit appreciatedagainst all regional currencies in the range of 2.1%-8.2% in 2001. Movements were influenced
to some extent by market concerns over the impactof the US economic downturn on the region’seconomic growth prospects. The depreciation ofthe Japanese yen also led to depreciation ofregional currencies through technical and
sentiment-driven factors. In addition, domesticpolitical developments exerted downward pressureon the Indonesian rupiah and the Philippine peso.
In terms of its trade-weighted nominal effectiveexchange rate (NEER), the ringgit appreciated by5.5% during the year, in line with the appreciationof the US dollar. The appreciation of the US dollaragainst other currencies in Malaysia’s trade-weighted basket was due mainly to higherexpected returns on US dollar denominated assetsfollowing the better economic growth prospectsfor the US relative to the other G-7 economies.However, since September 1998,the ringgit’s NEER has appreciated by only 3%.Given the relatively small appreciation, the ringgithas essentially maintained a fair valuation. It hasalso been well supported by the strengthenedmacroeconomic fundamentals. The low inflation,low external debt levels, strong externalbalance, higher reserve levels and strongbanking sector have created a favourableenvironment for Malaysia.
70
The ringgit peg continued to provide stability to the domesticforeign exchange market in an environment of volatile internationaland regional foreign exchange markets.
50
60
70
80
90
100
110
D J F M A M J J A S O N D J F M A M J J A S O N D
50
60
70
80
90
100
110
2000
Index (Dec. 1999=100) Index
(End-month)
Note: An increase in the index represents an appreciation of the currency against the ringgit.
Peso
S$
Rupiah
Won
Baht
2001
Graph 2.13Performance of the Malaysian Ringgit againstSelected Regional Currencies
100 Yen
2
3
4
5
6
7
8
2
3
4
5
6
7
8
STG
EuroUS$
Ringgit fixed at US$1=RM3.80
(Weekly average)RM/foreign currency RM/foreign currency
M J S D M J S D M J S D M J S D
1998 1999 2000 2001
Graph 2.12Exchange Rate of the Malaysian Ringgit againstMajor Currencies

Monetary and Fiscal Developments
FISCAL POLICY AND OPERATIONS
The 2001 Budget was formulated at a time whenthe outlook for the global economy, in terms of themagnitude and duration of the slowdown in themajor economies was uncertain. Given the opennessof the Malaysian economy, the slowdown in globalgrowth would affect Malaysia’s growth prospects.In view of the downside risks, the main thrust of the2001 Budget was directed at stimulating domesticdemand, enhancing the nation’s competitivenessand achieving the agenda for a caring society.
Given the uncertainties in global economicprospects, weak private sector activities andprevalence of excess capacity in many sectors,counter-cyclical fiscal policy was crucial to directlystimulate domestic economic activities. Therefore,the Government maintained its expansionary budgetthrough higher allocations for both operating anddevelopment expenditures. Nevertheless, the fiscaldeficit was budgeted at RM16.5 billion or -4.7% ofGDP (October 2000), lower than the fiscal deficit of5.8% of GDP in 2000. At that time, real GDP for2001 was forecast to grow moderately witheconomic recovery in the United States expected in
the second-half of 2001. Under this scenario, alower deficit would be consistent with theGovernment’s commitment to fiscal prudence anddiscipline in its financial management to preservelong-term fiscal sustainability and flexibility.
The focus of the budget allocation was also to ensuremaximum impact on growth and keep leakages abroadto a minimum to preserve the strong balance ofpayments position. Hence, allocations were accorded toprojects and programmes which would stimulatedomestic demand and strengthen Malaysia’s
productivity over the longer term. In terms of strategy,the 2001 Budget adopted a two-pronged approach:stimulate domestic growth through allocation forprojects which had strong domestic linkages and lowimport content; and stimulate domestic demandthrough raising disposable incomes. The latter waseffected through tax and non-tax measures includinghigher individual tax rebates and higher allowances forcivil servants in specific categories. In its expenditureallocation to raise economic activity, the Governmentfocused on projects that not only could be implementedquickly for maximum impact on domestic demand, butwould also meet the longer-term objective of increasing
71
Earlier fiscal discipline, accumulation of assets during favourableperiods and low Government debt have accorded the Governmentthe flexibility to pursue expansionary fiscal policy to supportgrowth. The actual outturn of the fiscal deficit for 2001 was muchlower than estimated due to stronger revenue.
RM to one unit of foreign currency 1
2000
Annual Change (%)
End-Dec.20001997 1998
Table 2.6Movement of the Ringgit
Change (%)
End-June Sept.2 2
Composite 102.47 72.11 70.86 73.34 3.2 3.5 –28.4 1.7
SDR 3.5030 5.1177 4.9511 4.7714 5.2 3.8 –26.6 7.3US$ 2.5235 3.8000 3.8000 3.8000 0.0 0.0 –33.6 0.0S$ 1.7647 2.1998 2.1946 2.0529 3.9 6.9 –14.0 7.2100 Yen 2.2088 2.7742 3.3121 2.8955 12.1 14.4 –23.7 –4.2Pound Sterling 4.1989 6.3708 5.6662 5.5161 8.3 2.7 –23.9 15.5Deutsche Mark 1.4522 2.1743 1.8064 1.7211 8.5 5.0 –15.6 26.3Swiss franc 1.7368 2.6450 2.3234 2.2757 2.6 2.1 –23.7 16.2Euro 3 3.5331 3.3662 8.5 5.0100 Thai baht 9.7470 9.3713 8.7790 8.6022 15.3 2.1 13.3 8.9100 Indonesian rupiah 0.1038 0.0354 0.0395 0.0365 37.2 8.2 184.4 –3.0100 Korean won 0.2842 0.2827 0.3022 0.2883 11.0 4.8 -1.4 –1.9100 Philippine peso 9.5878 8.8302 7.6053 7.3644 24.7 3.3 30.2 19.9
1 US$ rates are the average of buying and selling rates at noon in the Kuala Lumpur Interbank Foreign Exchange Market. Rates for foreign currenciesother than US$ are cross rates derived from rates of these currencies against the US$ and the RM/US$.
2 Ringgit was fixed to US$1 = RM3.8000 on 2 September 1998.3 The Euro began to be traded on 4 January 1999 (EUR 1= RM4.5050).
End-June ‘97-Dec. 2001
2 Sept. ’98-Dec. 200120012001
– – – –

productivity. Hence, a significant share of budgetallocation was allocated for projects related toeducation, infrastructure and industrial development.
To complement this strategy, incentives wereintroduced to further strengthen the foundation forlong-term sustainable growth. Towards this end,wide ranging fiscal incentives were provided todevelop new sources of growth, strengthen thenation’s competitiveness and resilience throughdevelopment of skilled manpower, technologicalcompetence and establishing strategic partnershipswith international and global players in the servicessector. Measures were also undertaken to enhancethe ability of the financial markets to be moredynamic, innovative and efficient in supportinggrowth, particularly as the economy transforms intoa knowledge-based economy.
In the early part of 2001, there were increasing signsthat the slowdown in the United States economy wasbecoming more severe with diminishing prospects ofan early recovery. The economic outlook for Malaysiain 2001 was revised downwards to 1-2% from 7%announced in October 2000. The impact on theexternal sector was expected to be more severe dueto a stronger deceleration in global growth. Under amore uncertain outlook, the Governmentimplemented several pre-emptive measures to sustainthe growth momentum. On 27 March 2001, theGovernment announced a package of stimulativemeasures to strengthen domestic demand. Thesemeasures included an additional fiscal stimulus ofRM3 billion, reduction in employees’ share ofcontribution to the EPF by two percentage points forone year and the removal of tax on credit cards.Projects identified under this package were those withhigh spill-over effects, low import content and shortgestation period. A higher allocation was given tosocial services, notably for education and training aswell as for low-cost housing. At the same time, theGovernment also undertook several other measuresto encourage private investment. These includedmeasures to reduce the property overhang andadditional financing for the small- and medium-sizedindustries through expanding the size and scope aswell as lowering the lending rates of special funds.
Subsequently, when there were increased risks biasedtowards weaker domestic demand following theSeptember 11 incident, a further fiscal stimuluspackage of RM4.3 billion was announced on 25September ahead of the 2002 Budget. Apart fromcontaining and minimising the adverse spill-over
effects from the deterioration in global demand, thefiscal stimulus also aimed at cushioning the negativeimpact on the poor and the less fortunate, increasingincome opportunities for small enterprises andassisting retail businesses. The new fiscal stimuluspackage was mainly allocated for small projects forwhich funds could be disbursed immediately. Theprojects identified were small development projectsin rural and selected urban areas, upgrading ofGovernment buildings and facilities, training ofretrenched workers and unemployed graduates andtourism promotion. The early announcement of thisfiscal stimulus before the 2002 Budget was aimedat providing enough lead time for higher expenditureto impact economic activities during the remainingmonths of 2001.
Following the two fiscal stimulus packages, the fiscaldeficit was expected to be higher than the deficit of5.8% recorded in 2000. Efforts were made to containthe estimated budget deficit at about 6.5% of GDPor RM22.4 billion. This level was deemed prudent andwithin limits that would not create longer-term risks.The actual outturn of the fiscal deficit was however,much lower. Efficiency in tax collection amidstsustained economic activities resulted in the actual taxrevenue collection being much higher than projected.Expenditure was on target with the shortfallcontained at less than 5% of total allocation.Following the stronger revenue, lower fiscal deficit ofRM18.4 billion or -5.5% of GDP was achievedcompared to earlier estimates of -6.5% of GDP.
In implementing the fiscal stimulus programmes, itbecame necessary to undertake measures to overcomethe slow disbursement of funds, especially in the earlymonths of 2001. Existing procedures were adjusted inorder to enhance the efficiency of projectimplementation, speed up payments to contractors andremove bureaucratic delays. Besides the review ofprocedures, rules and guidelines on the implementationof development projects and procurements as well aspayment to contractors, the implementation of projectswas also more closely monitored.
Previous fiscal prudence and accumulation of assetsduring favourable periods ensured that the Governmenthad substantial resources to finance expansionary fiscalpolicies. Although the budget deficits were recorded asa result of counter-cyclical measures taken since 1998,these deficits had not led to macroeconomicimbalances. On the contrary, the fiscal stimulusprogrammes had contributed positively in promotingdomestic sources of growth, thereby ensuring economic
72

Monetary and Fiscal Developments
stability and building resilience against adverse externaldevelopments. At the same time, the Governmentmaintained prudent practices and refrained fromunsustainable expansion in fiscal policy. In this respect,the Government targeted for at least a balancedposition in the current account of the Governmentbudget. This was achieved by ensuring that operatingexpenditure would not exceed revenue estimates.
The counter-cyclical demand impulse was effectiveand succeeded in sustaining domestic demand tocompensate for the rapid decline in export demand.The positive response of consumer spending to theGovernment measures sustained total consumptionspending, which accounted for 59% of GDP. As aresult, domestic demand was the main engine ofgrowth in 2001. The contribution of governmentexpenditure to domestic output was higher at 31%in 2001 compared with 27% in 2000. Thisexpenditure supported investment activities so thatthe decline in capital formation was contained. Publicsector expenditure, as a whole contributed 3.8percentage points to real GDP growth in 2001. At thesame time, public sector expenditure did not erodethe gains made in strengthening the balance ofpayments position. In addition, the benefits of thestimulus programmes would also enhance long-termgrowth prospects for the Malaysian economy.
While fiscal expansion contributed to GDP growth, itdid not exert pressure on domestic consumer prices andinterest rates. High savings rate and excess liquiditymade it possible for the bulk of the fiscal deficit to befinanced through non-inflationary domestic sources inthe form of Malaysian Government Securities (MGS).The large issuance of MGS was subscribed mainly byprovident, pension and insurance funds. Apart frommeeting financing requirements, the domesticborrowing programme was also aimed at providing abenchmark yield curve to facilitate the development ofthe domestic ringgit bond market. An auction calendaron the issue of government securities also continued tobe announced to enhance transparency and assistinvestors in the formulation of their investmentstrategies. As there was sufficient liquidity in thebanking system to meet the private sector financingneeds, the Government requirements did not result inany crowding out effects. In essence, this favourablesituation resulted in new issues of MGS being raised atlower coupon rates in line with declining interest ratesduring the course of 2001.
In 2001, taking advantage of the favourable marketconditions and improved overall yields, the
Government also tapped external borrowings throughthe international capital and debt markets. During theyear, two new market loans were raised to maintainregular market presence and to provide a benchmarkfor Malaysian corporations. Meanwhile, no new loanswere raised from the bilateral and multilateralsources. The Government continued to draw downfrom loans committed earlier from both bilateralsources, especially under the New Miyazawa Initiativeas well as from multilateral sources.
The higher borrowing raised the Federal Governmentdebt to RM145.7 billion or 43.8% of GDP as atend-2001. At this level, the debt remained low andsustainable. Interest cost accounted for only 15% ofoperating expenditure in 2001. More importantly,83% of the total government debt was domesticdebt and denominated in ringgit. Hence, thedomestic debt will not have exposure to exchangerate risks. As part of a prudent debt policy, theGovernment will continue to ensure prudence in itsrecourse to external borrowing to maintain its lowexternal debt level.
Consolidated Public SectorIn 2001, the financial position of the consolidatedpublic sector continued to record a large surplus in thecurrent account. This was due to better revenue
73
2001e 2002f2000
Table 2.7Consolidated Public Sector Finance
RM million
General government1
Revenue 76,002 92,937 87,692Operating expenditure 64,445 72,295 74,437
Current surplus of general government 11,556 20,642 13,255
Current surplus of NFPEs 2 41,204 31,303 33,493
Public sector current surplus 52,760 51,945 46,748
% of GDP 15.5 15.6 13.3
Net development expenditure 50,438 68,161 57,766General government 27,078 33,934 30,028NFPEs 23,360 34,227 27,737
Overall balance 2,322 –16,215 –11,018% of GDP 0.7 –4.9 –3.1
1 Comprises Federal Government, state governments, statutory bodiesand local governments.
2 Refers to 37 NFPEs.e Estimatef Forecast
Source: Ministry of Finance, state governments and non-financial public enterprises

performance of the general government. Nevertheless,the significantly higher development expenditure ofboth the Federal Government and the non-financialpublic enterprises (NFPEs) to stimulate economicactivities, led to an overall deficit of 4.9% of GDP.
Federal Government FinanceThe continued weakness in the external environmentand its adverse impact on the domestic economyprompted the Government to pursue a moreaggressive fiscal stimulus programme.Notwithstanding the additional allocations arisinglargely from the implementation of two fiscal stimuluspackages, the Federal Government recorded a lowerfiscal deficit of RM18.4 billion or -5.5% of GDP in2001. This was significantly lower than the earlierestimated deficit of RM22.4 billion or -6.5% of GDPdue mainly to higher revenue.
In 2001, Federal Government revenue registered asignificant increase of 28.6% or RM17.7 billion toRM79.6 billion or 23.9% of GDP. The better-than-expected revenue collection was attributable largelyto improved procedures for income tax collection aswell as higher dividend payments from publicenterprises. In aggregate, the increase in revenueemanated from all three broad categories ofrevenue, especially direct taxes.
The higher tax collection was attributed to thecontinued increase in economic activities, collectionof delayed payments for taxes for the assessmentyear 2000 as well as high oil prices in the previousyear. It also reflected the success of the widening ofthe tax base and concerted efforts to strengthenefficiency in tax collection. In particular, taxcompliance was enhanced further through creatingpublic awareness in paying taxes and duties as wellas ensuring stricter enforcement to reduce taxevasion. Consequently, the ratio of tax receipts to
GDP increased to 18.5% from 13.8% in 2000. Thiswas close to the pre-crisis level in 1997.
Of significance, collection from income tax increasedsharply, thus increasing its share to one-half of totalrevenue (44% a year ago). This development
74
Table 2.8Federal Government Finance
2002Budget
RM million
Revenue 61,864 79,567Operating expenditure 56,547 63,757 65,342
Current account 5,317 15,810 7,825% of GDP 1.6 4.8 2.1
Net development expenditure 25,032 34,232 26,689Gross development expenditure 27,941 35,235 28,382
Less Loan recoveries 2,909 1,003 1,700
Overall balance –19,715 –18,422 –18,857% of GDP –5.8 –5.5 –5.1
Sources of financing
Net domestic borrowing 12,714 13,381 –Gross borrowing 23,182 23,500 –Less Repayment 10,468 10,119 –
Net foreign borrowing 864 6,295 –Gross borrowing 4,767 7,030 –Less Repayment 3,903 735 –
Special receipts 13 6 –
Realisable assets1
and adjustments 6,123 –1,259 –
Total 19,715 18,422 –
1 Includes changes in Government’s Trust Fund balances. An increase in theaccumulated realisable assets is indicated by a negative (–) sign.
2 Includes a net revenue loss of RM234 million arising from the tax changesfor 2002.
p PreliminarySource: Ministry of Finance
2001p2000
10
20
30
40
50
60
70
80
90
RM billion Debt% of GDP
Overall balance% of GDP
Revenue
Domestic debt
External debt
Debt level remainedmanageable
Overall balance
-5.5% ofGDP
Current surplus
Operating expenditure
1992 1993 1994 1995 1996 1997 1998 1999 2000 2001p -190
-150
-110
-70
-30
10
50
90
130
1992 1993 1994 1995 1996 1997 1998 1999 2000 2001p
-12-10-8-6-4-202468
Gross development expenditure
Graph 2.14Federal Government Finance Federal Government Debt

Monetary and Fiscal Developments
reflected the significantly higher petroleum oil pricesin 2000 (tax base year for 2001) as well as betterperformance of the corporate sector, with fewerlosses being carried forward from previous year tooffset current year profits. In addition, a portion ofcorporate tax payable in 2000 was collected in 2001as instalment payment was allowed during thetransition period, following the introduction of thecurrent year assessment system in 2000. Collectionfrom individual income tax was also significantlyhigher, notwithstanding the provision of higherrebates announced in the 2001 Budget toindividuals to encourage consumption. The rebatefor individuals was increased from RM110 to RM350and from RM60 to RM350 for wives.
The strong sales of motor vehicles led to higherreceipts of excise duties and sales tax. Sales taxcollection was also boosted by the increase in salestax rates on cigarettes and tobacco products andalcoholic beverages. Receipts of service tax were alsohigher due largely to higher collection fromprofessional services and widened coverage ofservice tax to all telecommunication services (exceptthe internet), golfing and golf driving rangefacilities, public houses selling liquor and forwardingagents. Nevertheless, the increase in service taxrevenue was moderated to some extent by theabolishment of the RM50 service tax on each creditcard, implemented as part of the fiscal stimulusmeasures to encourage consumption.
Other major components of indirect taxes, however,recorded declines in collection. Lower receipts of importduties were seen in all categories of goods especially
motor vehicles, tobacco and cigarettes as well asmachinery and spare parts. The decline of the latterreflected the tax exemptions on selected machines andspare parts provided in the 2001 Budget to enhance theefficiency and competitiveness of the economy. Receiptsof export duties were also lower, attributable to both thedecline in export volume and oil prices during the year.
75
Non-tax revenue and receipts22.7%
Others2.5%
Companies26.1%
Petroleum12.4%
Individuals11.9%
Others2.5%
Service tax2.4%
Sales tax9.2%
Excise duties5.2%
Import duties4.0%
Export duties1.1%
Indirect taxes24.4%
Directtaxes52.9%
Total Revenue: RM79.6 billion
Graph 2.15Composition of Federal Government Revenue, 2001 (% share)
Table 2.9Federal Government Revenue
2000 2001p 2000 2001p
RM million
Tax revenue 47,173 61,492 4.0 30.4% of GDP 13.8 18.5
Direct taxes 29,156 42,097 7.0 44.4Income taxes 27,016 40,135 7.4 48.6
Companies 13,905 20,770 -11.7 49.4Petroleum 6,010 9,858 110.4 64.0Individuals 7,015 9,436 9.3 34.5Co-operatives 87 70 -39.0 -19.2
Real property gains tax 247 227 -13.9 -8.3Stamp duties 1,799 1,650 14.9 -8.3Others 94 85 -59.8 -9.4
Indirect taxes 18,017 19,395 -0.5 7.6Export duties 1,032 867 53.9 -16.0Import duties 3,599 3,193 -23.8 -11.3Excise duties 3,803 4,130 -19.5 8.6Sales tax 5,968 7,356 33.0 23.3Service tax 1,701 1,927 16.6 13.3Others 1,914 1,922 -6.2 0.4
Non-tax revenue and receipts 14,691 18,075 10.2 23.0
Total revenue 61,864 79,567 5.4 28.6% of GDP 18.2 23.9
p Preliminary
Source: Ministry of Finance
Annual Change (%)

Overall, tax revenue increased by 30%, leading to aslight increase of its share to 77% of the totalrevenue. Accordingly, the share of non-tax revenueaccounted for 23% with higher receipts frompayments of dividend especially from PETRONAS andpetroleum royalties.
Total Federal Government expenditure increased by17.2% to RM99 billion in 2001 due to a strongerexpansionary budgetary operation. The additionalstimulus packages were effected during the year inMarch (RM3 billion) and in September (RM4.3billion). Apart from higher expenditure, theGovernment stepped up efforts to improve policyimplementation, particularly to eliminate bureaucraticdelays and accelerate disbursements. TheGovernment also reviewed the procedures, rules andguidelines on the implementation of development
projects and payments to contractors (see Box fordetails). The objective was to ensure that the fiscalstimulus had the intended impact on the economy aswell as to improve the delivery of public goods andservices. As a result of these measures, theGovernment’s gross expenditure shortfall in 2001was small, at less than 5%.
In tandem with available resources, operatingexpenditure was raised by 12.8%, mainly tostimulate public and private sector consumption toincrease domestic demand. During the year, the totalwage bill, the largest component of operatingexpenditure (27%), increased by 6.6%. The increasein wage bill reflected the increased allowances,particularly for the police and armed forces personnelas well as nurses, doctors and headmasters. Thepayment for pensions and gratuities was also higher
76
Measures Undertaken by the Government to Improve Project Implementation
To eliminate bureaucratic delays:• A task force was established in the Ministry of Finance to monitor the progress as well as identify and
address implementation problems to ensure that all measures under the fiscal stimulus programmes are implemented efficiently.
• Established a “Flying Squad” to ensure that the implementation of public and privatised projects proceed as scheduled.
• To ensure that development projects are implemented as scheduled, all implementing agencies are required to submit monthly progress reports to the highest authority.
• For ministries that do not fully utilise their allocations, such allocations would be withdrawn and reallocated to other ministries.
To expedite the implementation of projects:• Ministries and agencies have been empowered with greater delegated authority in approving
tenders.
• To reduce processes, the Government appointed project management consultants (PMCs) to supervise public sector projects and awarded projects based on turnkey and design-and-build basis.
• To facilitate early project start-ups, all contractors implementing government projects were given advance payments of 15%, while for those implementing small projects under the pre-emptive package, advance payments of up to 75% were allowed.
To speed up payments: • Specific procedures were put in place to expedite payments. In particular, projects undertaken
through PMCs were allowed to submit claims for payment directly to the Accountant General’s office.

Table 2.11Federal Government Development Expenditure by Sector
2000 2001p 2000 2001p
RM million % share
Defence and security 2,332 3,287 8.3 9.3
Economic services 11,639 12,724 41.7 36.1Agriculture and
rural development 1,183 1,394 4.2 4.0Trade and industry 3,667 4,829 13.1 13.7Transport 4,863 5,042 17.4 14.3Public utilities 1,517 1,092 5.4 3.1Others 409 367 1.5 1.0
Social services 11,076 15,385 39.6 43.7Education 7,099 10,363 25.4 29.4Health 1,272 1,570 4.6 4.5Housing 1,194 1,269 4.3 3.6Others 1,511 2,182 5.4 6.2
General administration 2,894 3,839 10.4 10.9
Total 27,941 35,235 100.0 100.0% of GDP 8.2 10.6
p Preliminary
Source: Ministry of Finance
Monetary and Fiscal Developments
reflecting the higher annual contribution to thePensions Trust Fund (RM929 million in 2001; RM637million in 2000) as well as the special payments ofRM200 each to pensioners.
Disbursement on supplies and services wassignificantly higher, mainly for the procurement ofoffice supplies related to e-government flagshipapplications, repairs and maintenance as well aspayments for professional services associated with theGovernment’s initiative to upgrade the quality andefficiency of public services. Domestic debt servicingwas higher, reflecting the increased debt level tofinance the fiscal stimulus programme. Meanwhile,lower global interest rates contained the servicing ofexternal debt. The share of debt servicing was slightlysmaller at 15% of operating expenditure. Expenditurefor subsidies was also lower. This reflected thereduced quantum of subsidy payments following tworecent price increases for petroleum products andlower oil prices.
Implementation of stronger fiscal impulse during theyear led to the sharply higher developmentexpenditure (26.1%). Significantly higherexpenditure was spent on the social services sector,notably for education and training. The social servicessector continued to account for the largestcomponent of the total development spending(44%), reflecting the Government’s concerted effortto promote skills development in order to develop aknowledge-based economy. The expenditure wasmainly for upgrading of educational facilities,curriculum development, construction of single
session schools and building of new communitycolleges and universities. Priority was also placed onthe construction of computer laboratories to narrowthe digital divide between the urban and rural areas.
Outlays on health were also higher to ensure betterhealth care and support the increasing demand forpublic health services. This included the constructionand upgrading of hospitals and health clinics.Similarly, the large expenditure on housing was mainlyfor low-cost public housing projects for the poor aswell as housing programmes for the armed forces,police personnel, and teachers in rural areas.
In the economic services sector, emphasis continued tobe placed on infrastructure, industrial as well asagriculture and rural development. Expenditure ontransport absorbed a sizeable share of thedevelopment expenditure reflecting the Government’sefforts to increase activities as well as to provide amore efficient and integrated national transportationnetwork. The bulk of the expenditure was for theconstruction and upgrading of roads (includinghighways) as well as the development of the railsystem, including the dual track from Rawang to Ipoh.
Under the trade and industry sub-sector, the bulk ofexpenditure was for the development of small- andmedium-scale industries, industrial research anddevelopment, promotion of tourism and Bumiputera
77
Table 2.10Federal Government Operating Expenditure by Object
2000 2001p 2000 2001p
RM million % share
Emoluments 16,357 17,443 28.9 27.4Supplies and services 7,360 10,704 13.0 16.8Asset acquisition 572 1,339 1.0 2.1Debt service charges 9,055 9,634 16.0 15.1Pensions and gratuities 4,187 4,711 7.4 7.4Subsidies 4,824 4,450 8.5 7.0Other grants and transfers1 11,757 13,626 20.8 21.5Other expenditure2 2,435 1,851 4.3 2.9
Total 56,547 63,757 100.0 100.0% of GDP 16.6 19.2
1 Includes grants and transfers to state governments as well as public agencies and enterprises.
2 Includes grants to international organisations, insurance claims & gratuities and others.
p Preliminary
Source: Ministry of Finance

Commercial and Business Community. Additionalexpenditure was also incurred in the Government’sacquisition of the national airline as part of thecorporate restructuring exercise. During the year, theGovernment also intensified its efforts to increase theincome of the poor and enhance rural accessibility topublic utilities and amenities. Thus, expenditure foragriculture and rural development (including landdevelopment and drainage) as well as investment toimprove rural roads, water supply and electrificationprogrammes was higher.
Given the increasing sophistication and challengesfaced in combating crimes and ensuring nationalsecurity, outlays on defence and internal securitywere higher during the year. Expenditure forgeneral administration was also higher, largely forthe construction and maintenance of the newadministrative centre at Putrajaya; and theestablishment of the ICT infrastructure to supporte-government application and computerisation toenhance the efficiency and effectiveness of theGovernment administrative machinery.
The availability of adequate domestic resources tofund the Federal Government financingrequirements facilitated fiscal expansion. The bulkof the development expenditure was financeddomestically. The issuance of government securitieswas effected without crowding out private sector’saccess to financing. In addition, the large issuancecontinued to facilitate the development of the bondmarket through regular benchmark issues.Moreover, with the prevailing low domestic interestrate environment, raising funds domesticallyrepresented a lower source of financing, and as aresult, no unnecessary burden was placed on futureGovernment expenditure. The Government alsotapped the international market for continuedmarket presence and established a benchmark for
the corporate sector. Recourse to externalborrowings, nevertheless, would be prudent inorder to maintain the low external debt position.
Overall, the Federal Government recorded a largertotal net borrowing of RM19.7 billion in 2001. Thisled the Federal Government outstanding debt toexpand by 16% to RM145.7 billion or 43.8% of GDPas at end-2001. This level of debt remainedmanageable with low debt service charges (15% ofthe total operating expenditure) and low externaldebt service ratio (0.5%). While the domestic debtaccounted for 83% of total debt, the external debt ofthe Federal Government accounted for 14% of thenation’s external debt.
Net domestic borrowing totalled RM13.4 billion in2001. The domestic borrowing was financed largelyfrom non-inflationary domestic sources. During theyear, the Federal Government floated four issues ofMalaysian Government Securities (MGS) totallingRM21.5 billion mainly by way of open tenderthrough the principal dealers. The Governmentreopened three existing MGS issues to increase theirrespective issue size and enhance liquidity in thesecondary market to further develop the bondmarket. Meanwhile, on a net basis, there were nonew funds raised through Government InvestmentIssues (GII) and Treasury bills (TB). The TreasuryHousing Loans Fund, however, recorded a higher netborrowing of RM1 billion to meet the increasedfunding requirements following the relaxation ofhousing loan eligibility in the Budget 2001. Theeligibility for housing loans was increased from
78
Table 2.12Federal Government Outstanding Debt
Annual change At end
2000 2001p 2001p
Nominal value in RM million
Domestic debt 13,055 14,592 121,396Treasury bills 0 0 4,320Government Investment Issues 2,000 0 4,000Malaysian Government Securities 10,714 14,400 103,450Treasury Housing Loans Fund 341 1,259 5,555Market loans 0 -1,067 4,071
External debt 451 5,508 24,328Market loans 965 5,642 17,682Project loans -514 -134 6,646
Total 13,506 20,100 145,724% of GDP 43.8
p Preliminary
Source: Ministry of Finance
GII2.7%
TB3.0%
Housing loan3.8%
Syndicated loan2.8%
MGS71.0%
Domestic debt
External debt accountedfor only 16.7% of the totalFederal Government debt
Graph 2.16Federal Government Outstanding Debtas at end–2001p

Monetary and Fiscal Developments
between RM35,000 and RM200,000 to betweenRM40,000 and RM300,000.
Following the large net borrowings of MGS, theoutstanding debt of the MGS rose to RM103.5 billionas at end-2001. It accounted for 85% of the totaldomestic debt outstanding. In terms of the ownershipstructure of MGS, the largest holders were mainly theprovident, pension and insurance funds. The bankingsector raised its holding in 2001.
Gross external borrowings amounted to RM7 billion,reflecting largely the raising of two new loans duringthe year. Taking advantage of the favourable marketconditions and improved overall yields, in July 2001,the Federal Government raised a US$1 billion(RM3.8 billion) global bond due 2011 at a couponrate of 7.5%. The bond raised was three timesover-subscribed and was priced at 228 basis pointsabove the 10-year US Treasuries which reflectedforeign investors’ confidence in Malaysia’s strongfundamentals and its low external debt position.A syndicated loan was also raised in Decemberamounting to US$540 million (RM2.1 billion).The 7-year loan was raised at an attractive interestrate of US$ LIBOR plus 56 basis points, reflecting thehigh creditworthiness of the Government andconfidence in the Malaysian economy. The
Government also drew down on loans from bothbilateral sources, especially under the New MiyazawaInitiative, and multilateral sources (World Bank, IslamicDevelopment Bank and Asian Development Bank).
State GovernmentsBased on preliminary estimates, all 13 stategovernments registered surpluses in their currentaccounts. The consolidated state governmentsfinancial position, however, recorded a smallercurrent account surplus due to lower revenuereceipts from state sources amidst higher operatingexpenditure. As development expenditure was alsohigher, the consolidated financial position of thestate governments recorded a small overall deficit of0.7% of GDP in 2001. The overall deficit wasfinanced largely by Federal Government loans anddrawdown of accumulated financial assets of thestate governments.
During the year, the lower commodity prices includingcrude petroleum, crude palm oil and saw log had anadverse impact on the states’ own sources ofrevenue. Meanwhile, receipts from Federal sourceswere sustained to assist the states in providing
79
Table 2.13Holdings of Federal Government Domestic Debt
2000 2001p 2000 2001p
Treasury bills 4,320 4,320 100.0 100.0Insurance companies 76 160 1.8 3.7Banking sector 4,166 4,014 96.4 92.9Other 78 146 1.8 3.4
Government Investment Issues 4,000 4,000 100.0 100.0Insurance companies 194 195 4.8 5.0Banking sector 3,805 3,805 95.1 95.1Others 1 0 ... 0
Malaysian Government Securities 89,050 103,450 100.0 100.0Social security and insurance institutions 71,232 79,154 80.0 76.5of which:
Employees Provident Fund 61,476 67,468 69.0 65.2
Insurance companies 6,652 8,566 7.5 8.3
Banking sector 12,458 18,594 14.0 18.0Other 5,360 5,702 6.0 5.5
p Preliminary
Nominal value inRM million
Table 2.14Consolidated State Government Finance
2002Budget
RM million
Revenue 10,314 9,226 9,566State sources 8,118 7,127 7,470Federal grants and transfers 2,196 2,099 2,096
Expenditure 5,254 5,874 5,905
Current surplus 5,059 3,351 3,661% of GDP 1.5 1.0 1.0
Net Development expenditure 5,082 5,673 5,565
Gross development expenditure 5,348 5,878 5,757
Less: Loan recoveries 266 205 192
Overall balance –23 –2,322 –1,904% of GDP 0.0 -0.7 -0.5
Sources of financing
Federal loans 452 592 501Realisable assets1 -430 1,730 1,403
Total 23 2,322 1,904
1 A positive (+) sign indicated a draw down in the accumulated realisable assets. e Estimate
Source: State governments
2001e2000
% share

infrastructure and essential amenities to improve thequality of life and to support the increasingurbanisation in the states. The increased operatingexpenditure of the state governments reflected largelyhigher emoluments. A major share of the increaseddevelopment expenditure was directed to agricultureand rural sector, public utilities, as well as expansionand upgrading of infrastructure.
Non-Financial Public Enterprises (NFPEs)Preliminary estimates of the consolidated financialposition of the 37 non-financial public enterprises(NFPEs) indicated that the overall financial position ofthe NFPEs as a group recorded a small surplus ofRM1.6 billion or 0.5% of GDP in 2001. The smallsurplus was due to both lower revenue receipts andhigher expenditure. The higher development spendingof NFPEs was mainly used for quality improvement,capacity expansion and productivity enhancement toensure efficiency and adequate supply of goods andservices.
The consolidated revenue of NFPEs declined by 6.7%to RM107.7 billion. The lower oil prices during theyear contributed to the decline in revenue collection.Excluding receipts from oil and gas-related sector,NFPEs revenue recorded a positive growth of 6.5%.This growth was largely attributable to the higherdemand for telecommunications and energy servicesas well as synergy derived from diversification intonew business areas. To a lesser extent, extraordinarygains from sales of assets also contributed to theincrease in revenue. Meanwhile, the increase inoperating expenditure (0.2%) was marginal reflectinglargely the efforts to reduce cost as part of prudentfinancial management. Several public enterprises alsoimplemented organisational restructuring of theirbusiness operations through wholly owned
subsidiaries of the core business. The objectives wereto increase operational efficiency, transparency,accountability and performance to strengthenbusiness earnings.
Development expenditure was significantly higher atRM34.2 billion (+46.5%), accounting for slightly morethan one-half of total public sector developmentexpenditure. All major public enterprises registeredincreases in development spending. The higher capitalspending was for capacity expansion andmodernisation programmes. The NFPEs also investedabroad to strengthen their business earnings. In 2001,Petroleum Nasional Bhd. (PETRONAS) continued itsdomestic and international investments in bothupstream and downstream activities. Major projectsincluded the construction of the Malaysia LiquefiedNatural Gas Tiga (MLNG 3) and the integratedpetrochemical complexes in Kertih and Gebeng. Theyalso included LNG tanker fleet expansion by theMalaysia International Shipping Corporation toaccommodate the increase in future exports of LNG.Meanwhile, international projects undertaken byPETRONAS included the exploration and productionprojects in Indonesia, Vietnam, Niger, Cameroon,Chad, Egypt, Sudan, Turkmenistan and Iran.
A large portion of the capital expenditure of TenagaNasional Bhd. (TNB) was channelled towards theexpansion and upgrading of power generation,transmission and distribution networks to ensureadequate, reliable supply of electricity. Major projectsincluded the redevelopment of the Tuanku JaafarPower Station (Phase I and II), Janamanjung coal-firedpower plant, Kenyir Hydroelectric project (Phase II),Pasir Gudang Fast Track Plant-up project and theGelugor combined cycle conversion project. In thecase of Telekom Malaysia Bhd. (TMB), expenditurewas largely channelled towards capacity building incommunications technology. TMB focused onupgrading and expanding the fixed line and mobilenetwork operations, internet service and multimediaactivities. The capital outlays by Putrajaya HoldingsSdn. Bhd. were mainly for the new administrativecentre in Putrajaya.
The capital outlays of the NFPEs were mainly financedby internally generated funds and domesticborrowings. In 2001, a total of RM7.4 billion wasraised from the private debt securities market mainlyby enterprises involved in the power, construction andmanufacturing sectors. Net external borrowings bypublic enterprises amounted to RM0.9 billion in 2001.Public enterprises were active in debt management
80
Table 2.15Consolidated NFPEs Finance1
1999 2000 2001e
RM million
Revenue 100,331 115,419 107,689Expenditure 61,596 71,725 71,898
Current account 38,735 43,694 35,790% of GDP 12.9 12.8 10.8
Development expenditure 25,458 23,360 34,227
Overall balance 13,276 20,334 1,563% of GDP 4.4 6.0 0.5
1 Refers to 37 NFPEse Estimate
Source: Ministry of Finance and non-financial public enterprises

Monetary and Fiscal Developments
with repayments of higher cost external loans beingmade to reduce the debt-servicing burden.
Consequently, total outstanding external debt of thepublic enterprises remained manageable at RM66.5billion or 20% of GDP to account for 39% of thenation’s external debt. Debt servicing remained lowwith debt service ratio (ratio of debt servicing toexports of goods and services) at 2.9%. Most of theloans were utilised to fund productive investment,including overseas investments of a strategic naturethat would strengthen the future income stream ofthe NFPEs. Investment activities and borrowings of the
NFPEs were closely monitored to ensure they wouldnot create risks to the overall economy.
In 2001, the Government continued to pursue itsprivatisation policy, while strengthening further theregulatory framework for provision of services to thegeneral public. During the year, 11 new privatisedprojects were approved, mainly in infrastructure andland development. The privatisation was mostly in theform of build-operate-transfer, leasing of assets, landswap and management contracts. The projectsincluded the construction of hostels in UniversitiMalaysia Sabah and Universiti Kebangsaan Malaysia.
81

Outlook and Policy
84-91 World Economic Outlook91-97 Malaysian Economy in 2002
97-100 Management of the Economy in 2002100-102 Monetary Policy in 2002102-104 Fiscal Policy in 2002

WORLD ECONOMIC OUTLOOK
Developments in 2001 and Early 2002The global economic slowdown that began in late 2000became more severe than anticipated in 2001. Theevents following September 11 created furtherdownside risk to an early recovery. In the second half(2H) of 2001, overall growth in the major economicblocs declined by 0.5% from a modest growth in thefirst half of the year (1.5%). Falling confidence amidstdisruption in activity after September 11, especially inthe United States (US), had adversely affected worldgrowth, which was also reflected in declining globaltrade. World growth halved to 2.4% in 2001, whileworld trade growth decelerated from a double-digitgrowth to only 1% in 2001. Growth in the majorindustrial countries as a group weakened to 1.1%.
In early 2001, it was envisaged that only countries withstrong trade and investment links with the US, namely
Canada, Asia Pacific and Latin America would beaffected, while Europe would be fairly insulated. As theyear progressed, developments in the US, through moreintegrated capital markets, resulted in adverse effectsbecoming more pervasive in all regions.
The weakness in the euro area was not caused onlyby lower external demand, but also the unexpectedlyhigher inflation arising from the lagged effects ofhigher oil prices which constrained policy flexibility. Inthe regional economies, besides the severity of the USslowdown, the deeper and prolonged downturn inthe electronics sector had caused growth to slowdown more significantly than earlier expectations.Growth in East Asia slowed down to 3.7% in 2001.In several countries (Taiwan and Singapore), growthturned negative. To a large extent, the slowdown inall regional economies was contained by strongerfiscal stimulus and easier monetary conditions. Onlythe People’s Republic of China continued to expandat a strong pace of 7.3%, sustained by fiscalspending and strong private investment, mainly in theform of foreign direct investment.
Prompt policy response across the globe during thecourse of 2001 and immediately after September 11contained the economic slowdown. In particular,co-ordinated monetary easing and additional fiscalmeasures by the major industrial countries aidedconfidence and were effective in sustainingconsumer spending.
Concomitant with the weaker global economy, labourmarket conditions deteriorated in many countries ascompanies reduced their labour force as part of theircorporate consolidation process. However, in Europe,the average unemployment rate declined during theyear despite announcements of large layoffs bymanufacturing companies. The improvement was dueto easing of labour market rigidities in the euro areawith the introduction of more flexible workingconditions and the continued strength in the servicessector in the United Kingdom (UK). Meanwhile,inflationary pressures were contained during the yearagainst a backdrop of a sharp fall in energy prices,weakening global demand and abating wage pressures.
In 2001, the US economy slowed down rapidly asthe corporate sector adjusted to the weaker demand.
84
Outlook and Policy
Table 3.1World Economy: Key Economic Indicators
World growth 4.7 2.4 2.6 - - -World trade 12.4 1.0 2.0~2.5 - - -
Major industrial countries 3.5 1.1 1.1 2.3 2.1 1.2
United States 4.1 1.2 1.4 3.4 2.8 1.6Japan 2.2 -0.5 -0.5 -0.8 -0.7 -1.0Euro area 3.4 1.6 1.3 2.3 2.6 1.8United Kingdom1 3.0 2.4 2.0 2.1 2.1 2.4
East Asia 7.6 3.7 4.6~4.8 1.1 2.4 2.2~2.3
Asian NIEs 8.3 0.6 2.7~2.9 0.8 1.1 0.8~0.9Korea 8.8 3.0f 3.9 2.3 4.3 3.0Taiwan 5.9 -1.9 2.3 1.3 0.0 0.7Singapore 10.3 -2.0 1.0~3.0 1.3 1.0 -1.0~0.0Hong Kong SAR2 10.5 0.1 1.0 -3.8 -1.6 0.0
People’s Republic of China 8.0 7.3 7.0 0.4 0.8 1.0
ASEAN3 6.4 1.5 2.8~3.6 2.9 5.9 5.0~5.5Malaysia 8.3 0.4 3.5 1.6 1.4 1.8Thailand 4.4 1.5f 2.0~3.0 1.6 1.6 0.0~1.0Indonesia 4.8 3.3 3.5~4.0 3.8 11.5 10.9Philippines 4.0 3.4 4.0~4.5 4.4 6.1 5.0~6.0
1 Inflation refers to Retail Price Index excluding mortgage interest. 2 Inflation refers to composite price.3 Includes Singapore.eEstimatef Forecast
Source: International Monetary Fund, Datastream, OECD Economic Outlook, National sources
Inflation (%)Real GDP growth (%)
2000 2001e 2002f 2000 2002f2001e

Outlook and Policy
85
the quarter due to strong demand, particularly forautomobiles, spurred by aggressive price cuts andzero interest rate financing.
The euro area also weakened as its largesteconomy, Germany stagnated in the second half-year, reflecting broad-based weakness in bothdomestic demand and exports. The UK economywas less affected than the other major economies asit was supported by strong domestic demand,particularly consumption. Japan entered its thirdrecession since the correction in the asset markets inthe early 1990s, as falling exports compounded thedeflation and structural problems in the economy,resulting in sluggish domestic demand.
However, towards year-end, fears of a deep recessionin the US abated as markets looked ahead to arecovery. The liquidity impact from the aggressivemonetary easing during the year and increasedoptimism following the early conclusion of the WestAsian conflict contributed to the rise in stock markets.The wealth gain from the equity market in the fourthquarter of 2001 and early 2002 was estimated to bearound US$1.5 trillion. The optimism was furtherreinforced by positive data released in December andearly 2002 suggesting that the downturn in the USeconomy was beginning to level off. Markets havealso perceived the steepening of the US long-termyields as indicative of an impending recovery.
Prospects for 2002Going forward, the outlook for the global economyhas improved, supported by positive developments inthe US. There has also been improvement in otherparts of the world. Sentiment indicators in Europehave shown a marked improvement, while in theregion there have been further signs of stabilisation ineconomic activity, mainly a slower pace of decline inexports. Prospects are for the US to lead the recovery,thus supporting an upturn in the other regions,including the euro area and East Asia. However, Japanis expected to experience another year of contraction.
The world economy is expected to recover graduallyin line with the slow and modest recovery in the US.Thus, world growth is expected to pick up slightly to
2.6%, while world trade is forecast to expandbetween 2% and 2.5%, in tandem with a gradualupturn in the electronics sector. Real output growth in
United States 11 6.5 Tax cuts and 1.75 spending
Japan 2 0.25 zero
interest rate Spendingpolicy with quantitative
easing
Euro area 4 4.75 -3.25
United Kingdom 7 6.0 4.0 Spending
People’s Republic of China 11 5.85 Spending
5.311
Korea 4 5.25 Tax measures 4.0 and spending
Taiwan 11 4.625 Tax measures2.125 and spending
Singapore - - Tax measures and spending
Hong Kong SAR 11 8.0 Tax measures3.25
Malaysia 1 5.5 Tax and5.0 non-tax
measuresand
spending
Thailand 2 Initially interest rate
was increased Spendingfollowed by
two rate cuts to 2.0%
Philippines 15 13.5 -7.25
1 One-year lending rate on renminbi loans
Table 3.2Changes in Monetary and Fiscal MeasuresUndertaken by the Various Countries since 2001
Country Number ofinterest rate
cuts
Changes inpolicy rate
(%)
FiscalStimulus
Monetary Policy
Corporations consolidated as they reduced capitalspending, drew down on their inventories as well ascut back on their workforce. Declines in capitalspending was broad-based due to over-capacity,but was more pronounced in the technology sector.
However, consumer spending continued to be asource of support. Fourth quarter GDP data showedthat the economy turned around to expand during
Recent positive developments reinforce optimism for a gradual andmodest global recovery in 2002.

the major industrial countries as a group isexpected to stabilise at 1.1%, while growth in thedeveloping countries is projected to pick up slightlyto 4.5%. Growth in the East Asian economies isenvisaged to be slightly higher at 4.6 - 4.8%, asimpetus to growth is expected to emanate fromstronger export demand in the second half of 2002.
Industrial CountriesThe United States economy entered 2002 in arelatively better position as earlier fears of a recessionabated. Consumer confidence and equity marketshave rebounded and the fourth quarter 2001 GDPexceeded expectations. The US economy is nowexpected to recover gradually, gaining momentumfrom 1.6% in the first half-year to 2.8% in thesecond half-year. Growth, nevertheless, is expectedto be gradual and modest, as investment recovery willlag considerably given the prevailing excess capacity.The recovery in employment will also lag theeconomic recovery due to ongoing consolidation bycorporations as well as the slow recovery ininvestment. Under these circumstances, growth for2002 as a whole is estimated at 1.4%.
The recovery is premised on four factors. First, whilethe policies undertaken in 2001 have begun to filterthrough the economy, the monetary easing has a lagof 6 - 18 months before its full effects are felt oneconomic activity. The substantial easing of 475 basispoints in 2001 is expected to provide a large impetusto growth during the course of 2002. The US$70billion fiscal stimulus, comprising tax cuts andspending from the emergency package announcedafter September 11 for reconstruction and defence
industries, is also expected to be felt in 2002. Inaddition, a new fiscal package worth US$51 billion,comprising unemployment benefits and business taxbreaks should add further stimulus to growth in2002. Second, the gradual shift from destocking toinventory accumulation is envisaged to add about1 - 1.5 percentage points to GDP. Third, softer oilprices would support consumption. The consequentprospects of lower inflation would also allow greaterflexibility for the authorities to focus on growth.
86
-1
-0.5
0
0.5
1
1.5
2
2.5
3
Percent change(%)
1.21.4
-0.5 -0.5
1.6
1.3
2.4
2.0
US
Japan
Euro area UK
2001e 2002f
Graph 3.1Major Industrial Countries:Real GDP Growth (2001-2002)
-120
-100
-80
-60
-40
-20
0
20
40
60
80
100
120
-12
-10
-8
-6
-4
-2
0
2
4
6
8
10
12
Changes In Business Inventory (LHS)
90 91 92 93 94 95 96 97 98 99 00 01
Real GDP (RHS)
US$ billion Rate, %
Graph 3.2Real GDP and Changes in Business Inventory
In 2001, inventory liquidation eroded about 1.1 percentage pointsfrom overall GDP growth. A modest build-up of inventory isexpected to add about 1 - 1.5 percentage points to GDP growthin 2002.
-4
-2
0
2
4
6
8
10
0
20
40
60
80
100
120
140
160
Rate, % Index
Unemployment (M) (LHS)
Consumption (Q) (LHS)
Consumer confidence (M) (RHS)
90 91 92 93 94 95 96 97 98 99 00 0189
Graph 3.3Consumption, Consumer Confidence andUnemployment
Consumption is more related to expectations and lesser toemployment conditions. In the 1990s recession, consumptionpicked up two quarters before unemployment peaked. In thecurrent cycle, unemployment is expected to peak in mid-2002.

Outlook and Policy
87
Finally, the resilience in productivity growth seenduring the current downturn is expected to furthersupport growth during the year.
Central to the forecast is that consumption growthwould continue. While employment and incomeconditions may weaken in the next few months andrestrain consumption to some extent, the positiveimpact from lower taxes, energy prices and interestrates are likely to cushion part of the impact ondisposable income. At the same time, householdbalance sheets have remained relatively healthy(asset/liability ratio of 5:1), as the negative wealtheffect in the past year was confined mainly to lossesin equity wealth, while house prices have remainedsteady. The recent rise in consumer confidence furthersupports the view that consumption growth would besustained during the year.
Meanwhile, the corporate sector is expected tocontinue its consolidation exercise affecting investmentand employment prospects. Thus, both investment andemployment are expected to lag the recovery cycle andpick up only after clear signs of improvement incorporate earnings and capacity utilisation. In the thirdquarter of 2001, capacity utilisation declined to thelowest level since 1983 (technology: 61.2, non-technology sector: 77.8). In view of the above, theupside to new investment is somewhat limited exceptfor opportunities in some areas such as the autoindustry (upgrading into new models) and thetechnological upgrading for IT hardware industries.
Investment would also be supported by fiscal spendingworth US$40 billion for the reconstruction andinvestment in biotechnology and defence industries.
The euro area is expected to expand at a slowerpace of 1.3% in 2002, given that its recovery wouldbe lagging the US upturn by one to two quarters.Inflationary pressures that had earlier affecteddomestic demand are expected to diminishprogressively following the effects from lower energyprices. A pick-up in production during the secondhalf-year amidst rising demand from the US andinventory accumulation should contribute to growth.Improved exports as well as the lower cost ofborrowing (monetary easing of 150 basis points since2001) are expected to spur investment. In particular,investment in the high-tech sector is also expected toperform better in the euro area during the next phaseof growth since the extent of IT spending in the pasthad been lower than in the US. Given that the bulk ofthis impact is likely to be seen in late 2002 and 2003,growth is expected to be modest during the year.
In the United Kingdom, although growth is expectedto moderate slightly to 2% in 2002, the economywould continue to outperform the other majorindustrial economies. The weakness in themanufacturing sector is expected to dissipate graduallyfollowing an upturn in IT-related production and a shiftto inventory accumulation, while the strength in theservices sector is expected to remain. Lagged impactfrom the monetary easing in 2001 (200 basis points),the impetus from the expansionary fiscal policy (2001-2003 cumulative spending worth 3% of GDP) and thepositive wealth effect from a steady housing market areexpected to sustain the underlying strength in consumerspending. These recovery forces are likely to reduce theimpact from weaker household incomes and bonuses.
In Japan, growth prospects are expected to remainweak in 2002. Real GDP is projected to fall for thesecond consecutive year by 0.5%. Structural reformsin the financial and corporate sectors are expected todampen growth prospects in the immediate term.Under these circumstances, employment prospects arelikely to deteriorate amidst the deflationary forces.Although the reforms are viewed to contributepositively over the longer term, the short-term impactof the reforms could be fairly significant, especially onthe banking system. The two supplementary budgetstotalling ¥5.6 trillion as well as the accommodativemonetary stance are expected to cushion part of theadverse impact. Growth prospects also remainsensitive to Japan’s fiscal sustainability as well as
-25
-20
-15
-10
-5
0
5
10
15
20
25
30Rate, %
Investment Corporate profitability
90 91 92 93 94 95 96 97 98 99 00 0189
Graph 3.4Investment and Corporate ProfitabilityCorporate profitability registered the largest decline in 10 yearsof 18.5% in the third quarter of 2001 and is expected to havereached its trough in the fourth quarter of 2001. Corporateprofitability is only expected to recover gradually in the secondhalf of 2002, implying that firms are likely to hold backinvestment plans until they see a stronger upturn in profitability.

adverse domestic and external developments,including volatility in the financial markets.
Inflation in the major industrial countries as a wholeis expected to ease to 1.2% in 2002 due to softer oilprices and a gradual recovery in global demand,especially in the US and euro area. Japan wouldcontinue to face deflation in view of the excesscapacity, weak demand, lower imported inflation anddownward price pressures arising from deregulationand technological innovation. In contrast, inflation inthe UK is expected to edge upwards in view of thestrength in consumption.
Despite the optimism for a recovery in the US, themain risk for the global economy is for a“double dip” recession. The risk is that the USrecovery may not be durable in the event thatconsumer spending, which is key to the recovery,does not hold up. While the corporate sector hastaken the necessary adjustments, the householdsector remains vulnerable due to the low savings rate(January 2002: 1.8%) and increased indebtedness(ratio of debt to disposable income of 105%). Iflabour market conditions deteriorate beyond currentexpectations, consumers may not be able to servicetheir housing mortgages, which in turn could weakenthe housing market. Weaker income and negativewealth effects would encourage consumers tobecome cautious and cut back on consumption andincrease their savings.
Higher unemployment could be triggered by stress inthe corporate sector resulting in further corporateconsolidation. The corporate financing gap (thedifference between capital expenditure and cashflows) has remained large, implying that firms wouldneed continued financing from the capital marketsince banks have already tightened lending to thecorporate sector. The recent failure of a large UScorporation has made investors and regulators awareof the need to review current accounting standards toensure better disclosure. Should closer scrutiny revealmore problems, corporations’ credit ratings coulddeteriorate and lead to corrections in both the equityand bond markets, leading to further stress in thecorporate sector.
Nevertheless, structural improvements in the US inthe last decade resulted in lower inflation, highproductivity growth and a deep and sophisticatedfinancial system. These developments should help thecountry weather the current downturn. Events in thepast year also showed that the prompt response by
the authorities in respect to monetary and fiscalpolicies effectively shored up business and consumerconfidence, thereby reducing the severity of thedownturn.
The other downside risk is a sharp andprolonged depreciation of the yen. Thevulnerability of the Japanese banking system couldaffect investor sentiment and increase the volatilityand heighten the risk on the yen. If the yendepreciates to extremely weak levels for a sustainedperiod, it could further escalate the problems in theJapanese banking system. Empirical evidence showedthat there is a positive relationship between the yenand Japanese asset markets. Despite the fact thatforeign investors’ holdings of outstanding Japaneseassets are relatively small, they account for a largeshare of the active trading, and thus enable toinfluence the market direction. A combination of aweaker yen, weak Japanese bond and equity marketscan have an adverse impact on Japanese banks, giventheir large exposure to these markets. For the region,a weaker yen could have serious implications, andcould be highly destabilising on regional currencies.
East Asian EconomiesAgainst a backdrop of a mild US recovery and amodest rebound in the global electronics sector, theregional countries are envisaged to record an improvedgrowth in 2002. Growth for the region as a wholeis expected to improve to 4.6 - 4.8%, due mainly torelatively robust growth in the People’s Republic ofChina. Growth in the other regional countries isexpected to be more moderate, ranging from1 - 4.5%. The region is envisaged to recover in thesecond half of the year as external demand gathersmomentum. Given that most regional economies havea large tradable sector and are highly dependent onelectronics exports, the acceleration in external demandwould create a significant impetus to growth.
Latest available indicators suggest that thedownturn in the global electronics cycle hasbottomed out. The pace of contraction insemiconductor sales has eased and on amonth-on-month basis has turned around to recordpositive growth for two months. In addition, ordersreceived by global chipmakers have picked up,resulting in an improvement in the book-to-billratio, prices of selected product segments such asDRAMs have improved and some large companieshave indicated a brighter outlook. Despite thesepositive developments, the upturn in globalelectronics demand is expected to be modest,
88

Outlook and Policy
89
gradual and uneven as there is still significant excesscapacity, especially in the communications andnetwork product segments of the industry, amidstthe overall weak investment climate. Regionalcountries producing personal computers andspecialised in outsourcing activities are viewed tobenefit the most in the latest electronics upcycle.
In the interim, as external demand gathersmomentum, expansionary policies already in place areexpected to play a key role to support domesticdemand, and hence, growth in the first half of 2002.Against a mild inflation backdrop, monetary policy inthe regional economies would remain accommodativeto ensure sufficient liquidity to facilitate credit growthand stimulate economic activity. In line with theglobal trend, interest rates in the regional countrieshad been reduced significantly in 2001 and the costof borrowing is currently at relatively low levels. Inaddition, the cumulative effects from theexpansionary fiscal policies should also filter throughthe economies during the year.
In the event of further external shocks, the regionalcountries are also in a stronger position to absorbthese shocks. Their external positions havestrengthened. Countries have higher foreignexchange reserves and lower external debt withlonger-term maturities. Current account surpluses,although narrowing somewhat, are expected tocontinue in 2002, which would act as an additional
buffer to external shocks. The restructuring in thepost-crisis period has also strengthened thefinancial sectors in the regional countries. Capitaladequacy ratios have been raised in most countriesto above 10% and their non-performing loan ratiosare now lower than the post-crisis levels, due toactive measures by asset management companies.Financial institutions in both the banking sector andcapital markets in the region have also tightenedtheir prudential measures to be in line withinternational standards.
In addition, there has been a structural change in thefinancing pattern in the region, away from bankingsystem loans towards longer maturity and market-basedinstruments. These changes have helped to diversify the
sources of financing in the region that will enhance theresilience against future shocks. In the longer term, thereforms in the financial and corporate sectors shouldcontribute towards enhancing efficiency in productionand capital allocation.
In 2002, the Asian Newly Industrialised Economies(NIEs) as a group is expected to expand at a strongerrate of 2.7 - 2.9% (2001: 0.6%), reflecting a mildrecovery across all the countries on the back of firmerexternal demand. The forecast is premised on a modestrecovery in the electronics sector, on which the NIEs are
highly dependent. In Korea, growth is expected to riseto 3.9% in 2002, reflecting a pick-up in electronicsexports as well as stronger domestic demand,supported by lower oil prices and the positive wealtheffects from a rising stock market. Similarly, in Taiwan,real GDP is expected to recover to expand by 2.3% in2002, in line with the expected recovery in the US,which absorbs about one-third of Taiwan’s exports.Recovery in asset markets and receding politicaluncertainties are also expected to support consumerand business confidence.
The Singapore economy is projected to recover witha growth of 1-3%. Although growth may beaffected by rising unemployment in the first half ofthe year, the recovery is expected to gather
Regional countries to recover, supported by expansionary policiesand strengthening external demand. Stronger external positionsand structural improvements have reduced vulnerability of countriesto external shocks.
-4 -2 0 2 4 6 8
2001 2002
7.37.0
1.0 - 3.0
2.3
3.03.9
0.43.5
3.33.5 - 4.0
0.11.0
1.52.0 - 3.0
3.44.0 - 4.5
-2.0
-1.9
P.R. China
Korea
Malaysia
Indonesia
Hong Kong SAR
Thailand
Philippines
Singapore
Taiwan
Percent change (%)
Graph 3.5Regional Countries: Real GDP Growth (%)

momentum towards the end of the year, followingimproving demand from the US and better consumersentiment. In the Hong Kong SpecialAdministrative Region (SAR), growth is expectedto pick up to 1% in 2002 but strengthening indomestic demand would be vital to support therecovery. Meanwhile, growth in the People’sRepublic of China is expected to stabilise around7%, supported by strong domestic demand, increasedfiscal spending and investment related to foreigndirect investments, especially following its entry intothe World Trade Organisation (WTO).
Meanwhile, growth for the ASEAN economies as agroup is expected to pick up to 2.8 - 3.6% (2001:1.5%), in view of relatively stable domestic demandin the member countries amidst strengtheningexports. Growth in the Philippines is expected to riseto 4 - 4.5%, due to improvement in external demand,especially for electronics products, which form thebulk of the country’s exports. Effects from thesignificant monetary easing by 625 basis points sinceJanuary 2001 as well as improved confidence on theback of receding political uncertainty are likely tosupport domestic demand.
Growth in Thailand is projected to increase slightlyby 2 - 3% in 2002 on account of the recovery in theUS, its main export partner, and impact from fiscalstimulus measures. In the recent period, Indonesiahas been less affected among the regional countriesas it is a more domestically driven economy and itsexport sector is less dependent on technologyproducts. Nevertheless, in 2002, Indonesia’s real GDPgrowth is projected to remain moderate at around3.5 - 4%. Softening oil prices and a weak investmentclimate are likely to affect the scope for highergrowth in Indonesia during the year.
Inflation in the regional countries is expected to remainmoderate, easing slightly to 2.2 - 2.3% in 2002, due tomild inflation in the People’s Republic of China, endingof deflation in Hong Kong SAR and lower inflation inthe other countries. For most countries, lower inflationis largely on account of lower oil prices and generalweakness in private consumption, which limits theability of producers to pass cost increases to consumers.Inflation in the Asian NIEs as a group is expected toease to 0.8 - 0.9%. While inflation is expected toremain mild in Taiwan due to lower tariffs after its entryinto the WTO, Singapore is expected to experience amild deflation attributable to declining rentals, lower oilprices and sluggish demand amidst the highunemployment.
Similarly, inflation in the ASEAN countries as a groupis expected to moderate slightly to 5 - 5.5%. In bothThailand and the Philippines, price pressures areexpected to subside in view of lower oil prices,sluggish domestic demand and relatively stable foodprices. In Indonesia, however, inflation is expected toremain relatively high due to the planned fuel andelectricity price hikes.
Interest Rates and Exchange RatesIn 2001, monetary policy in the major industrialcountries shifted towards easing, with the US FederalReserve Board (Fed) taking the lead. The majorindustrial countries reduced interest rates aggressivelyduring the year, especially in the US, to counter thesharp economic slowdown amidst a declininginflation trend, especially in the aftermath ofSeptember 11. Following September 11, the Fed andthe other major central banks conducted co-ordinated interest rate cuts and undertook swaparrangements to minimise potential volatility in theglobal financial markets.
In the US, the Fed reduced the Federal funds rate bya cumulative 475 basis points in 11 steps, a reductionof 300 basis points prior to September 11 andanother 175 basis points after September 11. Thisbrought the Federal funds rate to 1.75%, its lowestlevel in 40 years. The Bank of England (BOE) easedits base lending rate (BLR) in seven steps by a
90
8
7
6
5
4
3
2
1
0
United Kingdom(Base lending rate)
United States(Fed funds rate)
Euro area(Repo rate)
Japan(Overnight rate)
4.00
3.25
1.75
0.0
Rate, %
1998 1999 2000 2001 2002
Graph 3.6Major Industrial Countries:Official Interest Rates

Outlook and Policy
91
cumulative 200 basis points to a 37-year low of 4%to insulate the economy from the global slowdown,amidst the declining trend of inflation.
In view of concerns that inflation remained above thetarget rate of 2%, the European Central Bank (ECB)reduced interest rates after a considerable lag,commencing only in May 2001. The repo rate wasbrought down to 3.25% in four steps by a cumulative150 basis points to mitigate the sharp slowdown in theeuro area. In March, the Bank of Japan (BOJ) revertedto its zero interest rate policy to counter the deflationamidst the sharp weakness in its economy.Subsequently, the BOJ engaged in several quantitativeeasing measures to inject liquidity to the bankingsystem in order to maintain financial stability.
In early 2002, except for Japan, monetary policy inthe major industrial countries remained unchanged.On 28 February, the BOJ continued furtherquantitative easing by increasing its direct purchase ofJapanese government bonds, while providing ampleliquidity to meet market demand.
For the remaining part of 2002, expectations arefor interest rates to stabilise given signs of improvingeconomic data, as well as the already significantmonetary stimulus that has been put in place tofacilitate the recovery. Nonetheless, the central banksare likely to remain vigilant against signs ofunexpected softening of economic activity that mayrequire further easing. Equally important, theauthorities are likely to assess the strength of theemerging recovery that may result in emerginginflationary pressures and consequently warrant pre-emptive policy responses. The possibility of a shift inthe stance, in either direction, would, however,depend on a number of factors, including thestrength of the recovery; developments in the ITsector; the movement in the major currencies; andthe performance of the financial markets.
In the foreign exchange markets, the US dollarstrengthened against all major currencies in 2001.The dollar appreciated by 15.2%, 5.9% and 2.8%against the yen, euro and pound sterling respectively.Although the dollar was briefly affected by September11 due to shifts away from dollar assets to capital-exporting countries, the dollar regained its strengththereafter. Large foreign inflows into the bond marketalso underpinned the dollar during the year. Thesentiment on the dollar was supported by marketperception that the US recovery would be ahead ofthe other major economies.
The euro weakened in view of the growth prospectsof the euro economies relative to the US. Thepound sterling tracked the euro weakness as thecurrency was seen to be adjusting, taking intoaccount the prospect of UK’s entry into the euroarea. The weakening of the yen, especially towardsthe end of the year, was triggered by perceivedchanges in the Japanese authorities’ stance totolerate a weaker yen.
In the first two months of 2002, the dollarremained firm against the major currencies as morepositive data in the US reinforced expectations thatthe US recovery would lead the global upturn. Theyen traded in the range of US$1= ¥130 - 135.However, in early March, the yen strengthened tobelow US$1= ¥130, following an increase in foreigninterest in the Japanese stock market.
For the rest of 2002, the movement of the dollaragainst other major currencies would be influencedby a number of factors. These include investors’perception on the importance of growth differentialsvis-à-vis interest rate differentials, performance ofstock and bond markets as well as the movement ofcapital flows during the year. Country-specific issuesthat are structural and relating to the health of thefinancial system could also affect the sentiment onthe major currencies.
MALAYSIAN ECONOMY IN 2002
The Malaysian economy is expected to strengthen in2002 following a strengthening of external demand.Past trends show that there is a brief lag between therecovery in the major economies and recovery inMalaysian exports. As such, the timing and
0.8
0.9
1
1.1
1.2
1.3
1.4
1.5
1.6
1.7
1.8
100
105
110
115
120
125
130
135
140
145
150
US$/£
¥/US$
US$/Euro
euro, sterling yen
1998 1999 2000 2001 2002
Graph 3.7Movement of the US Dollar against MajorCurrencies

magnitude of the recovery would have a significantimpact on the Malaysian economy. Currentindications suggest that external demand will not pickup as strongly as in the 1999-2000 period, whererecovery was mainly led by the internet-boom and theY2K factor. The current economic upturn is takingplace amidst global excess capacity, particularly in thetechnology sector. External demand is, therefore,expected to strengthen gradually. Against thisbackground, the recovery in the Malaysian economywould be modest, with real GDP expanding by3.5% in 2002.
At this juncture, latest indicators show signs ofstabilisation in the Malaysian economy. The indexof leading economic indicators compiled by theDepartment of Statistics, Malaysia, which providesearly indications on the direction of economicgrowth, has already registered five consecutivemonths of positive growth since July 2001. Thissuggests that the Malaysian economy would turnaround in the first quarter of 2002. Indications,however, are that growth would strengthen in thesecond half-year when external demand improvesmore significantly.
The growth projection for 2002 is based on strongergrowth in private consumption, a modest recovery inprivate investment, sustained public sectorexpenditure and a moderate growth in exports. If thepositive trend in the latest indicators for the USeconomy is sustained, the bias to the growthprojection would be on the upside. On the domestic
front, aggressive policy measures to enhance therole of the services sector, particularly in theeducation, tourism and information, communicationand technology sub-sectors, would benefit thesesectors, which in turn could improve further theGDP growth.
Expansionary fiscal policy and accommodativemonetary policy already in place are expected tosustain growth in domestic demand. Growth inprivate consumption is expected to pick up to 5%following the improved growth and employment
outlook as well as the cumulative effects from theGovernment’s measures that have raised disposableincome. Additional measures announced by theGovernment in the 2002 Budget such as the 1-2percentage points across-the-board reduction inindividual income tax rates, raising the incomethreshold before the maximum income tax rate takeseffect and an increase in civil servants’ salaries shouldall further increase disposable income. Growth inprivate consumption is projected to be strongerin the second half-year when export demandgathers momentum.
Meanwhile, private investment is expected torecover in 2002, registering a positive growth of1.2%. Investment in the manufacturing sector isexpected to turn around only in the second half-year when recovery in the global economybecomes more entrenched. The impetus to privateinvestment would, therefore, be coming mainlyfrom continued investments in the ongoingprivatised road projects, residential housing, railprojects, development works on ports andpower plants as well as investment in the oil andgas sub-sector.
While the 2002 Budget announced a fiscalconsolidation, the better-than-expected fiscal outturnin 2001 arising from stronger revenue collectionswould imply that the consolidation would be lesspronounced (fiscal deficit of –5.1% of GDP in 2002from –5.5% in 2001, compared to earlier estimate of–6.5% of GDP for 2001). Public investmentspending is projected to decline by 3% after a strongincrease of 15.5% in 2001. Despite this, the FederalGovernment’s development expenditure allocation for2002 remains high at RM28.4 billion, with a largeshare of expenditure continuing to be accorded to the
92
The Malaysian economy is well positioned to benefit from theexpected recovery in the global economy.
-10
-5
0
5
10
15
20
Leading Index
Coincident Index
Index
1997 1998 1999 2000 2001
Source: Departments of Statistics, Malaysia
Graph 3.8Leading Index Pointed to a Recovery in 2002

Outlook and Policy
93
economic and social sectors. Public consumption isprojected to increase by 4.1%, reflecting the 10%salary adjustment for civil servants as well as higherexpenditure on supplies and services.
On the production side, all major sectors areexpected to record positive growth in 2002. Themanufacturing sector is anticipated to recover,benefiting from the improvement in global demand
for electronics. The services and constructionsectors are expected to continue to supportgrowth, benefiting from the pro-growth policiesalready in place.
Value-added growth in the manufacturing sector isexpected to turn around to register a positive growthof 4.2% in 2002. The anticipated upturn in the USeconomy and electronics demand is expected totranslate into stronger demand for Malaysianmanufactured exports and, hence, stronger growth inthe production of manufactured goods. Both foreignand domestic manufacturers in Malaysia haveindicated increased optimism on the outlook for themanufacturing sector in general, and the electronicssector in particular. The general consensus is thatgrowth in the manufacturing sector would be modestin the first quarter before gathering strength in thesubsequent quarters of 2002.
Growth in the electronics industry is expected to beunderpinned by several positive factors. First, therewas a significant drawdown of inventories bycompanies in 2001 and, thus, new orders areexpected to result in an immediate increase inproduction, especially for electronics. The personalcomputer (PC) market is expected to show astronger recovery relative to thetelecommunications sector. Preliminary findings ofBNM’s study on the export composition ofMalaysia’s electronics industry showed that exportsof computers and peripherals account for about40% of Malaysia’s total electronics exports.Therefore, the impending improvement in theglobal PC market should benefit the industry inMalaysia. In addition, some manufacturers of
Table 3.3Real GDP by Expenditure (1987=100)
Domestic Demand1 2.3 2.8Private sector expenditure -2.9 4.2
Consumption 2.8 5.0Investment -19.7 1.2
Public sector expenditure 13.9 0.0Consumption 11.9 4.1Investment 15.5 -3.0
Net exports of goods and services 2.3 -0.6Exports -7.6 3.7Imports -8.6 4.2
Gross Domestic Product 0.4 3.5
1 Excluding stocks.p Preliminaryf Forecast
Source: Department of Statistics, Malaysia and Bank Negara Malaysia
2001p
Annualchange (%)
2002f
2001p
% point of contribution
2002f
Table 3.4Contribution of Demand Components to RealGDP Growth
Domestic Demand1 0.1 3.5Private sector expenditure -1.7 2.5
Consumption 1.3 2.3Investment -3.0 0.2
Public sector expenditure 3.8 0.0Consumption 1.4 0.5Investment 2.4 -0.5
Changes in stocks -1.9 1.1
Net exports of goods and services 0.3 -0.1Exports -8.9 4.0Imports -9.2 4.1
Gross Domestic Product 0.4 3.5
Note: Figures may not necessarily add up due to rounding1 Include stocksp Preliminaryf Forecast
Source: Department of Statistics, Malaysia and Bank Negara Malaysia
2001p
Annualchange (%)
2002f
Agriculture 2.5 1.0
Mining 0.2 3.0
Manufacturing -5.1 4.2
Construction 2.3 2.4
Services 4.9 3.8
Real GDP 0.4 3.5
p Preliminaryf Forecast
Source: Department of Statistics, Malaysia and Bank Negara Malaysia
Table 3.5Real GDP by Sector (1987=100)

electrical products have also begun to focus on newproducts to meet the changing consumerpreferences. Second, there is an increasing trendtowards outsourcing of activities in themanufacturing sector. As a result, some largemanufacturers in the region are expected totransfer some operations to Malaysia followingcorporate consolidation of plants in the region.Malaysia is expected to benefit from thesedevelopments. Finally, demand from niche marketsfor products such as video games, personal digitalassistants and emerging products such as photonicsor optoelectronics is expected to continue tocontribute to growth.
With the electronics and electrical productsindustries leading output growth in the export-oriented sector, the production of export-orientedindustries as a whole is projected to recover in 2002with a growth of 4.9% (2001: -10.2%). Output inthe domestic-oriented sector is expected to besustained at a strong rate of 6% in 2002 (2001:7.4%), supported by the Government’s pro-growthpolicies. In particular, the transport equipment andconstruction-related materials industries are forecastto continue to contribute to growth.
Growth in the services sector is expected to bebroad-based, with the intermediate services groupexpanding at a faster rate than the final servicesgroup. Growth, however, is expected to moderateto 3.8% partly due to the strong performance in2001. Nonetheless, policy measures to raise the
potential output of the services sector, particularlyin the education, tourism and information,communication and technology sub-sectors, couldresult in a stronger-than-expected growth in theservices sector, which in turn, would improve theGDP growth.
Growth in the construction sector is expected tobe sustained at 2.4%, with impetus coming fromthe civil engineering and residential sub-sectors.Low interest rates and various pre-emptivemeasures implemented by the Government toaddress the excess supply situation in the propertymarket will continue to support demand forresidential housing. The relaxation of the ForeignInvestment Committee guidelines on foreignacquisition of properties in April 2001 has helped toreduce the property overhang in the sub-sector.The Government has waived the stamp dutycharged for the purchase of residential propertyfrom developers registered with the Real Estate andHousing Developers’ Association Malaysia, for aperiod of six months, effective 1 January 2002. On27 November 2001, BNM lifted the restriction onthe provision of bridging finance for thedevelopment of residential properties aboveRM250,000 and shop houses exceeding RM250,000per unit located within residential areas, providedthe projects have achieved break-even sales.Growth in the civil engineering sub-sector isenvisaged to be supported by privatised projects aswell as fiscal spending on infrastructuredevelopment. Meanwhile, activity in the non-residential sub-sector would continue to beconstrained by excess capacity with activity focusedmainly on ongoing projects.
Growth in the agriculture sector is expected tomoderate to 1% due largely to lower production ofcrude palm oil (CPO), rubber and saw logs. Inparticular, CPO production is expected to declinedue to anticipated lower yields arising from cyclicaltree stress after three consecutive years of highproduction, as well as the impact of the replantingprogramme that will involve 200,000 hectares ofold oil palm trees. However, measures taken by theGovernment to increase food production isexpected to result in increased production of fruits,vegetables, livestock and fish, thus contributingto higher activity in the agriculture sector in 2002.Meanwhile, growth in the mining sector isexpected to pick up to 3% due to higherproduction of crude oil and natural gas inresponse to higher domestic demand. For 2002,
94
Table 3.6Malaysia’s Electronics Industry: Export Composition
Computer and peripherals 39Monitors, keyboards, servers and
related hardware 10Parts and accessories for computers 20Data storage devices 9
Discrete components 22
Integrated circuits 19
Others 20Electronics parts 7Display devices 6Electronics apparatus 3Cathode ray tubes and other picture tubes 2Other electronics related equipments 2
Total 100
Source: Department of Statistics, Malaysia
% share of total electronics exportsProduct Diversification

Outlook and Policy
95
crude oil production has been targeted at 600,000barrels per day.
Consumer prices are expected to edge upwards in2002 in line with the projected recovery in domesticeconomic activity. As growth is expected to bemoderate with excess capacity remaining high formost of the year, the increase in prices is expectedto emanate more from price adjustments rather thanfrom demand pressures. Core or underlyinginflation, which represents price increases arisingfrom demand pressures, is projected to increasefrom 1% in 2001 to 1.3% in 2002. A one-off priceincrease of an additional 0.5 percentage point isanticipated during the year. The increase in thepetrol prices and import and excise duties oncigarettes and tobacco products, announced in the2002 Budget, took effect from mid-October 2001.Toll charges on North-South Expressway andtelephone tariffs have also been raised effectiveJanuary 2002 and March 2002 respectively. WhileCPI inflation is projected to increase by 1.8% in2002, it continues to remain low.
The labour market situation is expected toimprove gradually in 2002 in tandem with therecovery in the export sector. The unemploymentrate is forecast to decline to 3.6% in 2002 (2001:3.7%). The establishment of nine schemes for skillstraining and higher education with an allocation ofRM300 million is envisaged to contribute positivelyto the development of skills of unemployedgraduates and retrenched workers. This is expectedto facilitate the absorption of unemployed workersinto higher-end job segments. While IT-relatedareas are expected to create new employmentopportunities, the manufacturing sector would stillbe a major source of new employmentopportunities.
As previous experience has shown, a revival ofeconomic activity would result in a narrowing of thecurrent account surplus of the balance ofpayments. The stronger trade surplus from higherexports would be eroded somewhat by higherimports. Similarly, the services and income accountdeficits are also expected to widen. The currentaccount surplus, nevertheless, is forecast to remainlarge in 2002, at 7.9% of GNP.
Exports are expected to turn around to record agrowth of 4.4% in view of the anticipated recovery inelectronic exports and higher revenue fromagricultural exports. Imports are expected to
increase by 4.8% with imports of intermediate goodsincreasing by 6.4%. Nevertheless, the trade surplus isprojected to be large mainly because the import ofcapital goods is not expected to increase significantlyin 2002 due to continued excess capacity and slowbuildup in new investment.
Manufactured exports are expected to performbetter in 2002, in view of the improving outlook on
0
1
2
3
4
5
6
% y-o-y
1997 1998 1999 2000 2001 2002f
CPI Inflation
Core Inflation
Graph 3.9Consumer Prices
Table 3.7Balance of Payments
2001p 2002f 2001p 2002f
Goods 69.9 73.0 18.4 19.2Trade account 53.7 55.0 14.1 14.5
Exports (% change) -10.4 4.4 -10.4 4.4Imports (% change) -9.9 4.8 -9.9 4.8
Services -8.4 -11.6 -2.2 -3.0
Balance on goods and services 61.5 61.4 16.2 16.1
Income -25.9 -27.5 -6.8 -7.2Current transfers -8.1 -8.4 -2.1 -2.2
Current account balance 27.4 25.5 7.2 6.7(% of GNP) 8.9 7.9 8.9 7.9
Financial account -14.8 -3.9
Errors and omissions -8.9 -2.3of which :
Exchange revaluation loss -4.1 -1.1
Overall balance 3.7 1.0
p Preliminaryf Forecast
Source: Department of Statistics, Malaysia and Bank Negara Malaysia.
RM billion US$ billion

external demand, especially in the US and theanticipated recovery of the global electronics sectorduring the year. For the year as a whole,manufactured exports are expected to turn aroundto register a positive growth of 6.5%, driven byelectronics exports, which accounted for about onehalf of total manufactured exports. With severalpositive developments already taking place towardsthe end of 2001, electronics exports are expectedto grow by 9.5% (2001: –16.3%). Nevertheless, thegrowth momentum is expected to pick up in thesecond half of the year. Similarly, exports of thenon-electronics industries are expected to expandby 3.6% (2001: –3.6%), particularly thoseproducing electrical products, chemicals andchemical products, and optical and scientificequipment. Consequently, export volume isexpected to expand by 8.5% in 2002 (2001:–4.1%). Export prices, however, are expected tocontinue to trend downwards, albeit at a moremoderate pace (–2%; 2001: –6.1%). Thedownward pressure on prices is due mainly toexcess capacity amidst a slower expansion indemand. In addition, increased capacity amonglower cost producing countries also exert pressureon prices, especially for electronic products.
The outlook for Malaysian commodity prices isexpected to be favourable in 2002, particularly forpalm oil. The projected increase of 18.2% inagriculture exports would be derived from thehigher palm oil price as export volume is onlyexpected to increase marginally, constrained by lowerdomestic supply. The price of palm oil, which hasbeen trending upwards since November 2001, isprojected to strengthen further to RM1,250 per tonnein 2002 in anticipation of rising demand and tightglobal supplies. Similarly, export prices of saw logs,sawn timber and rubber are forecast to improve asexternal demand for these commodities is expectedto pick up, particularly in the second half of 2002.Meanwhile, the average price for Malaysia’s crude oilis forecast to decline to US$18.00 per barrel in 2002(2001: US$25.53), reflecting primarily conditions inthe international oil markets. Globally, the increase inoil demand, which would be dependent largely onthe strength of the global economic recovery, isexpected to be modest relative to supply. Similarly,export prices of LNG are expected to decline in 2002in tandem with the downward trend in oil prices.Consequently, mineral exports are anticipated todecline by 32.1% in 2002.
The lower current account surplus would reflectentirely the widening of the services deficit to
3.6% of GNP and the income account deficit to8.5% of GNP. A recovery in exports would betranslated into higher payments for freight andinsurance and consultancy services as well asincreased outflows related to profits and dividendsrepatriation by non-resident companies. However,sustained receipts in the travel account as well ashigher earnings from port charges and educationare expected to support the services account. Withthe strategy to broaden and diversify the tourismmarket to new markets such as West Asia, Indiaand China, the number of tourist arrivals isexpected to remain high.
The financial account is expected to be supportedby sustained inflows of long-term capital includinghigher inflows of foreign direct investment in 2002.In March 2002, the Government tapped theinternational bond market by issuing US$750 millionNotes to take advantage of favourable marketconditions and low interest rates. Nevertheless,the official sector is expected to record a smallnet outflow due to high loan repayments by theNFPEs following the maturity of several bonds raisedin the 1990s.
In view of the recovery in global economic conditions,inflows of foreign direct investment (FDI) are
96
2001p
RM billion
2002f
Table 3.8Exports and Imports
Gross exports 334.4 349.1(% change) -10.4 4.4
Manufactures 285.3 303.8(% change) -10.3 6.5
Minerals 23.4 15.9(% change) -12.6 -32.1
Agriculture 20.0 23.6(% change) -13.2 18.2
Gross imports 280.7 294.1(% change) -9.9 4.8
Capital goods 43.7 44.2(% change) -1.1 1.2
Intermediate goods 201.8 214.7(% change) -13.3 6.4
Consumption goods 17.6 18.7(% change) 3.0 6.3
p Preliminaryf Forecast
Source: Department of Statistics, Malaysia and Bank Negara Malaysia

Outlook and Policy
97
expected to be higher with projected inflows ofequity from strategic alliances as well as inflows forexpansion and new investment in the manufacturing,services and oil and gas sectors. The investmentincentives announced in the 2002 Budget, includingthe extension of the reinvestment allowance periodfrom 5 to 15 years as well as the Government’scommitment to continue to provide the special Pre-Packaged Incentives, are also expected to attract highvalue-added FDI. The improved prospects for theeconomy would also encourage greater portfolioinflows. However, it is difficult to forecast themovement of short-term capital flows, given thatthese flows tend to be volatile, responding to specificevents and short-term sentiments.
The external debt outstanding is expected todecline to RM167.9 billion (US$44.2 billion) as at end-2002, equivalent to 52% of GNP, reflecting thedecline in debt of NFPEs and the private sector. Theexternal debt of the NFPEs is expected to decline withthe maturity of several bonds raised in the 1990s.Similarly, the external debt of the private sector isalso expected to decline, due to prepayments ofloans by companies as part of their corporaterestructuring exercises. Meanwhile, the FederalGovernment debt is expected to increase, due to newloans raised in the international capital markets and
the drawdown of loans committed under theMiyazawa Initiative. The debt service ratio is expectedto improve to 5.3%.
MANAGEMENT OF THE ECONOMY IN 2002
As economic recovery is expected to be modest,macroeconomic policies would continue to reinforcethe counter-cyclical macroeconomic measuresalready in place to support domestic sources ofgrowth. In an environment of low inflation, monetarypolicy can continue to remain accommodative in2002. Loan growth is expected to expand in tandemwith recovery. As the emphasis is on the creation ofan environment of stability and predictability, thethrust of policies would be directed at maintainingstrong fundamentals to support the fixed exchangerate regime.
In line with the stated intent to consolidate the fiscaldeficit in 2002, the fiscal stimulus is expected to beless expansionary at –5.1% of GDP (–5.5% in 2001).Given the high flexibility of fiscal policy, theGovernment is in the position to further increaseexpenditure to stimulate economic activity, should theneed arise. As consolidation would enhance long-term stability, there is strong commitment to meet theEighth Malaysia Plan target of fiscal balance by 2005.In managing the fiscal position, appropriate stepswould be taken to ensure that the Government’sfinancing requirements would not result in anycrowding out effects. Further, priority would continueto be accorded to maintaining the FederalGovernment debt at a low level (now amounting to43.8% of GDP).
In an environment of increased liberalisation in theglobal market place, policy focus in 2002 wouldessentially centre on ensuring that policyimplementation is carried out in a consistent andefficient manner to effectively manage theincreased competitive pressures. In this regard,structural adjustment efforts will be intensified ascontinued commitment to structural policies isenvisaged to contribute to building confidence andhelp in lifting any constraints on macroeconomicpolicy options and their effectiveness. In line withthe broader spectrum of policies outlined in theEighth Malaysia Plan (2001-2005) and the ThirdOutline Perspective Plan (2001-2010), measures thatwill be implemented in 2002 are expected tocontribute to improving the business environmentthrough not only demand side measures, but, alsosupply side initiatives. In this regard, strategies are
Table 3.9External Debt
Medium and long-term 146.4 144.5 86 86
Public sector 90.9 90.4 53 54Federal Government 24.3 29.9 14 18NFPEs 66.5 60.6 39 36
Private sector 55.6 54.1 33 32
Short-term 23.3 23.3 14 14Banking institutions 12.1 12.1 7 7Non-bank private sector 11.3 11.3 7 7
Total External Debt 169.8 167.9 100 100US$ equivalent 44.7 44.2
% of GNP Total debt 55.4 52.0Medium and long-term debt 47.7 44.7
Debt service ratio (%)Total debt 6.2 5.3Medium and long-term debt 5.8 5.0
Note: With effect from 2001, the external debt of MAS has been reclassified asNFPEs debt. Prior to 2000, it was classified as private sector debt.
p Preliminaryf Forecast
Source: Ministry of Finance, Malaysia and Bank Negara Malaysia
2001p 2002f
%shareRM billion
2001p 2002f

targeted to realise the full potential of the servicessector, promote the development of small- andmedium-scale enterprises, further improveproductivity levels and ensure that the incentivestructure remains favourable to both foreign anddomestic investors.
Services sector: In view of its strong linkages withthe other sectors of the economy and its strategicimportance in supporting the structuraltransformation of Malaysia to the New Economy,policies also target the acceleration of the
development of the services sector as the secondengine of growth. In this regard, in 2002, the Government would undertake in-depth studies onmaximising the potential of the health, education andtourism sub-sectors as sources of foreign exchangeearnings. Specifically, measures would concentrate onboosting health-tourism and further developing theeducation industry to establish Malaysia as a regionaleducation center of excellence as well as promotingMalaysia as a destination for potential tourists from awider range of new markets.
Tourism: In further promoting the tourism sub-sector, the 2002 Budget introduced severalmeasures, which include increasing the allocation tothe Tourism Fund from RM200 million to RM400million, extending the existing tax incentives foranother five years to tour operators organisingdomestic tours for foreign and local tourists andgranting of excise duty exemption on the purchaseof national cars to car rental operators. Indeveloping leisure cruising as a tourism product, theGovernment has allocated RM5.4 million for theconstruction of marinas and announced an incometax exemption of 100% for a period of five yearson income derived by companies providing charterservices of luxury yachts and motorboats. Apartfrom continuing to host major cultural, sporting andbusiness events in Malaysia, measures are already inplace to establish Malaysia as a regional shoppinghaven by 2003.
Financial sub-sector: As the banking institutions’merger programme has taken place against abackdrop of significant improvements in bankingsystem balance sheets, the focus of financial policy in
2002 will be placed on meeting the objectives set outin the first phase of the Financial Sector Master Plan(FSMP). This involves enhancing the capacity of thebanking groups by benchmarking, strengtheningskills, strengthening corporate governance,encouraging new delivery channels and promotinggreater operational flexibility so as to become moreefficient and effective. Also, measures to be takenduring the year would include developing minimumstandards for the management of market risk forbanking institutions; streamlining guidelines, bestpractices and examination requirements of exempt
dealers and stockbroking companies; extending theprudential regulatory framework to include holdingcompanies of banking institutions and theirsubsidiaries; and strengthening the regulatoryframework for investment banks. In the capitalmarket, listed companies with unsatisfactory financialpositions or with issued capital below the minimumthreshold will be given an extension up to December2002 to comply with the listing requirements of theKuala Lumpur Stock Exchange (KLSE) that wereissued in 2001.
In further expanding the enabling environment tosupport economic activity, the Bank will intensifyefforts to promote the role of development financialinstitutions (DFIs) to complement that of thebanking system. The Development FinancialInstitutions Act 2002 (DFI Act), which came intoforce on 15 February 2002, was formulated toprovide a comprehensive and effective regulatoryframework for DFIs, with emphasis on the safetyand soundness of financial and operationalconditions. In this regard, measures for the yearwill focus on strengthening the regulatoryframework and building institutional capacity ofthe DFIs, as outlined in the FSMP. Overall,measures aim to realign the functions of DFIs so asto enable the institutions to contribute strategicallyto the economy.
As with the conventional banking sector, theregulatory framework and the operational structureof the Islamic banking institutions will be furtherstrengthened to enhance resilience. The IslamicBanking Act, 1983, and the Banking and FinancialInstitutions Act, 1989, are being reviewed, whilst
98
Macroeconomic policies are in place to support the recovery. Thepolicy focus is to enhance competitiveness to achieve high qualitybalanced growth.

Outlook and Policy
99
focus is placed on enhancing the structure ofIslamic banking institutions. Regulatory measuresand promotional efforts are expected to support theIslamic banking industry in capturing a moresignificant market share of approximately 9%(2001: 8.2%) relative to the total assets of thebanking system. Moreover, further advancementof Islamic banking and finance on the internationalfront is envisaged. A key development in thisregard would be the standardisation andharmonisation of prudential standards for Islamicbanking and finance under the Islamic FinancialServices Board which will be set up in 2002.
In the insurance industry, the capitalisation ofinsurers continued to strengthen further followingthe increase in the minimum statutory requirementto RM100 million with effect from 30 September2001, which also advanced the consolidation of theindustry. As at end-January 2002, seven mergerand acquisition proposals involving 13 insurers wereat various stages of implementation. The ongoingconsolidation of the insurance industry, which isexpected to continue into the year 2002, willcreate progressively stronger and economicallyviable insurers, and hence, result in the increasedresilience of the industry. In protecting consumerinterests, specific measures targeted for 2002entail the adoption of ‘best advice’ practices andthe introduction of independent financial advisersto enable Malaysian consumers to obtainprofessional independent advice on financialoptions. Specific performance measures andbenchmarks are also being developed by the Bankto assess the progress achieved by the insuranceindustry in relation to the objectives andrecommendations outlined in the FSMP.
Small- and medium-scale enterprises (SMEs): Inmeeting the challenges of a global environment, acoherent strategy is being developed to enable theSMEs to provide the critical linkages in the developmentof a broad-based economy. The Bank had, inDecember 2001, initiated a comprehensive study onlocal SMEs to identify their needs and thus, match theirrequirements at each stage of the business cycle, inareas such as financing, training, management,marketing intelligence and IT development. Theinfrastructure and business support for SMEs willprovide a holistic and focused strategy that wouldmake SMEs viable regional and global players that arevalue-focused, customer-driven, speed-oriented,information-based, cross functional, flexible andnetworked. The strategy will focus on three main areas:
enhancing their production efficiency and effectiveness,encouraging production of high quality, differentiatedand high value-added products that meet worldstandards and promoting innovation and creativity.
Productivity: As competition in the global andregional markets will intensify with increased WTOand AFTA commitments, productivity enhancementbecomes central to Malaysia’s economic growth andcompetitiveness, given that Malaysia can no longeroffer a cheap labour market. Measures are already inplace to transform the economy to a productivity-driven economy that is characterised by knowledgeworkers. These measures include improving theinfrastructure support to promote productivity growthand providing tax incentives to the private sector toreduce the cost of their transition from investment- toproductivity-driven strategies.
Overall, the Government would remain committed toensuring that Malaysia continues to offer a cost-competitive and viable location to both foreign aswell as domestic investors. Efforts to constantlyevaluate the incentive structure for competitivenesswill continue, as with the further upgrading of thephysical and administrative infrastructure to meetworld-class standards. In order to encouragereinvestments, the Government, in the 2002 Budget,has extended the Reinvestment Allowance periodfrom five to 15 consecutive years, commencing fromthe year the first reinvestment is made. A number ofother key incentives introduced comprised taxmeasures to benefit, amongst others, the machineryand equipment industry, downstream activity in theresource-based sector (rubber, oil palm, timber andfood-based industries) and manufacturing-relatedservices (integrated logistics, marketing support andutility services).
In order to complement the semiconductor andelectronics sub-sector, the list of promoted activitiesand products for high-technology companies has beenexpanded by the Government to include advancedelectronics, biotechnology, electro-optics and non-linear optics, advanced materials, optoelectronics,software engineering, alternative energy sources andaerospace. Increased collaborative programmesbetween local universities and the Multimedia SuperCorridor (MSC) with industries will be encouraged tocreate a platform for research in the various promotedareas. In essence, the Government will seek tomaximise the contribution of both the educationsystem and business sector to develop a moreenterprising culture.

As efforts will remain focused on enhancingstructural changes in the economy with strongemphasis on knowledge-content activities andproduct innovation, the economy will continue topresent a range of opportunities to both local andforeign investors in traditional as well as newgrowth sectors. In terms of FDI, higher value-addedindustries and high quality investments will beencouraged into the country in order to bedifferentiated in the global market. TheGovernment’s stance is that FDI should not onlyincrease the nation’s stock of capital, but, also playa role in increasing the nation’s competitiveness byraising productivity. Hence, priority will be accordedto the promotion of investments into the MSC andin the manufacturing and services industries thatinvolve specialised technology, high intellectualcapital, low import content and increasing returns.In addition, strategic alliances that are mutuallybeneficial in terms of value creation and deliverywill be encouraged, particularly in sectors such asenergy, ports, finance, as well as the nationalairlines and car industry.
Amid increased dynamics of global marketintegration, Malaysia’s export promotion strategy willbe to sustain market shares in traditional markets,whilst conscientious efforts are made to matchspecific Malaysian products and services with therising and more diversified consumer needs inemerging markets. Tax incentives also favourMalaysian international trading companies andcompanies engaged in the export of services.Expenses related to the export promotion of goodsand services as well as expenses incurred inregistering patents overseas are given special taxtreatment. Particular attention was also given to thepromotion of Malaysian brands in internationalmarkets, so that export competitiveness is not basedon prices alone, but also on the level of technologyand brand recognition.
Given the developments on the external front,economic management in 2002 will focus on abroad comprehensive framework for Malaysia toincrease its competitive edge to ‘stay ahead of thecurve’. In managing the impact of more intensecompetition, sound macroeconomic policieswill be complemented by structural policies tobuild on existing capacity and raise long-termproductivity growth. Besides directing attentionto the entire business cycle in terms of itscontext and perspective, structural changesessentially aim to deliver internal adjustments
and focus on core complementarities forsustainable growth.
MONETARY POLICY IN 2002
In 2002, monetary policy will remain accommodativein order to provide a conducive environment tosupport the economic recovery process. This policystance is based on the assessment that the balance ofrisks is biased toward a modest recovery in economicactivities in Malaysia. With domestic inflationremaining subdued, monetary policy will continue tobuild on gains from the cumulative monetary easing,initiated since 1998, to ensure that the economicrecovery process becomes well entrenched. On theexchange rate front, the focus of policy is to ensurethat economic fundamentals continue to support thepegged exchange rate.
The monetary policy stance in 2002 will continue tobe influenced by global and domestic developments.On the external front, indications are that the US-ledglobal recovery would be modest in 2002. Theprospects for world trade and the global electronicdemand have also improved. It is expected that theUS domestic policies would remain supportive ofpromoting economic recovery, especially instrengthening consumer and business confidence.Notwithstanding these positive signs of imminentstronger recovery, several downside risks remain,including the sustainability of consumption in the USand the significant movement in the majorcurrencies, which could affect the recovery process.Against this external environment, the Malaysianeconomy is expected to register a modest growth.Inflation, however, is expected to rise onlyslightly given the excess capacity in several sectors inthe economy.
Given the prospects of modest economic growthand low inflation, the basic thrust of monetarypolicy will continue to be directed at nurturing therecovery in domestic economic activity. Recognisingthe lags between implementation and effects ofpolicy, there are significant advantages inmaintaining the current accommodative stance wellinto the period of economic expansion. Asinflationary expectations do not appear to be a riskin the near term, there would be greater flexibilityfor this accommodative policy stance.
The conduct of monetary policy in 2002 will,therefore, focus primarily on four keyconsiderations. Firstly, monetary policy will aim to
100

Outlook and Policy
101
maintain a stable and predictable operatingenvironment in order to facilitate business activity.It is also recognised that the maintenance ofmacroeconomic stability requires close co-ordination between monetary, fiscal, and structuralpolicies. Monetary policy will continue to leverageon areas of strong complementarity that existsbetween these policies to ensure an optimal policymix. In this regard, with the improved prospectsfor economic recovery, the maintenance of thecurrent accommodative monetary policy stanceamid a subdued inflationary outlook allows fiscalconsolidation to take effect in 2002. This will helpto position the economy to take full advantage ofthe global recovery when it takes place, and at thesame time, enhance our ability to absorb anyshocks in the event the actual outturn is weakerthan anticipated.
Secondly, the conduct of policy is guided by the needto ensure that the level of interest rates continues toremain supportive of economic activities. Since theIntervention Rate cut on 20 September 2001, externaldevelopments have been generally more positive onthe prospects for global growth. This, coupled withthe fact that the cumulative effects of the previousmonetary easing have not been fully manifested, hasreduced the need for a further easing of monetarypolicy at this juncture. BNM, nonetheless, monitorsall indicators and developments, both domestic andexternal, that could heighten the macroeconomicrisks towards further economic weakness.
The third consideration is the need to ensure aneffective transmission mechanism from the policyrate to retail rates, in order to precipitate a fasterresponse to the counter-cyclical policy measures. Inan uncertain environment, the normal marketprocess of adjustment may not always function atthe desired level of efficiency, particularly at a timewhen the banking industry is undergoingconsolidation. In this regard, the current BLRframework (implemented in 1998) which is basedon the Intervention Rate as the anchor rate,continues to serve its purpose in fostering aneffective transition to lower lending rates.Although this arrangement entails some trade-offs,evidenced in the divergence between the 3-month
Intervention Rate and the 3-month interbank rate, itdid not create any risk that could undermine thelong-term objectives of macroeconomic policy.
It should also be emphasized that such anarrangement does not represent a departure fromBNM’s long-term objective to move toward amarket-based approach. Nor does it precludebanks from pricing their loans lower than thecomputed BLR to remain competitive. Byenhancing the effectiveness of the monetary policymechanism under the current environment, this hasallowed banking reforms to proceed smoothly andmeasures to improve the efficiency of the financialmarkets to be implemented. As a long-termobjective, BNM remains committed to liberalisingthe BLR framework and interest rate structure asoutlined in the Financial Sector Masterplan. This
represents an integral part of the overall shifttoward a more market-oriented approach thatwould further improve efficiency in the transmissionmechanism of monetary policy.
A further consideration is to ensure the availability offunds to support the identified priority sectors. Stepshave already been taken to improve access to creditby the SMEs, the agriculture sector and otherstrategic sectors under the special funds. At the sametime, efforts to develop alternate modes of financingwill be intensified to support the financingrequirements of a knowledge-based economy, as partof the overall effort to enhance the long-termcompetitiveness of the economy.
Success in sustaining the economic recovery,nevertheless, is premised on two critical factors:market response to counter-cyclical policy measures;and the extent of policy flexibility accorded tomonetary policy management. The currentassessment is that both consumers and corporationshave remained responsive to policy measures.There are currently no “trigger” factors that maylead to a structural change in consumer behaviourand render monetary policy less effective. These“trigger” factors include prolonged deflationarytendencies associated with a boom-bust assetmarket cycle, and falling consumer and producer
Monetary policy will remain supportive of economic growth. Lowinflation and stronger macroeconomic fundamentals help to sustain the exchange rate regime and allow monetary policy to remainaccommodative.

price indices. Instead, demand for personal loans,notably mortgage and car loans, has remainedelastic to interest rates.
Consumption continues to be supported by stableemployment and income prospects as well asfavourable household balance sheets. Unemploymentrates remain low while the net asset position remainsstrong due to high personal savings and stable propertyand equity prices. Aided by the CDRC, corporationshave also reacted positively, taking advantage of thelow interest rates to consolidate, restructure and cuttheir business costs to stay competitive in a period ofreduced business demand. The accommodative policywill therefore continue to provide a positiveenvironment for the restructuring and reform process.Corporations will also be in a better position to takeadvantage of the economic recovery.
At the same time, BNM continues to have policyflexibility that will enhance the scope for monetarypolicy to adjust appropriately to changing trends thatcould potentially undermine the growth momentum.Underpinning this policy flexibility is the strengtheningof macroeconomic fundamentals. Notably, lowinflation and the wide interest rate differentials withthe US in favour of Malaysia will continue to accordpolicy flexibility. On the whole, improvedmacroeconomic fundamentals have helped toincrease the tolerance of ringgit to higher degrees ofvolatility in the foreign exchange market. This hasallowed BNM to continue to pursue a pragmatic andflexible monetary policy in order to promote domesticdemand.
Looking ahead, the most critical challenge lies inanticipating cyclical economic developments andturning points. In the current environment, correctdiagnosis of the strength or weakness of recoverywould allow BNM to build an appropriate degree ofstimulus and pursue front-loading and pre-emptivepolicy responses. Ensuring monetary policyresponse that is appropriate in terms of timing andmagnitude is important in order to achieve thedesired results.
Another challenge is managing potential risks thatcould emerge in the system. In this regard, BNM willmonitor closely the lending and investment activities ofthe banks to ensure that they do not create risks in thesystem. BNM will also ensure that the underlyingliquidity situation would support the expansion ofeconomic activity without stimulating inflationarypressures. To achieve this, BNM has the option to either
release the large pool of funds currently parked withBNM by the financial institutions, or to mop up excessliquidity through its market operations, depending onfactors affecting the supply and demand for funds.
On the exchange rate front, policy will focus onensuring that the pegged exchange rate remainssustainable and continues to benefit trade andinvestment. For a small open economy, theexchange rate has always been an important priceto Malaysia, as it could affect confidence, pricestability and long-term internationalcompetitiveness. It has, therefore, always beenMalaysia’s long-held policy not to resort toexchange rate changes to gain competitiveadvantage, nor to respond to transient and short-term currency movements that could easily bereversed. Policy to maintain internationalcompetitiveness has been implemented throughefficiency and productivity gains, rather than byrelying on the exchange rate. Indeed, the benefitsderived from the pegged exchange rate regimehave been significant in terms of promoting tradeand investment. The stability in the exchange rateitself, has also facilitated corporate restructuringand financial reforms.
Under these circumstances, continuouscommitment towards ensuring that fundamentalssupport the exchange rate will ensure that theexchange rate system will continue to generatesignificant benefits to the economy. There are noviable alternatives to sound policies and strongmacroeconomic fundamentals to sustain theexchange rate. Therefore, macroeconomic policieswill continue to be directed towards sustainingunderlying economic fundamentals and ensuringthat domestic sector remains sufficiently flexible todeliver the necessary internal adjustments tostrengthen competitiveness.
FISCAL POLICY IN 2002
The 2002 Budget which was presented toParliament on 19 October 2001 aimed atstrengthening economic growth through increasingdomestic demand, strengthening the private sector’sresilience and competitiveness, diversifying thesources of growth and ensuring a more equitabledistribution of wealth. While the Malaysianeconomy was expected to register a gradual andmodest growth following the gradual recovery inexternal demand, it was recognised that sustainingdomestic demand continued to be necessary given
102

Outlook and Policy
103
the downside risks to the global economic recovery.In this environment of uncertainty, fiscal policywould remain expansionary in 2002 to strengthenthe economic recovery process.
In line with the objective of fiscal prudence,consolidation of the budget deficit would begin in2002 with a less expansionary fiscal policy. TheGovernment, therefore, budgeted for a lower fiscaldeficit of –5.1% of GDP (-RM18.8 billion), comparedwith the estimated fiscal deficit for 2001 of –6.5% ofGDP (-RM22.4 billion). However, due to a strongerrevenue performance, the actual outturn for thefiscal deficit in 2001 was lower than budgeted, at–5.5% of GDP (-RM18.4 billion). Based on revenueforecast for 2002 in the 2002 Budget, fiscalconsolidation as envisaged in the 2002 Budget isexpected to be on track.
The fiscal deficit for 2002 would be kept at amanageable level to strike a balance between theshort-term objective of supporting growth and thelong-term policy of fiscal sustainability. The fiscaldeficit in 2002 is not expected to create risks to theeconomy, as Malaysia’s economic fundamentalscontinue to remain strong. The fiscal expansion isnot anticipated to result in higher inflation given theexcess capacity in the economy. Similarly,Government spending is not expected to lead toleakages as most of the expenditure is expected tohave minimal import content.
Expenditure allocation would continue to focus onprogrammes and projects that would have highmultiplier effects on domestic activity and raise thelong-term productivity of the economy. In terms ofdevelopment allocation, emphasis continues to beaccorded to the social services sector, notablyeducation and training. Higher priority was also placedon agriculture and rural development, reflecting theGovernment’s policy to revitalise the agriculture sectoras the third engine of growth. Infrastructure andindustrial development focusing on small and medium-scale enterprises and the development of e-commercewere also given special attention.
In addition, the fiscal package also contained bothtax and non-tax measures directed at stimulatingeconomic activities. Measures to encourageconsumption through increasing disposableincomes included the reduction in personal incometax rates between 1 to 2 percentage points to 0-28% as well as the 10% salary adjustment forcivil servants.
Besides addressing the immediate objective ofenhancing consumption, the Budget continued toemphasise the longer-term objective of increasingcompetitiveness to sustain growth. Wide-rangingfiscal incentives were directed at promotinginvestment in resource-based activities and theservices sector, as well as development of skills tomeet the needs of a knowledge-based economy.Among others, measures to encourage investmentincluded the extension of reinvestment allowance to15 years (from 5 years) and tax exemptions forcompanies involved in machinery and equipment,food production, as well as for reinvestment in theproduction of rubber, oil palm and timber. Fiscalincentives were also provided to reduce the cost ofdoing business and improve competitiveness. Importduties were either reduced or abolished on a widerange of products. The industrial building allowancewas extended for the purchase of buildings andhotels. Incentives were also directed at encouragingthe use of information and communicationstechnology (ICT) in all economic activities. Severalincentives were also introduced to strengthen thebalance of payments through promotion of tourismand enhancement of exports.
Prudent policies practised earlier have accordedthe Government greater flexibility in implementingexpansionary measures to support growth. Thedeficits since 1998 have been financed throughnon-inflationary sources given the high rate ofdomestic savings and the ample liquidity situation.As such, higher borrowings by the FederalGovernment have not crowded out the privatesector’s access to financing. As in the past, thebulk of the fiscal deficit in 2002 would be financedthrough the issuance of MGS that would beabsorbed mainly by the provident, pension andinsurance funds.
Federal Government debt would continue to becontained at manageable and sustainable levels(43.8% of GDP as at end-2001). Debt servicingremains low (15% of operating expenditure or 2.9%of GDP) and has not been a constraint on fiscalflexibility. Furthermore, the Government’s exposureto foreign exchange risk would be kept low, as thebulk of the Government’s debt would continue to beraised from non-inflationary domestic sources.Currently, 83% of total outstanding debt is indomestic currency. In addition, more than 60% ofthe debt has a maturity of more than 3 years. TheGovernment has always ensured that debt maturityprofiles are of medium- to longer-term maturity and

are adequately spaced out to minimise risks. Withthe economy on the path of recovery and given theGovernment’s target to achieve a balanced budgettowards the end of the Eighth Malaysia Plan period,the ratio of debt to GDP is expected to decline overthe medium term.
As part of the Government’s continuous effortstowards streamlining administrative procedures,reducing red tape and delegating powers, theBudget process was reviewed. Beginning in year2002, the budget preparation and examinationprocess would be carried out once every two yearsinstead of annually. The forward-looking budgetary
process is aimed at making the national Budget amore effective tool in financial management. Inparticular, the administrative change in the budgetprocess would provide greater fiscal flexibility. Itwould take into account both the shorter-termannual fiscal policies and the medium-termobjectives and policies within the context of thefive-year development plans and outline perspectiveplans. Besides ensuring that all allocations areutilised as scheduled, the new process would alsoallow for expeditious budgetary reallocations to beeffected to take into account unanticipateddevelopments in the domestic and internationalenvironment.
104

The Financial Sector
106-109 Sources and Uses of Funds of the Financial System109-127 Management of Banking System127-133 Supervisory Activities128-132 Progress of Implementation of Financial Sector
Masterplan133-135 Progress of Banking Sector Restructuring135-148 Performance of the Banking System148-154 Islamic Banking154-155 Development Financial Institutions155-160 Other Financial Institutions160-177 Financial Markets177-181 Developments in Payment and Settlement Systems

SOURCES AND USES OF FUNDS OF THEFINANCIAL SYSTEM
The total assets of the financial system expanded at aslower pace in 2001, in line with the more moderateeconomic growth. The bulk of its funds was sourcedthrough deposits placed with financial institutions andcontributions to the provident, pension and insurancefunds. As in previous years, the resources weremainly invested in loans and advances and securities.
The moderate increase in the total assets of thefinancial system of 3.5% to RM1,295.2 billionreflected the increases in assets of both the bankingsystem and the non-bank financial intermediaries(NBFIs). As a percentage of GDP, the total assets ofthe financial system rose to 389.4% of GDP from367.1% in 2000. Given the higher growth of theassets of the NBFIs (6.7%), relative to thatexperienced by the banking system (2.1%), thelatter’s share of the total assets of the Malaysianfinancial system declined from 67.8% at the end of2000, to 66.9% at the end of 2001.
Within the banking system, the bulk of the increasein assets was due to the growth in assets of the
commercial banks (including Islamic banks), financecompanies and merchant banks. This reflectedmainly the increase in loans and advances andinvestment in securities as well as deposits with otherfinancial institutions. Meanwhile, assets of the NBFIsaccounted for a higher share of 33.1% of totalfinancial system assets at the end of 2001(32.2% in 2000). The growth in assets of the NBFIswas driven principally by an expansion in the assets ofthe provident, pension and insurance funds(+RM25 billion), which accounted for 92.7% of theincrease in the total assets of this group.
During the year, the bulk of new resources wascontributed by deposits placed with financial institutionsand contributions to the provident, pension andinsurance funds. Though recording a slower growth of2.9% in 2001 (4.3% in 2000), deposits mobilised bythe financial institutions continued to account for thelargest share (45.8%) of the total sources of funds atthe end of 2001 (46% in 2000). Similarly, the bankinginstitutions (comprising commercial banks, financecompanies, merchant banks, and discount houses)continued to be the largest mobiliser of deposits,accounting for 83.4% of total deposits of the financialsystem (84.1% in 2000).
106
The Financial Sector
Bank Negara Malaysia11.6%
Commercial banks40.9%
Finance companies9.4%
Merchant banks3.2%
Discount houses1.8%
Development financeinstitutions
2.2%
Savings institutions2.4%
Other financialintermediaries
5.9%
Provident,Pension andInsurance Funds22.7%
Other provident and pension funds3.1%
Life insurance funds3.7%
General insurance funds1.2%
Employees Provident Fund14.8%
p Preliminary
Total Assets: RM1,295.2 billion
Graph 4.1Assets of the Financial System as at end 2001p (% share)

107
The Financial Sector
In terms of holders, deposits were mainly held bythe non-financial private sector (comprisingindividuals and business enterprises), whichaccounted for 68.6% of the outstanding deposits at
the end of 2001. The deposits of this group grewby 4.4% in 2001, mainly as a result of an increasein deposits by individuals. As in previous years,fixed deposits continued to account for the bulk ofthe increase in deposits placed by the non-financialprivate sector. By maturity, fixed deposits continuedto be concentrated at the shorter-end.
Contractual savings with provident and pensionfunds as well as contributions to insurance fundscontinued to be the major sources of funds for thefinancial system, expanding by 8.4% to account for19.8% of the total funds mobilised by the financialsystem in 2001. Meanwhile, capital and reserves ofthe financial system increased by 3.9% (+6.1% in2000), reflecting mainly the strengthened capitalposition of the banking institutions.
The increase in the total resources of the financialsystem in 2001 was mainly invested in loans andadvances and securities. The growth of total loans and
Capital and ReservesCurrencyDepositsBorrowingsFunds from other financial institutionsInsurance and provident fundsOther liabilities
CurrencyDeposits with other financial institutions
BillsLoans and advances
SecuritiesGold and foreign exchange reserves
Other assets
SOURCES
USES
9.8%2%
45.8%0.6%
5.3%19.8%
16.8%
0.3%13.7%
1.3%41.3%
23.7%8.8%
10.9%
p Preliminary
Total: RM1,295.2 billion
Graph 4.2Sources and Uses of Funds of the Financial Systemas at end 2001p (% share)
Table 4.1Assets of the Financial System
Banking system 27.5 17.5 865.9 Bank Negara Malaysia 1.9 0.8 149.7Commercial banks1 29.8 5.6 529.5Finance companies -4.4 4.2 121.7Merchant banks -2.3 4.2 41.1Discount houses 2.6 2.7 23.8
Non-bank financial intermediaries 42.6 26.9 429.3 Provident, pension and insurance funds 27.8 25.0 294.3 Employees Provident Fund 18.1 6.0 191.1 Other provident & pension funds 3.1 8.6 40.3 Life insurance funds 6.1 9.2 47.6 General insurance funds 0.6 1.2 15.3
Development finance institutions2 3.4 2.8 27.9 Savings institutions3 7.0 -1.5 30.7 Other financial intermediaries4 4.4 0.7 76.3
Total 70.1 44.4 1295.2
1 Includes Bank Islam Malaysia Berhad and Bank Muamalat Malaysia Berhad (since 1999).
2 Includes Malaysian Industrial Development Finance Berhad (MIDF), Bank Pertanian Malaysia, Borneo Development Corporation, Sabah Development Bank Berhad, Sabah Credit Corporation, Export-Import Bank Malaysia Berhad, Bank Pembangunan dan Infrastruktur Malaysia Berhad and Bank Industri dan Teknologi Malaysia Berhad.
3 Includes National Savings Bank, Bank Kerjasama Rakyat and co-operative societies.
4 Includes unit trust (ASN, ASB, ASW2020, ASN2, ASM (Malaysia) and ASM Mara), building societies, Credit Guarantee Corporation, Cagamas Berhad, leasing companies, factoring companies and venture capital companies.
p Preliminary
As atend
2001p
RM billion
2001p2000
Annual change
Table 4.2Sources and Uses of Funds of the FinancialSystem
Sources:Capital and reserves 7.1 4.7 126.7 Currency -3.8 -1.3 25.4 Deposits1 23.9 16.8 592.6 Borrowings -0.4 -0.2 7.3 Funds from other financial institutions1 -3.3 0.5 68.9
Insurance and provident funds 23.1 20.0 257.1 Other liabilities 23.5 3.9 217.2
Total 70.1 44.4 1295.2
Uses:Currency -2.4 -2.1 4.5 Deposits with other financial institutions 5.3 -6.3 178.0
Bills 0.1 -0.3 16.3 Treasury 0.6 -0.2 4.0 Commercial -0.4 -0.1 12.2
Loans and advances2 24.6 20.5 534.7 Securities 35.4 36.7 306.8
Malaysian government 12.6 14.1 101.6 Foreign 0.3 0.9 2.7 Corporate 19.9 22.3 195.7 Others 2.6 -0.7 6.9
Gold and foreign exchange reserves -3.9 3.7 113.5 Other assets 11.2 -7.9 141.3
1 Effective 1998, the statutory reserves of banking institutions have been reclassified as “Funds from other financial institutions” rather than “Deposits”. In this regard, data from prior years have also been revised accordingly.
2 Excludes loans sold to Danaharta.p Preliminary
Asat
end2001p
RM billion
Annual change
2000 2001p

advances was sustained at RM20.5 billion or 4% in2001 (+RM24.6 billion or 5% in 2000) despite the lowerreal GDP growth. The sustained loan growth was duemainly to increased demand from the household sector.
This was reflected in the higher loans extended for thepurchase of residential property and passenger cars.
Investment in securities by the financial systemcontinued to expand in 2001, recording an increase of13.6%. In particular, there were marked increases ininvestments in corporate (+RM22.3 billion) andgovernment securities (+RM14.1 billion), in line with theincrease in the issuance of both PDS and MGS as well asmarket expectations of lower interest rates whichencouraged investors to acquire debt securities.
108
Others4.1%
Discount houses1.3%
National Savings Bank2.6%
Commercial banks74.3%
Finance companies15%
Merchant banks2.8%
Repos4.6%
NIDs0.4%
Savingsdeposits14.4%
Demand deposits14.3%
Fixed Deposits66.2%
Up to1 year58.3%
More than1 year7.9%
By InstitutionsTotal Deposits: RM406.5 billion
By Types of DepositsTotal Deposits: RM406.5 billion
p Preliminary
Graph 4.3Non-Financial Private Sector Deposits with the Financial Systemas at end 2001p (% share)
Table 4.3Non-Financial Private Sector Deposits1 with theFinancial System2
Deposits3 with:Commercial banks 37.5 14.3 301.8 Finance companies -0.9 2.6 60.8 Merchant banks 2.9 -2.4 11.3 Discount houses 1.3 0.0 5.3 National Savings Bank 3.4 0.1 10.6 Others 3.1 2.3 16.6
Total 47.3 17.0 406.5
Demand deposits 14.8 2.1 58.1 Fixed deposits 21.9 9.2 269.1 Savings deposits 10.2 4.0 58.6 NIDs4 0.0 -1.1 1.8 Repos5 0.4 2.8 18.8
Fixed depositsof which:
Up to 1 year 10.6 6.6 237.0 More than 1 year 11.4 2.6 32.2
1 Refers to deposits of the business enterprises (excluding NFPEs) and individuals.
2 Excludes provident, pension and insurance funds, and other financial intermediaries.
3 Refers to demand, savings and fixed deposits, negotiable instruments of deposits and repos.
4 Refers to negotiable instruments of deposit.5 Refers to repurchase agreements.p Preliminary
As atend
2001p
RM billion
2001p2000
Annual change
Table 4.4Direction of Credit1 to the Non-Financial PrivateSector
Loans and advances 22.9 21.6 501.1 Agriculture 2.7 0.3 13.7 Mining and quarrying 0.0 -0.1 1.3 Manufacturing 1.6 -1.2 55.8 Housing 13.2 12.8 111.1 Construction2 -3.3 1.8 84.1 Business services -0.9 1.4 21.8 General commerce 0.9 0.8 19.4 Transport and storage 0.1 -0.9 13.4 Purchase of shares 0.0 -2.4 20.5 Consumption credit 7.4 9.6 68.3 Others 1.0 -0.4 91.7
Investments in corporate securities 16.0 22.3 195.7
Total 38.9 44.0 696.8
1 Excludes credit to non-financial public enterprises.2 Includes loans for real estate.p Preliminary
RM billion
Annual change
2001p2000
As atend
2001p

Financial Sector
Provident and pension funds continued to be the maininvestors in securities, accounting for 41% of theincrease in investments in securities. Having declined inthe previous year (-RM3.9 billion), gross holdings of goldand foreign exchange reserves turned around to record amarginal increase of RM3.7 billion in 2001, mainly onaccount of the repatriation of export proceeds fromabroad and inflows of foreign direct investment.
MANAGEMENT OF BANKING SYSTEM
The strategies implemented in 1999 and 2000 tostrengthen the banking sector continued to be pursued
in 2001 aimed at strengthening the ability of thebanking sector to operate in a more competitive andincreasingly difficult economic environment. Inparticular, efforts to restructure the large corporatesector debts were intensified during the year. Thepositive results achieved through the institutionalarrangements put in place by the Government duringthe financial crisis have also succeeded in minimisingthe impact of the economic slowdown on the overallhealth of the banking system. Despite the adverseimpact of the events on September 11 on the worldeconomy and its consequent impact on the Malaysian
economy, the Malaysian banking sector remainedresilient and was able to play its intermediation roleefficiently and effectively throughout the year. Totaloutstanding loans of the banking system continued torecord positive growth of 3.4%, whilst the preliminaryunaudited pre-tax profit of RM7.5 billion for thecalendar year 2001 can be expected to furtherstrengthen the capital base of the banking system, thusenhancing further its capacity to meet futurechallenges. The thrust of the banking policiesthroughout the year were therefore aimed at preservingthe integrity and maintaining the resilience of thebanking system amidst a more challenging environment
as well as building the necessary foundations for thelong term development of the banking system toeffectively meet the needs of a changing economy asenvisaged in the Financial Sector Masterplan. With theincreased resilience of the banking sector, BNM hasshifted its focus from managing banking sectorproblems to medium and longer term efforts towardsdeveloping a more robust financial system.
Developments in 2001The restructuring efforts undertaken since thefinancial crisis have placed the banking sector on a
109
Despite the adverse impact of the events on September 11 on theworld economy and its consequent impact on the Malaysianeconomy, the Malaysian banking sector remained resilient and wasable to play its intermediation role efficiently and effectivelythroughout the year.
Investmentin corporate
securities28.1%
Loans & advances71.9%
Agriculture2%
Manufacturing8.0%
Mining & quarrying0.2%
Housing15.9%
Construction12.1%
Consumption credit9.8%
Others13.2%
Business services3.1%
General commerce2.8%
Transport and storage1.9%
Purchase of shares2.9%
Total Credit: RM696.8 billion
p Preliminary
Graph 4.4Direction of Credit to the Non-Financial Private Sectoras at end 2001p (% share)

stronger footing to withstand further pressures and tocontribute towards macroeconomic stability. Thevarious prudential and developmental measuresintroduced earlier have also helped to enhance thebusiness and risk management practices withinbanking institutions. Close regulatory and supervisoryoversight on the banking institutions will neverthelesscontinue to be maintained. Banking institutions arenow subjected to more rigorous stress testing and arerequired to submit more detailed statistics to identifyareas of potential vulnerabilities. BNM also conductsregular dialogues with banking institutions tofacilitate the formulation of pre-emptive policies thatwould contribute towards minimising the impact ofthe economic slowdown on the banking system andto preserve the soundness of the banking sector. Onepotential area of vulnerability that needed to beaddressed was the resolution of the large corporatedebts and its impact on the health of the bankingsector. To facilitate this process, the corporate debtrestructuring framework under the Corporate DebtRestructuring Committee (CDRC) was revamped toaccelerate the pace of corporate debt restructuring inMalaysia. Borrowers and creditors were subject tomore stringent and definitive timelines in the debtrestructuring process to ensure that they complete theresolution process within the shortest timeframe. Themembership of the Steering Committee was alsoexpanded to include representatives from PengurusanDanaharta Nasional Berhad and the Federation ofPublic Listed Companies. Operational restructuringwas undertaken together with financial restructuringto ensure the viability of the debt restructuringscheme. Significant progress has been achievedfollowing this revised framework, with the resolutionof a number of debt restructuring cases, including thedebts of three large corporates. CDRC had targetedto resolve 10 cases with total debts of RM10.2 billionbetween 1 August 2001 and 31 December 2001. Asat 31 December 2001, CDRC has successfully resolvedeight of these cases, with debts accounting for83.5% of the total targeted amount of debts to beaddressed. In total, CDRC has successfully resolved11 cases in the year 2001, involving debts amountingto RM11.9 billion. With stronger economic recoveryenvisaged in 2002, CDRC is well placed to meet itstarget to complete the restructuring of the remainingcases by July 2002.
The merger programme for domestic bankinginstitutions that was initiated in 1999 and concluded in2000 succeeded in consolidating the fragmenteddomestic banking sector without causing disruptions tothe provision of banking services. In 2001, the focus of
the domestic banking groups was to complete thebusiness integration processes and rationalisationexercises. This formed the most critical aspect of themergers. The banking groups would not be able to reapthe benefits of mergers and attain higher levels ofeconomies of scale, synergies and efficiency withoutrationalising their business operations and removingduplications in resources. Therefore, all banking groupscapitalised on the opportunity to reorganise, rationaliseand restructure their business operations, including theirbranch network and staff requirements, in line withtheir future business strategies. By the end of 2001, allbanking groups had conducted their branchrationalisation exercise and five banking groups hadrationalised their workforce. All the staff rationalisationexercises were conducted on a voluntary basis. Affectedstaff were granted the opportunity for various optionsof redeployment to other suitable business divisions, orto opt for the voluntary separation schemes. For thosewho opted for the latter, they were adequatelycompensated. The compensation schemes wererelatively consistent across banking groups. Staff werealso given the opportunity to participate in a re-skillingprogramme, aimed towards enhancing their skills inalternative areas of businesses, thereby facilitating theirsmooth transition into other segments of the economy.As a result of the rationalisation exercises during theyear, 187 branches were closed, whilst 55 brancheswere relocated and a total of 4,240 staff left thebanking industry.
All banking groups completed their business systemintegration during the year with minimal disruption tothe provision of banking services to customers, thusenabling customers to enjoy seamless services fromthe merged institutions. Customers now have accessto a wider scope of banking services through cross-selling of banking products between institutionswithin the same banking groups. The mergedbanking groups are now more well-capitalised tomeet future calls for capital expenditure as well asable to undertake higher levels of risk arising fromwider scope of business activities. Domestic bankinginstitutions have already started on aggressivebranding campaigns to establish themselves as keyplayers within the Malaysian banking industry.
The merger programme and the structural reformsundertaken by the banking sector since 1998 haveenhanced the ability of the banking sector to adjustand cope with a more difficult environment. As animportant enabler of the economic transformationand growth process in Malaysia, it was important thatthe development of the financial sector is aligned
110

111
Financial Sector
Original Anchor Banking Group Merged with Resultant Entity After Merger
1 Affin Bank Berhad GroupPerwira Affin Bank Berhad BSN Commercial Bank (M) Berhad Affin Bank BerhadAsia Commercial Finance Berhad BSN Finance Berhad AFFIN ACF Finance BerhadPerwira Affin Merchant Bank Berhad BSN Merchant Bankers Berhad Affin Merchant Bank Berhad
2 Alliance Bank Berhad GroupMulti-Purpose Bank Berhad International Bank Malaysia Berhad Alliance Bank Berhad
Sabah Bank Berhad Alliance Finance BerhadSabah Finance Berhad Alliance Merchant Bank BerhadBolton Finance BerhadAmanah Merchant Bank BerhadBumiputra Merchant Bankers Berhad
3 Arab-Malaysian Bank Berhad GroupArab-Malaysian Bank Berhad MBf Finance Berhad Arab-Malaysian Bank BerhadArab-Malaysian Finance Berhad Arab-Malaysian Finance Berhad1
Arab-Malaysian Merchant Bank Berhad Arab-Malaysian Merchant Bank Berhad
4 Bumiputra Commerce Bank Berhad GroupBumiputra Commerce Bank Berhad Bumiputra Commerce Bank BerhadBumiputra Commerce Finance Berhad Bumiputra Commerce Finance BerhadCommerce International Merchant Commerce International MerchantBankers Berhad Bankers Berhad
5 EON Bank Berhad GroupEON Bank Berhad Oriental Bank Berhad EON Bank BerhadEON Finance Berhad City Finance Berhad EON Finance Berhad
Perkasa Finance Berhad Malaysian International Merchant Malaysian International Merchant Bankers Berhad
Bankers Berhad
6 Hong Leong Bank Berhad GroupHong Leong Bank Berhad Wah Tat Bank Berhad Hong Leong Bank BerhadHong Leong Finance Berhad Credit Corporation (Malaysia) Berhad Hong Leong Finance Berhad
7 Malayan Banking Berhad GroupMalayan Banking Berhad The Pacific Bank Berhad Malayan Banking BerhadMayban Finance Berhad PhileoAllied Bank (M) Berhad Mayban Finance BerhadAseambankers Malaysia Berhad Sime Finance Berhad Aseambankers Malaysia Berhad
Kewangan Bersatu Berhad2
8 Public Bank Berhad GroupPublic Bank Berhad Hock Hua Bank Berhad Public Bank BerhadPublic Finance Berhad Advance Finance Berhad Public Finance Berhad
Sime Merchant Bankers Berhad Public Merchant Bank Berhad
9 RHB Bank Berhad GroupRHB Bank Berhad Delta Finance Berhad RHB Bank BerhadRHB Sakura Merchant Bankers Berhad Interfinance Berhad RHB Delta Finance Berhad
RHB Sakura Merchant Bankers Berhad
10 Southern Bank Berhad GroupSouthern Bank Berhad Ban Hin Lee Bank Berhad Southern Bank Berhad
United Merchant Finance Berhad Southern Finance BerhadPerdana Finance Berhad Southern Investment Bank BerhadCempaka Finance BerhadPerdana Merchant Bankers Berhad
Note: 1 Pending completion of business merger with MBf Finance Berhad.2 To be absorbed into Mayban Finance Berhad.
Table 4.5Merger Programme for Domestic Banking Institutions

with the envisaged direction for the development ofthe economy. This is an important element behind theformulation of the Financial Sector Masterplan (FSMP)by BNM that was launched in March 2001, whichoutlines the broad strategies for the development ofthe Malaysian financial sector over the next 10 years.
The FSMP outlines the medium and longer termagenda to build a financial sector that is responsive tothe changing economic requirements and that isresilient, efficient and competitive. In achieving theend-game, the respective building blocks needs to beput in place to form the foundation on which furtherprogress can be built upon. The recommendationsthat were outlined in the FSMP were thereforefocused on enhancing domestic capacity andcapability before progressing towards a morecompetitive environment in the second phase andfinally towards greater international integration. TheFSMP identified three key objectives in itsimplementation phases: firstly, to enhance domesticcapacity by building the capabilities of domesticbanking institutions and increased deregulation incertain areas to increase competition; secondly, topromote financial stability through strong, risk-adjusted prudential regulations and supervision;and finally, to meet the socio-economic objectivesof Malaysia, which includes increasing the levelof consumer activism. The thrust of the policymeasures and initiatives undertaken during 2001were therefore aimed towards meeting the objectivesin these areas.
Enhancing Domestic CapacityOne of the most significant developments during theyear was the introduction of internet banking bydomestic banking institutions. Eight domestic bankinggroups are now offering the full range of bankingservices through the internet. This is a significantmilestone for the Malaysian banking sector, not onlyin terms of a new delivery channel but also markedthe beginning of the liberalisation process. It isplanned under the FSMP that the liberalisation of theoperating environment for the incumbentforeign-owned banking institutions would start inPhase 2, that is after 2003. However, given theprogress that has been achieved by the domesticbanking institutions to compete, foreign-ownedcommercial banks have been allowed to offertransactional internet banking services with effectfrom 1 January 2002. As at 1 March 2002, threeforeign-owned commercial banks have takenadvantage of this and are offering transactionalinternet banking services.
The completion of the consolidation programme forthe domestic banking sector represented the initial steptowards enhancing the capacity of the domestic playersto compete in the new business environment.Following this, the domestic banking groups wouldneed to continuously assess their positions, not onlywithin the domestic market but also within thepresence of other regional and international players,and develop strategies to enhance their competitivepresence in their targeted market segment.Benchmarking their position vis-à-vis their peers withinthe domestic banking sector as well as the foreignbanks operating in Malaysia, would be an importantstep for the domestic players to gain this competitiveedge, whilst setting realistic targets for improvement.
The benchmarking programme that started in 2000continued to be one of the main agenda pursued byBNM to enhance the capacity of banking institutions.The benchmarking programme provides a powerfultool for banking institutions to see where theirstrengths lie and identify the opportunities that canbe capitalised in enhancing returns in areas in whichthey have comparative advantage. As consumersgrow in sophistication, the ability for bankinginstitutions to provide wide range of financial servicesat competitive prices becomes increasingly important.Financial products would need to be personalised andcustomised to the individual needs of corporate andretail clients. Banking institutions would thereforeneed to be more proactive and innovative inidentifying their niche areas and packaging andmarketing their products to cater for the needs oftheir niche markets. Recognising these challengesahead, it is important for banking institutions toformulate their plans with clearly defined milestonesand the necessary resources required to achieve thesegoals. Baselines for future comparison would need tobe established. Therefore, banking institutions mustallocate adequate resources and implement capacitybuilding measures to achieve this strategic objective.
In this regard, BNM has developed a set of generalbenchmarks in consultation with the banking industry,that has served as an initial framework to measurethe position of banking institutions vis-à-vis theirpeers and help drive performance improvementwithin each banking institution. These benchmarksinclude indicators on operating and financing ratios,broad indicators on customer service and ratios togauge operational efficiency within bankinginstitutions. BNM will continue to provide statistics onindustry averages to banking institutions on aquarterly basis to facilitate their internal monitoring
112

Financial Sector
process. Efforts are currently ongoing to further refinethe general performance indicators to allow bankinginstitutions to better assess their competitive position,particularly in identifying gaps and opportunitiesrelating to different customer and product segments.By monitoring detailed ratios on cost and returns ofdifferent products, transactions, customer segmentsand delivery channels, banking institutions would bein a position to evaluate their key strengths andcapabilities. This understanding will help bankinginstitutions to re-examine existing business models,define future focus and leverage on their respectivestrengths to enhance shareholders’ value.
Tracking the progress is an important part of theprocess. Board of directors of banking institutionsare certainly expected to show commitment to drivethis process. Towards this end, BNM hasimplemented the first of a series of awarenessprogrammes for directors and senior managementof banking institutions to raise their awareness ofbest practices on core areas of banking andemerging issues facing the banking industry. Thefirst seminar was on benchmarking aimed toenhance the understanding of the board of directors
and senior management of banking institutions onthe related issues. Strategies to be undertaken inimplementing a benchmarking exercise, howbenchmarking could aid an institution in formulatingtheir business plans and drive performance, as wellas how benchmarking could be incorporated in riskmanagement practices were discussed. In line withthe strategy of the FSMP, further seminars would beconducted, emphasising on areas relating to thecapacity enhancement of banking institutions.
As recommended in the FSMP, BNM has alsodeveloped a broad framework for the establishment offull-fledged investment banks in Malaysia. Thefunctions of an investment bank are currentlyperformed by different entities within a banking group:that is the merchant bank, stockbroking firm anddiscount house. The more competitive and challenging
environment has made it imperative for these differententities to attain higher levels of efficiency andeconomies of scale, by facilitating mergers betweenthese different entities. With the creation of investmentbanks, the consumers would benefit by being able toobtain a wide range of banking and securities relatedproducts and services from the merged entity. Towardsthis end, BNM has undertaken a study to determinethe scope of business, desired structure and regulatoryframework for the investment banks. As the scope ofactivities of investment banks would focus on banking-related as well as capital market and securities-relatedactivities, the merged entity would need to besupervised by both BNM and the SecuritiesCommission (SC). As part of this process, efforts aretherefore being directed towards harmonising the legaland regulatory framework for the merchant banks andstockbroking companies. This would be essential tominimise regulatory gaps and to ensure that therewould not be excessive regulatory burden oninvestment banks arising from the dual regulatoryenvironment. Efforts are also being undertaken tostreamline guidelines, best practices and examinationrequirements imposed on the stockbroking companiesand the exempt dealers, which are the commercial
banks and merchant banks. With the standardisationof the operational requirements and continuouscollaboration between BNM and the SC, the bankingsector and capital market would stand to benefit fromthe efforts to develop a more robust capital market asenvisaged by the Capital Market Masterplan.
Promoting Financial StabilityThe initiatives to strengthen the capacity of domesticbanking institutions were complemented withcontinuous enhancements to the prudentialregulations in order to maintain stability in thebanking sector and to enable the banking sector toadapt to the changes evolving within the industry.BNM continued to place emphasis on preserving thestrength and resilience of the banking sector, whilstpromoting an environment where innovation andcompetition amongst players in the financial market
113
BNM continued to place emphasis on preserving the strength andresilience of the banking sector, whilst promoting an environmentwhere innovation and competition amongst players in the financialmarket were encouraged. The challenge was therefore, to balancethe trade-offs between encouraging innovation between players inthe financial system and preserving overall financial stability.

were encouraged. The challenge was therefore, tobalance the trade-offs between encouraginginnovation between players in the financial systemand preserving overall financial stability.
Banking institutions are very much involved in thebusiness of managing risks. To ensure that thesafety and soundness of the banking system ispreserved at all times and to safeguard the interestof depositors, it is critical to have an effective risk-focused and risk-adjusted prudential regulation andsupervisory framework in place to govern theconduct of banking institutions. In the past,guidelines relating to the management of risk onderivatives trading were issued to inculcate thepractice of sound risk management amongbanking institutions in the area of derivativestrading. Recognising the need to enhance theoverall risk management framework and to alignthe practices of banking institutions withinternational best practices, BNM has issued aguideline on best practices for credit riskmanagement and is currently developing a morecomprehensive market risk management frameworkto address the risk exposures that are inherent inthe banking business.
The continued emphasis on sound credit riskmanagement clearly strengthens the point thatcredit risk forms the largest source of risk faced bybanking institutions as their core business is in lendingactivities. The recent Asian financial crisis hashighlighted that poor credit risk management is asource of vulnerability in banking institutions and theabsence of sound credit risk practices and strong creditculture may result in significant or even crippling losses.Therefore, the Guidelines on Best Practices for theManagement of Credit Risk formed the foundationtowards upgrading the practices by banking institutionswith regard to credit management and administration.The guidelines prescribed the specific requirements thatbanking institutions have to comply with, as well asbest practices which banking institutions areencouraged to observe. The establishment of soundcredit risk management practices and culture asenvisaged in the guidelines rests on four pillars:enhanced responsibility on the part of the board ofdirectors and management of banking institutions inthe credit risk management process, having in placeadequate infrastructure for effective credit riskmanagement, the development of an integrated riskmanagement process and the establishment ofcomprehensive internal controls and audit proceduresfor credit risk management.
The responsibilities of the board of directors of bankinginstitutions to be aware and ensure that properoversight on credit risk management is establishedwithin banking institutions is one of the keyrequirements emphasised in the guidelines. Boardmembers are expected to focus on supervisory oversightto ensure that adequate credit risk managementprocesses are put in place and that the credit risk policyis consistent with the banking institutions’ capitalstrength, management expertise and risk appetite. Theboard of directors need to be kept informed in a timelymanner on the performance of the credit portfolio andbanking institutions are required to set up anindependent credit risk management committee, whichdoes not have any credit approval authority, to assist theboard in overseeing the overall credit risk managementprocess. The functions of the credit risk managementcommittee would include, among others, evaluatingand assessing the adequacy of strategies and policies tomanage the overall credit risk associated with theiractivities; monitor, assess and advise on credit riskportfolio composition; and evaluate risks under stressscenarios and the capacity of the banking institution tosustain such risk.
The level of risk exposure that a banking institutionassumes on a credit facility is determined when thedecision is made to grant the facility. Thus, it isimportant for the credit assessment and evaluationprocess to be properly conducted by competentpersonnel using all relevant information andappropriate risk assessment tools to perform theevaluation process. The credit management processshould include regular reviews on the financialposition and the repayment capacity of the borrower,as well as taking into account the developmentsfacing the economic sector in which the borroweroperates. As such, having competent personnel in thecredit granting and review process is essential towardsenhancing the quality of credit. Recognising this, theguidelines require that all personnel involved in thecredit appraisal, approval and review process toundergo an accreditation programme. Thisprogramme would enhance the understanding onthe risks associated and the factors and marketconditions that may subsequently affect the qualityof the credit granted.
The upgrading in the level of skills amongst creditpersonnel alone would not be sufficient. It has to becomplemented with an effective credit riskmanagement information system to help bankinginstitutions identify potential areas of vulnerabilitiesamong borrowers, thus enabling them to take
114

115
Financial Sector
Banking Measures Issued in 2001
The regulatory framework was further strengthened in 2001 with the introduction of several new policymeasures and further refinement to the existing prudential guidelines. In addition, liberalisation measureswere also instituted as part of the continuing effort to improve the competitiveness and efficiency of thefinancial sector. Several recommendations outlined in the Financial Sector Masterplan (FSMP) were alsoimplemented during the year.
Enhancing Resilience and Capacity of Banking IndustryRevision of Corporate Debt Restructuring Committee (CDRC) FrameworkIn previous years, the size and complexity of the cases referred to the Corporate Debt RestructuringCommittee (CDRC) contributed to the slow progress of debt restructuring efforts. The unfavourablemarket conditions and sentiments have also affected the smooth implementation of some of therestructured schemes which had obtained all the necessary approvals from the authorities, including thoseinvolving disposal of assets and raising of new equity capital. In certain instances, several cases had to berevised to review aspects of the previously agreed and approved terms and conditions, thus delaying theimplementation of the restructuring process.
To expedite efforts to strengthen the corporate sector and to enable the restructuring exercises to beconducted effectively to place the corporate sector in a position to continue to participate in theeconomic growth process, a number of changes were introduced to the CDRC framework to facilitateand expedite the restructuring efforts under its purview. These initiatives are as follows:(i) Inclusion of representatives from Danaharta and the Federation of Public Listed Companies in the
CDRC Steering Committee;(ii) Revision to the CDRC framework and approach with a specific timeline set to ensure effective
implementation of the restructuring schemes (CDRC has set a timeline of one year for the completionof the restructuring of key corporate groups);
(iii) Enhance greater discipline among borrowers and creditors where borrowers would be required to undertake operational restructuring, where necessary, and for creditor banking institutions to be morerealistic in their recovery expectations; and
(iv) Enhance disclosure and reporting through the issuance of a quarterly update on the progress of debt restructuring to ensure a more comprehensive reporting of the corporate borrowers and the progress of the restructuring to allow for greater transparency of the restructuring process.
The criteria for acceptance of loans to participate in a restructuring exercise under the CDRC was alsochanged to be eligible only to cases which involved an aggregate borrowing of RM100 million by theborrower as compared to RM50 million previously, and for the borrower to have exposure to at least fivecreditor banks as opposed to two creditor banks previously. The guiding principles to be adhered by allparties concerned, the formulation and implementation of workout proposal for the CDRC cases and theconditions to be abided during standstill periods remain unchanged.
Industry Wide Benchmarking ProjectOne of the key recommendations outlined in the FSMP to drive improvements and enhance the capacityof the banking industry is the benchmarking exercise. BNM in discussions with the Association of Banksin Malaysia has embarked on an industry wide benchmarking project to provide banking institutions witha means to elevate the performance of the banking sector. This is essential in equipping bankinginstitutions with the necessary knowledge to leverage and reap the potential opportunities and toeffectively address emerging challenges.
While indicators and benchmarks have been used previously, this is the first time that a wide ranging setof indicators has been formulated to form a basis for a periodical and systematic assessment.A committee comprising a number of industry players, the Association of Banks in Malaysia and BNM

116
was set up to drive the benchmarking project. The group is responsible for developing the quantitativeand qualitative benchmarks that would serve as ‘drivers’ of performance improvement. To initiate thisprocess, BNM has begun to disseminate reports to banking institutions, benchmarking each bank’sperformance against that of the industry. Currently, there is a proposed set of minimum generalbenchmarks that are being adopted by all the banking institutions. These include benchmarks for capitaladequacy, profitability, asset quality, liquidity, loan performance, productivity, customer service andoperational efficiency. This set of indicators will be further refined with additional and more detailedindicators so as to enhance understanding of the factors driving the banking institutions’ performance.The results from the benchmarking exercise will provide valuable input to banking institutions to guidethem in implementing capacity building initiatives. The monitoring of comprehensive ratios andindicators will facilitate banking institutions to better evaluate their key strengths and capabilities and usethis understanding to examine existing business models and strategies, and define future focus in theface of a constantly changing financial landscape.
Prudential MeasuresGuidelines on Directorship in Banking InstitutionsAs part of the overall effort to improve the quality of corporate governance in the banking sector, theGuidelines on Directorship in Banking Institutions (BNM/GP1) was revised on 24 July 2001.
The main revisions cover:• Restricting directorships by the CEOs of banking institutions to the holding company, sister company
or subsidiary of the sister company, all of which must be financial institutions and limiting the numberof directorships held by a CEO at any one time to five.This aims to ensure that CEOs of banking institutions are able to concentrate and dedicate their full attention on the management of the respective banking institution. Directorship in related companies would allow the CEOs to streamline the activities of the banking institutions with the financial companies in the group, thus enabling the group to maximise both its synergistic value and profitability. Directorships in organisations that represent the interests of the banking industry, non-profit organisations and statutory bodies or Government-owned companies, are however permitted and would not be part of the limit.
• Accord full discretion and responsibility to the Board of Directors of individual banking institutions in determining the remuneration of CEOs.The bonus, salary, increment and remuneration package of CEOs would be determined by the Board based on objective, measurable and transparent criteria. The total remuneration of the directors and the CEOs must be disclosed in the annual financial statements of the banking institutions.
Best Practices for the Management of Credit RiskFollowing a series of discussions with the banking industry, the Best Practices for the Management ofCredit Risk (Best Practices) was implemented on 1 September 2001. The Best Practices stipulates theminimum standards on best practices and mandatory requirements to be observed by all bankinginstitutions in all aspects of their credit activities. The issuance of the Best Practices is one of therecommendations outlined in the FSMP.
Reflecting the nature of banking business, credit risk remains the largest source of risk for bankinginstitutions. Effective credit risk management is therefore vital to minimise the risk of insolvencyemanating from poor and weak credit processes and risk management. In tandem with this objective,the Best Practices aims to lay the foundation for the progressive development of higher standards in themanagement of credit risk and to inculcate strong credit culture in banking institutions.
Among the major requirements stipulated in the Best Practices are:(i) Appropriate overview by the Board of Directors and management

117
Financial Sector
• The Board of Directors is entrusted with the supervisory role and is responsible for ensuring that adequate risk management processes are in place. Therefore, the Board of Directors will no longer approve loans so as to enable them to undertake their supervisory role more effectively. However, the Board of Directors can reject loans or modify the terms of the loan that have been approved by the banking institution’s executive body/credit personnel, should the majority of the Board be of the opinion that the loan would expose the banking institution to undue excessive risk.
(ii) Existence of adequate infrastructure for credit risk management• An independent committee comprising of personnel experienced in credit and risk management
must be formed and be chaired by a director (without the executive powers to approve credit) to assist the Board in overseeing the credit risk management processes;
• Personnel involved in credit-granting activities must be accreditated by reputable bodies or individuals acknowledged by the Board, after undergoing a common training programme and passing a common test, before being eligible to approve a credit proposal;
• A product evaluation programme must be carried out where all new credit products must be signed off by all relevant departments affected by the product and approved by the committee/the Board before its introduction; and
• An effective management information system must be put in place to enable management to be aware of, measure, monitor and control the credit risk inherent in its activities.
(iii) Existence of an integrated risk management process• The credit approving function must be performed by full-time executive personnel or a committee
comprising of such personnel;• An internal credit grading system must be developed to systematically grade the credit risk of the
banking institution’s loan accounts;• Credit assessment must be based on repayment capacity rather than on collateral, with specific
reference and comprehensive assessment of the identified source of repayment; • An independent credit review department or unit to review (audit) the quality of loan appraisals
done by the mainstream credit officers and the approval process in accordance with standards set;and
• Biannual stress analysis, or at more frequent intervals as may be prescribed by BNM, must be performed, the results of which must be tabled to the Board.
(iv) Comprehensive internal controls and audit procedures• An audit evaluation must be performed to assess the independence, adequacy and overall
effectiveness of the credit risk management systems.
Accounting Treatment for Loans Sold to Cagamas with RecourseWith effect from 1 September 2001, the accounting treatment for loans sold to Cagamas on a recoursebasis was revised to reflect the essence of the transaction (including under the back-to-backarrangement). Following the revision:
• loans sold to Cagamas on a recourse basis will no longer be deducted from gross loans. Proceedsfrom the “sale” transaction is reclassified to the “liability side” of the balance sheet; and
• interest income received from the loans and subsequently paid to Cagamas would be recognised on a gross basis as “interest income” and “interest expense” respectively, instead of on a net basis as “non-interest income”.
The sale of loans to Cagamas Berhad on a recourse basis effectively entails a secured financing asany defaulted loans would be returned and replaced by the selling banking institutions. Thus, from arisk point of view, the credit exposure remains with the selling institutions, even after the loans havebeen “sold”. The revision attempts to ensure that the books of a reporting entity reflect the substance

of the transaction, rather than its form, the main principle underlying the generally accepted accountingprinciple.
Anti-Money Laundering Act 2001The Anti-Money Laundering Act 2001 (AMLA) was gazetted on 5 July 2001. The enactment of AMLA signifiesa concerted and comprehensive effort to combat illegal transfer of financial resources as a mean to legitimisesuch assets. AMLA provides comprehensive new laws for the prevention, detection and prosecution of moneylaundering, the forfeiture of property derived from, or involvement in money laundering and the requirementsfor record keeping and reporting of suspicious transactions for reporting institutions.
In recognition of the importance of a co-ordinated national effort in the fight against money laundering,the National Co-ordination Committee to Counter Money Laundering (NCC) was formed involving thevarious ministries and government agencies as its members. One of the major outcomes of the variousinitiatives undertaken by the NCC is the enactment of AMLA in 2001.
AMLA addresses the following broad issues:(i) Money Laundering Offences
Stipulates monetary penalty of up to RM5 million or imprisonment not exceeding five years, or both, on any person found to be engaged or abetted in money laundering. The Second Schedule sets out the criminal activities that are illegal activities for the purpose of money laundering which include among others, serious crimes of drug trafficking, corruption and certain offences under the Penal Code such as kidnapping, robbery, human trafficking, gambling, vice and fraud.
In the civil or criminal proceedings ensuing the offence, no witness shall reveal the identity of the person who discloses the offence unless required by the court. No publications or broadcasting of the proceedings are allowed on the disclosure, or person who does the disclosure, except if the person is charged with the offence.
(ii) Financial Intelligence Unit (FIU)Empowers the Minister of Finance (MoF) to appoint a competent authority, who will be empowered to act in accordance with this Act. In this regard, the MoF has appointed BNM as the competent authority and a ‘Financial Intelligence Unit’ (FIU) has been set up in BNM. Its responsibilities include:• receiving and analysing reports issued by the reporting institutions;• sending any report received or information derived from any such report to an enforcement
agency;• sending any information derived from an examination to an enforcement agency;• compiling statistics and records; • making recommendations to the relevant supervisory authority, enforcement agency and reporting
institutions;• developing training requirements and providing training for any reporting institutions; and• communicating relevant information to a corresponding authority of a foreign state.
(iii) Reporting Obligations The obligations of the reporting institutions cover:• record keeping by the reporting institutions;• immediate reporting on transactions exceeding an amount specified by the FIU or any suspicious
transaction, either to the FIU or the supervisory authority;• maintenance of records for a period of not less than six years, even after the closure of the
account;• verification of the identity of the account holder using official or private documents for any
banking service to be offered. In the case of an account opened on behalf of another person, reasonable measures must be undertaken to obtain the true identity of the person; and

119
Financial SectorThe Financial Sector
• adoption, development and implementation of internal programmes, policies, procedures and controls in order to guard against and detect any offence. The aforesaid programme needs to address the integrity of employees; conduct training programmes to enable the employees to disclose their responsibilities effectively, designate compliance officers at the management level and develop audit functions to test compliance. Compliance shall cover all branches and subsidiaries inside and outside Malaysia.
Provisions stipulated under AMLA overrides the secrecy obligation imposed by any written law.
(iv) Powers of investigation, search and seizureThis is to be undertaken by a competent authority and enforcement agencies (EA) upon having reason to suspect an offence under AMLA. The powers include:• power to enter and search the premises for any property, record, report or document;• make copies of, take extracts from, take possession of or remove from the premises, any of the
records, reports or documents that were seized; and • power to search and detain any person found on such premises until the search is completed.
(v) Powers of freezing, seizure and forfeiture of propertyThe EA may issue an order to freeze any property and seize any movable property suspected to be thesubject matter of an offence or evidence relating to such an offence, except those in the possession, custody or control of a financial institution. Where the movable property seized comprising money, shares, securities, stocks, debentures etc, belonging to a person other than the person being prosecuted, the seizure shall prohibit the using, transferring or dealing with such property; or require the surrender of the property.
Liberalisation MeasuresNegotiable Instruments of DepositsWith effect from 22 January 2001, the maximum tenor for the issuance of negotiable instruments ofdeposit (NIDs) was lengthened to ten years from five years.
The NIDs were first introduced in 1979 as an alternative avenue for banking institutions to source funds.When the NIDs were first issued, the maximum tenor was restricted to three years. Over the years, themaximum tenor was lengthened to five years in tandem with developments in the local debt market.Reflecting the need to further deepen the capital market, efforts were intensified in recent years toexpand the range and tenor of debt instruments. Consistent with this effort, the current extension of themaximum tenor to up to 10 years would increase the supply of longer dated debt papers as well aslengthening the yield curve in the pricing of long-term bonds, thus contributing positively towards thedevelopment of the longer end of the debt market. In addition, it also adds variety and diversity to thelonger dated papers available in the debt market to cater to the specific needs of the various groups ofinvestors and permit the banking institutions to source longer term funds for hedging purposes.
Upliftment of the RM150,000 Limit on Sale of Housing Loans with Recourse Basis to CagamasBerhadThe restriction on sale of housing loans costing more than RM150,000 on a recourse basis to CagamasBerhad (Cagamas) was uplifted on 29 May 2001. The liberalisation took place after a temporaryrelaxation of the selling restriction during the period 17 April 2000 to end-March 2001.
The securitisation market in Malaysia began in late 1980s with the establishment of Cagamas whichpurchases housing loans of RM150,000 and below from banking institutions on a recourse basis. As themarket at that time lacked the infrastructure required for a full-fledged securitisation activity, sale ofhousing loans to Cagamas were made on a full recourse basis, with a longer-term objective of developinga full-fledged securitisation market through outright sale of loans to Cagamas, i.e. on a non-recourse
basis. Bearing in mind this long-term agenda, the range of housing loans eligible for sale on a recoursebasis to Cagamas has been restricted to those costing less than RM150,000.
In 2001, Cagamas expanded its operations to include the purchase of housing loans on a non-recoursebasis. Nevertheless, the volume of loans sold by banking institutions under the scheme remains low as thefinancial institutions are flooded with liquidity under prevailing market conditions and hence do not seethe need to seek refinancing from Cagamas. Furthermore, the yield spread of banking loans has increasedin view of the low interest rate environment. Even though the response to this new facility is notencouraging in view of the present liquidity situation, this new avenue provides the financial institutionswith greater flexibility in managing their assets and liabilities more efficiently and effectively. Once marketconditions return to normal, financial institutions would use this avenue as an effective tool to reducetheir credit exposure and hence, increase their ability to grant credit facilities. Therefore, in the meantime,banking institutions were permitted to sell housing loans above RM150,000 on a recourse basis for atemporary period. However, as at end-March 2001, the market remained liquid whilst compliance withthe data requirement by Cagamas for the non-recourse sale remained insufficient. In view of thesedevelopments, banking institutions are now allowed to sell all types of housing loans to Cagamasincluding those for the purchase of houses costing above RM150,000. This would give Cagamas greaterflexibility to extend its business scope, thus providing a catalyst to the further development of thesecuritisation industry. Notwithstanding this, the role of Cagamas in developing a true securitisationmarket would continue to be pursued.
Upliftment of Restriction on the Provision of Bridging Finance for Residential PropertyDevelopment Exceeding RM250,000 Per UnitWith effect from 27 November 2001, the restriction on the provision of bridging finance facility for thedevelopment of residential properties priced above RM250,000 per unit as well as the development ofshop houses exceeding RM250,000 per unit located within residential areas was uplifted as the stock ofunsold residential units had declined. The bridging finance restriction for the development of shop housespriced above RM250,000 per unit, which are not located within residential areas as well as for thedevelopment of commercial properties, remains unchanged. Details of this measure can be found in theMonetary Measures in 2001 section in Chapter 2: Monetary and Fiscal Developments of the BNM AnnualReport.
Consumer-related MeasuresGuidelines for Lending Institutions Accepting Guarantee for a Credit FacilityWith effect from 1 June 2001, the Guideline for Lending Institutions Accepting Guarantee for a CreditFacility was amended to further safeguard the interest of guarantors. Under the revised framework,banking institutions may no longer obtain a waiver of guarantor’s rights whether voluntarily orinvoluntarily. In addition, the maximum coverage of credit facility secured by a guarantor was raised toRM250,000 from RM200,000.
In the course of their lending activities, banking institutions often require a guarantor, who in the event ofdefault by the borrower, is equally and severally liable to the lending banking institution. The issuance ofthis guideline, back in 1995, aims to provide certain safeguards to the guarantor of a credit facility. Thisincludes the requirement for banking institutions to ensure that the guarantor is fully aware of his liabilitybeforehand and is prepared to undertake it, and that he is kept informed of the latest status of the creditfacility to enable him to monitor the repayment by the borrower. In dealing with defaults, the lendinginstitutions are required to use their best endeavour to execute the judgement to recover the sum indefault from the borrower first, before any action can be taken against the guarantor. These safeguardsare however, not applicable in cases where the guarantor voluntarily waives his rights, thus reducing theeffectiveness of the safeguards stipulated in the guideline. With the revision, banking institutions wouldstill be required to perform the steps as stipulated in the guideline, hence ensuring that the rights of theguarantors remain protected.

121
Financial Sector
Establishment of Complaints Unit in Banking InstitutionsIn order to promote greater customer awareness of the existence of a structured and formal mechanismfor banking institutions to address public enquiries, all commercial banks and finance companies havebeen required to set up a dedicated Complaints Unit within their organisation by end-2001. Bankinginstitutions are also encouraged to establish complaints booth within their branch premises. The Unit willfunction as the focal point for managing all complaints received by the banking institutions (viacorrespondence, e-mails, telephones etc) consistent with the long-term objective to improve the servicesprovided by the banking institutions to the banking public.
To ensure that all complaints are being attended to, banking institutions are required to put in place acentral tracking system to record and monitor the status of each complaint received by the institution. Inaddition, all complaints lodged must be processed and responded to within a period of two weeks fromits receipt, with the exception of complex cases whereby complainants would be informed of thetimeframe to resolve the matter. For certain cases, if the complainant is unsatisfied with the responsegiven or the cases remain unresolved, the complainant may subsequently forward his/her dissatisfactionor complaints to the Banking Mediation Bureau (BMB) or BNM.
The BMB was established to provide an avenue for consumers aggrieved with the services provided by thebanking institutions to seek redress. The present scope of BMB operations is limited to claims involvingmonetary losses not exceeding RM250,000 arising from unfair practices relating to charges and fees as wellas against guarantors, ATM-related matters and unauthorised use of credit cards. In order to foster a moremarket-oriented banking system as envisaged in the FSMP, the power and scope of operations of BMB wouldbe expanded to cover the full range of retail banking-related consumer complaints. This would ensure thatBMB would be effective and proactive in protecting the rights of the banking consumers. The setting up ofthe Unit is therefore an initial step towards the achievement of this vision.
Improving Access to Financing for Priority SectorMeasures implemented in 2001 were also focused at enhancing the accessibility of the small- andmedium-sized enterprises (SMEs) and specific industries to financing at reasonable cost to fund theirworking capital needs in order to meet demands of the domestic economy.
Reduction of Interest Rates and Financing of Loans under Special FundsWith effect from 16 April 2001, the funding rates (rates charged by the Government on lendinginstitutions) and lending rates (maximum rates charged by lending institutions on borrowers) for the Fundfor Food (3F), New Entrepreneurs Fund (NEF) and Fund for Small and Medium Industries 2 (FSMI2) werereduced. The reduction in funding rates ranged between 0.75 and 2.0 percentage points, whilst thelending rates were reduced within the range of 0.25 and 1.0 percentage points. In addition, theallocation for these funds was also increased, which in aggregate amounted to RM0.75 billion. Details ofthis measure can be found in the Monetary Measures in 2001 section in Chapter 2: Monetary and FiscalDevelopments of the BNM Annual Report.
Reduction in Lending Rates and Liberalisation of Eligibility Criteria of Special FundsEffective 15 October 2001, the funding and lending rates for the Rehabilitation Fund for Small andMedium Industries (RFSMI), FSMI2 and NEF2 were further reduced by 0.5 percentage points. The revisionin the rates was aimed at further lowering the cost of doing business, thus promoting higher domesticeconomic activities as impetus for growth in investment.
The eligibility criteria and conditions of 3F, RFSMI, Fund for Small and Medium Industries, BumiputeraEntrepreneur Project Fund and Entrepreneur Rehabilitation and Development Fund were also liberalisedto further enhance access to such financing schemes. Details of this measure can be found in theMonetary Measures in 2001 section in Chapter 2: Monetary and Fiscal Developments of the BNMAnnual Report.

The Entrepreneur Rehabilitation and Development FundThe Entrepreneur Rehabilitation and Development Fund (ERDF) was established on 3 July 2001 with a totalallocation of RM500 million. It has two objectives, namely to assist the resolution of existing non-performingloans (NPLs) and to provide working capital to Bumiputera SMEs. Out of the RM500 million allocation,RM120 million is allocated to assist the SMEs in resolving their existing NPLs, whilst the remaining RM380million is allocated to provide working capital support to enable the SMEs to continue in their businessoperations. The ERF Sdn Bhd (ERF) has been entrusted to act as the administrator and secretariat of the ERDF.
The primary objective of the ERDF is to provide distressed companies that are still fundamentally viableand being capably run, with financial assistance in the form of working capital to eligible borrowers withexisting NPLs not exceeding RM1 million. Features of the financing terms include:• amount of financing sought is limited to the borrower’s actual working capital requirement or RM3
million, whichever is lower. The new financing would be extended by the ERF and financial institutions in the ratio of 80%:20%;
• maximum lending rate of 5% per annum for a maximum tenure of 5 years; and• all conduct of the new financing is made through non-checking accounts with close monitoring on
the disbursements by the financial institutions and ERF.
The new financing would be complemented by a scheme to restructure the existing NPLs through debtreduction and moratorium as follows:• Unsecured loans: all outstanding and penalty interests would be waived, whilst the unsecured principal
amount would be reduced by 40%. The Government will contribute financial assistance on 30% of the principal amount, while the entrepreneur must settle the remaining 30% of the NPLs by not more than 18 monthly instalments; and
• Secured loans: haircuts of between 50%-100% on outstanding interest including penalty interests anda 2-year moratorium on the repayment of the remaining balance would be granted. In the event that the borrower defaults on the instalment payments, the financial institutions would reinstate any haircuts provided prior to the default and the Government would withdraw the financial assistance that was given to help the distressed companies.
An added unique feature to the financing scheme under the ERDF is the mandatory requirement for theapproved applicant to undergo structured training programmes and the existence of advisory services. Thisadded feature attempts to equip Bumiputera SMEs with current business expertise and skills required tosucceed in the present business environment through the various training and awareness programmesthat are conducted by Institut Bank-Bank Malaysia (IBBM). The training is organised to cover topics suchas financial cash flow management, computerised accounting, financing tools and motivational talks. Theprogrammes also help to ensure optimal and prudent usage of the disbursed funds to maximise businessopportunities that are available at any given time.
To ensure that only qualified SMEs are given access to the ERDF, the applicants to the ERDF must meet thefollowing eligibility criteria: • The Bumiputera SMEs total outstanding NPLs must not exceed RM1 million;• The SMEs must be at least 60% owned by Bumiputera;• The NPLs must be for business related loans only;• The financial duress suffered by the SMEs must be due to the economic crisis and not due to
mismanagement or fraud;• The loans turned non-performing between 1 January 1998 and 30 June 2001; and• The borrower must have an ongoing business or potential viable business venture.
Eligible SMEs are expected to use the combination of working capital assistance, NPLs restructuring andtraining programmes to both rehabilitate and develop existing businesses that would otherwise have beenforced to cease operations due to the economic downturn.

123
Financial Sector
developing minimum standards for the managementof market risk for banking institutions. Theseguidelines would focus on three main componentsof market risk, namely: interest rate risk, exchangerate risk and equity risk. The issuance of thisguidelines envisaged in 2002 would enhance theoverall risk management practices of bankinginstitutions in both credit and market risks.
The raising of standards of risk management practicesamong banking institutions, in particular with respectto market and credit risks would not only helpbanking institutions to better understand therisk-return relationship in their own business, but alsohelp them to prepare for the new capital regulatoryrequirements to be introduced by the Bank forInternational Settlements, known as ‘Basel II’. Whilethe new capital adequacy rules will allow greaterflexibility in the use of internal systems to determineregulatory capital requirements, this would be subjectto banking institutions having the ability and capacityto maintain high standards of risk managementpractices. To attain the flexibility, banking institutionswould not only be required to meet the technicalrequirements with respect to their risk managementsystems for instance, covering the structure of theinternal loan rating system and the minimumhistorical data requirement, but they would also berequired to conduct comprehensive evaluation on theuse of such systems in the decision making processwithin the institutions. The issuance of minimumstandards on risk management would therefore beconsistent with the developments in the internationalarena and would help domestic banking institutionsin particular lay the foundation for stronger businessculture to cope with changing market structure andregulatory framework.
Since the financial crisis, various efforts have beenchannelled towards strengthening the supervisoryframework over banking institutions. With thecompletion of the consolidation programme fordomestic banking institutions, it is imperative thatcloser monitoring and supervision over bankinggroups be conducted to maintain the overall stabilityof the banking sector. To achieve this, BNM hasintensified its supervisory focus on bank holdingcompanies and their subsidiaries in the supervisionprocess. Previously, the examination focus has mainlybeen on the banking institutions and theirsubsidiaries. As the financial system evolves andbecomes increasingly complex, supervisory oversightneeds to be extended to the group as a whole, toprovide a better understanding on the linkages and
pre-emptive actions, such as loan rescheduling orrestructuring, to ensure that borrowers will be able tocontinue their business activities and thus mitigateany potential losses. To facilitate the monitoring andreview process, banking institutions are required todevelop an internal credit risk rating system whichwould cover all the credit exposures of the bankinginstitution to the borrowers, including off-balancesheet exposures. With a better understanding of thebehavioural patterns that are inherent in certain typesof loans or industries, banking institutions would thenbe able to price their loans correctly to match thelevel of risk inherent in the credit facility.
In addition to the new requirements that wereintroduced in the guideline, existing practices such asthe setting of credit authority limits, limits onparticular sectors, single customer credit limit andrules regarding the provision of credit facilities torelated entities, would continue to be a significantpart to the overall management of credit risk. Theguidelines that have been issued are by no meansconclusive and exhaustive. The framework would becontinually reviewed to be in line with internationalbest practices and to be reflective of the creditpractices of the banking industry.
The availability of a comprehensive and up-to-datecentralised database that houses credit information ofprevious and present borrowers can assist bankinginstitutions in their credit assessment and monitoringprocess, by expediting the credit evaluation processwhilst enabling banking institutions to have morecomprehensive information on a particular borroweron a real time basis. To enhance the existingcentralised credit bureau that was established in theearly 1980s, BNM has developed a sophisticated andcomprehensive electronic-based system, known as theCentral Credit Reference Information System (CCRIS)which became operational in October 2001. TheCCRIS would capture information of all borrowers inthe banking system, thereby enabling bankinginstitutions to conduct background checks onprospective borrowers and the level of indebtednessof the borrower in the banking system on a real timebasis. From a broader perspective, CCRIS would helpto develop sound credit culture in the financial systemby enabling personnel engaged in credit approvalprocess to make informed decisions based oncentrally available and comprehensive information.
In addition to credit risk, another area of risk thatneeds to be properly managed by bankinginstitutions is market risk. BNM is currently

interdependencies between the respective entitieswithin each banking group. The extension of thesupervisory net to include bank holding companieswould place BNM in a better position to assess theoverall condition of the banking group and act uponthe areas of vulnerabilities that may threaten thesolvency of the banking group, and ultimately thestability of the financial sector. The expansion of theexamination process to include the bank holdingcompany of banking institutions and theirsubsidiaries is also consistent with the overall movetowards consolidated supervision. Close monitoringof the activities of the bank holding companies, aswell as other entities within a particular bankinggroup would only be possible with the availability ofkey information such as capital strength and leverageposition of the bank holding company and the groupas a whole. The framework for regular reporting bythe bank holding company would therefore befinalised to enable BNM to assess the risk profile ofeach banking group on a consolidated basis and toextend the prudential regulatory framework toinclude bank holding companies. The prudentialframework aims to ensure that bank holdingcompanies are well capitalised and able to lendfinancial support to its subsidiaries should the needarise. At the same time, an assessment of the groupstructure would also be undertaken. While groupstructures would naturally take into account theneed for business synergy, regulatory principleswould ensure that such structures do not hamperthe effective conduct of consolidated supervision.The framework for consolidated supervision wouldneed to continuously evolve as the market developsand continuously enhanced to provide acomprehensive framework that will culminate into aspecific legislation to regulate the holding companiesof banking groups.
As the banking system undergoes the transitiontowards a more deregulated and a market-orientedfinancial system, strong corporate governancebecomes a key pre-requisite. Good corporategovernance practices such as transparency, efficientinternal controls and having an effective board ofdirectors would contribute positively towardsensuring that banking institutions are well-run andwell-managed, with the ultimate objective ofenhancing efficiency, productivity and shareholders’value. As banking institutions grow larger andundertake more complex business activities, it wouldbe increasingly important for members of the boardand senior management to comprehend the factorsthat may affect the financial position of their
banking institution so that appropriate measures canbe implemented to safeguard the soundness of theirbanking institution. Directors and seniormanagement are also expected to continuouslyupgrade their knowledge on emerging issues such astrends emerging in the market, new technology andtechniques that can enhance their performance andefficiency, as well as new challenges facing thebanking business in order for them to exercise theirduties effectively. Given the critical role played by theCEOs in managing the daily operations of thebanking institutions, it would be vital for CEOs toaccord their full attention to the running of theirbanking institution. Therefore, BNM has restrictedthe number of directorships that a CEO may hold atany one time to five directorships. To ensure that thepositions that they hold will not be in conflict oradversely affect the objectivity of the CEOs, they arealso not permitted to become a director, chairman orhold any executive powers in other entities, otherthan as a director in a subsidiary or a holdingcompany of their banking institution.
It has been a practice previously for bankinginstitutions to request for approval for theremuneration rewarded to their CEOs and directors.This was necessary at the time to ensure that thecompensation packages of senior managementcommensurate with increases in the level ofproductivity of the banking institutions. However,moving forward, to enable banking institutions toattract the best talents and for the remuneration tobe market driven, BNM has removed the requirementfor banking institutions to obtain the prior approvalof BNM on the remuneration of their CEOs anddirectors. The responsibility of determining theappropriate amount of remuneration now lies withthe board of directors and shareholders of bankinginstitutions, who are primarily responsible forensuring that the remuneration packages of theirsenior management are based on transparent,measurable and objective criteria. In line with themove towards promoting greater market discipline,this liberalisation is accompanied by the requirementfor banking institutions to disclose the aggregateamount of remuneration paid to their CEOs,executive directors and non-executive directors intheir annual accounts.
Taking into account the increasing demand for greaterpublic disclosure and the enhancement of financialreporting by standard setters, BNM has recently issueda consultative paper to the banking industry on theproposed amendments to the Guidelines on the

125
Financial Sector
Specimen Financial Statements for the Banking Industry(GP8). The revised GP8 has been drawn up withgreater focus on the role of the board of directors.Directors are placed in a position of trust byshareholders while the law places the responsibility formanaging the affairs of the banking institutions on theboard. The board therefore carries the ultimateresponsibility for proper stewardship of companyresources and the achievement of corporate objectives.In line with this, the primary responsibility for thepreparation of the financial statements is placed on theboard of directors and the board is expected todevelop a sound financial reporting structure to ensurethe integrity and credibility of its accounts. A lessprescriptive stance has been adopted in the reportingof several items in the revised GP8. This is intended togive banking institutions the flexibility in disclosing theirpolicies and reporting of financial performance andbusiness operations according to the specificcircumstances pertaining to the institution.
The shift towards fair value accounting frameworkwith the adoption of International AccountingStandard 39 (IAS 39) is another area of challenge tofinancial institutions in terms of financial reporting.While the fair value model is yet to be fullyimplemented in Malaysia, banking institutions muststand ready and make preparations for compliancewith the new requirements. Policies on investmentsin financial assets as well as hedging activities forexample, would need to be re-examined to beconsistent with the new recognition andmeasurement rules. The new framework would alsorequire banking institutions to reassess the capabilityof their management information systems to copewith the new measurement rules. Similarly, the boardand management of banking institutions would needto be informed of the overall impact of the fair valueaccounting framework on the institution’s balancesheet and profitability, in particular with respect topotential increase in income volatility.
Banking is a business which is founded on the basisof integrity and is dependent upon the confidencelevel that is placed by the public on the bankingsystem. Therefore, it is important that the integrity ofthe financial system is preserved to maintainconfidence of the public on the financial sector. Theboard of directors therefore, have an equallyimportant role to ensure that the reputation of theirbanking institution is preserved. The board ofdirectors must ensure that there is an appropriatemechanism to monitor and manage reputationalrisks, as even though a banking institution may have
strong fundamentals, certain issues if not managed,may have destabilising effects on the bankinginstitution. It has been a practice for bankinginstitutions to have adequate controls andprocedures in place to verify the authenticity of theircustomers before establishing a banking relationshipwith them. These requirements have been put inplace since the introduction of the guidelines on“Know Your Customer Policy” in 1993 to ensurethat the banking system is not used as a conduit forcriminal activities.
However, in light of the higher degree of innovationand greater use of technology in the banking sector,efforts were directed towards strengthening theoverall regulatory framework on anti-moneylaundering. In June 2001, the Government passed anew legislation, Anti-Money Laundering Act 2001(AMLA), to combat money laundering activities inMalaysia. Prior to the enactment of this legislation,legal provisions on money laundering activitiesfocused mainly on drug and corruption activities andthese provisions were incorporated in various specificlegislations. Legal statutes on money launderingwere therefore fragmented. The AMLA also aims toaddress the gaps in the various legislations byensuring that all activities relating to moneylaundering are curbed in a cohesive manner. TheAMLA enhances the overall anti-money launderingframework by making it more comprehensive. Firstly,money laundering itself would now be treated as aseparate criminal offence. Secondly, the scope ofAMLA would cover laundering of proceeds from 122offences. Thirdly, existing administrative requirementsin relation with customer identification, recordkeeping and suspicious transaction reporting wouldnow be made legally binding. The AMLA alsorequires the establishment of a financial intelligenceunit to receive suspicious transaction reports andconduct intelligence. The Government has appointedBNM as the competent authority to collect, processand conduct intelligence gathered relating tosuspected money laundering activities from reportingentities. The AMLA which came into force on 15January 2002 has identified at the initial stage,commercial banks, finance companies, merchantbanks and Islamic banks as reporting entities. Otherentities such as stockbroking companies, discounthouses, insurance companies and money changerswill be included as reporting entities at a later stage.Fourthly, the AMLA enhances the powers of lawenforcement agencies to seize and freeze propertiesto enable them to detect, monitor and prosecutemoney laundering offences.

Following the enactment of the AMLA, BNM willrevise the guidelines on “Know Your CustomerPolicy” to be in line with the provisions in the AMLAand to incorporate international best practicesprescribed by the Bank for International Settlementsand the Financial Action Task Force. At the initialstage, the reporting mechanisms on cases of moneylaundering would be based on suspicious transactionsreporting only. The requirement to report alltransactions exceeding a certain prescribed amountwould be imposed at a later stage when bankinginstitutions have put in place the necessary systems torecord and track information of individual customersin a more comprehensive manner. Procedures andcontrols to address the integrity of their employees,training programmes including“know-your-customer” programmes, designatecompliance officers at management level and developaudit functions to test compliance would also formpart of the compliance requirements, tobe complied by all branches and subsidiaries ofbanking institutions.
Meeting Socio-economic NeedsOne of the important objectives highlighted in theFSMP is to promote greater consumer awarenessand activism. BNM continued to pursue effortstowards achieving this objective whilst building thesafeguards to protect the interests of consumers ofbanking services. Consumer activism has beenidentified as an important element that would helpto drive performance in banking institutions and thedesired efficiency and effectiveness in a marketdriven environment. The need to ensure adequateand effective consumer education and protection isalso becoming more crucial. The prevention of anydisruptions in the level or reliability of service tobank customers and also their protection frompotential unfair practices reflects positively on theability of the financial system to absorb increasingcompetition. Active and structured consumereducation programmes are needed to increaseconsumer understanding of banking institutions’products and services, which will in turn give rise tomore active consumerism. The objectives of theconsumer awareness initiative are threefold: toeducate and enhance consumer knowledge onpersonal financial issues; to improve legal protectionfor consumers and customer redress avenues; and toincrease product transparency and disclosure. Toachieve these objectives, BNM has taken severalmeasures in 2001 to lay the necessary foundationtowards building a more active consumerismmovement in Malaysia.
As part of the ongoing efforts to educateconsumers on financial issues, BNM has alsoundertaken an extensive education and publicannouncement programme to curb the activities ofillegal deposit taking entities. This effort wasconducted through media advertisements,distribution of pamphlets and placement of postersto reach a wide spectrum of the population and toenhance consumer knowledge on such illegalactivities. Due to the lack of information andunderstanding by the public, illegal deposit takingbusinesses were able to develop particularlyamongst the less informed segment of thepopulation. With the extensive educationcampaign, it is hoped that greater awareness wouldhelp towards preventing the activities of illegaldeposit taking from taking place in the future.
Towards further improving legal protection forconsumers, the guidelines on the acceptance ofguarantee for credit facility were amended to furthersafeguard the interests of guarantors in May 2001.The level of protection accorded to guarantors wasemphasised by prohibiting banking institutions fromobtaining a waiver of guarantor’s rights voluntarily orinvoluntarily. This was to ensure that guarantors wereaware of their rights and would not be caught off-guard by the fine prints in the guarantee agreement.Greater emphasis was also placed on ensuring thatbanking institutions educate the guarantors on theirobligations before committing to the loan agreement,and to keep the guarantors updated on the status ofthe loan at all times. Actions against guarantorsshould only be taken after banking institutions haveexhausted all means available to recover the amountowed to them from the borrower.
In a move towards providing avenues of redress forcustomers and to enhance the level of serviceprovided by banking institutions, all commercial banksand finance companies are required to set up adedicated Complaints Unit as a channel for customersto raise their problems with their respective bankinginstitutions and to enable banking institutions torecord and monitor the progress of complaintsreceived from consumers in order to improve theservices that are provided. The Complaints Unit is thefocal point for managing complaints received bybanking institutions and is responsible to take thenecessary actions so that similar grievances would notreoccur in the future. Previously, BNM had activelymediated to resolve grievances raised by consumers.With the setting up of the Complaints Unit, bankinginstitutions would now be the first point of reference
126

127
Financial Sector
for dissatisfied customers. Banking institutions shouldendeavour to act upon and respond to thecomplainant as soon as possible. In the event that thecustomer remained dissatisfied with the decisionsmade by the banking institution, the matter could beforwarded to the Banking Mediation Bureau.
BNM also continued to accord priority to thedevelopment of Bumiputera entrepreneurs. In particular,to improve the accessibility of banking services forBumiputera entrepreneurs, banking institutions havebeen required to set up a designated BumiputeraDevelopment Unit (BDU) within each organisation toaddress specific issues related to the Bumiputeraentrepreneurs. The role to be played by the BDUincluded acting as a one-stop centre to coordinate allfinancing and advisory services for Bumiputeraentrepreneurs, to be responsible for handling loanapplications received from Bumiputera businesses, toundertake functions of marketing and promotingbanking related products to the Bumiputeraentrepreneurs, and to undertake and coordinatetraining programmes in areas such as productfamiliarisation and financial management forBumiputera entrepreneurs. With the established pointof reference within each banking institution, themechanism for Bumiputera entrepreneurs to gain accessto banking credit will be more efficient and effective.
BNM also established a special fund, EntrepreneurRehabilitation and Development Fund or “TabungPemulihan dan Pembangunan Usahawan” to providefinancial assistance to small and medium Bumiputeraenterprises (Bumiputera SMEs). The objectives of thefund was to provide financing to help affectedBumiputera SMEs to resolve their NPL problems byproviding working capital to enable them to continuewith their business. Although the funds were providedby the Government, banking institutions were requiredto assess the viability and repayment capacity of theSMEs. The Fund is aimed at providing assistance toBumiputera SMEs that faced difficulties in obtainingnew financing and thus helped to preserve theirbusinesses that were still viable.
Moving AheadThe FSMP has outlined the direction for thedevelopment of the banking sector in the next 8-10years. The implementation of the recommendationsof the FSMP needs to be carefully sequenced in orderto minimise disruption to the overall economy.
The developments during the next few years wouldbe vital towards achieving the end-game envisaged
in the FSMP. They would form the building blockson which further developments of the bankingsector would take place. With the global financialindustry continuing to evolve and the accelerationin the rate of change, the Malaysian banking sector,particularly the domestic banking institutions wouldbe faced with mounting pressure to become moreefficient and competitive, innovative, technology-driven and strategically more focused. Therefore,greater emphasis would continue to be giventowards strengthening the resilience andcompetitive position of banking institutions toenable them to remain relevant in a more globalisedand liberalised environment.
SUPERVISORY ACTIVITIES
BNM continues to adopt a two-pronged supervisoryapproach for banking institutions, focusing on bothon-site examination and off-site surveillance. In linewith the philosophy of creating a framework for astrong, risk-adjusted prudential regulation andsupervision of the banking sector, emphasiscontinued to be placed on high risk areas that couldaffect the safety and soundness of bankinginstitutions. The risk profile and business activities ofthe banking institution and its related companies aretaken into account in determining the areas ofsupervisory focus to enable appropriate assessmentof the overall health of the banking group and toensure that activities undertaken by the groupwould not result in an adverse impact on thebanking institutions and the banking system as awhole. The supervisory process therefore covers notonly the banking institutions, but also the bankholding companies and related companies.
In 2001, BNM conducted 85 examinations onbanking institutions, of which, 35 examinations wereconducted on the local and overseas branches of thebanking institutions and another 7 examinations onbank holding companies and related companies ofbanking institutions. In addition, there were 5examinations of non-bank financial institutions. Theon-site examination continues to focus primarily onthe assessment of the financial and operatingconditions of banking institutions, reinforced withemphasis on the assessment of risk profiles andadequacy of risk management systems of bankinginstitutions. The off-site supervisory functioncomplements on-site examination through dynamicongoing surveillance of the financial health ofbanking institutions. It includes the review andapproval of financial statements of banking

128
PROGRESS OF IMPLEMENTATION OF FINANCIAL SECTOR MASTERPLAN
The Financial Sector Masterplan (FSMP), launched in March 2001, outlines the medium and long-term strategies forthe development of the financial sector. In the context of the plans and strategies that have been put in place, it isimportant for the development to be monitored and managed. Towards this end, a FSMP Secretariat and a FSMPSteering Committee (FSMP SC) have both been set up in BNM to monitor the implementation of the FSMPrecommendations. The FSMP Secretariat has drawn a framework to monitor the progress in the implementation ofthe recommendations. It will also review the relevance of the recommendations against current and futuredevelopments, especially in the international markets and to monitor the progress of the domestic financialinstitutions and financial system in the context of attaining the specified milestones. The FSMP SC reviews on amonthly basis the progress of the FSMP recommendations, provides strategic directions to the FSMP Secretariat aswell as discuss policy issues that have emerged in taking the FSMP recommendations forward for implementation.
To facilitate monitoring the progress in the development of the financial system, the recommendations aredivided into five categories based on objectives that are being envisioned for the financial system. This willinclude building efficiency and capacity, enhancing competition, providing an efficient payment system,strengthening the regulatory framework and enhancing consumer awareness. With regard to therecommendations under the Islamic Banking and Takaful sector, its progress is being monitored in accordancewith four objectives, namely, to strengthen regulatory framework development, to promote product and marketdevelopment, to strengthen the legal and Shariah framework and to enhance knowledge and expertise topromote human capital development. In line with the consultative and iterative approach that has beenadopted in the implementation of the FSMP recommendations, a number of working groups with participationand representations from the industry, the private sector and related Government agencies have been and willbe established in the development of the financial sector as outlined in the FSMP. This is to ensure that theimplementation of the FSMP recommendations are being carried out in a manner where the desired results areachieved without disruptions to the financial sector.
Commenced and to be completed
in/after 200332 (45)
Completed9 (21)
On-going22 (25)
Yet to commence
32 (70)
Commenced and to be completed
in 200224 (49)
Total recommendations : 119Total projects : 210( ) No. of projects
7.5%
18.5%
26.9%20.2%
26.9%
Graph I.1Progress of Implementation of FSMPRecommendations
As at end-2001, out of the total 119 recommendations, 22 recommendations are being implemented on an on-going basis, where its implementation is on a continuous basis and runs throughout the FSMP’s 10-year period,while nine or 9% of the remaining 97 recommendations have been fully implemented. The associated work in theimplementation of each recommendation involves several related projects. The recommendation for the“Development of a Comprehensive Framework for Consolidated Supervision” for example encompasses eightprojects. The projects under the recommendation include developing a framework for consolidated supervision offinancial conglomerates relating to information/statistical reporting by bank holding companies to BNM as well asputting in place the legal framework and regulations relating to group structures, intra-group transactions, corporategovernance, liquidity, capital adequacy and other prudential requirements. The recommendation would only be

129
Financial Sector
considered complete when all projects under it have been fully completed. To achieve the implementation of theremaining 88 recommendations, a total of 164 projects will need to be completed.
Consistent with the focus under Phase 1 of the FSMP on building domestic capacity, current efforts are focusedon implementing measures to enhance the capability and capacity of financial institutions to improve their levelof efficiency, competitiveness and effectiveness, measures to promote stability in terms of strengthening theregulatory and institutional framework as well as measures to put in place an efficient and market drivenconsumer protection framework.
The recommendations to enhance domestic capacity and enhance competition include the benchmarkingexercise to enable banking institutions to benchmark their performance against international standards and
Table I.1Status of Implementation of Recommendations
R3.5 Uplift restriction on employment of expatriatesto attract best international talents to meetthe demand for expertise in specific areas ofbanking
R3.12 Encourage outsourcing of non-core functionsto gain greater strategic focus and efficiency
R3.14 Encourage the development of new deliverychannels to increase the range of product andservices at more effective rates
R4.2 Allow all players in the market to operate viathe internet to enhance competitiveness andefficiency of the insurance industry
R4.16 Increase the statutory minimum paid-upcapital of insurers to accelerate consolidationprocess that will enable domestic insurers tocapture the size and scale needed to competeeffectively in a more deregulated andliberalised market
R5.6 Increase the number of takaful operators toaccelerate the expansion of takaful industry
R3.3 Enhance credit skills and monitor the requirement foraccreditation of credit officers and managers to strengthencredit skills of credit officers and managers and ensureeffectiveness of the accreditation requirement
R3.13 Require management of banking institutions to give greaterattention to the development of ICT to ensure theformulation of appropriate ICT strategies
R3.15 Adopt ‘what is not prohibited is allowed’ regulatoryphilosophy and phase-out product pre-approvalrequirements to remove impediment to innovation
R3.19 Facilitate the development of a conducive tax regime toprovide incentives to encourage financial prudence andinnovation
R4.5 Open up the pension industry to insurers to increase themarket share of domestic life insurers
R4.8 Allow insurers to distribute other personal financial serviceproducts to enable insurers to make more effective use ofthe agency force and other distribution channels
R5.11 Create a favourable tax regime to avoid barriers in adoptingIslamic banking concepts and takaful products
R3.34 Initiate an active and structured consumer educationprogramme to develop active consumerism
R3.36 Encourage consumers to pursue formal administrative andlegal redress to protect customers from possibilities of unfairpractices by banking institutions
R3.2 Improve awareness of best practices and conduct focusedtraining to raise the level of awareness of best practices andenhance understanding of chief executive officers anddirectors of banking institutions on emerging trends andissues facing the banking industry
Banking Sector
Completed On-Going
Insurance Sector
Completed On-Going
Islamic Banking and Takaful
Completed On-Going

130
to use it as a strategic tool to drive performance. BNM has disseminated reports to banking institutions,benchmarking each bank’s performance against that of the industry and that of their peers on the basicindicators. In order to enhance awareness and garner the support and commitment of board members andsenior management of banking institutions on the importance of benchmarking, BNM had conducted a“Seminar on Benchmarking”. The seminar was part of a series of seminars planned for the directors andchief executive officers of banking institutions and insurance companies to enhance awareness onimportant areas which are vital prerequisite for taking the development of financial services sector forward.In addition to quantitative indicators, market research will be conducted on customers’ needs andsatisfaction levels to drive customer segment strategies, particularly in the areas of retail and smallbusiness banking.
Internal benchmarking will also be established to determine the pace of implementation of the FSMP. To gaugethe extent of progress achieved in relation to the specific objectives set out under the various phases of theFSMP, the performance and development will be periodically measured against specific milestones set at thevarious stages of implementation. The results of the periodic reviews will serve both to determine the sequenceand pace of subsequent implementation, as well as prompt remedial actions or adjustments that may be neededto ensure that the measures implemented achieve their intended objectives.
R7.2 Establish a RM500 million VC Fund to increasethe availability of VC financing and stimulatenew ventures
R7.3 Introduce further tax incentives for the VCindustry to promote the growth of VCs
R7.4 Liberalise the MESDAQ listing requirements tofacilitate the exit of VCs from their investments
R7.13 Establish a one-stop agriculture research and developmentcentre as well as a comprehensive and integratedinformation database to facilitate banking institutions intheir assessment of specialised risks involved in agriculturefinancing
R7.14 Develop structured and systematic training programme forborrowers to ensure the orderly development of players inthe agriculture sector
R7.15 Establish risk-distribution mechanism that will reduce risksto the financial institutions and at the same time, reduceborrowing costs through a guarantee and insuranceprotection scheme
R7.16 Provide subsidies to agriculture industry to help reduceinsurance costs especially for small scale farmers
R7.17 Grant tax exemptions to provide greater financial assistanceto the sector
Alternate Modes of Financing
Completed On-Going
Labuan International Offshore Financial Centre
Completed On-Going
R8.1 Develop an active International Offshore Financial Centre(IOFC) for Malaysia to support the increasing demands ofthe domestic economy
R8.2 Review existing rules and regulations to facilitate expansionin the scope of core business to facilitate new offshorebusinesses and allow offshore service providers to maximisecapabilities and expertise to expand their businesses
R8.3 Adopt a consultative and market driven approach to createa conducive tax and business environment to enhance thecompetitiveness and attractiveness of Labuan
R8.9 Maximise potentials of Labuan IOFC by developing othercomplementary economic measures
R8.6 Strengthen Islamic banking and finance as well as Islamicinsurance (takaful) to develop Labuan with a strategic focuson Islamic products and services
R8.7 Enhance the Labuan International Financial Exchange (LFX)to be a one stop financial exchange for residents andglobal companies
R8.8 Enhance the e-commerce gateway to encourage globale-commerce operators to set up domicile in Labuan

131
Financial Sector
Given the crucial importance of developing expertise and skilled personnel to manage and control credit riskwithin banking institutions, a recommendation relating to the accreditation of credit personnel programme hasalso been introduced. The accreditation programme is aimed at ensuring that all credit personnel have acomplete understanding of the risks associated with lending activities, which in turn would help to enhance thecredit culture and credit standards of banking institutions. The recommendation relating to removal of salaryrestrictions has also been implemented whereby banking institutions are now given flexibility to determine thesalaries, allowances and bonuses of their employees based on their productivity and efficiency levels. This hasenhanced the ability of banking institutions to mobilise, attract and retain the best talents into the industry.
To allow greater operational flexibility, banking institutions have also been allowed to outsource their non-corebusiness activities to third party service providers and engage in cross-selling activities. To date, 22 bankinginstitutions have outsourced some of their non-core functions to third party service providers and 6 bankinginstitutions are engaged in cross-selling financial products and services of entities within the same group, includingthose belonging to their related non-bank financial institutions. The ability of banking institutions to offer a broadrange of financial services through different distribution channels also become increasingly important to maintaintheir competitive edge. To date, eight domestic banking institutions and three foreign-owned banking institutionsoffer internet banking facilities. Various efforts have also been put in place to enhance the efficiency andcompetition in the payments system. This includes enhancements to the RENTAS system, introduction of a real timesurveillance system to enhance transaction monitoring and liquidity management, and a Repurchase AgreementEnhancement Module to enhance liquidity in the secondary bond market and facilitate the settlement of repurchaseagreement transactions. In order to allow market forces to shape developments in the payments system, a NationalPayments Advisory Council (NPAC) was established in mid-2001 to perform an advisory function and provide marketinput in the development of payment systems policies. Members of the NPAC comprise of officials from the Ministryof Energy, Communications and Multimedia of Malaysia, BNM, Securities Commission, Hong Kong MonetaryAuthority, Bank of Japan, Malaysian Administrative Modernisation and Management Planning Unit (MAMPU),Malaysian Electronic Payment System Sdn. Bhd. (MEPS), the Association of Banks in Malaysia, the Association ofFinance Companies of Malaysia, the Association of Merchant Banks in Malaysia and the General InsuranceAssociation of Malaysia.
To further strengthen the regulatory framework, three consultative papers on the banking sector have been issuednamely, the prompt corrective measures which recommend a set of regulatory actions that would be automaticallyinstituted on banking institutions found to be operating in a manner detrimental to depositors’ interest; theconsultative paper on single customer credit limit which is intended to refine the existing guidelines; the consultativepaper on the revised Guidelines on the Specimen Financial Statements for the Banking Industry (BNM/GP8), which isintended to cater for the rapid pace of development in the financial markets; and the increasing demand for greaterpublic disclosure to foster market discipline and strengthen financial stability.
In the insurance sector, the consolidation of the industry was further advanced with the implementation of therecommendation to increase the statutory minimum paid-up capital for direct insurers to RM100 million witheffect from 30 September 2001. To date, a total of eight mergers and acquisitions (M&As) involving 16 insurershave been completed, while M&As involving another 13 insurers are at various stages of implementation.
The FSMP also contained a set of recommendations to enhance the effectiveness of financial institutions that arenot licensed under the Banking and Financial Institutions Act 1989. The recommendations were directed atimproving the regulatory framework for Development Financial Institutions (DFIs) and building capacity andincrease efficiency of DFIs in utilising their financial resources in meeting the Government’s objectives. TheDevelopment Financial Institutions Act 2002, which came into force effective 15 February 2002 has accordedBNM powers to enforce the Act. Following the enforcement of the Act, six DFIs have been placed under thepurview of the Act. In order to further enhance the development of alternative modes of financing, the listingrequirements by venture companies on the MESDAQ have been liberalised and the Government has establisheda RM500 million Venture Capital (VC) Fund to increase the availability of VC financing in the economy and inthe process, stimulate more new ventures, particularly in the ICT industry. In addition, tax incentives in the formof tax deductions equivalent to the amount of investments made in approved venture companies at start-up,seed capital and early stage financing have also been given to the industry.

132
In promoting consumer awareness and initiating a structured consumer educationprogramme, BNM and the banking institutions have initiated a comprehensive plan for anactive and structured Consumer Education Programme. The Association of Banks in Malaysiain consultation with The Product Transparency and Disclosure Working Group had publishedthe first series of information pamphlets namely, on areas such as protecting your credit card,protecting your ATM card, investing in unit trusts and prepayment charges on housing loans.An information pamphlet on “Illegal Deposit Taking/Get Rich-Quick Schemes” was alsopublished to highlight and promote public awareness of the dangers of participating in getrich-quick schemes involving illegal deposit-taking. In addition, BNM, together with thebanking institutions have established a committee for consumer education to enhanceconsumer knowledge on personal financial issues including awareness on consumers’ rightsand liabilities; and to improve legal protection for consumers and customer redress avenues.In moving towards a standard full disclosure model for products, the committee will developguidelines on the minimum level of product transparency to ensure that consumers are wellinformed of all risks and liabilities associated with particular banking products and services.
In the same vein, consultative papers were also issued on a proposed framework for thedevelopment of independent financial advisers (IFAs) in the insurance industry and ‘bestadvice’ practices in the sale of life insurance products. These recommendations under theFSMP, which are currently being finalised for implementation in 2002, will enable consumersto obtain professional independent advice on their financial planning and management fromcertified IFAs who can provide advice on a broader range of insurance products. The ‘bestadvice’ practices regulation would ensure that proper advice, based on the specific financialcircumstances and needs of individuals, is rendered by intermediaries in the sale of lifeinsurance products.
With regard to Islamic banking, a standard framework has been formulated for thecomputation of the rate of return for Islamic banking institutions aimed at providing a levelplaying field and terms of reference for the Islamic banking players in deriving the rate ofreturn. The framework would allow BNM to assess the efficiency, profitability, prudentmanagement and fairness of Islamic banking institutions more effectively. Two committeeshad been formed namely, the Consultative Committee on Services (CCS) and ConsultativeCommittee on Product and Market Development (CCPMD). The CCS was formed with theobjective of setting the minimum best practice standard for Islamic banking in customerservice, establishing image building as well as promoting public awareness and knowledge onIslamic banking and finance. The CCPMD was formed to drive the innovation anddevelopment of Islamic banking products. Both CCS and CCPMD have members comprisingof BNM officials and representatives of the Islamic banking institutions and takafulcompanies.
A total of 24 recommendations or 27% of the 88 recommendations are targeted to be fullyimplemented in 2002. With the implementation of the recommendations under Phase 1, thefoundations for developing stronger domestic banking and financial institutions would havebeen established. The expected outcome, by the end of Phase 1 should be the emergence ofdomestic players that are stronger, more efficient and innovative, besides being increasinglymore competitive and resilient, as well as effective DFIs that play a significant role inaddressing the development strategies of the nation by complementing the establishedbanking institutions to meet financing requirements of the changing economy. BNM wouldcontinue to closely monitor the progress of the implementation of the recommendationsunder the FSMP to ensure a smooth transition from one phase to another, based on theachievement of specified milestones and to ensure measures implemented are timely and thedesired strategic direction and objectives are achieved.

133
Financial Sector
institutions. Financial statements are reviewed toascertain if the statements are prepared incompliance with accounting standards and BNMguidelines, as well as to ensure adequate provisioningfor bad and doubtful debts. In addition to the reviewof audited accounts on an annual basis, the review ofsemi-annual and quarterly (for listed companies)accounts are also performed.
In addition to examination conducted onbanking-related activities, emphasis was also placedon the information systems within bankinginstitutions to ensure that they were adequatelymaintained with high data integrity. With theintroduction of internet banking as a new deliverychannel and the increased usage of technology inbanking activities, additional attention was given tothe information systems of banking institutions inorder to mitigate the potential risks associated withthe widespread adoption of electronic bankingdelivery channels. The maintenance of data integrityin these delivery channels, especially where it involvespayment services, becomes increasingly critical andwarrants supervisory focus. BNM has thereforeincreased its information system examinationsthroughout the year to ensure that the informationsystems of banking institutions form a foundation forthe safe and sound operation of banking institutions.A rigorous monitoring of the performance of bankinginstitutions, compliance with regulatory requirementsand occurrence of fraud, complements the stresstests. These would enable BNM and the bankinginstitutions to undertake pre-emptive and remedialactions in areas of supervisory concern. Specialsurveillance programs were also conducted to curbthe rise in ATM related frauds.
Moving forward, developmental efforts will continue tobe taken to further strengthen the supervision of thebanking institutions. In line with the increasingcomplexity of risks undertaken by banking institutions,the CAMEL framework is being expanded to include aseparate component on Sensitivity to Market Risk. Inaddition (following the enactment of the DevelopmentFinancial Institutions Act 2001), the scope of bankingsupervision was expanded to include the supervision ofDevelopment Financial Institutions.
PROGRESS OF BANKING SECTORRESTRUCTURING
The institutional arrangements put in place topreserve the stability of the banking sector during theAsian crisis, namely, Pengurusan Danaharta Nasional
Berhad (Danaharta) the asset management company;Danamodal Nasional Berhad (Danamodal) a specialpurpose recapitalisation agency; and the CorporateDebt Restructuring Committee (CDRC) achievedsignificant progress in their respective operationsduring the year 2001.
As at 31 December 2001, total loan rights acquiredand managed by Danaharta amounted to RM47.7billion, of which RM39.8 billion were from thebanking system. This accounted for approximately40% of the total non-performing loans of thebanking sector. Danaharta completed its loanacquisition phase in 2000 and did not make anydirect purchases from the banking institutions in2001. The increase in loans managed by Danahartain 2001 was mainly due to the exercise of the putoption agreement between Danaharta, Commerce-Asset Holdings Berhad and Bank Bumiputra MalaysiaBerhad (BBMB) Group arising from the mergerbetween BBMB and Bank of Commerce (M) Berhad.The put option has since expired on 31 August 2001.
In 2001, Danaharta focused on the management ofloans and assets within its administration. With theobjective of maximising recovery values, Danahartaadopted various techniques in the managementprocess, including active restructuring andrescheduling for viable loans, foreclosure,appointment of Special Administrators and Schemesof Arrangement for non-viable loans.
As at 31 December 2001, Danaharta has dealt withRM47.7 billion (99.9%) of the total loan rights acquiredand managed under its portfolio. Of these loans,Danaharta expects a recovery rate of 56% over the
Adjusted Adjustedloan expected
outstanding1 recovery2
(RM billion) (RM billion)
Plain loan restructuring 11.6 8.0 69Settlement 6.9 5.2 76Scheme of arrangement 9.2 6.9 76Special Administrators -
scheme approved 5.5 2.5 44Foreclosure 11.6 3.4 29Others (including partial
resolutions) 4.1 2.5 60Legal action 2.0 - -
Total 50.9 28.5 56
1 Comprising loan rights acquired of RM47.7 billion and accrued interest of RM3.2 billion.2 Assuming zero recovery on defaulted cases as at 31 December 2001.
Table 4.6Danaharta: Loan Recovery as at 31 December 2001
Expectedrecovery
(%)

outstanding amount of loans acquired (inclusive ofaccrued interest). The expected recovery rate has beenadjusted after applying an assumption of zero recoveryfor defaulted accounts (average default rate as at 31December 2001 is approximately 11%).
From the total adjusted loan outstanding already dealtwith, Danaharta expects to receive total recovery ofRM28.5 billion as at 31 December 2001. Of this,Danaharta has received recovery proceeds totallingRM15.2 billion, of which RM9.7 billion were realised inthe form of cash and the remaining in the form of non-cash assets, namely restructured loans, securities and
properties. The remaining expected recoveries totallingRM13.3 billion are at various stages of recovery.
Danaharta has distributed net recoveries amounting toRM8 billion in cash and 36,559,542 units of securitiesat par value. The cash distribution, amounting to RM7.7billion, was distributed for the recovery on BBMB andSime Bank Group NPLs and the remaining RM312.6million and 36,559,542 units of securities at par valuewere distributed back to 24 financial institutions underthe 80 (selling financial institution): 20 (Danaharta)surplus recovery sharing agreement.
Danaharta continued to sell foreclosed propertycollateral via open tenders during the year. Propertiesthat remained unsold during the tenders weretransferred to Danaharta Hartanah, which continuesto sell the properties via its “secondary sales”programmes. In 2001, Danaharta conducted a fifthproperty tender involving 269 properties, of which49% received successful bids for a total considerationof RM283.4 million, representing a 17% surplus overtheir total indicative value of RM242.3 million. Thefifth tender saw the highest participation of propertybuyers amongst all the tenders that had beenconducted by Danaharta. It also further exemplifiedthe strong trend of successful sales via real estateagents (REAs), during which the REAs wereresponsible for selling 126 or 96% of the 131properties that received successful bids. On 22January 2002, Danaharta launched a specific propertytender involving 30 units of six-storey shopoffices in
one location only with a total indicative value ofRM31.9 million. The closing date for the tender was28 February 2002. Danaharta expects to launch itssixth property tender in the second quarter of 2002.As at 31 December 2001, Danaharta has sold 498 ofthe 614 properties offered since the first open tenderheld in 1999, for a total consideration of RM843.5million. These included 357 properties sold in primarysales (RM593.3 million) and 141 properties sold insecondary sales (RM250.2 million).
Danaharta also embarked on its first asset-backedsecuritisation (ABS) exercise through Securita ABS
One Berhad (Securita), a special purpose vehicle. TheABS exercise was the first collateralised loanobligation securities in Malaysia, to provideDanaharta with a more efficient method ofdivestment as it helped to overcome the operationaldifficulties faced in outright sales or auctioning alarge number of accounts and avoided the risk of“cherry picking” by investors. It also enabled awider investor base to be addressed. Funds raisedfrom this and future issues will help to enhanceDanaharta’s cash collection in meeting bondredemption and operational requirements.
The first Danaharta ABS exercise, which will matureon 20 December 2005, involved the issuance ofRM310 million triple-A rated Senior Notes with acoupon rate of 3.875% per annum that werebacked by approximately RM595 million worth ofperforming loans. The successful exercise garnered asubscription rate of 3.5 times above the nominalamount of the issue.
In the case of Danamodal, no further capital injectionwas made since December 1999 as the capital positionof banking institutions has continued to strengthen. InAugust 2001, Danamodal concluded the Sales andPurchase agreement on the disposal of its investment inone finance company. With the completion of the sale,Danamodal’s outstanding investment in the bankingsector has reduced to RM2.1 billion, from RM7.1 billionsince its inception. Danamodal expects to recover theentire remaining investment over time.
134
Noting that debt restructuring on its own may not bring about longterm solution for the problems faced by the large corporates,borrowers were also required to undertake operationalrestructuring, over and above the financial restructuring, to ensurethe viability of the company over the longer term.

Financial Sector
Changes were made to the CDRC debt restructuringframework during the year. The changes which weremade to accelerate the pace of corporate debtrestructuring in Malaysia included the setting ofspecific timeline to ensure effective implementation ofthe restructuring and enhanced disclosure andreporting requirements. Noting that debt restructuringon its own may not bring about long term solutionfor the problems faced by the large corporates,borrowers were also required to undertakeoperational restructuring, over and above thefinancial restructuring, to ensure the viability of thecompany over the longer term. The criteria for theacceptance of loans under CDRC was also amendedto borrowers with aggregate borrowing of RM100million with exposure to at least five creditor banks.(The details of the revision in the framework can befound in the section on Banking Measures 2001).
As at 8 March 2002, 12 cases with debts totallingRM18.8 billion remained outstanding. This includedone case which was previously resolved but had to berevised. For cases in which the creditors andborrowers are unable to reach a consensus on theterms of the restructuring exercise, the cases wouldbe removed from the purview of CDRC. Any furthernegotiations between the creditors and borrowerswill be conducted outside the auspices of CDRC. Todate, CDRC has rejected or discharged 12 casesfrom its purview. CDRC is on course in its target toensure that all workout proposals of borrowersunder its purview are approved and implemented byend-July 2002.
PERFORMANCE OF THE BANKING SYSTEM
ProfitabilityFor the third consecutive year since the Asian crisis,the Malaysian banking sector continued to recordprofits, albeit at a lower level. Profits for the calendar
year 2001 amounted to RM7.5 billion. Higherprovisioning accounted for the lower profits in 2001.Analysed by institution type, the lower profits wereattributed to the commercial and merchant banks.The decline in the profits recorded by the banks washowever mitigated by the higher profits recorded by
135
-20
-10
0
10
20
30
2000 2001
RM billion
Net interest income Non-interest incomeLoan loss provisions Staff costsOverheads
INCOME
EXPENDITURE
1 Excludes Islamic banks
Graph 4.5Banking System 1 : Profitability
Table 4.7Status of CDRC cases as at 8 March 2002
Total debt Numberoutstanding* of(RM million) accounts
Total referred to CDRC 67,644 87Cases withdrawn / rejected /
transferred to Danaharta 13,076 36Cases accepted 54,568 51Resolved 35,773 39Outstanding 18,795 12
Being restructured by CDRC 17,770 11Revised 1,025 1
* Including non-banking and offshore institutions.
Table 4.8Banking System1: Income and Expenditure
For the calendar year
2000 2001p Annual change
RM million %
Interest income net of interest -in-suspense 38,217 37,601 -616 –1.6
(Interest-in-suspense) 5,139 5,787 648 12.6
Less: Interest expense 19,575 19,330 –244 –1.2
Net interest income 18,642 18,271 –371 –2.0
Add: Non-interest income 6,700 7,917 1,218 18.2
Less: Staff cost 4,597 4,841 245 5.3 Overheads 4,706 5,321 615 13.1
Profit before provisions 16,039 16,026 –13 –0.1
Less: Loan loss provisions 6,716 8,552 1,836 27.3
Pre-tax profit 9,324 7,474 –1,849 –19.8
Of which:Commercial banks 6,848 5,112 –1,737 –25.4 Finance companies 1,889 2,060 171 9.0 Merchant banks 586 302 –283 –48.4
Return on assets (%) 1.5 1.1 Return on equity (%) 19.5 14.5Cost to income (%) 36.7 38.8
1 Excludes Islamic banks.p Preliminary.

136
the finance companies. While the banks’ profits wereeroded by the higher provisions for loan losses, thestrong loan growth of the finance companiesespecially for the purchase of passenger cars, coupledwith a decline in loan loss provisions, had contributedto their higher profitability.
The higher loan loss provisions charged by thebanking system in 2001 was the result of theincrease in the NPL (6-month classification) to RM60billion as at end-December 2001. The increase inloan loss provisioning expenses was due partly toanchor banks having to realign the policies on loanloss provision of the acquired loan portfolios to bein line with their more stringent standards. Thesewere, however, one-off adjustments which in effectwould place the banking system on a strongerfooting as the adjustments were from minimum tomore prudent standards.
Net interest income remained at about the same levelas in the previous year, recording only a marginaldecline of 2% during the year. The reduction in netinterest income was due to a larger decline in grossinterest income compared to the decline in interestexpense. Lower interest income from interbankplacements and investment securities contributedlargely to the decline in gross interest income. As thebanking system remained flushed with liquidity in2001 and interest rates continued to be low, bankinginstitutions switched their asset mix from loweryielding investment securities to loan assets. Thischange in strategy to maximise yields led to intensecompetition in the retail and mortgage loans sectors.The competitive interest rate environment and lowerlending rates were compensated by a healthy growthin loan base which resulted in total income receivedfrom lending activities recording an increase of 3.5%.
Commercial Banks1%
Finance Companies
Merchant Banks
ALR ACOF
Note: ALR includes interest which have been suspended and penalty interest on NPLsACOF excludes the costs of overheads, statutory reserves andliquid asset requirements
1 Exclude Islamic banks
0
2
4
6
8
10
12
14
0
2
4
6
8
10
12
14
0
2
4
6
8
10
12
14
J F M A M J J A S O N D J F M A M J J A S O N D
J F M A M J J A S O N D J F M A M J J A S O N D
J F M A M J J A S O N D J F M A M J J A S O N D
2000 2001
2000 2001
2000 2001
%
%
Graph 4.7Average Lending Rates and Average Costs of Funds
3.5
2000 2001
4.04.55.05.56.06.57.07.5
J F M A M J J A S O N D J F M A M J J A S O N D
Percentage points
Commercial banks Finance companiesMerchant banks
1 Exclude Islamic banksNote: Net interest margin = Average lending rate for all loans - Average cost of funds
Graph 4.6Net Interest Rate Margins
The lower lending rates were also compensatedby a decline in interest expense due to lowerinterest paid on deposits (-RM0.3 billion or -1.9%)although total deposits mobilised by the bankingsystem increased.

Financial Sector
The non-interest income (excluding recoveries) of thebanking system increased by 18.2% in 2001. This wasdue mainly to extraordinary gains from disposal ofinvestments and dividends received which rose byRM0.9 billion (+73.9%) and trading income of RM0.5billion (+28.4%). Fee-based income, which accountedfor 26.3% of the non-interest income, registered anincrease of RM17.9 million to RM3 billion, reflecting thegreater attention by banking institutions on theprovision of fee-based services to complementtraditional fund-based income.
The rationalisation and systems integration effortsundertaken consequent to the merger exerciseresulted in an increase in overhead costs of RM0.6billion or 13.1%. These are, however, one-off costsand banking institutions are expected to be able toreap the benefits of the rationalisation andintegration process in the future years.
Loan ActivityThe lending activities of the banking systemmoderated in 2001 following a modest economicgrowth during the year. The slowdown, which wasprimarily a consequence of the global economicdownturn, had affected the domestic economythrough lower exports, unfavourable businesssentiment and short-term prospects. Against thesedevelopments, demand for loans and financingdeclined, resulting in a lower number and amountof loan applications received by bankinginstitutions in 2001. In view of the lower numberof loan applications received, loan approvalsdeclined by 6.5% during the year. However, loanrepayments increased marginally by 3.8%as many borrowers repaid and refinanced theirloans to take advantage of the low interest rateenvironment. Loan disbursements also recorded amarginal increase of 2.3%.
Consumer credit extended by the banking system whichrose by 11.9% was supported by the strong consumerspending. Similarly, loans for purchase of transportvehicles (primarily for purchase of passenger cars)recorded a strong growth of 27.4%, while loans forpurchase of residential properties expanded by 9.3%.The strong demand for loans by the retail sectorreflected mainly the positive response of the public tothe current low interest rate environment as well as theGovernment’s pump-priming expenditure to spur thedomestic economy. The demand for housing loans wasalso augmented by the competitive housing loanpackages offered by banking institutions and the homeownership promotion campaigns initiated by the private
sector to boost sales. In addition, several incentives wereaccorded during the promotion period such as stampduty exemption for buyers, waiver of processing feesand a higher margin of financing.
Demand for loans from the corporate sector,however, remained weak throughout 2001 due tothe decline in exports and the domestic economicslowdown. The low demand for loans from theconstruction and real estate sector was attributableto the overhang situation and the Government’sdirective to the local authorities to defer approvalfor new construction of office and commercialspace to combat the property overhang situation.As a result, approximately 50% of the new loansapproved during the year were to individuals, withloans for residential properties accounting for asignificant share of 22%.
As the time lag between approval and disbursementof loans for credit cards and purchase of passengercars is short, loan disbursements to the two sectors in2001 recorded strong growth at 59.2% and 40.1%respectively. This was followed by loans for purchaseof residential properties at 10.6% and loans for themanufacturing sector at 9%. Disbursements of loans
137
Table 4.9Banking System1 : Financing Activities
For the year
2000 2001 Annualgrowth
RM billion (%)
Loan approvals 133.3 124.7 –6.5
Loan disbursements 357.3 365.5 2.3
Loan repayments 345.0 358.2 3.8
As at end
2000 2001 Annualgrowth
RM billion (%)
Outstanding loans2 447.4 462.7 3.4
Adjusted outstanding 454.5 473.3 4.1loans3
Adjusted total financing 551.4 586.6 6.4for the economy4
1 Excludes Islamic banks.2 Includes loans sold to Cagamas and Danaharta. 3 Outstanding gross loans, adjusted for loans sold to Cagamas and
Danaharta as well as loans written-off and conversions and repayment of loans of the two LRT companies.
4 Outstanding gross loans, adjusted for loans sold to Cagamas and Danaharta, loans written-off and conversions as well as repayment of loans of the twoLRT companies and outstanding private debt securities.

to finance the purchase of residential properties wereslower due to the legal documentation process whilstfor properties under construction, drawdowns areprogressive according to the stage of completion.Loan disbursements in other sectors declinedfollowing the downward trend in loan approvals.As in the previous year, the manufacturing sectoraccounted for a significant proportion of loandisbursements, totaling RM101.4 billion or 27.7%of total disbursements. Funds disbursed to thewholesale, retail, restaurant and hotel sectoramounted to RM65.4 billion, a marginal increase of4.6% from RM62.5 billion as at end-2000. Themanufacturing sector also contributed the largestshare in loan repayments, accounting for 28.1% orRM100.7 billion, which was 10.8% higher than theamount of repayments last year (RM90.9 billion). Thewholesale, retail, restaurant and hotel sector alsorecorded a significant amount of repayments,accounting for 17.9% or RM64.1 billion.
Compared with the previous year, total undrawnloans edged up by 8.1% in 2001. With higherundrawn loans and repayments marginally lowerthan disbursements, total outstanding loans of thebanking system, including loans sold to Cagamasand Danaharta, registered an annual growth of3.4% in 2001, compared with 5.4% the previousyear. Taking into account loans written-off andloans converted into equity and bonds in the courseof restructuring, as well as the repayment of theloans of the two LRT companies, the totaloutstanding loans grew at an annual rate of 4.1%,compared with 7.1% in 2000.
As interest rates continued its downtrend to arecord low in 2001, new private debt securities(PDS) issued increased sharply by 23.8%, raising atotal of RM33.3 billion from the market. Totalredemption amounted to RM16.9 billion, whichwas mainly due to the redemption and maturity ofseveral medium-term PDS that were issued in1996/97. Subsequently, outstanding PDS rose by16.9% to RM113.3 billion and total outstandingloans, adjusted for loans written-off and loanconversion, as well as the repayment ofthe loans of the two LRT companies and takinginto account outstanding PDS in 2001, amountedto RM586.6 billion. This translated into an annualgrowth of 6.4%, relatively lower than 9.6%achieved in 2000.
Moderating demand for financing throughout 2001had resulted in a slower pace in lending activities of
the banking institutions during the year. However,further drawdown of existing approved creditfacilities, as well as the various measures introducedin 2001, are expected to translate into improvedloan activity in 2002. The upliftment of therestriction on the provision of bridging finance forresidential property development exceedingRM250,000 per unit in November 2001 is envisagedto spur further the growth in the property sector. Afurther impetus for growth in the property sectorwould be the extension of ringgit credit facilities tonon-residents for the purchase of immovableproperties in Malaysia. Effective July 2001, residentfinancial institutions are allowed to provide loans tonon-residents to finance the purchase orconstruction of any property in Malaysia. Variousincentives were also introduced to enhance accessof small- and medium-sized enterprises (SMEs) tofinancing under the existing special funds, as wellas to promote domestic economic activity andinvestment growth. These included a reduction inlending rates and liberalisation of eligibility criteriaof special funds, as well as additional allocations forcertain funds. For example, the Fund for Food (3F)was increased from RM1 billion to RM1.3 billionand the lending rates reduced to 3.75% per annumfrom 4% per annum. The allocation for the NewEntrepreneur Fund (NEF) rose from RM1.25 billionto RM1.5 billion, with a reduction in lending ratesto 5% per annum. A new EntrepreneurRehabilitation and Development Fund (ERDF) wasestablished and incorporates rehabilitation measuressuch as advisory services, new contracts andfinancial support. In addition, on 20 September2001, given the increased risks biased towardsfurther economic weakness following the 11September incident, the 3-month BNM interventionrate was reduced by 50 basis points to 5% perannum. This resulted in a corresponding fall in thebase lending rates (BLR) of commercial banks andfinance companies to 6.39% per annum and7.45% per annum, respectively. This reduction, inpart, has provided an impetus for consumerlending, as well as enhance domestic business andconsumer confidence to support domestic economicactivity. These measures are expected to continue totranslate into an improved outlook in loan activitiesin 2002.
Asset QualityAmidst the economic slowdown in 2001, the assetquality of the banking system deteriorated marginallyduring the year. Net NPLs on a 6-month classificationincreased by RM8 billion to RM32.1 billion as at end-
138

Financial Sector
December 2001. Similarly, net NPLs on a 3-monthclassification increased by RM8.4 billion to RM45.2 billionas at end-December 2001. The asset quality during theyear was largely affected by two factors; the expiry of the
NPL indulgence period granted to borrowers participatingin the debt restructuring process under the auspices ofthe CDRC and the economic slowdown that hadhampered the ability of corporations and retail
borrowers to repay their debts. Towards the first half of2001, loans amounting to RM4.3 billion or 34.7% of theincrease in gross NPLs were classified as NPLs due to theexpiry of the indulgence period. The reclassification of
these loans however did not adversely affect theprofitability of banking institutions on account of therequirement that interest on these loans be recognisedon a cash basis and specific provisions be set aside. In
139
Table 4.10Banking System1: Non-performing Loans and Loan Loss Provisions
As at end
2000 2001
Classification ClassificationActual2 Actual2
3-month 6-month 3-month 6-month
RM million
Commercial banksGeneral provisions 6,399.8 6,365.9 5,241.9 6,125.6 6,134.3 5,416.9Interest-in-suspense 5,576.2 5,672.7 5,263.1 6,632.0 6,661.8 6,435.7Specific provisions 11,360.8 11,726.5 10,721.5 14,134.0 13,975.7 13,188.7Non-performing loans 35,660.6 41,107.3 31,607.3 46,934.8 51,578.9 41,682.7
Net NPL ratio (%)3 6.4 8.1 5.3 8.8 10.4 7.4Total provisions/NPL (%) 65.4 57.8 67.2 57.3 51.9 60.1
Finance companiesGeneral provisions 1,647.1 1,640.4 1,656.7 1,822.5 1,802.6 1,802.5Interest-in-suspense 2,343.3 2,435.3 2,211.6 2,640.6 2,849.3 2,579.8Specific provisions 4,809.0 5,055.4 4,514.3 4,971.2 5,095.2 4,840.2Non-performing loans 14,255.4 17,627.0 13,338.3 15,266.0 18,781.8 14,602.9
Net NPL ratio (%)3 9.2 13.2 8.5 9.0 12.8 8.4Total provisions/NPL (%) 61.7 51.8 62.8 61.8 51.9 63.2
Merchant banksGeneral provisions 377.1 336.3 336.9 379.0 340.5 374.6Interest-in-suspense 513.5 568.5 524.0 523.1 540.0 522.8Specific provisions 816.3 827.2 806.4 1,056.8 1,073.9 1,017.0Non-performing loans 3,084.2 4,387.4 3,211.1 4,415.8 5,029.3 4,373.9
Net NPL ratio (%)3 10.9 18.7 11.7 21.7 26.2 21.6Total provisions/NPL (%) 55.3 39.5 51.9 44.4 38.9 43.8
Banking systemGeneral provisions 8,423.9 8,342.6 7,235.4 8,327.0 8,277.4 7,594.0Interest-in-suspense 8,433.0 8,676.6 7,998.7 9,795.7 10,051.2 9,538.4Specific provisions 16,986.0 17,609.0 16,042.3 20,162.0 20,144.9 19,045.9Non-performing loans 53,000.3 63,121.7 48,156.7 66,616.6 75,390.0 60,659.5
Net NPL ratio (%)3 7.2 9.6 6.3 9.3 11.5 8.1Total provisions/NPL (%) 63.9 54.9 64.9 57.5 51.0 59.6
1 Excludes Islamic banks.2 Loans classified as NPL based on individual banking institution’s NPL classification policy i.e. 3-month or 6-month classification.3 Net NPL ratio = (NPL less IIS less SP) / (Gross loans less IIS less SP) x 100%.
Despite the build-up of NPLs over the year, the institutional andregulatory framework put in place by BNM over the years and theprudent provisioning policies of banking institutions had positionedthe banking sector on a sound footing to adjust and respondpositively to these pressures. The banking system continued tomaintain a strong capital position, with RWCR well above 12%throughout the year.

addition, a number of loan accounts that had previouslybeen restructured were reclassified as NPL as theeconomic slowdown and weak capital market impededthe ability of corporations to raise funds to improve theirleverage position.
Despite the increase in NPLs over the year, theinstitutional and regulatory framework put in placeby BNM over the years and the prudent
provisioning policies of the banking institutions hadpositioned the sector on a sound footing torespond positively to these pressures. The bankingsystem continued to maintain a strong capitalposition, with RWCR well above 12% throughoutthe year. The specific provisions set aside bybanking institutions increased by RM3 billion or18.7% during the year. As a result, the net NPLratio of the banking system was sustained withinthe range of 7.9% to 8.3% throughout the secondhalf of the year. In terms of loan loss coverage, thelevel of provisioning outstanding remained high at59.6% of total NPLs as at 31 December 2001.Including the value of collateral, the total loan losscoverage of the banking sector strengthened to148.1% of NPLs as at end-December 2001. Thestress tests conducted on banking institutions on aquarterly basis have also indicated that the bankingsector as a whole would continue to remain strongand well capitalised under adverse economicconditions and depressed asset prices, with theRWCR of the banking sector remaining above 8%,and some banking institutions recording RWCR wellabove 8%.
140
0
24
68
10
1214
J F M A M J J A S O N D J F M A M J J A S O N D
2000 2001
as %
6-month classification 3-month classification
Excludes Islamic banks1
Graph 4.8 Banking System1: Net Non-performing Loans Ratio
Table 4.11Banking System1: Non-performing Loans by Sector
As at end
As percentage of total loans to sector
2000 2001 2000/2001 2000 2001
RM million %
Agriculture, hunting, forestry and fishing 702.5 924.0 31.5 6.4 8.1Mining and quarrying 210.3 244.5 16.3 14.7 19.4Manufacturing 8,865.9 12,409.6 40.0 14.4 20.3Electricity, gas and water supply 252.9 358.8 41.9 3.3 7.3Wholesale and retail trade, restaurants and hotels 4,729.5 4,983.4 5.4 13.3 13.8
Wholesale trade 2,058.6 2,126.5 3.3 10.7 10.7Retail trade 1,300.5 1,364.5 4.9 11.8 12.0Restaurants and hotels 1,370.4 1,492.4 8.9 26.0 30.1
Broad property sector 20,874.0 27,346.3 31.0 15.8 17.1Construction 8,021.2 10,526.0 31.2 23.2 31.6Purchase of residential property 5,055.3 6,727.9 33.1 9.0 8.0Purchase of non-residential property 4,159.7 4,918.7 18.2 15.8 18.2Real estate 3,637.7 5,173.7 42.2 24.5 33.2
Transport, storage and communication 1,920.5 1,595.0 -17.0 16.3 15.5Finance, insurance and business services 2,990.4 4,633.8 55.0 9.6 14.5Consumption credit 6,260.7 5,803.3 -7.3 11.1 8.3
Personal uses 1,885.2 1,873.5 -0.6 14.6 14.2Credit cards 377.8 409.4 8.4 5.1 4.6Purchase of consumer durable goods 80.3 70.1 -12.7 10.1 14.8Purchase of transport vehicles2 3,917.4 3,450.3 -11.9 11.1 7.3
Purchase of securities 4,438.5 5,206.6 17.3 18.2 24.6Community, social and personal services 783.8 1,237.3 57.9 13.1 21.1Others 971.3 1,874.0 92.9 8.4 17.9
Total 53,000.3 66,616.6 25.7
1 Excludes Islamic banks.2 Includes commercial vehicles.
NPL by sector Change

Financial Sector
The global economic downturn and the slump in theglobal electronics industry in 2001 adversely impactedexports during the year and consequently, the volumeof production and sales of the manufacturing sector.Against this backdrop, the sector recorded the largestincrease in NPL over the year, from RM8.9 billion as atend-2000 to RM12.4 billion as at end-2001. In termsof distribution of gross NPLs by economic sectors, themanufacturing sector continued to account for a largeportion of total NPLs in the banking system. As at 31December 2001, gross NPLs to the manufacturingsector accounted for 18.6% of total NPLs of thebanking system and 20.3% of total loansgranted to this sector. However, towards the lastquarter of 2001, the NPLs of this sector stabilised asboth external and domestic demand improvedduring the quarter.
The construction sector was also adversely affectedby the economic slowdown. As at end-December2001, the NPLs for this sector accounted for 15.8%of total NPLs of the banking sector and 31.6% oftotal loans to this sector. As the construction sectorhas been a major beneficiary of the Government’sfiscal stimulus measures, the NPLs in this sector isexpected to improve in 2002. NPLs for the purchaseof residential properties remained manageable at8% of total loans extended for this purpose. Within the finance, insurance and business servicessector, NPLs increased by 55% during the year. Thebulk of the NPLs to this sector were attributed toinvestment holding companies which had difficultiesservicing their debts due to lower dividends fromsubsidiary companies.
Despite the relatively stronger performance of thestock market in 2001, NPLs for the purchase ofsecurities increased by RM0.8 billion or 17.3%.Although the NPL ratio to this sector accounted for24.6% of total loans to the sector as at 31 December2001, the total exposure of the banking sector to thesector remained small at 5% of total loans extendedby the banking sector.
In terms of potential risk to the banking sector, totaloutstanding loans in arrears have stabilised andcontinued to remain at manageable levels throughoutthe year. Despite a more difficult economicenvironment, total outstanding loans in arrears net ofNPLs in the 2 to less than 6 months buckets increasedonly marginally by 1.4% or RM280.8 million in theyear 2001. These were mainly due to increases inloans in arrears in the 2 to less than 3 monthsbuckets, whilst total outstanding loans in arrears in
the 4 to less than 6 months buckets declined by4.5% during the year. New loans classified as NPLshave also started to moderate over the second half ofthe year, recording a decline from RM20.1 billion inthe first half of the year to RM11.2 billion in thesecond half of the year 2001. The banking system hasalso recorded a 27.8% increase in recoveries in thesecond half of the year.
The pre-emptive initiatives that have been taken toaccelerate the pace of corporate debt restructuringhave started to yield positive results in enhancing theasset quality of banking institutions and significantlyreduced risks to the banking system. During the year,the successful restructuring of the debts of two largecorporate borrowers had reduced the NPLs of thebanking system by RM2.9 billion or 0.7% of totalNPLs. The satisfactory progress of corporate debtrestructuring under the new CDRC framework isexpected to further alleviate a significant portion ofthe NPL problems from the banking sector. With thecompletion of the debt restructuring process underCDRC envisaged by July 2002, the asset quality ofbanking institutions can be expected to improve byapproximately 3 percentage points. Therefore, thebanking institutions are well placed to support theeconomic recovery in 2002.
It is therefore envisaged that the level of NPLs in thebanking system will continue to remain manageableas the banking system has emerged stronger followingthe restructuring efforts as well as the variousmeasures introduced to improve the risk managementpractices of banking institutions. As the economyis expected to record stronger performance in theyear 2002, the asset quality of banking institutionswill also improve in tandem with the positiveeconomic outlook.
141
0102030405060708090
100
J F M A M J J A S O N D J F M A M J J A S O N D
RM billion
2-<3 mths 3-<6 mths 6-<9 mths
9-<12 mths 12 mths and above
2000 2001
Excludes Islamic banks1
Graph 4.9Banking System1: Ageing Profile of Loansin Arrears

142
The liquidity management of the banking institutionsshowed an overall improvement as the adoption ofthe new liquidity framework become mandatory fromJanuary 2001. As at end-December 2001, thecumulative liquidity surplus of the banking system(excluding two Islamic banks) was projected atRM51.7 billion in the very short-term bucket of up to1-week and RM69.6 billion in the 1-month bucket.As a group, commercial banks, finance companiesand merchant banks projected large surpluses in the1-month bucket amounting to 16%, 14% and 44%of their total deposit base respectively.
On an individual basis, the majority of the bankinginstitutions have projected surpluses, well above theregulatory requirement in the 1-week and 1-month
Liquidity ManagementThe international reserves declined during the firsthalf of the year to RM98.9 billion as at end-June2001. To stabilise liquidity conditions, BNM liquidityoperations was expansionary, releasing liquidity thatwas absorbed from the banking system in theprevious year. The total intervention by BNM in theform of outstanding net interbank borrowing andissuance of Bank Negara Bills (both conventional andIslamic) declined from RM49.6 billion as at end-2000to RM34.1 billion as at end-June 2001.
Liquidity in the banking system however increased inthe second half of the year as international reservesrose by RM18.4 billion, from RM98.9 billion as at end-June 2001 to RM117.2 billion as at end-December2001. The significant current account surplus, thesteady inflow of foreign direct investment and theinterest rate differential in Malaysia’s favour during theperiod following coordinated interest rate cuts in themajor economies during the year accounted for theincrease in inflows, thereby contributing to theincrease in the level of liquidity in the banking system.To absorb the impact of the additional liquidity, BNMincreased its intervention and sterilised the inflowsduring the second half of the year through additionalinterbank borrowing (including Islamic borrowing) ofRM12 billion, increasing the total intervention by BNMto RM46.1 billion as at end-December 2001. This hasensured that interbank rates remained stable, with thethree-month weighted average interbank rate rangingfrom 2.85% to 3.06% per annum during the year.
Cumulative Buffer as Mismatch % of total
(RM billion) deposits
1 wk. 1 mth. 1 wk. 1 mth.
Commercial banks1 37.1 51.8 11.5 16.1
Finance companies 8.0 11.4 9.9 14.1
Merchant banks 6.6 6.4 46.1 44.1
Banking system1 51.7 69.6 67.5 74.3
1 Excludes Islamic banks.
Table 4.12 Banking System1: Liquidity Projection as at 31 December 2001
0
2
4
6
8
10
12
14
16
<-5% -5-0% 0-5% 5-15% >15%As a % of Total deposits
No. of Institutions
Commercial banks Finance companies Merchant banks
Islamic banks
Graph 4.11Banking System: Profile of Potential LiquiditySurplus/Shortfall up to One Month Aheadas at 31 December 2001
Jan Feb Mar Apr May Jun Jul Aug Sept Oct Nov Dec
RM billion % per annum
BNM's total intervention (net of lending)from 31 January 2001 to 31 December 2001Weighted average 3-months Interbank Rate (RHS)
Months
0
10
20
30
40
50
60
2.7
2.75
2.8
2.85
2.9
2.95
3
3.05
3.1
Graph 4.10Liquidity in the Banking System in 2001

Financial Sector
buckets and only one finance company and onecommercial bank projected a shortfall of between-5% and 0% for the 1-month bucket as compared to12 banks as at end-December 2001. With theproportion of assets that were liquid also remaininghigh at RM59.4 billion (in terms of forced sale value) asat end-December 2001, the ability of the bankingsystem to withstand potential liquidity shocks hassignificantly improved. The ample liquidity in thebanking system would then enable banking institutionsto conduct increased intermediation activities to supportthe economic growth momentum.
Interest Rate RiskAs activities in the debt market increased in tandemwith the low interest rate environment, andsignificant growth in fixed rate loans, particularlyloans for the purchase of transport vehicles, the levelof interest rate risk in the banking system remainedmanageable. Nevertheless, the overall interest ratemismatch profile of the banking system as at end-2001 remained structurally similar, with negativeinterest rate mismatch positions concentrated in theshorter term maturities and positive interest ratemismatches in the longer term maturities. Thisreflects the nature of domestic banking activities andthe lack of long-term hedging instruments, whereassets with longer tenure interest rate repricing arenot funded by liabilities of similar interest raterepricing tenure.
Focusing on the shorter term tenure of the interest ratemismatch profile, the net positive gap position in the lessthan 1-month repricing bucket is driven by significantconcentration in floating rate BLR type loans that matureor are repriced within 1-month, accounting for over40% of banking institutions’ interest sensitive assets.Nevertheless, with short-term deposits beingpredominantly repriced between the 1 to 12 monthsbuckets, the negative gap position within these repricingbuckets have offset the positive gap position in the lessthan 1-month bucket. As at 31 December 2001, over83.3% of interest rate sensitive liabilities wereconcentrated in the less than one year repricing buckets.
On the other hand, across the medium- to long-termspectrum of banking institutions’ interest rate maturityprofile, the depth in funding is still relatively shallowgenerally due to the lack of long-term hedginginstruments and partly to the preference of depositorstowards shorter term deposits in view of the presentlow interest rate environment. This has resulted in thepositive interest rate mismatch. As a percentage ofinterest rate sensitive assets with repricing maturityabove one year, fixed rate loans accounted for 67%whilst fixed rate debt securities accounted for 30%.
Adopting the duration weighted position concept inthe analysis of banking institutions’ interest rate riskwhich ascertains the potential loss in economic valueof banking institutions’ on- and off-balance sheetposition given a one percentage point shift in interestrates, as at end-2001, the duration weighted netposition of the banking system amounted to RM4.4billion. Reflective of the interest rate mismatchprofile, most of the exposure to interest rate risk wasconcentrated in the maturity buckets exceeding three
143
Commercial banksFinance companies
Merchant banks Banking system
1 Excludes Islamic banks
Mismatches(RM billion)
-60
-40
-20
0
20
40
60
80
Tenure range
≤1mth
>1 - 3 mths
>3 - 6 mths
>6 - 12 mths
>1 - 2 yrs
>2 - 3 yrs
>3 - 5 yrs
>5 - 10 yrs
>10 - 15 yrs
> 15 yrs
Graph 4.12Banking System1: Net Interest Rate PositionMismatches as at 31 December 2001
Table 4.13Banking System1: Impact of 1% Rise in InterestRate on Solvency and Balance Sheet
Duration weighted net position
As a percentage of
RM million Capital base Total assets(%) (%)
2000 2001 2000 2001 2000 2001
Commercial banks -1,842 -2,281 -4.3 -5.2 -0.4 -0.4
Finance companies -1,323 -1,846 -14.2 -19.3 -1.2 -1.5
Merchant banks -216 -224 -4.7 -4.9 -0.6 -0.6
Banking system -3,381 -4,351 -6.0 -7.5 -0.5 -0.6
1 Excludes Islamic banks.

years. The duration weighted position of the bankingsystem in the 3 to 10 years and the more than 15years repricing buckets amounted to RM2.4 billionand RM1.5 billion respectively, representing 54% and35% of the total duration weighted position of thebanking system. This was largely due to fixed ratefinancing granted by the finance companies,particularly hire purchase financing, block discountingand lease financing, and the commercial banks andmerchant banks long-term fixed rate loans andholdings of fixed rate securities for liquidity andinvestment purposes.
On an industry-type basis, the majority of theexposure to interest rate risk has been fromcommercial banks and finance companies, whichhave respectively accumulated a duration weightedposition of RM2.3 billion and RM1.8 billion or a52.4% and 42.4% share from the total durationweighted position of the banking system as at end-2001. The rise in interest rate risk of financecompanies can be explained by the significantgrowth in fixed rate loans in the 3 to 5 years and 5to 10 years bucket by 56.1% and 89% to RM8billion and RM17.4 billion respectively. On theother hand, the commercial banks’ growth ininterest rate risk is due to their increased activitiesin fixed rate debt securities in the medium-termtenures and the long-term fixed rate loan activitiesof two commercial banks, predominantly in theform of Islamic type financing and staff loans withmaturity exceeding 15 years amounting to overRM9 billion. The duration weighted position ofmerchant banks remain relatively small with a totalamount of RM224 million as compared to RM216million as at end-2000.
In relating the impact of interest rate risk to the stabilityof the banking system, the duration weighted positioncan be used to measure against the potential erosion ofthe value of banking institutions’ capital base and assets.In terms of assets, as at 31 December 2001, theexposure of the banking system towards interest raterisk was rather insignificant with a potential loss of only0.6% in the value of the banking system’s total assetsfor a one percentage point rise in interest rates.Nevertheless, this would translate to an erosion of 7.5%in the value of the banking system’s capital basecompared to 6% as at end-2000. This was due to theincreased exposure of finance companies to interest raterisk in relation to their fixed rate loan activities. Thepotential loss to the value of finance companies’ capitalbase amounts to 19.3%, higher than 14.2% recorded inthe previous year. On the other hand, merchant banksand commercial banks experienced a marginal increasein the erosion in capital base for a one percentage pointrise in interest rates, recording 4.9% and 5.2%,respectively. On an individual institution basis, 12institutions were exposed to interest rate risk exceeding10% of their capital base, nine of which were financecompanies reflecting the high interest rate risk nature oftheir activities. The other institutions were onecommercial bank and two merchant banks whoseactivities in the debt market increased significantly. Mostof the remaining commercial banks and merchant bankshad a potential loss in capital base of less than 5% for aone percentage point shift in interest rates.
Equity RiskThe banking system’s exposure to equity investmentsremained insignificant as at end-2001, with theoverall outstanding equity holdings representing only0.2% of the system’s total assets. Investments inquoted shares during the year declined from RM1.8billion to RM1.5 billion due mainly to the lacklustreperformance of the Kuala Lumpur Composite Index(KLCI) as a result of global economic slowdown. TheKLCI peaked just above 700 points in the firstquarter of 2001, but remained below 700 points forthe remaining part of the year, resulting in lowerdebt-to-equity conversions which declined by 25%during the year.
The relative uncertainty and weak sentiment in thestock market throughout the year, led to a largerproportion of equity held by banking institutions dueto underwriting, which increased by 5% fromRM64.5 million as at end-2000 to RM143.7 million asat end-2001. The holdings of unquoted shares, whichrepresented 0.1% of the system’s total assets alsoregistered a decline.
144
0
2
4
6
8
10
12
14
16
18
Up to 5 >5 - 10 >10 - 15 >15 - 20 > 20Duration Weighted Position / Capital Base (%)
Number ofinstitutions
Commercial banksFinance companiesMerchant banks
1 Excludes Islamic banks
Graph 4.13Banking System1: Distribution by Duration Weighted Net Position as a Percentage of CapitalBase as at 31 December 2001

Financial Sector
Reflective of the weak stock market, both thecommercial banks and finance companies reducedtheir equity holdings by 25% and 15% respectively in2001. The merchant banks however registered anincrease in their equity holdings by 30.2%, mainlyfrom underwriting activities as a result of lacklustreinitial public offers in the first half of the year.Consequently, merchant banks had the highest equityexposure as their holdings of quoted sharesaccounted for more than 8% of their capital base,while equity exposure of commercial banks andfinance companies accounted for only 1.8% and3.7% of their capital base respectively. In terms ofindividual banking institutions, most banks had lessthan 2% of the capital base exposed to equity risk.However, three merchant banks had an equityexposure in excess of 20% of capital base.
In the face of a more volatile market, the estimatedpotential loss in equity value based on a 10-dayvolatility of the KLCI, was higher at 17% in the year2001 as compared to only 10% in 2000. Despitethe higher volatility, potential loss to the bankingsystem in the event of a decline in the stock marketwas estimated to be only 0.4% of the total capitalbase in 2001, as compared to 0.5% in 2000. Thismarginal loss is due to the overall reduction in theequity holdings of the banking institutions.
While the equity potential loss of commercial banksand finance companies was reduced to 0.3% and0.6% of their respective capital base, merchant banks,on the other hand, had the highest potential lossfrom equity risk of 1.5%, which is 40 basis pointshigher compared to the year 2000, due to higherequity holdings coupled with the merchant banks’relatively smaller capital base. However, this exposureremained insignificant and did not pose any threat tothe stability of the banking system.
145
MarketPurchase
28%
Underwritting9%
LoanConversion
58%
Quoted Shares71%Unquoted
Shares29%
DebtSatisfaction
4%
31 December 2001
31 December 2000
1
MarketPurchase
21%Loan
Conversion
Underwriting4%
Quoted Shares66%
UnquotedShares34%
68%Excludes Islamic banks
DebtSatisfaction
7%
Graph 4.14Banking System1: Composition of EquityInvestments
Table 4.14Banking System1: Equity Exposure
Equity2 holdings Potential equity2 loss(RM million) / Capital base (%)
2000 2001 2000 2001 2000 2001
Commercial banks 1,031.2 768.5 2.4 1.8 0.4 0.3
Finance companies 417.3 354.9 4.6 3.7 0.8 0.6
Merchant banks 305.8 398.1 6.6 8.7 1.1 1.5
Banking system1 1,754.3 1,521.6 3.1 2.6 0.5 0.4
1 Excludes Islamic banks.2 Amount of investment in quoted shares.
Equity2 / Capital base (%)
0
5
10
15
20
0 - 2 2 - 4 4 - 8 8 - 13 13 - 20 >20 Equity as % of Capital Base
Commercial banks Finance companies
No. of BankingInstitutions
Merchant banks1 Excludes Islamic banks
Graph 4.15Banking System1: Distribution by Equity as a Percentage of Capital Base as at 31 December 2001

Foreign Exchange RiskAlthough the interest rate differential between the USDand Ringgit narrowed in the first half of 2001 causingthe forward discount in the foreign currency forwardmarket to reduce considerably, there was strongdemand for foreign currency forward contracts byimporters during this period. Foreign currencyforwards sold by banking institutions increased byRM10 billion during the period of heightenedspeculation by the market that the Ringgit would berepegged downwards against the USD. As a hedgeagainst these forward contracts, holdings of foreigncurrency assets by banking institutions rose to peak atRM21.3 billion as at end-May 2001. Consequently,the net open foreign currency position of the bankingsystem rose to RM3.1 billion as at end-June 2001before easing off in the second half of the year toRM2.3 billion at the end of 2001.
In the second half of 2001, the continued fall in USDinterest rates further narrowed the interest ratedifferential between the USD and Ringgit, andsubsequent rate cuts by the US Federal Reserveresulted in USD interest rates falling below thedomestic interest rate from September 2001 onwards.This dampened the demand for foreign currencyforwards by importers which resulted in foreigncurrency forward sales by banking institutions decliningfrom RM25.9 billion as at end-May 2001 to RM13.6
billion as at end-2001. Subsequently, the holdings offoreign currency denominated assets by bankinginstitutions contracted in response to reduced hedgingrequirements. By year end, net foreign currency assetsof the banking system declined to RM8.4 billion asagainst RM9.8 billion as at end-2000.
The foreign currency risk undertaken by the bankinginstitutions remained within prudential levels as therewas only a marginal increase in foreign currencyexposure compared to end-2000. The commercialbanks’ net open foreign currency position as apercentage of capital base increased by 0.9 percentagepoints to 5.1% and by 0.8 percentage points to 1% forthe merchant banks. On an individual banking institutionbasis, only six commercial banks and one merchant bankout of the total 35 commercial and merchant banks hadnet open foreign currency position as a percentage ofcapital base above 5%. Of the seven, four had a netexposure beyond 10%. The high exposure of theseinstitutions were generally attributable to increasedforward purchases as well as off-balance sheet fundingof domestic activities through the swap market.
146
NOP NOP/Capital Base(RM million) (%)
end-2000 end-2001 end-2000 end-2001
Commercial banks 1,824 2,221 4.2 5.1
Merchant banks -8 47 0.2 1.0
Banking system 1,816 2,268 3.8 4.7
1 Excludes Islamic banks.
Table 4.15Banking System1: Foreign Currency Exposure
0
2
4
6
8
10
12
14
16
<-10 -10-<-2 -2-<2 2-<5 5-<10 ≥10
NOP/Capital Base (%)
Number ofinstitutions
Commercial banks
Merchant banks
Excludes Islamic banks1
Graph 4.17Banking System1: Distribution of Net OpenForeign Currency Position as at 31 December 2001
2001
RM billion % p.a
Net open foreign currency position
Net foreign currency swap purchasedNet foreign currency assets(including value spot and tomorrow)3-month avg KLIBOR (RHS)US TBill secondary market rate (RHS)Net outright forward foreign currency purchased
1 Excludes Islamic banks
-25
-20
-15
-10
-5
0
5
10
15
20
25
0
1
2
3
4
5
6
J F M A M J J A S O N D
Graph 4.16Banking System1: Foreign Currency Exposure

Financial Sector
Capital StrengthThe capital position of the banking systemstrengthened during the year to 12.8% as atend-2001 on the back of continued profitability andcapital injections into the banking institutions tosupport their enlarged operations following theconclusion of the mergers as well as to meet the 31December 2001 deadline of a higher minimum capitalfunds requirement. Profits (excluding unauditedprofits for the year 2001) accounted for RM2.8 billionof the increase whilst new capital injectionscontributed another RM3.7 billion. On a net basis,capital base of the banking system has increased byRM1.6 billion on a year-on-year basis. This is largelydue to the exclusion of the capital base of 16 bankinginstitutions amounting to RM4.1 billion, which weremerged or absorbed as a result of the consolidationprocess during the first quarter of the year.
Concurrent with the profits earned and increase incapital funds, total Tier-1 capital of the bankingsystem increased by RM2.6 billion or 5.2% to RM53.4billion as at end-2001. Total Tier-2 capital howeverrecorded a marginal increase of RM0.2 billion.Reflective of the stronger capital position of thebanking system in 2001, its risk-weighted capital ratio(RWCR) increased to 12.8% in December 2001 from12.5% as at end-2000 while core capital ratio (CCR)increased by 10 basis points to 10.8%. Both theRWCR and CCR far exceeded the internationallyprescribed ratios of 8% and 4%. Overall, the RWCRof the banking system was consistently above 12%throughout 2001 except for January 2001 when itdipped to 11.8% while the CCR was sustained above10% throughout 2001.
Although the capital base of the commercial banksand finance companies improved from their end-2000position, only the commercial banks registered animprovement in their RWCR from 12.2% as at end-2000 to 12.6% as at end-2001. The increase in thecapital base of the finance companies was moderatedby higher investments in subsidiaries following thetakeover of a finance company in conjunction withthe merger exercise. This, coupled with strongdemand for hire purchase financing in 2001, resultedin the RWCR of the finance companies declining by10 basis points to 11.4% as at end-2001. The capitalbase of merchant banks has declined after deductinginvestments in subsidiaries which has increased by658% in 2001 following the acquisition/establishmentof two new subsidiaries by a merchant bank.However, the RWCR of merchant banks increased to19.1% from 17.1% as at end-2000 due to the
reduction in the risk-weighted assets caused by adecline in the loan base, in line with the trend to shiftthe focus of activity from lending to advisory services.
The total risk-weighted assets of the banking systemincreased marginally by 0.2% or RM1.1 billion toRM465.4 billion as at end-2001 in line with amoderate loan growth. Of the various categories ofrisk-weighted assets, the risk-weighted assets of 0%and 50% risk-weight categories had increased due tothe increase in investments in low risk assets andhousing loans secured by first charge. Assets in the10% risk-weight category continued to shrink asbanking institutions reduced their holding ofCagamas papers whilst assets in the 20% risk-weightcategory shrank due to the reduction in investmentsin corporate papers that are guaranteed by domesticBIs following the maturity of such papers. Assets inthe 100% risk-weight category fell mainly due to thewrite-off of the amount recoverable from Danaharta.
147
Table 4.16Banking System1: Constituents of Capital
As at end
2000 2001
RM million RM million %
Tier-1 capital 50,786.9 53,419.5 2,632.6 5.2Tier-2 capital 14,753.6 14,960.2 206.6 1.4
Total capital 65,540.5 68,379.7 2,839.2 4.3
Less:Investment in
subsidiaries and holdingsof other banking institutions’capital 7,662.6 8,923.6 1,261.0 16.5
Capital base 57,877.9 59,456.1 1,578.2 2.7
Risk assets:0% 121,482.3 124,822.2 3,339.9 2.710% 17,864.5 15,985.5 -1,879.0 -10.520% 104,355.8 97,728.5 -6,627.3 -6.450% 80,985.4 92,666.9 11,681.5 14.4100% 401,143.3 397,872.7 -3,270.6 -0.8
Total risk-weighted assets 464,293.6 465,350.4 1,056.8 0.2
Risk-weightedcapital ratio (%)
Banking system1 12.4 12.8 0.4 3.2
Commercial banks 12.2 12.6 0.4 3.3Finance companies 11.5 11.4 -0.1 -0.9Merchant banks 17.1 19.0 1.9 11.1
1 Excludes Islamic banks.
Annualchange

With the strong capital base of the banking systemfollowing the higher revised minimum capital funds,the conclusion of the merger programme and theprofits recorded in 2001, the banking system is wellpositioned to meet the loan demands which wouldaugur well for the growth of the economy in 2002.
ISLAMIC BANKING
The Islamic banking industry sustained its expansiondespite slower economic growth during the year. In termsof the market share relative to the banking system, theshare of Islamic banking assets and deposits increased to8.2% and 9.5% respectively, surpassing the 8% targetsset for the year 2001 (6.9% and 7.4% respectively in2000). Total financing registered an increase to 6.5%compared with 5.3% in 2000. The continued expansionof the Islamic banking sector was mainly attributable to
the various measures undertaken by BNM and continuousefforts by the industry players in introducing newinstruments as well as measures to enhance the Islamicbanking industry in areas that were outlined in theFinancial Sector Masterplan (FSMP) on Islamic banking andtakaful.
The FSMP has set a 20% target to be achieved by 2010,in terms of the market share of Islamic banking assetsrelative to the total banking system. The development of awell-established and comprehensive regulatory frameworkthat preserves the integrity of the Islamic bankingoperations is an integral component of the work beingundertaken to set up an appropriate prudential standardfor the Islamic banking industry. To further strengthen theregulatory framework of Islamic banking and to improvethe operational efficiency of Islamic banking institutions,BNM introduced the following measures in 2001:
• Requirement to observe the minimum risk weighted capital adequacy ratio framework for the Islamic banking portfolios of conventional banking institutions participating in the Islamic Banking Scheme (IBS banks)With effect from 2 January 2002, in order to steer the development of Islamic banking, BNM set a series of targets to be achieved by the IBS banks. IBS banks are required to observe a minimum core capital ratio of 4% and risk-weighted capital ratio of 8% for their Islamic banking portfolios. The new requirement is expected to promote a more efficient utilisation of Islamic banking capital funds and enhance thelevel playing field among IBS banks. This is an initial effort to prepare the regulatory platform that is sensitive and tailored specifically to address the distinct risk characteristics of Islamic banking. To ensure full disclosure and transparency, the IBS banks are required to maintain a separate disclosure on the capital adequacy of their Islamic banking portfolios in the financial statement.
• Standard framework for the computation of the rate of return for Islamic banking institutionsBNM formulated a standard framework for the computation of the rate of return for Islamic banking institutions, aimed at providing a level playing field and terms of reference for the Islamic banking players in deriving the rate of return. The framework would allow BNM to assess the efficiency, profitability, prudent management and
148
Table 4.17Islamic Banking: Key Data
As at end Change (%)2000 2001 2001
Number of financial institutions 49 38 –22.4
Commercial banks 21 14 –33.3 Finance companies 14 10 –28.6 Merchant banks 5 5 0.0 Islamic banks 2 2 0.0 Discount houses 7 7 0.0
Total assets (RM million) 47,068 58,929 25.2 Commercial banks 20,094 26,750 33.1 Finance companies 7,150 9,749 36.3 Merchant banks 1,507 1,353 –10.2 Islamic banks 14,029 17,328 23.5 Discount houses 4,288 3,749 –12.6
Total deposits (RM million) 35,923 47,106 31.1 Commercial banks 16,091 22,031 36.9 Finance companies 5,393 7,664 42.1 Merchant banks 867 673 –22.4 Islamic banks 11,304 14,375 27.2 Discount houses 2,268 2,363 4.2
Total financing (RM million) 20,891 28,201 35.0 Commercial banks 8,606 12,256 42.4 Finance companies 5,090 7,613 49.6 Merchant banks 769 771 0.3 Islamic banks 6,426 7,561 17.7 Discount houses – – 0.0
Financing-deposits ratio (%) 58.2 59.9 1.7 Commercial banks 53.5 55.6 2.1 Finance companies 94.4 99.3 5.0 Merchant banks 88.7 114.6 25.9 Islamic banks 56.8 52.6 –4.2 Discount houses – – 0.0
Number of branches 131 132 0.8 Commercial banks 7 8 14.3 Finance companies 2 2 0.0 Islamic banks 122 122 0.0
Number of counters 2,087 2,065 –1.1 Commercial banks 1,338 1,335 –0.2 Finance companies 745 730 –2.0 Merchant banks 4 0 –100.0

Financial Sector
fairness of Islamic banking institutions more effectively. Furthermore, the standardisation of the calculation of the rate of return would serve to address the information asymmetry between the bank and its depositors, by enhancing transparencyand ensuring that depositors receive their fair shareof the return on investment, in conformity with the Shariah principles.
To provide greater strategic focus to Islamic bankingoperations and facilitate greater economies of scale,BNM has encouraged the IBS banks to rationalise theirIslamic banking operations within their respective
banking groups. Consolidation would result in a widerrange of Islamic banking facilities, better synergieswithin the group, enhanced cost effectiveness andefficiency, thereby, placing the IBS banks in a betterposition to expand their Islamic banking operations.One domestic banking group established the firstdomestic one-stop Islamic financial centre, providing awide range of facilities to meet customer requirements.
As part of the activities to promote Kuala Lumpur asa regional Islamic financial centre, the Kuala LumpurInternational Summit was held from 19 to 21February 2001. The Summit provided an avenue forregulators, practitioners and academicians todeliberate on the issues and challenges confrontingIslamic banking and finance. In conjunction with theSummit, the Islamic Banking and Finance InstituteMalaysia (IBFIM) was launched as an industry-ownedresearch and training institute. IBFIM would be aone-stop centre for providing education, trainingand research on Islamic financial services, coveringIslamic banking, takaful and Islamic capital market atboth the domestic and the international levels.
As part of the initiatives to enhance the effectiveness indisseminating information on Islamic banking andtakaful, the Islamic Banking and Takaful Week (IBTW)was held from 26 October to 2 November 2001. Theprimary objective was to promote greater publicawareness and knowledge on Islamic banking andtakaful, as well as to build a high impact campaign onIslamic banking and takaful at the Islamic financial
institutions. Apart from the Islamic banking institutions(comprising the Islamic banks and IBS banks) andtakaful companies, the development financeinstitutions offering Islamic products and services alsoparticipated in the campaign.
In conjunction with the IBTW, was the launch of theIslamic banking logo. The main objective of the logois to increase the visibility of Islamic banking,particularly in conventional banking institutionsoffering both conventional and Islamic bankingproducts and services. The Islamic banking institutionsare required to display the logo at their premises to
indicate the availability of Islamic banking productsand services offered. The logo would also be used bythe Islamic banking institutions in their documentsand brochures related to Islamic banking transactions.In conjunction with the IBTW, the Association ofIslamic Banking Institutions Malaysia (AIBIM)introduced two awards, the ‘Islamic Banker Award’for individual contribution and ‘Best PerformanceInstitution Award’ for individual institutioncontribution, to acknowledge meaningfulcontributions made for the development of theIslamic banking industry in Malaysia.
In line with the recommendations of the FSMP toincrease the market penetration level and to deepen theIslamic financial market, BNM formed two consultativecommittees, the Consultative Committee on Services(CCS) and Consultative Committee on Product andMarket Development (CCPMD), comprising BNM andrepresentatives of the Islamic banking institutions andtakaful companies. The CCS was formed with theobjective of setting the minimum best practice standardfor Islamic banking in customer service, establishingimage building as well as promoting public awarenessand knowledge on Islamic banking and finance. TheCCPMD was formed to drive the innovation anddevelopment of Islamic banking products.
Consequent to the continuous efforts to enhance thesavings avenue for senior citizens and charityorganisations, half of the Bon Simpanan Malaysia Siri03 issuance was based on the Islamic principle of Bai’
149
The Islamic banking logo provides the branding of Islamic financial products and services and reflects the commitment of the Islamic banking institutions in developing Islamic banking and finance as envisioned by the FSMP.

Al-Inah (sell and buy back) where the bankidentifies the assets and sells them to thecustomers. The customers will then sell back theassets at a higher price and in return, the bankissues the bond to the customers. The Islamic bondshave a maturity period of two years and a rate ofreturn of 5% per annum. During the year, BNMissued specific operational guidelines to govern theadministration of three government funds disbursedunder the Islamic concept, namely the NewEntrepreneurs Fund 2 (NEF 2), EntrepreneursRehabilitation and Development Fund (ERDF) andFund for Food (3F).
During the year, the Malaysian Accounting StandardsBoard (MASB) issued MASB Standard i-1 (Presentationof Financial Statements of Islamic FinancialInstitutions). The objective of the standard is to laydown the basis for the presentation and disclosure of
financial statements of Islamic financial institutionsthat conduct Islamic banking activities.
Sources and Uses of FundsIn 2001, the total assets of the Islamic banking sectorincreased by RM11.9 billion or 25.2%, to RM58.9billion as at end-2001. A significant portion of theincrease in the total assets (RM7.3 billion or 61.3%)was contributed by the financing disbursed during theperiod. As in the previous years, the largest portionof the Islamic banking assets remained with the IBScommercial banks with a market share of 45.4%,followed by the Islamic banks (29.4%) and the IBSfinance companies (16.5%). Both the IBS commercialbanks and finance companies recorded moderategrowth in their assets of 33.1% and 36.3%,respectively. The increase in assets was attributable tothe growth in total financing of IBS commercial banks(42.4%) and finance companies (49.6%), constituting70.5% of the total financing.
A major portion of funds in the Islamic bankingsector continued to be sourced from deposits,which accounted for 79.9% of the total resources.Total deposits recorded a moderate growth of31.1% or RM11.2 billion to reach RM47.1 billion asat end-2001, capturing a market share of 9.5%(7.4% in 2000) of the total banking industry. Whilethe deposits of the IBS finance companies recordedthe highest growth (42.1%), the bulk of Islamicbanking deposits (46.8%) remained with the IBS
150
Table 4.18Islamic Banking: Sources and Uses of Funds
As at end 2000 2001
RM % RM %million share million share
Sources:Capital and reserves 2,526 5.4 3,434 5.9Debentures and notesDeposits 35,923 76.3 47,106 79.9
of whichINI issued 500 1.1 1,222 2.1Repos 431 0.9 1,655 2.8
Amount due to financial institutions 4,796 10.2 4,173 7.1
Domestic 4,796 10.2 4,173 7.1Foreign
Bankers acceptances 597 1.3 728 1.2Others 3,227 6.9 3,488 5.9
Total 47,069 100.0 58,929 100.0
Uses:Cash 348 0.7 201 0.3Reserve with BNM 724 1.5 878 1.5Amount due from financial institutions 8,743 18.6 11,502 19.5
Domestic 8,743 18.6 11,062 18.8Foreign – ... 440 0.7
Investments 3,135 6.7 10,148 17.2of which:Stock and shares 82 0.2 45 0.1Debentures 2,808 6.0 9,909 16.8Fixed Assets 245 0.5 194 0.3Foreign investments – ... – 0.0
Placement with discount houses – – – ...
Marketable securities 12,877 27.4 5,309 9.0of which:Treasury bills - - - - GII 357 0.8 908 1.5INI held 212 0.5 184 0.3Cagamas bonds 134 0.3 84 0.1
Financing 20,891 44.4 28,201 47.9Others 351 0.7 2,690 4.6
Total 47,069 100.0 58,929 100.0
– ... – ...
– ... – ... Table 4.19Islamic Banking: Deposits by Type and Institutions
As at end
2000 2001 2001RM RM RM
million million million
Demand deposits 1,190 22.1 –107 –1.6 6,457Commercial banks 580 18.1 55 1.5 3,841Islamic banks 610 28.1 –162 -5.8 2,616
Savings deposits 817 32.5 822 24.7 4,149Commercial banks 567 56.0 553 35.0 2,133Finance companies 145 50.7 131 30.4 562Islamic banks 105 8.7 138 10.5 1,454
Investment deposits 9,405 62.5 9,041 37.0 33,505Commercial banks 3,917 66.6 3,808 38.8 13,610Finance companies 2,214 87.3 2,237 47.1 6,986Merchant banks 129 32.2 -160 -30.2 370Islamic banks 877 14.1 3,066 43.1 10,181Discount houses 1,159 104.5 90 4.0 2,358
Other deposits 814 108.1 1,428 91.1 2,995Commercial banks 451 95.6 1,524 165.1 2,447Finance companies –96 –45.3 116 Merchant banks 337 –34 –10.1 303Islamic banks 26 37.7 29 30.5 124Discount houses 5 5
Annual change
% %
–
–
–
– –

Financial Sector
commercial banks. The growth in depositsreflected public confidence and acceptance ofIslamic banking as well as the competitive rate ofreturn on deposits.
In terms of types of customers, deposits frombusiness enterprises accounted for 30.5% of thetotal deposits, followed by Government (23.7%)and the domestic non-bank financial institutions(20.2%). Investment deposits continued to capturea major portion of the Islamic banking deposits(71.1%), registering a strong growth of 37% toreach RM33.5 billion as at end-2001. The savingsdeposits recorded a growth of 24.7%, while thedemand deposits recorded a slight decline of 1.6%during the period.
In terms of the maturity profile of the investmentdeposits, 61.1% of the deposits (65.3% in 2000)continued to be concentrated at the shorter end ofthe yield curve, mainly one to three months maturity.The one to three months maturity captured 59.4% ofthe general investment deposits and 72% of thespecific investment deposits (63.6% and 80.8%
respectively in 2000). The trend is relatively similar tothe fixed deposits of the conventional banking systemfor which the shorter end of the yield curverepresented a share of 49.3% of the depositsplacement (53.4% in 2000). The average rates ofreturn for the investment deposits with placement ofless than three months maturity were in the range of2.6% to 3.6% and for placement of one year andabove, the range was 3.3% to 4.5%. The smallincremental return between the shorter and longerplacement tenures and the uncertainty of future ratesof return led to the continued concentration at theshorter end of the yield curve by depositors.
As at end-2001, shareholders’ fund of the Islamic banksand the Islamic banking capital fund of the IBS bankinginstitutions saw a significant increase of RM908 millionto RM3.4 billion. This increase was mainly attributableto higher retained profits during the year. Theprofitability of the Islamic banking sector recorded atotal pre-tax profit of RM905.9 million during the yearcompared with RM533.3 million in 2000.
Total financing extended by the Islamic bankingsector expanded by RM7.3 billion or 35% (RM7.2billion or 52.2% in 2000). The financing-depositsratio increased to 59.9% at end-2001 from 58.2%at end-2000. As in the previous years, financing tothe broad property sector and consumption creditremained significant, increasing by 38.2% and24.2% respectively. The higher demand for propertysector financing was attributed to the growth in theend-financing for residential properties (72.2%),benefiting from the Property-Ownership Campaignbacked by the Government during the year. Meanwhile, financing for the purchaseof passenger vehicles also recorded an increase of
151
Table 4.20Islamic Banking: Direction of Financing
As at end 2000 2001
RM % RM %million share million share
Agriculture, hunting, forestry and fishing 1,577.7 7.6 1,639.6 5.8
Mining and quarrying 78.5 0.4 64.0 0.2Manufacturing 2,044.3 9.8 3,073.4 10.9Electricity, gas and water 855.6 4.1 543.6 1.9Community, social and personal services 292.7 1.4 353.1 1.3
Broad property sector 7,506.3 35.9 10,782.5 38.2Real estate 363.1 1.7 565.8 2.0Construction 1,572.0 7.5 1,698.3 6.0Purchase of residentialproperty 3,974.4 19.0 6,845.9 24.3
Purchase of non-residential property 1,596.8 7.6 1,672.4 5.9
Wholesale, retail, restaurants and hotels 854.7 4.1 1,135.2 4.0
Transport, storage and communications 787.9 3.8 763.0 2.7
Finance, insurance and business services 595.7 2.9 1,229.5 4.4
Purchase of securities 705.0 3.4 872.6 3.1Consumption credit 4,043.1 19.4 6,812.7 24.2
Credit cards 1.4 … 3.0 …Personal uses 340.2 1.6 686.9 2.4Purchase of consumer durables 43.1 0.2 55.2 0.2
Purchase of transport vehicles 3,658.4 17.5 6,067.7 21.5
Others 1,549.7 7.4 932.1 3.3
Total 20,891.2 100.0 28,201.3 100.0
Other Islamicconcepts15.9%
Al-Musyarakah1.4%
Al-Murabahah7.0%
Al-Istisna'0.9%
Al-IjarahThumma Al-Bai
22.2%
Al-Ijarah4.3%
Al-BaiBithaman Ajil
48.3%
Graph 4.18Islamic Financing Concepts as atDecember 2001

152
65.9% to RM6.1 billion in 2001 from RM3.7 billionin 2000, duly caused by the relatively lowerprofit-taking ratio charged for financing whichaveraged 4.5% per annum in 2001 (averaged 6%per annum in 2000).
In tandem with the continued exposure of Islamicfinancing to the broad property sector, financingbased on Bai Bithaman Ajil (BBA) constituted thebulk of total financing (48.3%), amounting toRM13.6 billion as at end-2001. This was followedby Ijarah Thumma Al-Bai (AITAB) financing thatrecorded a significant increase of 68.3%, reflectingthe tremendous demand for the Islamic hirepurchase financing during the year.
ProfitabilityAs in the previous year, the Islamic banking sectorcontinued to record a significant increase in profits.Pre-tax profit rose by 69.9% to RM905.9 million forthe calendar year 2001 (RM533.3 million in 2000).With the improvement in profitability, the Islamicbanking sector was able to provide a positive rateof return on assets of 1.5% (1.1% in 2000) and areturn on equity of 26.4% (21.2% in 2000).
The higher profitability recorded in 2001 was largelydue to the increase in total finance income ofRM2.9 billion, where income from financingconstituted 67% of the total finance income.Investment income also increased by 206.8% orRM89.1 million in 2001 (RM29 million in 2000) dueto gains from the sale of investment securities,while trading income increased by 60.4% toRM108.1 million in year 2001 (RM67.4 millionin year 2000).
Asset QualityThe asset quality of Islamic financing deterioratedmoderately during the year 2001, with net non-performing financing (NPF) ratio increasing to 7.2%from 7% in 2000. The financing loss provisions(income-in-suspense, specific provisions and generalprovisions) increased slightly to RM1.4 billion fromRM1 billion in 2000. The increase in financingloss provisions was mainly due to the increase ingeneral provisions by 49.4%, and specificprovisions by 49%.
The bulk of the NPF was concentrated in the broadproperty sector, where NPF expanded by 57.4% orRM609.8 million in 2001 to account for the largestshare of 56.7% of total NPF (50.2% in 2000). The highNPF in the broad property sector reflected the
significant increase of NPF in the residential and non-residential property sectors of RM371.1 million andRM128.3 million respectively.
Islamic Interbank Money Market (IIMM)The outstanding amount of liquidity absorbed fromthe IIMM through BNM operations increased by51.3% to RM5.9 billion, mainly due to theconcentration of BNM’s liquidity operation onmedium-term tenure investment via theMudharabah Money Market Tender. This wasevidenced by the increase of 46.3% in the volumeof the one-month maturity profile of MudharabahInterbank Investments. However, this had led to adecline in the volume of Mudharabah funds in theovernight (-17.8%) and 1-week (-26.4%) tenures,which subsequently resulted in a reduction in theoverall trading volume of Mudharabah interbankinvestments of 14.9% from RM283.6 billion in theyear 2000. This reduction was also due to the shiftof Mudharabah funds to investment activities inother Islamic instruments.
The total trading volume of Islamic instrumentsincreased by 42.5% to reach RM12.2 billion in theyear 2001 (RM8.6 billion in 2000). An important
Table 4.21Islamic Banking: Non-performing Financing andFinancing Loss Provision
As at end2000 2001
RM millionIslamic Banking
General provisions 314 469Income-in-suspense 163 182Specific provisions 535 797
Non-performing financing (NPF) 2,119 2,949Net NPF ratio (%) 7.04 7.24Total provisions/NPF (%) 47.76 49.10
Table 4.22Islamic Interbank Money Market (IIMM) *
2000 2001Volume Annual Volume Annual
(RM billion) change (%) (RM billion) change (%)MudharabahInterbankInvestments 283.6 -32.8 241.2 -14.9
Green BankersAcceptances 13.6 7.9 19.5 43.4
IslamicAcceptanceBill 4.7 291.7 3.9 -17.0
*Volume transacted through brokers.

Financial Sector
development in the trading of short-term Islamicinstruments was the marked growth in the volumeof trading of Bank Negara Negotiable Notes (BNNN),which amounted to RM1.2 billion (RM70 million in2000). The increase in the trading volume of BNNNwas associated with the higher issuance of BNNN ofRM1 billion (RM250 million in 2000) and highdemand for short-term Islamic instruments. The totaltrading volume of green bankers acceptance alsorecorded a significant growth of 43.4% (RM19.5billion). However, the trading volume of the Islamicacceptance bills was lower, totalling RM3.9 billioncompared with RM4.7 billion in the year 2000.
The trading of long-term Islamic instrumentscontinued to improve in 2001. During the year, thetotal trading volume was RM11 billion comparedwith RM8.5 billion in 2000. This was mainlyattributable to the increase in trading of Khazanahbonds amounting to RM5.9 billion (RM5.4 billion in2000). The total trading volume of GovernmentInvestment Issue (GII) amounting to RM2.4 billion,also contributed to the increase in the total tradingvolume of long-term Islamic instruments. Prior toJune 2001, GII was not a tradable instrument as itwas issued under the Islamic principle of QardhulHasan (benevolent loan), which did not permitsecondary trading. As part of BNM’s efforts todevelop and promote the secondary trading ofIslamic instruments, the issuance concept of GII waschanged from Qardhul Hasan to Bai’ Al Inah (selland buy back) concept as to allow GII to becomeone of the tradable instruments in the IIMM. As atthe end of 2001, the outstanding amount of GIIamounted to RM4 billion.
The average gross rates of return of the Islamic bankinginstitutions for the year 2001 were in the range of2.9% to 8.7%, with an average of 5.3%. Meanwhile,the average Mudharabah interbank rates concluded inthe IIMM were in the range of 2.8% to 3.1% with the
tenure ranging from overnight to 6 months. There wereno activities concluded above the 6 months tenure, asmarket participants were uncertain of the return oninvestment and also due to the lack of hedginginstruments available for market participants to hedgetheir longer-term exposure.
National Shariah Advisory CouncilIn 2001, the bank re-appointed all the sevenmembers of the National Shariah Advisory Council forIslamic Banking and Takaful (the Council) for the2001-2003 term. The Council held four meetingsduring the year of 2001 and deliberated more than15 Shariah issues. Among the major issues discussedand decided by the Council were:-
(i) Financing obtained through the New Entrepreneurs Fund (NEF) should be based on Bai’ Al-Inah (sell and buy back arrangement) concept instead of Bai’ Ad-Dayn (sale of debt). This is to avoid the possibility of sale and purchase of non-existence debt which may occur in the previous financing mechanism of the NEF based on Bai’ Ad-Dayn;
(ii) Islamic banking institutions are allowed to sell debt arising from vehicle financing based on Ijarah Thumma Al-Bai’ concept to Cagamas Berhad, following which, Cagamas will issue Cagamas Mudharabah bonds to finance the transaction. This will facilitate the securitisation of Islamic financing and provide additional investment opportunities to the market players; and
(iii)Islamic money market players are allowed to participate in intra-day transactions to manage their short-term liquidity needs. The mechanism for the intra-day transaction is similar to the inter-bank Mudharabah investment which is currently being practised. The shortened maturity period in intra-day transaction would ease liquidity constraints and allow market players to manage liquidity positions more efficiently.
International DevelopmentsWhile the FSMP primarily focused on thedevelopment of the Islamic banking industry on thedomestic front, BNM also participated actively in theglobal development of Islamic banking and finance.With the rapid development in the global Islamicfinancial industry, there was recognition for the needof a standard-setting body to adapt, develop andharmonise standards for Islamic financial productsand services that would foster the development of
153
Table 4.23Islamic Interbank Money Market (IIMM) -Maturity Profile *
2000 2001Volume Volume Change
(RM billion) (RM billion) (%)
Overnight and weekends 223.8 184 -17.8
1 week 66.3 48.8 -26.4
1 month 13.4 19.6 46.3
* Volume transacted through brokers and Mudharabah money market tender.

154
the industry. Against this background, meetings onthe Risk Management and Regulatory Standards forIslamic Financial Institutions among the centralbanks of the Muslim countries, the IslamicDevelopment Bank, Accounting and Auditing ofIslamic Financial Institutions, and the IMF agreedthat an international standard-setting entity,preliminarily known as the Islamic Financial ServicesBoard (IFSB), be established. The objectives of IFSB,among others, would be to promote thedevelopment of Islamic financial services industry aswell as effective supervision and regulation ofinstitutions offering Islamic financial productsthrough adaptation of new or existing standards,based on the recognition of the unique risks ofIslamic financial products and practices. IFSB wouldalso liaise and cooperate with relevant standardsetters and facilitate training and capacitydevelopment of personnel in relevant areas toensure effective oversight of the industry. Inaddition, it would enhance and coordinate initiativesto develop instruments and procedures for efficientoperations and risk management as well asundertake research on the Islamic financial industry.The IFSB is expected to be established in 2002 andMalaysia has been chosen to be the headquarter forthe Secretariat of the IFSB.
The year 2001 also witnessed a significant developmentin the International Islamic Financial Market (IIFM).Bahrain, Indonesia, Islamic Development Bank, Iran,Malaysia and Sudan signed the Article of Agreement onthe establishment of an IIFM Board on 13 November2001. This signified the global commitment andsupport for the initiative to create and structure aninternational financial market which accords andembraces Islamic principles. The IIFM Board is entrustedto develop and supervise the orderly development ofthe IIFM. The Board is supported by two committees,the Market and Product Development Committee(MPDC) and the Shariah Supervisory Committee (SSC).The MPDC would undertake research and developmenton universally accepted financial products which complywith the Shariah principles, and the SSC would endorseand approve the new products before they are traded inthe market. For this purpose, Shariah scholars fromseveral regions would be appointed to become the SSCmembers to ensure the harmonisation of the Shariahinterpretations. Meanwhile, the IIFM Secretariat islocated in Bahrain. The Labuan Offshore FinancialServices Authority and Labuan offshore players areexpected to capitalise on this development in promotingLabuan IOFC as one of the active centres for Islamicmoney and capital markets, particularly in this region.
On 1 November 2001, Malaysia entered into aMemorandum of Understanding (MoU) withBahrain to jointly promote the development ofIslamic banking and finance on the internationalfront. The MoU outlined the co-operativeframework between Malaysia and Bahrain for thedevelopment of the IIFM, the development ofprudential standards to govern the operationsof Islamic financial institutions, the convergenceof the accounting, auditing and Shariahstandards for international harmonisation aswell as training and research in the field of Islamicbanking and finance.
DEVELOPMENT FINANCIAL INSTITUTIONS
BackgroundDevelopment Financial Institutions (DFIs) areinstitutions that have been established and largelyfunded by the Government to promote thedevelopment of certain identified priority sectors andsub sectors of the economy, such as agriculturesector, infrastructure development, shipping,capital-intensive and high-technology industries aswell as to achieve certain social goals, by providingfinancial services and support to complement thebanking institutions. These DFIs are generallyspecialised in the provision of medium and long-termfinancing of projects that may carry higher credit ormarket risks due to the longer investment tenures.DFIs have played a significant role in thesocio-economic development of the country. It isenvisaged that in the next decade, DFIs will continueto progress and assume a more significant role inpursuing the Government policy goals for strategic,social and economic development. The realisation ofthis vision is supported by the recommendations forDFIs in the Financial Sector Masterplan (FSMP) thataims to improve supervisory framework for DFIs andto enhance DFIs’ effectiveness and efficiency inproviding specialised financial services.
Supervisory and Regulatory Framework for the DFIsDFIs were regulated and supervised by severalMinistries and State Agencies. The DevelopmentFinancial Institutions Act 2002 (DFIA) came into forcewith effect from 15 February 2002 to provide acomprehensive regulatory framework to ensure safeand sound financial management of the DFIs. DFIAtakes into consideration the unique roles, functionsand objectives of each DFI, the relevant provisions inthe existing statutes, the current supervisorystandards that are provided in the Banking and

155
Financial Sector
to deal with any mismanagement andmalpractices in the DFIs.
(f) Strengthen financial position and improveefficiency of asset and liability managementDFIA provides the mechanism to strengthen thefinancial position of DFIs. Prudential requirementsare imposed with the aim to ensure safe andsound financial operations of DFIs, so as to be inline with the best practices of insurancecompanies and banking institutions.
OTHER FINANCIAL INSTITUTIONS
Discount HousesTotal resources of discount houses continued to risein 2001 by RM2.7 billion or 12.8% (RM2.6 billion or13.8% in 2000). The increase mainly reflectedhigher interbank borrowings and deposits. Withdeposits increasing at a slower rate (8%; 38.2% in2000), discount houses resorted to other sources offunds to finance their investment. As a result, therewas greater reliance on interbank borrowings, whichincreased by 23.8% in 2001 (-25.3% in 2000).Furthermore, recognising the tendency forcustomers to make withdrawals towards the end ofthe year, discount houses increased their interbankborrowings to safeguard their year-end trading
Financial Institutions Act 1989 (BAFIA) and theInsurance Act 1996. It aims to ensure that thepolicies and objectives of DFIs are consistent withthe Government initiatives. Under the DFIA, BNMwould be the single regulatory and supervisory bodyfor the DFIs. In performing its role, BNM’s focus willbe to promote effective and efficient DFIs which willeventually minimise the Government cost inmeeting its policy objectives. This will contributetowards realisation of the vision and objectives forDFIs in the FSMP.
The important aspects of DFIA include: -(a) Selective application of the Act
Recognising the unique characteristics of eachDFI, DFIA is structured to allow flexible applicationof the Act on selected DFI or on specific role,function and operating structure of each selectedDFI.
(b) Centralised supervisory bodyEfforts to develop effective and efficient DFIsrequire effective and dynamic supervision by acentralised regulatory authority which would playa strong coordination role in the overallsupervision of DFIs. The appointment ofBNM as the centralised supervisory body for theDFIs is aimed at meeting this requirement.
(c) Monitoring role and objectives of DFIsThere is strong emphasis on the assessment ofthe efficiency and effectiveness of DFIs inperforming their roles and objectives to ensureconsistency with the Government policies. Theperformance measurement of DFIs will encompassquantitative and qualitative indicators thatevaluate the economic and social contribution aswell as financial performance.
(d) Efficient management and effectivecorporate governanceDFIA emphasises on efficient management andeffective corporate governance in the DFIsthrough the appointment of qualified board ofdirectors and senior management. Additionally,this will be augmented by credible externalauditor and transparent disclosure of information.The aim is to harness sufficient check and balanceand greater accountability by the management.
(e) Comprehensive supervision mechanismA formal and comprehensive supervisionframework is required to ensure the safety andsoundness of the DFIs so as to minimise the needfor financial assistance from the Government. Thelegislation incorporates prudential rules, on-siteand off-site supervision, reporting requirement,disclosure standard and powers to the regulator
Table 4.24Discount Houses: Sources and Uses of Funds
Sources:Approved capital funds 191 277 2,065 Deposits 3,858 1,117 15,070 Interbank borrowings -1,670 1,173 6,099 Others 181 129 582
Total 2,561 2,696 23,816
Uses:Investment in securities: 2,337 1,657 20,382
Government debt securities 46 1,111 1,788 MGS held -122 993 1,462
Khazanah bonds 163 222 655 BNM bills 709 -590 120 Private debt securities 342 942 11,647 Bankers acceptances 990 -941 3,234 Negotiable instruments of
deposit -603 -124 220 Cagamas debt securities 858 -224 1,087 Others1 -169 1,259 1,631
Interbank placements 313 724 2,856 Others -90 315 578
1999 2000 2001
Number of discount houses 7 7 7
1 Includes Danaharta and Danamodal bonds.Note: Total may not add-up due to rounding.
20012000
At end 2001
Annual Change
RM million

RM million
positions. Deposits accepted grew at a slower rateduring the year because of the non-rollover inSistem Perbankan Islam (SPI) deposits upon maturityand the less competitive interest rates offered bydiscount houses.
The increase in total resources continued to beinvested mainly in securities, which expanded byRM1.7 billion or 8.9% in 2001 (RM2.3 billion or14.3% in 2000). In particular, there was a shift ofinvestment into longer-dated bonds, particularly MGS,Danaharta and Danamodal bonds, as well as bondsissued by the private sector (PDS). The shift reflectedthe declining interest rate environment whichenhanced the attractiveness of longer-dated papers ascompared to shorter-term instruments.
During the year, discount houses also expanded theirfee-based activities. The industry arranged, lead-managed and co-managed the issuance of PDS worthRM4.4 billion (RM2.8 billion in 2000). The totalamount underwritten by the discount houses wasRM1.6 billion (RM2.5 billion in 2000), for 16 PDSissues (58 issuance in 2000). Following the annualreview of the Principal Dealer System by BNM in early2001, only one discount house was appointed as aprincipal dealer (two in 2000).
National Savings Bank Total resources of the National Savings Bank (NSB)continued to expand, increasing by RM451 million or4% to RM11.8 billion as at end-2001. The increasewas due mainly to higher GIRO and Islamic bankingdeposits, which more than offset the decline in fixedand savings deposits. GIRO deposits grew by RM427million or 14.9%. The increase in GIRO deposits wasdue mainly to attractive product enhancements thatoffered additional advantages to depositors. Islamicbanking deposit schemes, which were introduced in1994 have gained popularity, with Islamic bankingdeposits rising by RM216 million in 2001. Althoughfixed deposits decreased marginally, due mainly toredemptions by corporations, it nevertheless remainedthe major source of deposit funds, accounting for52.4% of total deposits outstanding as at end-2001,followed by GIRO deposits with a share of 32%.
In terms of the composition of its assets, there was ashift from placements of deposits with financialinstitutions to investments in shares andGovernment guaranteed bonds. Investments inshares and Government guaranteed bonds increasedby RM913 million (+80.7%) and RM458 million(+40.6%) respectively. Meanwhile, deposits placed
with financial institutions declined by RM986million, reflecting the low interest ratesenvironment. As at end-2001, the bulk of NSB’sassets was in the form of investments in securities(51.1%), deposits with financial institutions (22.8%)and loans (18.3%).
Provident and Pension FundsTotal resources of the 14 provident and pension funds(PPF) surveyed by BNM expanded by 6.7% in 2001 toRM231.5 billion. The bulk of the increase were newcontributions to the Employees Provident Fund (EPF).Accumulated contributions, however, grew at a slowerrate of 6% or RM11.7 billion during the year, reflectinglower net contributions and dividends credited duringthis year. At the same time, withdrawals were alsohigher (RM6.6 billion to RM17.3 billion), resulting in thePPF recording lower net contributions of RM3.4 billionduring the year (2000: RM9.5 billion).
Higher withdrawals were mainly under the four EPFschemes, for which withdrawal procedures had beenmade more flexible during the year. Withdrawal of EPF
156
Table 4.25National Savings Bank
Deposits 1 3,299 243 10,307Savings -69 -84 1,230Fixed 3,092 -317 5,400GIRO 384 427 3,300Islamic banking -108 216 360Others 1 1 17
Premium Savings Certificates 40 97 700
Investments (book value) 1,212 1,687 6,053Malaysian Government
Securities 178 18 1,111Shares 32 913 2,045Government guaranteed
bonds 544 458 1,587Other investments 458 298 1,310
Deposits with financial institutions 2,793 -986 2,700
Gross loans 310 -69 2,302Net loans (less provision for
doubtful debt, bad debts, and interest in suspense) 312 -74 2,164
Number of NSB branches 2 -3 -9 414Number of post offices with
NSB facilities 3 -18 -180 443Number of account
holders (‘000) 600 390 9,500Number of Automated
Teller Machines 14 -5 606
1 Includes interest credited2 Includes mini-branches and sub-branches3 Includes permanent and mobile officesp Preliminary
2001p2000
Atend
2001p
Annual change

Financial Sector
contributions were made more flexible for pensionableemployees as well as retirees who took optionalretirement; for all contributors for the purchase of asecond house on condition that the first house is sold;the purchase of computer for own use; and forpayment of fees for tertiary education. Withdrawalsunder the annuity scheme were also higher during theyear before the scheme was discontinued on 5 October2001. Improved efficiency which led to shorterprocessing time for withdrawal applications alsocontributed to higher withdrawals during the year.
During the year, gross contributions to PPF expanded ata slower rate of 2.6% (2000: 15.1%) reflecting mainlythe more moderate increase in gross contributions to theEPF. In April, EPF contributors were given an option toreduce their monthly contributions from 11% to 9% inline with the Government efforts to stimulate domesticdemand. About 75% of the active contributors optedfor the reduction in their contribution. The number ofcontributors to the PPF also fell marginally by 0.1% to19.1 million as a result of the decline in the number ofnon-active members of the Social Security Organisation.Meanwhile, total dividends credited during the yearwere lower, at RM9.4 billion, reflecting lower investmentincome amid a low interest rate environment.
In terms of the composition of assets of the PPF, therewas some shift from the holdings of deposits andmoney market papers to MGS and corporate bonds.
The share of MGS and corporate bonds increased to31.3% and 9.8% respectively, while the share ofdeposits and money market papers declined to17.7% at the end of 2001. The shift reflected thepreference for assets with higher returns and also thelarger issuance of MGS and corporate bonds duringthe year. Meanwhile, investment in equities recordeda higher share of 25.4% while the share of loansdeclined to 11.8%, reflecting some shift in theinvestment strategy of PPF in 2001.
Several recommendations affecting the PPF industrywere contained in the Capital Market Masterplan,which was launched in February 2001. Theseincluded recommendations for PPF to participate inventure capital funds in order to diversify theirholdings and enhance returns on portfolio;deregulation of restrictions on participation inexchange-traded derivatives; and liberalising therestrictions on the management of funds by foreignfund management companies. Specifically for EPF, therecommendations included a review of the investmentrestrictions imposed on EPF in order to allow for agreater free float of MGS; and diversification of themanagement of funds by placing out a greaterportion of its funds with external fund managers. InJanuary 2002, the EPF’s Annuity Scheme was replacedby the Withdrawal Payment Scheme. Under this newscheme, contributors can transfer not more than 50%of their savings from Account 1 to a new account,Account 4. The scheme allows contributors to makemonthly withdrawals from Account 4 over a 20-yearperiod on reaching the age of 55.
Industrial Finance InstitutionsIndustrial finance institutions constitute BankPembangunan dan Infrastruktur Malaysia Berhad(BPIMB), Bank Industri dan Teknologi Malaysia
157
Table 4.26Provident and Pension Funds: Selected Indicators
2000 2001p
RM million
As at endNumber of contributors (‘000) 19,075 19,058 of which: EPF 9,966 10,074
SOCSO 8,877 8,769 Accumulatedcontributions 196,290 208,023
Assets 216,936 231,479 of which: Investments in MGS 65,810 72,512
During the yearGross contributions 20,178 20,701 Withdrawals 10,689 17,314 Net contributions 9,489 3,387Dividends credited 10,237 9,366 Investment income 12,150 11,113
p Preliminary
Source: Employees Provident Fund, Pension Trust Fund, Social Security Organisation, Armed Forces Fund, Malaysian Estates Staff Provident Fund, Teachers Provident Fund and eight other private provident and pension funds.
26.0 27.4 27.9 30.3 31.3
14.2 14.4 13.6 11.6 11.88.8 8.9 9.8
22.5 22.9 24.7 25.4
24.2 23.7 23.1 20.5 17.7
8.68.8
23.7
0%
20%
40%
60%
80%
100%
1997 1998 1999 2000 2001
(RM million)
0
50,000
100,000
150,000
200,000
250,000
(% of total assets)
MGS Loans Bonds Equity
Deposits & Money Market Total Assets
Graph 4.19Provident and Pension Funds:Major Asset Composition

Berhad (BITMB), Sabah Development Bank Berhad(SDB), Export-Import Bank of Malaysia Berhad (EXIMBank), Malaysian Industrial Development FinanceBerhad (MIDF), Malaysian Industrial Estates Berhad(MIEL), Borneo Development Corporation (Sabah)Sendirian Berhad (BDC Sabah), and BorneoDevelopment Corporation (Sarawak) SendirianBerhad (BDC Sarawak).
Total assets of the industrial finance institutionscontinued to increase in 2001 by RM3.4 billion or16.7% compared with RM2.5 billion or 14.1% in2000. The growth in total assets was mainlyattributed to the increase in deposits placed withfinancial institutions and loans and advances whichaccounted for 53.9% (+RM1.8 billion) and 38.9%(+RM1.3 billion) of the increase respectively.
Loans extended by the industrial finance institutionsregistered a lower growth of 12.1% in 2001 comparedwith 16.3% in 2000. The growth was largely influencedby the loans extended by BPIMB and SDB whichregistered increases of 28.9% (+RM1.5 billion) and18.5% (+RM178.7 million) respectively. However,excluding the two institutions, the total loans extendedby industrial finance institutions recorded a decline of6.9% (-RM329.9 million) in 2001.
Total loans extended by BPIMB and SDB accounted for63.3% (RM7.6 billion) of total loans of industrial financeinstitutions. The growth was driven by the expansion indevelopment and infrastructure loans of BPIMB asreflected in the growth rate of 29.2% (RM862.7million) in loans to the transport and storage sector(especially infrastructure sub-sector). In the case of SDB,the increase was triggered by the implementation ofloan expansion strategy in 2001. The decrease in totalloans extended by other industrial finance institutionswas largely attributed to early repayment of loans by
borrowers of BITMB and MIDF and conversion of loansto loan stocks by borrowers of MIDF.
Deposits placed with financial institutions byindustrial finance institutions increased by 40.4%(+RM1.8 billion) in 2001 compared with 46.4%(+RM1.4 billion) in 2000. The large increase waspartly the result of lower demand for loansexperienced by many of the industrial financeinstitutions relative to increase in borrowings.
Industrial finance institutions have traditionally reliedheavily on funding from the Government andgovernment-related institutions in the form of equity,grants, loans and placement of deposits to fund theiroperations as they are not licensed to mobilise depositsfrom the public. The industrial finance institutions alsorelied, to a lesser extent, on external funding atpreferential terms under special bilateral agreementswith international multilateral development financeinstitutions. More recently, however, some industrialfinance institutions have raised funds from the capitalmarket to better match the long investment tenure ofthe projects financed by them and to be less dependenton government funding.
Total borrowings of industrial finance institutionsincreased by 16.9% (+RM2.4 billion) in 2001compared with 23.8% (+RM2.8 billion) in 2000.Borrowings from the Government by the industrialfinance institutions registered a substantial increaseof 44.5% to RM10.7 billion in 2001 and accountedfor 63.8% of total borrowings. The increase wasmainly contributed by a significant increase inborrowings (131.3% or +RM3.4 billion) by BPIMBfrom the Government to support its developmentand infrastructure projects. Borrowings from thenon-Government entities however, declined by12.4% to RM6.1 billion in 2001.
158
Table 4.27Industrial Finance Institutions : Changes in the Direction of Lending
Transport & storage 995.3 291.6 1,612.7 120.7 862.7 29.3Agriculture -13.4 -13.1 38.3 42.9 -3.9 -3.0Manufacturing -0.8 … -96.8 -2.8 128.5 3.9General commerce -24.8 -7.9 -212.9 -73.6 8.0 10.4Real estate & construction 838.2 37.9 -372.7 -12.2 315.0 11.8Others -198.8 -15.7 541.7 50.7 -2.7 -0.2
Total 1,595.7 20.8 1,510.4 16.3 1,307.6 12.2
Annual Change
1999 2000
RM million
2001
% change RM million % change RM million % changeSector
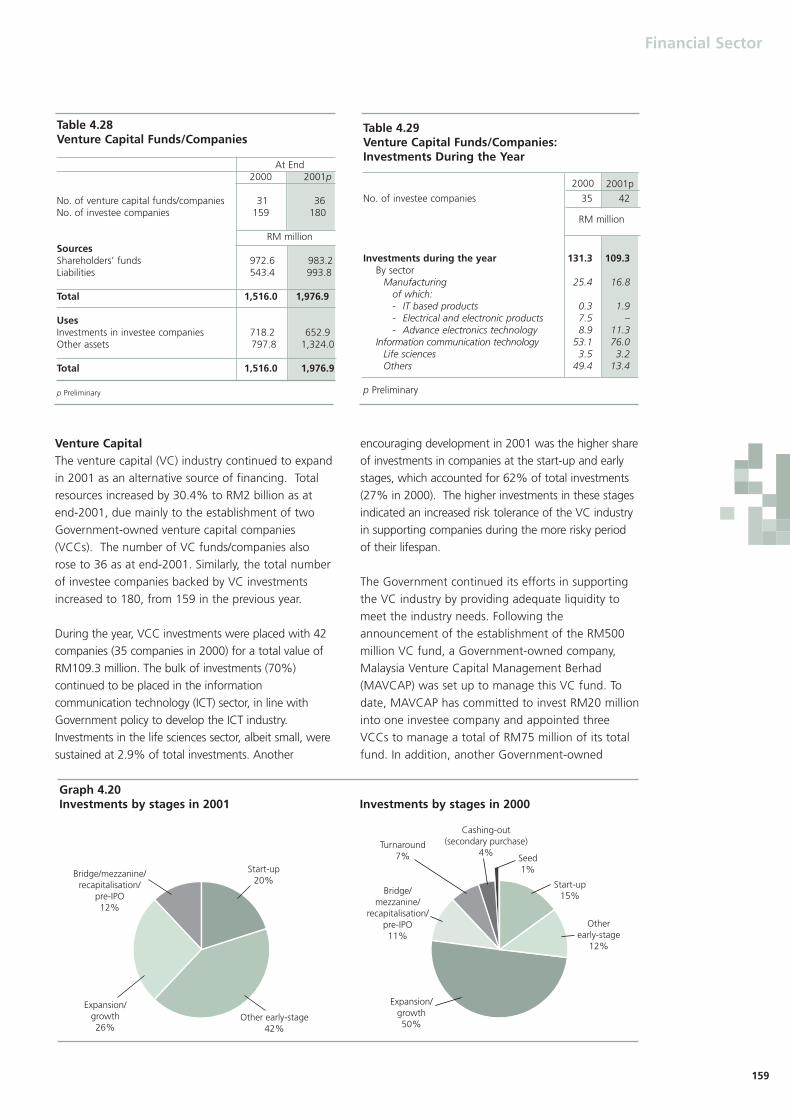
Financial Sector
Venture CapitalThe venture capital (VC) industry continued to expandin 2001 as an alternative source of financing. Totalresources increased by 30.4% to RM2 billion as atend-2001, due mainly to the establishment of twoGovernment-owned venture capital companies(VCCs). The number of VC funds/companies alsorose to 36 as at end-2001. Similarly, the total numberof investee companies backed by VC investmentsincreased to 180, from 159 in the previous year.
During the year, VCC investments were placed with 42companies (35 companies in 2000) for a total value ofRM109.3 million. The bulk of investments (70%)continued to be placed in the informationcommunication technology (ICT) sector, in line withGovernment policy to develop the ICT industry.Investments in the life sciences sector, albeit small, weresustained at 2.9% of total investments. Another
encouraging development in 2001 was the higher shareof investments in companies at the start-up and earlystages, which accounted for 62% of total investments(27% in 2000). The higher investments in these stagesindicated an increased risk tolerance of the VC industryin supporting companies during the more risky periodof their lifespan.
The Government continued its efforts in supportingthe VC industry by providing adequate liquidity tomeet the industry needs. Following theannouncement of the establishment of the RM500million VC fund, a Government-owned company,Malaysia Venture Capital Management Berhad(MAVCAP) was set up to manage this VC fund. Todate, MAVCAP has committed to invest RM20 millioninto one investee company and appointed threeVCCs to manage a total of RM75 million of its totalfund. In addition, another Government-owned
159
Table 4.28Venture Capital Funds/Companies
At End2000 2001p
No. of venture capital funds/companies 31 36 No. of investee companies 159 180
RM millionSources Shareholders’ funds 972.6 983.2 Liabilities 543.4 993.8
Total 1,516.0 1,976.9
UsesInvestments in investee companies 718.2 652.9 Other assets 797.8 1,324.0
Total 1,516.0 1,976.9
p Preliminary
Table 4.29Venture Capital Funds/Companies: Investments During the Year
No. of investee companies 35 42
Investments during the year 131.3 109.3By sector
Manufacturing 25.4 16.8 of which:- IT based products 0.3 1.9 - Electrical and electronic products 7.5 –- Advance electronics technology 8.9 11.3
Information communication technology 53.1 76.0 Life sciences 3.5 3.2 Others 49.4 13.4
p Preliminary
2001p2000
RM million
Start-up20%
Other early-stage42%
Expansion/growth26%
Bridge/mezzanine/recapitalisation/
pre-IPO12%
Graph 4.20 Investments by stages in 2001
Start-up15%
Otherearly-stage
12%
Expansion/growth50%
Bridge/mezzanine/
recapitalisation/pre-IPO11%
Seed1%
Turnaround7%
Cashing-out(secondary purchase)
4%
Investments by stages in 2000

company, Kumpulan Modal Perdana Sdn. Bhd. wasestablished to manage the Venture Capital Fund forTechnology Acquisition amounting to RM190 million.The objective of this VC fund is to assistentrepreneurs in technology acquisition by investinginto foreign technology-based companies whichwould lead to technology transfer to Malaysia. Thefund would also be used for the implementation ofthe Advanced Microchip Design and Training Centre. In a move to improve the quality of Malaysiantechnopreneurs, the Government launched theTechnopreneur Development Flagship spearheadedby the Multimedia Development Corporation. The
Flagship is aimed at developing a sizable number ofSMEs in the ICT sector and nurturing them intoworld-class companies. Several measures wereintroduced to increase the usage and deploymentof ICT, including sales tax exemption on smart cardsand related equipment, tax reduction on incomederived from trading via websites in Malaysia andincome tax deduction on costs incurred in developingbusiness websites.
During the year, there were also new private sectorinitiatives which contributed to the development of theVC industry. The first business plan competition,Venture 2001, which was launched in November 2000with the objectives of converting potential ideas intoactual businesses and fostering an entrepreneurialenvironment in Malaysia successfully received 447business plans, significantly higher than its initial targetof 250. Venture 2002 was subsequently launched inJanuary 2002 to build on earlier efforts to develop anentrepreneurial culture in Malaysia.
FINANCIAL MARKETS
OverviewIn 2001, trading volume in the money market andcapital markets, comprising bond and equity markets,and futures market were higher, while the foreignexchange market recorded a lower trading volume. Thefinancial markets remained effective in their role asfinancial intermediaries for mobilisation and allocationof funds in 2001. During the course of 2001, relevantauthorities continued to undertake new initiatives inorder to improve market infrastructure to better meetthe financing needs of the economy.
Total volume of funds traded in the money marketincreased moderately, reflecting mainly the highertrading of money market papers, amidst lowertrading of interbank deposits. The higher trading inthe money market papers reflected the significantincrease in trading of Malaysian GovernmentSecurities (MGS) as well as the shift in investmentsfrom lower-yielding papers to the high-yielding papersin view of ample liquidity and the low interest ratesenvironment. Meanwhile, the lower trading ininterbank deposits was an outcome of the ampleliquidity situation, which led to the reduced relianceon the interbank market for funding needs.
In the interbank foreign exchange market, theaverage daily volume of interbank foreign exchangetransactions was lower during the year. Tradingactivity in the ringgit was concentrated mainly intrade-related transactions following the non-internationalisation of ringgit. Activities continued to
160
New initiatives to further improve infrastructure of the financialmarkets resulted in improved efficiency of market as financialintermediaries, as reflected in generally higher trading volumes.
Table 4.30Funds Raised in the Capital Market
By Public SectorGovernment Securities, gross 16,413 23,087Less Redemptions 5,286 7,100Less Government holdings - -
Equals Net Federal receipts 11,127 15,987
Khazanah Bonds (net) 551 -220Govt. Investment Issues (net) 2,000 -195Malaysia Savings Bond (net) -19 -359
Net funds raised by public sector 13,659 15,213
By Private SectorShares 6,013 6,123Debt securities1 30,953 37,220
Less Redemptions 10,459 20,890Equals Net Issues 20,494 16,330
Net funds raised by private sector 26,507 22,453
Total Net Funds Raised 40,166 37,666Short-term papers and
notes (net)2 -1,482 -2,288
Total 38,684 35,378
1Exclude debt securities issued by banking institutions.2 Refers to Commercial Papers and Cagamas Notes only.p Preliminary
2000 2001p
RM million

Financial Sector
be dominated by transactions in the US dollar againstthe ringgit, reflecting the importance of the dollar asa vehicle currency and the high dollar concentrationin trade settlements and other capital accounttransactions.
The capital market, comprising the equity and bondmarkets, remained important as a source of financing,although net funds raised in the capital market wasslightly lower at RM37.7 billion. The bulk of fundswas raised in the bond market by both the privateand public sectors (RM31.6 billion), while the balance(RM6.1 billion) was raised in the equity market by theprivate sector. The public sector raised a totalamount of RM15.2 billion mainly through newissuances and reopening of MGS to meet the higherfinancing needs of the Government.
In the private sector, total funds raised in both thePDS and equity markets amounted to RM22.5 billion,of which the PDS market accounted for 72.7%.Although funds raised in the equity market remainedrelatively unchanged at RM6.1 billion, they remainedan important source of financing. Funds were raisedlargely through rights issues, initial public offerings(IPOs) and private placements. Improved sentimenton the Kuala Lumpur Stock Exchange (KLSE) as asource of financing was evidenced byoversubscription in many of the IPOs. These IPOswere also traded at a premium over their offer pricesat the end of their first day of trading. In achallenging environment in 2001, the KLSEperformed relatively well, with its composite indexrising marginally by 2.4% to 696.09 points at the endof 2001. Market capitalisation also increased by4.6% to RM465 billion. Besides the low interest ratesand ample liquidity situation coupled with theexpansionary fiscal policy, factors such as positivecorporate restructuring and strengthened
macroeconomic fundamentals contributed positivelyto the performance of the KLSE.
In the PDS market, total gross funds raised during theyear was higher at RM37.2 billion (2000: RM31 billion)as companies resorted to issuing PDS to take advantageof low interest rates, ample liquidity and investorpreference for more stable investment options.Nevertheless, high redemptions, in particular by a majorcorporation under the debt-restructuring schemeresulted in lower total net funds raised during the year.In contrast to the year 2000, the bulk of the funds raisedduring the year were utilized to finance new activitiesand for refinancing purposes. During the year, therewas a steady decline in the yields of bonds due tomarket expectations of lower interest rates andcontinued ample liquidity in the market. Meanwhile,trading activity in the secondary market increased sharplyduring the year following the higher supply of MGS.
In the derivatives market, trading in the KLIBOR Futuresand Crude Palm Oil (CPO) Futures was higher duringthe year while trading activities in the KLSE CI Futuresremained thin. The decline in turnover volume of KLSECI Futures was due mainly to the lack of volatility of theKLSE CI. Trading in KLIBOR Futures, on the other hand,was active due to the ample liquidity situation in theinterbank cash market and improved interests in thelocal bond and interest-rate swap markets. Meanwhile,higher production of crude palm oil and favourabledevelopments on the price fronts contributed to thehigher trading in the CPO Futures Contract.
During the year, several measures and initiatives wereimplemented to strengthen market practices and builda stronger financial infrastructure. A notabledevelopment in the capital market during the year wasthe launching of the Capital Market Masterplan inFebruary with the objective of setting out the strategicposition and future direction for the Malaysian capitalmarket. At the same time, in the equity market,measures introduced during the year emphasizedefforts to improve corporate governance and efficiencyin market activity. The introduction of the guidelineson offering of asset-back securities was the majordevelopment in the bond market. Meanwhile, theMalaysia Derivatives Exchange (MDEX) was establishedin June 2001 as an integrated derivatives exchangefollowing the merger of two exchanges, the KualaLumpur Options and Financial Futures Exchange andthe Commodity and Monetary Exchange of Malaysia,aimed at facilitating economies of scale and depth ofmarket through improved operating efficiencies andthe trading of more derivative products.
161
-505
1015202530354045
1997 1998 1999 2000 2001
RM b
illio
n
-3
-2
-1
0
1
2
3
Ratio
of N
et F
unds
Rai
sed
to B
ank
Loan
s
Public SectorPrivate SectorRatio of Net Funds Raised to Bank Loans
Graph 4.21Net Funds Raised in the Capital Market by thePublic and the Private Sectors

Money MarketVolume of transactions in the money market rosemoderately in 2001. A notable development was thesignificant expansion in trading of MalaysianGovernment Securities (MGS) and the shift of tradinginto the longer-dated papers. These developmentswere influenced by interest rates developments, theunderlying liquidity in the system and supply factors.During the year, trading in the money marketinstruments was concentrated in the MGS. Thehigher trading volume (148.2%) reflected mainlymarket expectations that the domestic interest rateswould remain low, following the aggressive interestrate cuts by the US. The September 11 incidentcompounded these expectations, precipitating asignificant rise in trading of MGS in the months ofSeptember and October to account for one-fifth oftotal volume of transactions during the year. Thesedevelopments, together with the sustained inflows offunds amid the ample liquidity situation, as well asthe larger issuance of MGS to finance theGovernment’s fiscal deficit, prompted marketparticipants to lock in their funds in higher-yieldingMGS. In addition, longer-dated papers such asMGS tended to exhibit wider range of pricemovements, thereby providing the market witharbitrage opportunities particularly in a declininginterest rate environment. In 2001, the average yieldto maturity (YTM) of the 5-year MGS fluctuated
within a wide range of 136 basis points, comparedwith 72 basis points in 2000. Furthermore, there wasalso greater participation of non-bank players, notablyinsurance companies and large corporations. Theheightened interest in the MGS resulted in loweryields, particularly for the longer-dated MGS.
162
2.5
3
3.5
4
4.5
5
5.5
6
Yield %
3-m T-bills1-y MGS3-y MGS5-yMGS
0
5
10
15
20
25
30
J F M A M J J A S O N D J F M A M J J A S O N D
(RM billion)Volume of MGS
2000 2001
Graph 4.22Money Market Instruments
Interbank Deposits
0%10%20%30%40%50%60%70%80%90%
100%
2000 2001
Overnight Weekend 1wk
1-3m 6, 12m, Others
BAs
Money Market Instruments
0%10%20%30%40%50%60%70%80%90%
100%
2000 2001
MGS BNB Cagamas InstrumentsNIDs Khazanah TB
Graph 4.23Share of Total Volume Traded
Table 4.31Money Market1
2000 2001
Volume Annual Volume Annual(RM Change (RM Change
bilion) (%) bilion) (%)
Total money markettransactions 1425.4 0.7 1500.8 5.3
Interbank deposits 1091.7 -8.2 1055.3 -3.3
Money market papers 333.7 47.7 445.5 33.5BankersAcceptances (BAs) 63.6 -6.3 60.5 -4.9Negotiable
instrument of deposits (NIDs) 21.0 -22.8 34.3 63.3
MalaysianGovernmentSecurities (MGS) 88.6 38.9 219.9 148.2
Khazanah bonds 15.5 -3.7 17.9 15.5Treasury bills 15 30.4 13.4 -10.7Bank Negara Bills 50.9 55.2 8.4Cagamas bonds 29.3 127.1 25.9 -11.6Cagamas notes 49.8 87.9 18.4 -63.1
1All data are sourced from the Bond Information and Dissemination System,except BAs and NIDs which are sourced from money market brokers.

Financial Sector
Consequently, the yield curve shifted downwardsfrom the position at end-2000, before edgingupwards since November when sentiments on theprospects for global economic recovery improvedtowards the end of the year. To some extent, thehigher MGS yield in December also reflected theliquidation of papers by some market playersfollowing the large accumulation of MGS in theirportfolio in September and October.
In contrast, trading in the shorter-dated papers,notably the Cagamas notes, Treasury bills andBankers Acceptances was lower during the year (-28.1%). Similarly, the interbank deposits alsorecorded a lower transactions volume (-3.3%),due to the preference among banks to invest inthe higher-yielding papers, while the ampleliquidity in the system has reduced recourse tointerbank funding. Overnight deposits remainedthe most actively traded tenure in the interbankmarket, accounting for 70% of interbankdeposit trades.
Foreign Exchange MarketIn the KL interbank foreign exchange market, theaverage daily volume of interbank foreign exchangetransactions (spot and swap transactions) donethrough the eight foreign exchange brokersdeclined by 9.5% compared to the volume tradedin 2000. Trading activity reflect mainly trade-relatedtransactions. Position-taking activity on the ringgithas been contained through the elimination of theoffshore ringgit market as well as throughguidelines governing the operating framework ofbanking institutions. As a result of these measures,the volume of transactions conducted has stabilisedfollowing the significant decline at end-1998.
The majority of trades transacted in 2001 occurredin the first half, before subsiding towards the endof the year. The increased activity in the first half ofthe year reflected mainly forward purchases offoreign exchange for imports of goods and services,and loan repayments in view of the discount on theringgit swap rate. By composition, transactions inthe Kuala Lumpur foreign exchange marketcontinued to be dominated by transactions in theUS dollar against the ringgit, with the share of suchtransactions increasing to 76% in 2001 from 68%of total transactions in 2000. This developmentreflects the increasing significance of theUS dollar in the KL interbank foreign exchangemarket as well as the high usage of the US dollarin the settlement of trade, services and capitalaccount transactions.
Equity MarketNotwithstanding a more challenging globalenvironment in 2001, the Kuala Lumpur StockExchange Composite Index (KLSE CI) ended the yearslightly higher (2.4%). Market capitalization also roseby 4.6% to RM465 billion (RM444.4 billion in 2000).Compared to the regional bourses, which include HongKong, Singapore, Indonesia and the Philippines, theKLSE also performed quite favourably. During the year,strong economic fundamentals, the completion ofrestructuring of large corporations and positive changesin corporate governance issues became factors thathave increasingly influenced the performance of theKLSE CI. Meanwhile, the KLSE as well as the SecuritiesCommission continued to further enhance regulationsand their enforcement to address issues of concern toinvestors, particularly minority shareholders.
The equity market remained an important source offinancing for the private sector in 2001. Funds raisedthrough the equity market amounted to RM6.1 billion
163
0
200
400
600
800
1,000
1,200
1,400
0
200
400
600
800
1,000
1,200
1,400
Spot Swap Total
1994 1995 1996 1997 1998 1999 2000 2001
RM billion RM billion
Graph 4.24Volume of Interbank Transactions in theKuala Lumpur Foreign Exchange Market
68%
22%
6%3%
1%
US$/RM US$/SGD US$/YEN US$/EURO Others
2000 2001
76%
14%
8%1%
1%
Graph 4.25Interbank Transactions in the Kuala LumpurForeign Exchange Market by Currency

or 27.3% of the total funds raised by the private sectorin the capital market (RM6 billion or 22.7% in 2000).The new funds were mainly raised through rights issues(31%), initial public offerings (IPOs) (27.4%) and privateplacements (27.4%). In 2001, there was a total of 20
IPOs, of which six were listed on the Main Board andthe other 14 on the Second Board. The amount raisedthrough IPOs was higher, at RM1.7 billion during theyear. Compared with 2000, using IPOs to raise fundswere exercised by companies in a broader range ofindustries and sectors, including telecommunications,trading and services, industrial and consumer products,and information technology. Improved confidence inthe equity market was evident in the oversubscriptionfor about 70% of the total number of IPOs raisedduring the year. Furthermore, the bulk of the IPOs wastraded at a premium over the offer prices at the end ofthe first day of trading, influenced mainly by the issuers’prospects and investor interest in specific sectors.
164
-30 -20 -10 0 10 20 30 40 50
Korea
Taiwan
Thailand
Malaysia
37.5%
17.0%
12.9%
2.4%
-5.8%
-7.1%
-15.7%
-19.6%
-24.5%
Source: International Federation of Stock Exchanges (FIBV)
Indonesia
Dow Jones
Singapore
Nasdaq
Hong Kong
Graph 4.27Performance of Selected Regional & EmergingStock Market Indices(% change from 2000 to 2001)
Table 4.32Kuala Lumpur Stock Exchange: Selected Indicators
2000 2001p
Price indicesComposite 679.64 696.09EMAS 159.77 165.23Second Board 132.98 134.13
Total turnoverVolume (billion units) 75.4 54.9Value (RM billion) 244.1 96.0
Average daily turnoverVolume (million units) 208.1 204.4 Value (RM million) 911.1 349.8
Market Capitalisation (RM billion) 444.4 465.0 Market Capitalisation / GDP (%) 130.4 134.6
Total number of companies listed 795 812Main Board 499 520Second Board 296 292
Market liquidity:Turnover value / Average market capitalisation (%) 42.3 22.2
Turnover Volume / Number of listed securities (%) 39.5 27.4
Market concentration:*10 Most Highly Capitalised Stocks/
Market Capitalisation (%) 38.9 36.7
Average paid-up capital of stockbroking firms (RM million) 129.6 138.2
p Preliminary* based on market transaction only
Source: Kuala Lumpur Stock Exchange
0
2
4
6
8
10
12
14
16
18
20
0
20
40
60
80
100
120
140
160
180
200Index (Jan 2000=100) Volume (billion units)
Volume KLSE CI 2nd Board Index
J F M A M J J A S O N D J F M A M J J A S O N D
2000 2001
Source: Kuala Lumpur Stock Exchange
Graph 4.28Kuala Lumpur Stock Exchange Composite Index,(KLSE CI) Second Board Index and KLSE TradingVolume
0
5,000
10,000
15,000
20,000
25,000
30,000
35,000
40,000
Bond Market Equity Market1997 1998 1999 2000 2001
RM million
Graph 4.26Funds Raised by the Private Sector in theCapital Market

Financial Sector
In the first half of 2001, the decline of 11% in theKLSE CI was influenced mainly by poorer-than-expected corporate earnings as well as concerns overthe slowdown in the global economy. Other factorsincluded concerns over the impact of the depreciation
of yen on regional currencies, and the revision of theMalaysian economic outlook from positive to stableby an international rating agency. Some otherfactors, however, mitigated the decline in the KLSE CI.These included the fact that other major international
165
500
550
600
650
700
750
29-D
ec
05-J
an
12-J
an
19-J
an
26-J
an
02-F
eb
09-F
eb
16-F
eb
23-F
eb
02-M
ar
09-M
ar
16-M
ar
23-M
ar
30-M
ar
06-A
pr
13-A
pr
20-A
pr
27-A
pr
04-M
ay
11-M
ay
18-M
ay
25-M
ay
01-J
un
08-J
un
15-J
un
22-J
un
29-J
un
US Federal Reservereduced interest rates
by 50 bp to5.5%
KLSE CI reached itshighest point in2001 of 736.34
US Federal Reservereduced interest rates
by 50 bp to 5%
- KLSE CI dropped below 600 pointssince the beginning of the year- Standard & Poor's downgradeMalaysia's outlook from'positive' to 'stable'
KLSE CI reached thelowest point at 553.34
Government announcedRM3 billion fiscal stimulus
package
Depreciation of regionalcurrencies; declines in
BNM reserves
Abolishment of exitlevy imposed onforeign investors
European Central Bankreduced interest rates
by 25bp
Malaysia 10-yearglobal bond was
issued
Governmentannounced the
8th Malaysian Plan
MSCI announced alower weighting
on Malaysia1Q 2001 GDP
increased by 3.3%
US marketrally
US Federal Reservereduced interest rates
by 50 bp to 6%
US Federal Reservereduced interest rates
by 50 bp to 4%
US FederalReserve reducedinterest rates by25 bp to 3.75%
US Federal Reservereduced interest rates
by 50 bp to 4.5%
Graph 4.29Performance of the KLSE CI (31 December 2000 - 30 June 2001)
500
550
600
650
700
750
02-J
ul
09-J
ul
16-J
ul
30-J
ul
06-A
ug
13-A
ug
20-A
ug
27-A
ug
03-S
ep
10-S
ep
17-S
ep
24-S
ep
01-O
ct
08-O
ct
15-O
ct
22-O
ct
29-O
ct
05-N
ov
12-N
ov
19-N
ov
26-N
ov
03-D
ec
10-D
ec
17-D
ec
24-D
ec
31-D
ec
Major corporaterestructuring news,
mergers andtakeovers emerged in
the market
BNM released 2Q GDPgrowth of 0.5% Terrorist attacks in
the US
KLSE suspendedtrading
Several foreignresearch houses
upgraded outlookon Malaysia
Banking stocks fellafter the CDRC
announced the newguidelines on debt
restructuring
- US market resume trading afterthe 11 September attacks- Federal Reserve reducedinterest rates by 50 bp to 3.0%
BNM reducedintervention rate
by 50 bp
Government announcedRM4.3 billion fiscal stimulus
package
US Federal Reservereduced interest rates by 50
bp to 2.0%
JP Morgan upgradedweighting for KLSE to
'overweight' from'underweight'
US Federal Reservereduced interest rates
by 50 bp to 2.5%
US launchedattacks on
Afghanistan
Announcement ofBudget 2002
3Q 2001 GDPdeclined by 1.3%
US interest ratesreduced by another
25bp to bring interestrates to 1.75 %
Year-end rallyUS Federal Reservereduced interestrates by 25 bp
to 3.5%
Graph 4.30Performance of the KLSE CI (1 July - 31 December 2001)

166
KLSE CI performance tracked the trend in the flow offunds through the external accounts. These are theringgit accounts maintained by non-residents,indicating that activities in the KLSE were to someextent, influenced by foreign participation.
In the Malaysian Exchange of Securities Dealing &Automated Quotation (MESDAQ), the MESDAQComposite Index (MCI) declined by 5.4% to closethe year at 88.08 points. The total trading volumewas lower, valued at RM1.6 billion (2000: RM4.7billion). Trading activities also remained thin withtrades concentrated in May and July. Marketcapitalisation, nevertheless, increased to RM177.6million at the end of the year (2000: RM141.4million). This was due to one new listing onMESDAQ in 2001. By end-2001, four companieswere listed on MESDAQ. The increasingunderwriting risks amidst a weak market made itdifficult for companies to secure underwritingcommitments. As at end-2001, MESDAQ’s totalmembership rose to 20 (2000: 19), of which 16were stockbroking companies while the remainingwere merchant banks.
In line with the recommendations of the CapitalMarket Masterplan to establish a single Malaysianexchange, MESDAQ signed a Merger Agreement withthe KLSE on 31 December 2001. The consolidation ofthe exchanges would streamline the regulatory andmarket development functions of KLSE and MESDAQ,enabling the offering of a wider range of products and
rating agencies maintained their favourable ratingson the outlook for the Malaysian economy, as well asthe abolishment of the exit levy on profits fromportfolio investment repatriated within one year,effective May 2001.
The KLSE CI rebounded strongly by 17.4% in thesecond half of 2001 against the backdrop ofimproving prospects for the domestic economyand positive reception of the institutional changesmade to accelerate corporate debt restructuring.Prior to the September 11 incident, the bettermarket performance was due partly to morefavourable views on the Malaysian economyfollowing positive GDP growth in the secondquarter. Recovery in the US market and othermarkets also aided sentiment. The September 11incident had temporarily disrupted the market. TheKLSE was suspended on 12 September in order tomaintain the orderly functioning of the market andto provide investors with sufficient time to fullyassess the situation. After a brief bearishperformance, market sentiment improved inOctober following better prospects for theMalaysian economy and positive developments incorporate restructuring. Market sentimentimproved further towards year-end, supported byannouncements of corporate restructuring of bigenterprises, further fiscal spending to supportgrowth as well as the Government’s success inraising the US$1 billion 10-year global bond.
During the year, the performance of the KLSE was to alarge extent, influenced by movements in foreignportfolio investment funds. It was evident that the
-3,000
-2,000
-1,000
0
1,000
2,000
3,000
500
550
600
650
700
750
800
850
900
950
1,000
J F M A M J J O S O N D J F M A M J J O S O N D
Index RM (million)
2000 2001
Cap-Flows KLSE CI
Graph 4.31KLSE CI vs Flows through External Accounts(Jan 2000 - Dec 2001)
0
100
200
300
400
500
600
700
0
10
20
30
40
50
60
70
80
90
100
Turnover value (RM'000)MCI (points, end-mth)
Turnover Value(RM'000)
MCI(points, end-mth)
J F M A M J J A S O N D2001
Source: Malaysian Exchange of Securities
Graph 4.32Malaysia Exchange of Securities Dealing andAutomated Quotation: Trading and MESDAQComposite Index (MCI)

Financial Sector
services to market participants. As a result of theproposed merger, certain projects were aborted or puton hold. These included the enhancement of theMESDAQ Order Routing and Execution SurveillanceSystem, the on-line registration of registeredrepresentatives and the on-line Capital Adequacyreporting by members.
In 2001, further measures were introduced to bringpractices in the equity market in line withinternational standards. At the same time, the KLSE
strengthened their monitoring and enforcement ofcompliance to existing and new regulations. Inensuring that investors would continue to haveconfidence in investing on the KLSE and in theMalaysian economy, emphasis continued to begiven to improving the level of corporategovernance. The new Listing Requirementsintroduced in January achieved the objectives ofenhancing corporate governance and transparency,and efficiency in capital market activities, therebystrengthening investor protection and promotinginvestor confidence. At the same time, there wassome relaxation of rules affecting the issue, offerand listing of securities in an effort to make theMalaysian capital market the preferred fund-raisingvenue for Malaysian companies.Other measures included steps to enhance investorprotection, especially minority shareholders.The details of the measures introduced duringthe year are contained in the box “Key CapitalMarket Measures in 2001.”
Bond Market The ringgit bond market expanded further in 2001and has increased in importance as a source offinancing. The growth of the bond market was dueto the low interest rate environment and ampleliquidity situation, increased recourse to the bondmarket for longer-term financing and intensifieddebt restructuring exercise. In addition, theexpansionary fiscal stance of the FederalGovernment resulted in significantly higher issuanceof Malaysian Government Securities (MGS) tofinance the fiscal deficit. Such a developmentcontinued to provide a benchmark yield curve forthe ringgit bond market.
Total net funds raised in the bond market remainedhigh at RM31.5 billion, accounting for 83.7% ofthe total funds raised in the capital market. As atend-2001, outstanding ringgit bonds rose by13.3% to RM275.8 billion from RM243.6 billion asat end-2000.
In the primary market, the public sector raised netfunds of RM15.2 billion. During the year, theGovernment issued and reopened a total of fourMGS issues. New issues were raised to finance the
Government’s fiscal stimulus programmes. Thesenew issues were also the rollover of maturingissues and as a means to enhance secondary
167
The ringgit bond market expanded further in 2001 and hasincreased in importance as a source of financing. A larger numberof companies issued PDS in order to “lock-in” financing at lowinterest rates.
Table 4.33Funds Raised in the Bond Market
By Public SectorGovernment Securities, gross 16,413 23,087Less Redemptions 5,286 7,100
Equals Net Federal Receipts 11,128 15,987
Khazanah Bonds (net) 551 -220Govt. Investment Issues (net) 2,000 -195Malaysia Savings Bond (net) -19 -359
Net Funds Raised by the Public Sector 13,659 15,213
By Private SectorPrivate Debt Securities, gross 30,953 37,220Straight bonds 12,940 13,813Bonds with Warrants 0 913Convertible Bonds 1,944 1,328Islamic Bonds 7,666 13,501Asset Backed Securities 0 1,235Cagamas Bonds 8,403 6,430
Less Redemptions 10,459 20,890Private Debt Securities 6,205 15,575Cagamas Bonds 4,254 5,315
Net Funds Raised by the Private Sector 20,494 16,330
Net Funds Raised in the Bond Market 34,153 31,544
Net Issues of Short-term Securities 1 –1,482 –2,093
Total 32,671 29,451
p Preliminary.1 Refers to Cagamas Notes and Commercial Papers only.
2000 2001p
RM million

market liquidity. As announced in the MGS auctioncalendar, the MGS were issued regularly on aquarterly basis, with a relatively large size of RM5billion each in the first three quarters and RM6.5billion in the fourth quarter of the year. Of thefour MGS issues, three were reopening ofexisting MGS.
During the year, Government Investment Issues (GII)and Khazanah bonds were issued in order to rolloverexisting issues. In November, the Malaysia SavingsBonds Series 02 (BSM02) issued in November 1999matured. The Government announced in the 2002Budget that BNM would issue the third series of thesavings bond, BSM03, for subscription by seniorcitizens and charitable organizations. The purposewas to mitigate the impact of the low interest rateenvironment on incomes of senior citizens andcharitable organizations that were primarilydependent on income from deposits placed withbanking institutions. BSM03 was offered for sale inJanuary 2002.
The private sector also turned to the bond marketto raise funds for its medium and long-termfinancing needs. A larger number of companiesissued PDS in order to “lock-in” financing at lowinterest rates. In an environment of ample liquidityand uncertainties in the equity markets, there wasalso investor preference for more stable investmentoptions. In 2001, the value of new PDS issuesincreased to RM37.2 billion. After netting offredemptions of RM20.9 billion, however, total netfunds raised were lower at RM16.3 billion (2000:RM20.5 billion). The high redemptions were duepartly to the early redemptions by a major
corporation under a debt-restructuring scheme. Inaggregate, total PDS outstanding increased by13.1% to RM158.4 billion, or equivalent to 47.6%of GDP (41.1% at end-2000). Compared to theequity market which raised RM6.1 billion, the PDSmarket remained the main source of financing inthe capital market for the private sector.
In terms of types of instruments, straight bonds andIslamic PDS were the most popular forms of fundingduring the year. Of the total proposed PDS issuesrated by Rating Agency Malaysia (RAM), 35% weremedium-term (5-7 years) while 60% were long-term(more than 7 years) bonds. Meanwhile, the higherissuance of Islamic PDS was due to the higherdemand for Islamic instruments, partly due to theincreased number of Islamic unit trust funds that werelaunched during the year. In addition, privatisedprojects such as water and power projects have beensuccessfully funded by Islamic PDS. On the otherhand, the issuance of bonds with warrants andconvertible bonds remained small.
A notable development in the PDS market during theyear was the introduction of the Guidelines on theIssuance of Asset-backed Debt Securities (ABS) by theSecurities Commission. Total issuance of ABS amountedto RM1.2 billion in 2001. The interest in issuance ofABS reflected the benefits accruing to both originatorsand investors. From the originators’ perspective,securitisation provides a vehicle for transformingrelatively illiquid financial assets into liquid assets. Inaddition, it enables the originator to achieve a moreefficient and cheaper cost of financing as ABS generallycarry a higher rating compared with the long-termcredit rating of the originator. This is because payments
168
0.0
0.1
0.2
0.3
0.4
0.5
0.6
0.7
0.8
0.9
1997 1998 1999 2000 2001
Public sector Private sector Total
Graph 4.33Ratio of Bonds Outstanding to GDP
Straight Bonds38%
Bonds withWarrants
2%ConvertibleBonds4%
IslamicBonds36%
AssetBackedBonds3%
Cagamas17%
Graph 4.34PDS Issues in 2001 by Type of Instrument

Financial Sector
to investors in respect of such debt securities areprincipally derived, directly or indirectly, from the cashflows on these assets. Thus, the credit rating of suchdebt securities is derived from the quality of theunderlying assets and not the credit standing of theoriginator of the assets, as is the case in debt securitiesissued by the corporation itself. From the investors’perspective, ABS widens the selection of fixed incomeproducts in the Malaysian bond market.
During the year, Cagamas has maintained itsposition as an active issuer in the PDS market,accounting for 17.3% of total issues. Cagamas re-opened seven of its existing fixed rate bonds inorder to enlarge the size of existing issues, thereby
enhancing the liquidity of Cagamas bonds in thesecondary market. For the first time, Cagamasissued 10-year fixed rate bonds in December 2001to fund its purchases of housing loans for a 10-yeartenure. The issuance of these bonds enabledCagamas to develop a longer-term yield curve for itsdebt securities. This, in turn, would enable Cagamasto price its purchases of loans, particularly for thelonger tenures, at market rates.
Companies from the utilities and infrastructuresectors were among the largest issuers of PDS,accounting for 30% and 16.1% of the total newissues respectively. Major issuers within this sectorwere independent power producers and toll roadconcessionaires which required long-termfinancing of more than 10 years for their projects.There was also increased recourse to the PDSmarket by companies in the manufacturing sectorwhich accounted for about 7.5% of the total PDSissues in 2001. The debt restructuring of a fewlarge and strategic corporations was reflected inhigher new issues of PDS in the Government andother services sector. Issues were made by thespecial purpose vehicles, which were set up duringthe year, as part of the Government’s commitmentto accelerate the corporate restructuring process tostrengthen investor confidence. The maturity ofbonds issued by these special purpose vehicles havebeen appropriately sequenced. The issuance ofbonds was accompanied by other debt andoperational restructuring in order to improve thefinancial and operational capacities of thecorporation to generate the cash flows to redeemthe bonds.
169
Table 4.34New Issues of Private Debt Securities by Sector 1
Sector 2000 2001p
Agriculture, hunting, forestry and fishing 42.5 0.2 26.6 0.1
Mining and quarrying 0.0 0.0 0.0 0.0Manufacturing 1,354.6 6.0 2,512.0 7.5Electricity, gas & water supply 4,564.1 20.2 10,006.9 30.0
Wholesale & retail trade, restaurants and hotels 1,853.9 8.2 420.0 1.3
Construction 2,006.3 8.9 3,299.9 9.9Transport, storage and communication 7,320.3 32.5 5,374.5 16.1
Financing, insurance,real estate and business services 5,108.3 22.7 5,103.2 15.3
Government and others 300.0 1.3 6,598.2 19.8
Total 22,550.0 100.0 33,341.3 100.0
1/ Excluding Cagamas Bondsp Priliminary
RMmillion
RMmillion
%share
%share
0 10 20 30 40 50 60
2000 2001
%
Restructuring
Refinancing
New activities
20.7%
50.7%
37.7%
17.2%
41.6%
32.1%
Graph 4.35Utilisation of Proceeds
2.50
3.00
3.50
4.00
4.50
5.00
5.50
6.00
6.50
J F M A M J J A S O N D J F M A M J J A S O N D2000 2001
MGS Cagamas Khazanah AAA
%
Graph 4.36Indicative Yields of Selected Three-YearBonds

Of the total PDS issued, 41.6% were for newactivities, 37.7% for refinancing and 20.7% were forrestructuring purposes. This marked a positivedevelopment in the economy as a significant share ofthe funds would be used to generate new economicactivities. In 2000, the bulk of the PDS issued hadbeen for restructuring purposes.
There was a steady decline in the yields of bonds inall tenures, with the yield curves continuing to shiftdownwards throughout the year. The three-year MGSfell from 4.02% at end-1999 to 3.07% at end-2000.The same trend was observed for the 10-year MGSwhich had fallen by 188 basis points during the sameperiod. Yields for other papers such as three-yearKhazanah and Cagamas bonds also trended lowerwith narrowing yields differentials vis-à-vis the MGSpapers. The yield differentials between three-yearCagamas bonds and three-year MGS in the secondarymarket were about six to 18 basis points. The narrowspreads enabled Cagamas to continue to play its rolein providing low cost funds to financial institutions.The declining yield trend was due to marketexpectations of further reduction in interest rates,continued ample liquidity in the market and the shiftof investments from equities to bonds in anenvironment of greater volatility in the global stockmarkets. The yields fell further in September followingfurther interest rates cut in the United States and thereduction in the 3-month BNM Intervention Rate. InDecember, however, some upward shifting of yieldsoccurred due to the expectations of interest ratesbottoming out, in line with the shifting of yield curvesin the regional markets, following indications of USeconomic recovery.
The MGS yields curves flattened throughout theyear as the spread between the 10-year and thethree-year papers narrowed from 167 basis pointsto 75 basis points, reflecting market expectationsthat interest rates would remain low for themedium term. The yields of PDS trended lowersince early 1999 and the spreads against MGSnarrowed notably. The narrowing of spreads of theAAA-rated PDS against the MGS was significant,indicating a trend towards lower risk premiumsrequired by investors. In 2001, the spreadsfor A- and BBB-rated bonds, however, widenedfrom 275 - 508 basis points in Januaryto 321 - 611 basis points in December due toconcerns over deteriorating global and localeconomic performance. This resulted in investorsshifting their investments to the more securedGovernment and quasi-Governmentpapers as well as highly rated and good qualitycorporate bonds.
Trading activities in the secondary market for ringgitbonds was sharply higher in 2001, which auguredwell for the deepening of the bond market.Trading volume increased by 49% and was valuedat RM378.2 billion in 2001 (2000: RM253.8 billion).Similarly, liquidity in the bond market, as measuredby the ratio of trading volume to total outstanding,also rose to 137.1% (2000: 104.2%). The highertrading activity was mainly due to the higher supplyof MGS during the year. MGS were the mostactively traded papers, rising by 148.2% andaccounting for 58.2% of total trading activities(2000: 34.9%). The volume traded was highest inthe third quarter. Expectations of a possible
170
2.5
3.0
3.5
4.0
4.5
5.0
5.5
6.0
6.5
1 2 3 4 5 6 7 8 9 10 11 12 13 14 15
Years to Maturity
Dec-00
Jun-01
Dec-01
Sep-01
%
Graph 4.37MGS Yield Curves
0
1
2
3
4
5
6
7
J F M A M J J A S O N D J F M A M J J A S O N D
AAA AA A BBB
Graph 4.38Yield Differentials for 3-Year Bondsvis-a-vis the 3-Year MGS

171
Financial Sector
to RM400 million per issue), hence affecting liquidityfor Cagamas papers. Despite investor interest beingcentered on MGS, demand for PDS with high ratingsand good quality remained high. Nevertheless, theshare of PDS turnover moderated to 29.4% of totaltrades compared with 45.9% in the previous year.
During the year, requests for ratings remained high ascorporations, especially those with strong credit ratings,shifted to bonds as a cheaper funding option. In 2001,RAM completed 88 new ratings with the proposedgross issue valued at RM27.1 billion. Long-term issuesrepresented 76% and 87% of the total number andgross issue value respectively. Meanwhile, the MalaysianRating Corporation Berhad (MARC) completed 29 newcorporate debt ratings with a total rated value of RM9.5billion. The rated issues generally concentrated on theAA and A categories, as companies with good creditquality took advantage of their relatively easy access tothe bond market.
During the year, of the total 192 rating reviews of theexisting long-term debt securities conducted by RAMand MARC, 153 were affirmations/reaffirmations, 14issues were upgrades while 25 issues were downgrades.As at the end of 2001, the bulk of the long-term bondswas in the AA and A categories.
During the year, several measures were introduced tofurther develop the bond market. The key measuresare contained in the box “Key Capital Market Measuresin 2001”. These measures included the introduction ofguidelines on offering of asset-backed securities,relaxation of the restrictions on the use of proceeds fromthe issuance of PDS and guidelines on the securitiesborrowing and lending programme under the Real TimeElectronic Transfer of Funds and Securities System.
Unit Trust IndustryThe unit trust industry expanded further in 2001, asevidenced by the growth in the number of unit trustmanagement companies and unit trust funds as wellas the increased units in circulation and number ofaccounts. Gross sales of the unit trust funds alsoexceeded repurchases during the year, resulting in netsales of RM6.1 billion. While net sales in 2001 weremarginally lower than in 2000, it neverthelessremained high, relative to the average net sales ofRM0.5 billion during the period 1995-99.
Growth of the industry was stimulated by increasedinvestor demand for unit trust funds to suit theirrisk-return profiles and the continued availability ofthe EPF Member’s Investment Scheme. Following
2000: RM253.8 bil
0
50,000
100,000
150,000
200,000
250,000
2001: RM378.2 bil
MalaysianGovern-
mentSecurities
OtherUnlisted
PDS
CagamasBonds
KhazanahBonds
Govern-ment
Invest-mentIssues
ListedPDS
AssetBackedDebt
Securities
(RM million)
Graph 4.39Trading of Ringgit Bonds
0
5
10
15
20
25
30
35
40
13.4
34.2 34.2
10.7
3.42.0 2.0
%
AAA AA A BBB BB B C&D
* In terms of number of issuesSource: RAM and MARC
Graph 4.40Rating Distributions of Outstanding PDS*(As at end December 2001)
reduction in interest rates prompted investors totake longer positions in the bond market, especiallyin risk-free papers. During this period, bondinvestors were also switching to Government andquasi-Government papers due to the more stablereturns from Government issues.
In contrast, secondary trading for Cagamas bondsdeclined sharply by 11.4% during the year,accounting for 6.9% of total trading activities (2000:11.5%). In the low interest rate environment, tradinginterest was skewed towards longer-maturity paperssuch as MGS. Most Cagamas bonds were issued fortenures of two to three years. In addition, the size ofCagamas bonds was relatively small (RM200 million

172
Key Capital Market Measures in 2001
Capital market measures introduced in 2001 were aimed at promoting a more efficient, transparent, innovativeand competitive capital market which would attract increased participation among market players. Overall, themeasures were aimed at enhancing investor confidence by addressing areas of concern, including issues ofcorporate governance. The key capital market measures introduced in 2001 were as follows:
Setting A Clear Direction for Capital Market Development• A notable development in the year 2001 was the launching of the Capital Market Masterplan (CMP) in
February with the objectives of setting the strategic position and future direction for the Malaysian capital market. There were six key objectives:i) To be the preferred fund-raising centre for Malaysian companies;ii) To promote an effective investment management industry and a more conducive environment for investors;iii) To enhance the competitive position and efficiency of market institutions;iv) To develop a strong and competitive environment for intermediation services;v) To ensure a stronger and more facilitative regulatory regime; andvi) To establish Malaysia as an international Islamic capital market centre. Of the 152 recommendations, 14 recommendations have been fully implemented, 24 partially completed while another 48 were ongoing. Progress has been made in the areas of exchange consolidation, stockbroking consolidation, disclosure-based regulation and the corporate bond market.
Strengthening the Stockbroking Industry by Enhancing Transparency and Governance• On 22 January, the Kuala Lumpur Stock Exchange (KLSE) issued its New Listing Requirements to
further strengthen the capital market and securities industry. The New Listing Requirements strengthened provisions in areas relating to disclosure, corporate governance, continuing listing obligations, financial reporting and enforcement. It codified unwritten rules and procedures relating to listed companies, simplified procedural requirements and processes, clarified requirements by removing ambiguities, and adoptedinternational best practices and standards in listing rules.
• On 10 May, the Securities Commission (SC) introduced several flexibilities to facilitate the issue, offer and listing of securities by Malaysian companies. These flexibilities were in line with the CMP objective of making the Malaysian capital market the preferred fund-raising centre for Malaysian companies byenhancing the efficiency of the overall fund-raising process. The flexibilities introduced were:i) Revision of the historical profit-performance requirement for initial public offerings and reverse take-
overs/backdoor listing on the KLSE;ii) Allowing the issuance and listing of irredeemable convertible unsecured loan stock (ICULS) as part of the
floatation scheme on the KLSE; iii) Abolishing the preferential allocation limit of 10 lots per person for directors, employees and other persons
in relation to a floatation scheme on the KLSE. However, the 5% overall limit of the preferential allocation scheme was retained;
iv) Removal of the merit-based criteria for bonus issues arising from capitalisation of share premium and other reserves. Listed companies are now allowed to undertake bonus issues of securities through the capitalisation of share premium as long as the availability of the share premium is verified by the external auditors to the company; and
v) Revision of the guidelines on employee share option schemes.
• On 3 September, further flexibilities were introduced by the SC to complement the previous flexibilities given on Initial Public Offering (IPOs) issuance and fund-raising and restructuring. For the issuance of IPOs, the SC amended the requirements for public offers, placements, underwriting, shareholding spread, retention of reserves and limitations on capital structure. Amendments to the Issues Guidelines relating to the use of proforma accounts were also introduced. With respect to flexibilities for fund-raising and restructuring exercise, flexibilities previously granted to rescue cases were extended. The post-restructuring net-tangible-

173
Financial Sector
asset position requirement for distressed listed companies, on the other hand, was reduced to 35% from 50%of the par value of their ordinary shares. In addition, all distressed listed companies were allowed to issue convertible securities with nominal values below RM1.00.
• On 25 April, the SC issued the Guidelines on Offer Documents for take-overs with the objective of enhancing disclosure in offer documentation, in line with the move towards a full disclosure-based regulation. The Guidelines would facilitate a take-over exercise by ensuring the clarity of the process, protecting the interests of minority shareholders of companies and providing timely and adequate information to shareholders.
Promotion of the Bond Market • The SC released the Guidelines on the Offering of Asset-Backed Securities (ABS) on 10 April, marking
an important milestone in the development of the corporate bond market. The Guidelines served to set out clear and transparent criteria to facilitate market participants in the offering of asset-backed debt securities. In accordance with the 2001 Budget announcement, asset securitisation transactions that are in full compliance with the SC’s ABS Guidelines would be eligible for real property gains tax and stamp duty exemption, where applicable.
• On 3 December, the restrictions on the use of proceeds from the issuance of PDS were further relaxed. Proceeds from PDS issues can now be used to finance the development of residential properties and shop houses priced above RM250,000 per unit on condition that the proceeds of the bond issues should only be drawn upon achieving break-even sales (in value terms). In addition, such development of shop houses should be located within residential areas. This relaxation was in line with the relaxation of lending restrictions by BNM.
• BNM issued the Guidelines on Securities Borrowing and Lending (SBL) Programme under the Real Time Electronic Transfer of Funds and Securities System. The Guidelines, which took effect on 10 December, were part of the measures implemented during the year to promote the development of the bond market. A SBL transaction involves an exchange of securities between two parties for a period of time to meet the temporaryneeds of either or both parties. The objective of implementing of the SBL programme was to enhance the liquidity in the secondary bond market by providing a new mechanism to support trading strategies for dealersas well as to enhance the returns on bond portfolio investment for investors.
Enhancing Market Mechanism and Competitiveness• On 1 July, the SC reduced the SCANS clearing fee, the SCORE fee, and SC levy as part of continuous efforts to
enhance industry competitiveness. The SCANS clearing fee was reduced to 0.04% from 0.05%, subject to a maximum of RM200 per contract. The SCORE fee was reduced to 0.0025% from 0.005%. The SC levy, whichwas derived from the brokerage commission and the SCANS clearing fee, was reduced to 0.015% from 0.02%.
• Effective 18 July, the KLSE through its clearing house, SCANS, commenced the Institutional Settlement Service (ISS) for direct business transaction. The implementation of the ISS for direct business transaction would reduce the settlement risk exposure of international investors and enhance the delivery versus payment environment in line with international settlement best practices and requirements.
• On 29 August, the SC released the Guidelines on the Establishment of Electronic Access Facilities by Universal Brokers in line with the effort to create a framework for the orderly and effective implementation of electronic commerce in the capital market. “Electronic access facility” refers to a range of physical sites, locations or premises which contain facilities that enable clients to initiate orders or obtain investment advisoryinformation electronically. Universal Brokers are free to determine the type, size, number and location of these facilities. However, they must ensure that the facility is reasonably secure against unauthorised tampering andintrusion. In addition, as a further step towards developing a more facilitative electronic commerce

174
framework, particularly with regard to online trading, Universal Brokers were given the flexibility to provide discounts of up to 25% of the current commission rates applicable to trades with contract values of RM100,000 and below, for all electronically-routed trades executed by them.
• In the Budget 2002 presentation in October 2001, the Government announced the implementation of the circuit breaker mechanism in the stock market exchange. The mechanism has the capacity to halt trading activities temporarily when large declines are experienced during a trading day. The mechanism is expected tobe in operation in the first quarter of 2002. It aims to provide investors some “breathing space” and opportunity for greater information dissemination during excessive market volatility by allowing closure or cessation of trading for a specific period, before resuming stock market trading activities. In this event, maintaining investor and market confidence can be ensured, especially when the trading environment becomes extremely uncertain.
Enhancing Investor Protection• On 17 September, the SC released the Guidelines on Trustees for Debenture Holders, which would
provide the check and balance to ensure that the interest of debenture holders are protected. Under these guidelines, the SC would grant a blanket approval to any trustee seeking to be appointed or to act as trustee under subsection 69(2) of the Securities Commission Act, provided that the requirements of these guidelines were met. A condition of approval by the SC was that the trustee must continue to meet these requirementswhile acting as a trustee in respect of a particular debenture issue.
• On 26 November, the SC announced that companies listed on both the main and second boards of the KLSE which have yet to increase their paid-up capital to at least RM60 million and RM40 million respectively, were required to inform investors of their non-compliance and their plans to achieve compliance through updates in their quarterly financial reports. The deadline for compliance with the requirement was extended from 30 April 2002 to 31 December 2002. Companies that failed to meet the minimum paid-up capital requirement by the extended deadline would be subjected to trading restrictions.
Improving Corporate Governance and Minority Shareholder Protection • Effective 15 February, directors of public listed companies were required to attend Mandatory
Accreditation Programme (MAP) and Continuing Education Programme (CEP) pursuant to the revamped Listing Requirement, which was issued on 22 January. The objectives of these training programmes were to better equip directors to discharge their duties and to enhance the overall calibre of directors of listed companies.
• Effective 1 June, public listed companies were required to comply with the revamped Listing Requirements(except for a few provisions), which came into effect on 15 February. Among others, the revamped Listing Requirements has brought into effect recommendations of the Finance Committee, in relation to the Malaysian Code on Corporate Governance. These recommendations were to create an environment that demands higher standards of conduct and higher quality disclosures from companies, board of directors and management. The new Listing Requirements has encouraged compliance with the Malaysian Code on Corporate Governance. The amendments made to the previous Listing Requirements include:i) Requirements on reporting the extent of compliance with the Malaysian Code of Corporate Governance by
public listed companies;ii) Rules on disclosure requirements by directors when reporting on the state of internal controls;iii) Rules on non-executive directors and the requirement for one third of the board to be independent; andiv) Rules requiring the mandatory accreditation of directors of public listed companies.
• Effective 1 June, public listed companies were required to comply with the ‘Statement on Internal Control: Guidance for Directors of Public Listed Companies’ issued by the Taskforce on Internal Control of the KLSE. The objective is to provide guidance to directors of listed companies in making disclosures on thestate of internal control of their companies in their annual reports. In particular, explanation was provided on

175
Financial Sector
marketing efforts by the industry, there was alsogreater awareness of the benefits of unit trustschemes for the smaller retail investors. The numberof institutional unit trust agents also increased to 27from 17 in the previous year. Together, these factorscontributed to the 9.2% growth (2000: +0.5%)in the net asset value (NAV) of the unit trustindustry. Consequently, the ratio of the industry’sNAV to KLSE market capitalisation increased to10.2% as at end-2001, from 9.8% at the end ofthe previous year.
Exchange Traded Derivatives MarketIn line with the recommendation of the Capital MarketMasterplan, the Malaysia Derivatives Exchange (MDEX)was established on 11 June 2001 as an integratedderivatives exchange, following the merger of twoexchanges, the Kuala Lumpur Options and FinancialFutures Exchange and the Commodity and MonetaryExchange of Malaysia. The establishment of the MDEXwas aimed at facilitating economies of scale and depthof market through improved operating efficiencies andthe trading of more derivative products. In 2001, theMDEX offered four products, namely the KLSE CIFutures, KLSE CI Options, 3-Month KLIBOR Futures andCrude Palm Oil (CPO) Futures Contracts.
the key areas that directors must focus on before making any statements about the state of the company’s internal control. These key areas were the system of internal control, responsibilities of various parties in the maintenance of the system of internal control, the process of review of the adequacy and integrity of the system of internal control and the minimum disclosures on the state of internal control to be made by the Board of Directors.
• The Minority Shareholder Watchdog Group (MSWG), which was established in August 2000, commencedoperations in July 2001. Its founding members are the Employees Provident Fund, Permodalan Nasional Berhad, Armed Forces Fund, Pilgrims Fund Board and Social Security Organisation (SOCSO). The role of the MSWG is to promote awareness among minority shareholders, particularly institutional investors, of their rights and responsibilities, to protect minority shareholders from exploitation by public listed companies and todeter and if necessary, to combat abuses by public listed companies on minority shareholders.
Table 4.35Unit Trust Industry (Includes Islamic Unit Trust Funds) - Selected Indicators
2000 2001 2000 2001
Growth (%)
Number of Unit Trust ManagementCompanies 34 37 3.0 8.8
Number of Unit Trust Funds* 119 149 17.8 25.2
Units in Circulation (billion) 63.8 71.4 21.3 11.9
Number of accounts (million) 9.6 10 7.9 4.2
Net Asset Value (RM billion) 43.3 47.3 0.5 9.2
Net Sales (RM billion) 7.0 6.1Ratio of NAV to KLSE
market capitalisation (%) 9.8 10.2
* Refers to funds already launched
Source: Securities Commission
-1,000
0
1,000
2,000
3,000
4,000
5,000
Gross Sales Repurchases
Net Sales/Repurchases
2000
J F M A M J J A S O N D J F M A M J J A S O N D
2001
RM million
Graph 4.41Unit Trust Industry - Gross Sales, Repurchasesand Net Sales
Table 4.36MDEXTurnover: Number of Contracts
2000 2001 % change
KLSE CI Futures 366,942 287,528 -21.6KLSE CI Options 349 565 61.9KLIBOR Futures 44,812 54,914 22.5CPO Futures 308,622 479,799 55.5
Source: Malaysia Derivatives Exchange

176
The performance of products traded over the MDEXwas mixed in 2001. Trading activities in the KLSECI Futures were weak with trading volumedeclining by 21.6%. The month-end open position,which is the number of unsettled positions was alsolow. The lower trading volume was due mainly tothe lack of volatility of the KLSE CI that resulted inless participation by local and foreign investors. This
was reflected in the low Derivatives Liquidity Ratio(DLR), which represented the ratio between theturnover value of futures against the turnover valueof the component stocks. The DLR remained belowthe 100 mark throughout the year, implying thatinvestors’ exposure in the underlying market wasnot fully covered by their futures contracts. On the
0
50
100
150
200
250
300
350
400
0
2,000
4,000
6,000
8,000
10,000
12,000
14,000
J F M A M J J A S O N D J F M A M J J A S O N D2000 2001
Average Daily Turnover(No. of Contracts)
Open Interest(No. of Contracts)
Average Daily Turnover
Open Interest
Graph 4.43KLIBOR Futures
3
3.2
3.4
3.6
3.8
4
4.2
02-J
an
16-J
an
30-J
an
13-F
eb
27-F
eb
13-M
ac
27-M
ac
10-A
pr
24-A
pr
08-M
ay
22-M
ay
05-J
un
19-J
un
03-J
ul
17-J
ul
31-J
ul
14-A
ug
28-A
ug
11-S
ept
25-S
ept
09-O
ct
23-O
ct
06-N
ov
20-N
ov
04-D
ec
18-D
ec
KLIBOR 1st contract month 1st quarter contract month 4th quarter contract month
Implied Yields
Graph 4.44KLIBOR Futures Implied Yields and Spot Yields
Average Daily Turnover Open Interest
J F M A M J J A S O N D J F M A M J J A S O N D2000 2001
Average daily turnover(No. of contracts)
Open interest(No. of contracts)
0
500
1,000
1,500
2,000
2,500
0
500
1,000
1,500
2,000
2,500
3,000
3,500
Graph 4.42KLSE Composite Index Futures and Option

177
Financial Sector
price front, the KLSE CI Futures prices, whichtracked the movement of the underlying KLSE CIclosely, increased marginally by 1.4% in 2001.Similarly, total trading volume of the KLSE CIOption, which was introduced in 2000, remainedlow at 565 contracts and there was no openposition. The weak trading activities were due tothe lack of understanding of the product and highmargin requirements.
Meanwhile, the annual turnover for 3-MonthKLIBOR Futures increased by 22.5%. In addition,the month-end open position was generally on arising trend during the year, with the highest levelrecorded in August at 13,023 contracts, beforeclosing at 10,751 contracts at year-end (end-2000:6,642 contracts). The higher turnover was due tothe ample liquidity situation in the interbank cashmarket and improved interest in the local bond andinterest rate swap (IRS) markets. Bankinginstitutions were the major players and accountedfor the bulk of the trading activities. KLIBOR Futuresprices were mixed during the year. The impliedyields (4th quarter month contracts) increased from3.84% in January to a peak of 4.10% in Aprilbefore declining to the lowest level at 3.22% inOctober. The implied yields rose subsequently toclose at 3.50% at the end of the year.
In 2001, the total trading volume for CPO FuturesContracts on the MDEX was higher, reflectingmainly higher crude palm oil production, whichgrew by 8.9% as well as developments on thephysical palm oil markets, which began to show
stronger prices since July. Reflective of thefavourable development on the price front, totallots traded on the MDEX were significantly higherin the second half year, compared to the first half-year. During the year, the price range for thebenchmark 3rd month futures contract widened toRM622 (2000: RM492), with the highest daily pricetrading at RM1,315 per tonne on 8 August 2001.Analysis on a bi-annual basis showed that averagemonthly CPO futures prices were lower in the firsthalf-year, ranging between RM741-RM860 pertonne before surging to a higher price range ofRM913-RM1,264 per tonne in the second half-year.The price rally during the second half of 2001 wasmainly on account of increasingly tight globalsupplies of vegetable oils, as production of severalmajor vegetable oils, including palm oil, rapeseedand sunflower oils declined, while demandcontinued to increase.
DEVELOPMENTS IN PAYMENT ANDSETTLEMENT SYSTEMS
In 2001, BNM undertook several measures andenhancements to improve the efficiency of the paymentsystems operated by BNM as well as other domesticpayment systems in co-operation with participatingbanks and the payment consortium. These efforts wereimportant to ensure that the country’s payment systemsremain efficient, stable and reliable, while keepingabreast with technological developments.
RENTASDuring the year, several measures were introducedto further enhance the efficiency and flexibility ofRENTAS. This included the introduction of a realtime surveillance system to enhance transactionmonitoring and liquidity management, as well as aRepurchase Agreement (REPO) Enhancement
0
10
20
30
40
50
60
0
250
500
750
1,000
1,250
1,500
Lots Open position
3rd month average futures prices
J F M A M J J A S O N D J F M A M J J A S O N D
2000 2001
Lots ('000) Price (RM/tonne)
Graph 4.45Crude Palm Oil Futures
2001
Value Volume
Annual Annual (RM billion) change (‘000) change
(%) (%)
RENTASIFTS transactions 10,436 -4.8 1,511 4.9SSTS transactions 559.8 33 68 30.8
SPICKCheques cleared 996 7.4 165,473 0.4
GIRO (IBG)IBG instructions 1.08 1,2501 125 1,1501
1 The Interbank Giro system was introduced in October 2000
Table 4.37Payment and Settlement Systems

178
Malaysian Payment Systems
RENTAS• RENTAS is the Real Time Gross Settlement System (RTGS) that was developed to reduce the financial
risks associated with high value payments. The RENTAS system was launched in July 1999 and consisted of an inter-bank funds transfer system (IFTS) and a scripless securities trading, processing and settlement system (SSTS). The introduction of RENTAS has facilitated the attainment of the real time Delivery versus Payment (DVP) Model 1 for the sale and purchase of designated scripless securities.
SPICK• SPICK (or Sistem Penjelasan Imej Cek Kebangsaan) is an image-based cheque clearing system, which
provides for imaging of inward cheques for the purpose of examination and verification of signatures by the paying banks. With SPICK, banks are able to process and verify the cheques based on the data and compact disc received from the SPICK centres without having to sight the physical cheques. This enables a larger area of the country to enjoy same day clearing facilities and reduces the day-hold of outstation cheques as well as minimises the handling and movement of physical cheques. The system, which has centres located in Pulau Pinang, Kuala Lumpur and Johor Bahru, processes about 90 percent of the nation’s cheques. SPICK retained its ISO 9002 certification in November 2001.
Automated Teller Machines (ATMs)• Following the integration of the three ATM networks in 1996, the domestic banks now have a fully
integrated ATM network of more than 3,800 ATMs. The payment consortium, Malaysian Electronic Payment System (1997) Sdn. Bhd. (MEPS) provides the switching, clearing and settlement services for the shared ATM network. This collaboration amongst the domestic banks has enabled customers to use all ATMs within the MEPS network and reduced the need for further expansion of each individual bank’s ATM network.
Interbank GIRO• The Interbank GIRO (IBG) service operated by MEPS since October 2000 involves an exchange of
digitised transactions to transmit payment orders. The IBG system, which is capable of processing large volumes of individual payments electronically, has shortened the clearing cycle for payment transfers, especially for outstation payment transactions. The IBG payments include standing instructions for loan repayment, as well as payments of insurance premiums, salaries, income tax and contributions to the Employees Provident Fund. The IBG facility is currently provided by 11 banking institutions (including an Islamic bank). Plans are underway to enhance the IBG system to a browser-based system to facilitate e-commerce payment transactions. Graph 4.49 shows the performance of IBG system.
SET Payment Gateway• In supporting the development of e-commerce, MEPS launched an internet payment gateway in March
1999 to process card-based payments for its member banks. The payment gateway accepts both Secure Sockets Layer (SSL) and Secured Electronic Transaction (SET) transactions. Currently, a total of eight banking institutions are participating in this system. Graph 4.50 shows the performance of the SET Payment Gateway.
Debit Card System• MEPS launched an interbank debit ePOS (electronic point of sale) service with three domestic banks in
early February 2002. In this system, MEPS would operate the switching network for domestic debit cards, such that ATM cardholders of participating banks would be able to pay for purchases using their ATM cards at participating merchants, regardless of the acquiring bank. A debit card system allows cardholders to have their purchase transactions charged directly to funds in accounts with the issuing banks.

179
Financial Sector
Module (REM) and securities borrowing and lending(SBL). The objectives of REM and SBL are to enhancethe liquidity in the secondary bond market byproviding a new framework or mechanism to supportthe trading strategy of dealers and to enhance returnson investment in bond portfolio for investors. Theimplementation of REM and SBL is also to facilitategreater flexibility in the settlement of REPO and SBLtransactions among RENTAS members. At the sametime, discussions are on-going to establish linkageswith other domestic clearing systems such as theequities clearing and settlement system to enhancethe current equities Delivery versus Payment model.
SPICKBNM introduced new day-hold periods for theclearing of outstation cheques deposited at and
drawn on the respective SPICK and non-SPICKareas, which are cleared at SPICK-KL. With effectfrom 1 December 2001, the day-hold for chequesdeposited at SPICK-KL, which are drawn on alltowns, would be three days, whilst chequesdeposited at Pulau Pinang, Johor Bahru, Kelantan,Terengganu, Sabah and Sarawak would be betweenthree to eight days. The cut-off time of 2.00 p.m.for same day clearing, which was introduced as atemporary measure by BNM, was also removed.Hence, all local cheques deposited during the daywould be cleared on the same day.
Cheque clearing for the non-SPICK areas in thestates of Kelantan and Terengganu in the EastCoast of Peninsular Malaysia and in Sabah andSarawak in East Malaysia is currently done manually.
38
39
40
41
42
43
44
220
230
240
250
260
270
280
290
300
Volume (million) Value (RM billion)
Q1 Q2 Q3 Q4 Q1 Q2 Q3 Q42000 2001
Volume (million) RM billion
Graph 4.48Value and Volume of Cheques Clearedby SPICK Centres
330
335
340
345
350
355
360
365
370
375
380
0
500
1,000
1,500
2,000
2,500
3,000
3,500
Q1 Q2 Q3 Q4 Q1 Q2 Q3 Q4
2000 2001
Total ('000) RM billion
IFTS Volume ('000) IFTS Value (RM billion)
Graph 4.46RENTAS IFTS Turnover
0
5
10
15
20
25
0
20
40
60
80
100
120
140
160
180
SSTS Volume ('000) SSTS Value (RM billion)
Q1 Q2 Q3 Q4 Q1 Q2 Q3 Q4
2000 2001
Total ('000) RM billion
Graph 4.47RENTAS SSTS Turnover
0
10
20
30
40
50
60
0
50
100
150
200
250
300
350
400
450
500
Number of Transactions ('000) Value (RM million)
Q4 Q1 Q2 Q3 Q4
2000 2001
Total ('000) RM million
Graph 4.49Inter-Bank GIRO Transactions

180
Graph 4.51Credit and Charge Card Operations in Malaysia
Value of Charge CardTransactions (RM billion)
0
0.5
1
1.5
2
2.5
3
3.5
4
0
5
10
15
20
25
No. of Charge Cards(million)
No. of Credit Cards(million)
Value of Credit CardTransactions (RM billion)
1996 1997 1998 1999 2000 2001
No. of cards (million) RM billion
BNM is exploring ways to improve the chequeclearing services in these areas, particularly inreducing further the number of day-holds.
Automated Teller Machines (ATMs)During the year, the banking institutions continued toenhance their ATM services to provide additionalfacilities for customers to perform various bankingtransactions, including requests for new cheque books,fixed deposit placements, unit trust purchases, billpayments, electronic ticketing, share issue applications,loan repayments and the reloading of prepaid cards.Plans are also underway to migrate the current set ofmagnetic stripe ATM cards to chip-based ATM cards byJanuary 2003 as part of the nation’s efforts toencourage the ulitisation of multipurpose smart cards(MPC) and the banking industry’s drive to counterfraud. As such, the ATM machines would be upgradedto read chip-based cards.
The Internet and Other Payment ServicesAt the end of 2001, eight domestic banks haveintroduced transactional internet banking services. Theservices offered allow customers to, among others,
remit payments and transfer funds between accountsand banks, conduct account balance inquiries andstatement requests, request for stop cheque paymentsand new cheque books, and access up-to-dateaccount information. In some cases, it is also possibleto submit loan applications and perform online sharetrading. Several banks have also provided online billpayment services using credit cards.
In 2001, a private sector operator had alsointroduced an electronic bill payment service viakiosks. The services provided at these kiosks includepayment of utility bills as well as prepaid uploadingand payments via credit cards, MEPS Cash and ATMcards of participating banks.
Developments in Payment MediaWhile cash is still the most common retail paymentinstrument used in Malaysia, the usage of creditcards, charge cards, debit cards and electronicmoney has been on an increasing trend. To someextent, this reflected the growing sophistication ofMalaysian consumers as well as aggressivepromotions by the card issuers.
BNM together with banks and credit cardassociations have implemented various measures toaddress the problem of credit card fraud. Thesemeasures included close monitoring of credit cardactivities through the issuance of guidelines andsupervision, formation of a Risk ManagementCoordination Unit by the industry to coordinatefraud data collection, increasing the awareness ofcredit card fraud activities among merchants and
No. of Value of No. of Value ofcards transactions cards transactions(‘000) (RM billion) (‘000) (RM billion)
Credit Cards 2,818 16.4 3,485 20.3Charge Cards 235.7 1.9 286.9 1.8Debit Cards n/a 0.04 n/a 0.04
Table 4.38Payment Media : Credit and Charge Cards
20012000
0
5
10
15
20
25
30
35
40
45
50
0
20
40
60
80
10
12
Volume ('000) Value (RM million)
Q1 Q2 Q3 Q4 Q1 Q2 Q3 Q4
2000 2001
Volume ('000) RM million
Graph 4.50SET Payment Gateway Transactions

181
Financial Sector
cardholders, promoting cooperation and enhancingthe investigative capabilities of banks in combatingcredit card fraud, and upgrading the banks’ cardsurveillance system.
Progress has also been made in theimplementation of the electronic money scheme,MEPS Cash, which was first introduced in 1998during the Commonwealth Games. To increase itsusage, the MEPS Cash card was piloted inSeptember 1999 at selected areas in KualaLumpur, with six banking institutions participatingand a total of 187 merchants accepting the MEPSCash card. The banking institutions are now in thefinal stages of implementing a nationwide roll outof the MEPS Cash application. Besides beingintroduced as a stand-alone card, MEPS Cash willalso be issued as an application in MyKad and thePayment Multi-Purpose Card (PMPC), which willcontain ATM and debit applications.
Co-operation InitiativesIn 2001, BNM had established the NationalPayments Advisory Council (NPAC), which was set upin 1993. The roles of the NPAC are:-
• To provide input to address the short and long-term payment systems infrastructural needs;
• To monitor and keep abreast of developments inpayment systems locally and abroad;
• To help co-ordinate various initiatives on paymentsystems to maximise utilisation of resources andavoid duplication of efforts;
• To provide inputs on the formulation of standardswhere necessary, for application of newtechnology in payment systems; and
• To provide their respective agency perspective onpayment systems matters.
Currently, members of the Council includerepresentatives from the Bank of Japan and theHong Kong Monetary Authority, as well as theMinistry of Energy, Communications andMultimedia, the Malaysian AdministrativeModernisation and Management Planning Unit(MAMPU) of the Prime Minister’s Department, theSecurities Commission, MEPS, the Association ofBanks in Malaysia, the Association of FinanceCompanies of Malaysia, the Association ofMerchant Banks in Malaysia, and the GeneralInsurance Association of Malaysia.

184-184 Overview185-193 Reform of the Financial Architecture193-196 Financial Sector Liberalisation196-202 Regional Co-operation Initiatives202-202 Bilateral Co-operation
External Relations

184
OVERVIEW
The conduct of Bank Negara Malaysia’s (BNM’s)external relations in 2001 was focused on regionalinitiatives to further strengthen regional surveillanceand support mechanisms for crisis prevention.BNM also participated in international meetings in theglobal efforts to reform the international financialarchitecture (IFA). This also included initiatives tostrengthen the domestic financial systems and toenhance the voluntary adoption of appropriatestandards and codes of good practices in thebanking sector and in capital market regulationand supervision.
As the year unfolded, the attention of international andregional fora turned progressively to surveillance issueswhen the weakening of global economic conditionsbecame increasingly pronounced. Malaysia’sparticipation in regional and international meetingsprovided opportunities to benefit from the sharing ofexperiences and exchange of views in assessing theefficacy of alternative policy responses to manage theadverse impact of developments in the major industrialcountries on the global and regional economies.
During the year, significant progress was achieved atthe regional level in terms of the implementation ofconcrete measures to assist regional economies incrisis prevention. This included the successfulimplementation of the Chiang Mai Initiative (CMI),a regional financial arrangement for crisis preventionamong the ASEAN+3 countries (namely, members ofthe Association of South-East Asian Nations, and thePeople’s Republic of China, Japan and Korea).Malaysia concluded a bilateral swap arrangementwith Japan under the CMI. The aim of thearrangements are to enhance the capacity of regionaleconomies to respond expeditiously to avert emergingcrises. Progress was also made in furtherstrengthening the economic review process amongthe ASEAN+3 countries to complement theimplementation of the CMI. In addition, furtherwork was undertaken at another regional forumto enhance regional co-operation in informationsharing on capital flows. The South-East AsianCentral Banks (SEACEN) Expert Group on CapitalFlows developed a common framework to addressgaps in data on capital flows. This co-operative effort
aims to facilitate an exchange of country experienceson the risk management of capital flows, an issue ofhigh priority to Malaysia and regional economies.
At the international level, progress in terms of theIFA reforms was limited. Although someimprovements were made in enhancing transparencyand streamlining the operations of the InternationalMonetary Fund (IMF), fundamental reform remainedelusive, particularly in the area of reform of the IFIsand managing the risks of excessive volatility incapital flows. As part of on-going efforts on IFAreforms, BNM hosted a meeting of the Groupof 15 (G-15) Expert Group on the Reform of theInternational Financial Architecture in Kuala Lumpuron 26 February 2002 to maintain the momentum forthe reforms as well as to ensure that the views andconcerns of developing countries, including theG-15 members, were addressed.
Although the issue of global co-operation to countermoney laundering and terrorist financing activitiesbecame a major theme in the international andregional fora only after September 2001, Malaysia’sinvolvement in promoting co-operation in this areahad been evident since early 2001. As the co-chairof the Asia/Pacific Group on Money Laundering,BNM’s involvement in the Group’s work focused onpromoting regional and international co-operationto counter money laundering activities. Malaysiaalso implemented a series of measures to preventthe abuse of the Malaysian financial system tofinance any criminal or terrorist activities. A furtherdevelopment in Malaysia’s external relations in 2001was the enhanced participation of BNM inpromoting international co-operation in thedevelopment of Islamic banking and finance.
During the year, BNM’s external relations continued toaccord importance to enhanced bilateral co-operation.Additional contacts were made to promote bilateralpayment arrangements, in line with the Government’sobjective to strengthen South-South trade. This wouldalso facilitate efforts to diversify Malaysia’s exportmarkets and reduce vulnerability to adversedevelopments in the traditional export markets. In2001, BNM continued to provide technical assistance toa number of central banks, primarily in the form ofattachments and training programmes.
External Relations

External Relations
185
REFORM OF THE INTERNATIONAL FINANCIALARCHITECTURE
In 2001, efforts toward reforming the IFA continuedto emphasise crisis prevention and management.Progress had been made in the areas oftransparency and standards and codes, which wereconsidered essential for crisis prevention. Someheadway was also made in the reform of theinternational financial institutions (IFIs). However,progress was limited in addressing the issue of thegovernance of the IFIs and risk management of
international capital flows. In this connection, BNMparticipated in a number of regional andinternational meetings, focusing on the concern thatthere was an urgent need for the internationalcommunity to persevere with concrete measures toreform the IFA to ensure greater efficiency ininternational financial markets. Malaysia supportedthe international community’s efforts to countermoney laundering and terrorist financing activitiesfollowing the events on 11 September 2001. Suchefforts should, however, not weaken the resolve topursue on-going IFA reform initiatives to promoteinternational financial stability and address the risksand challenges of globalisation.
Besides the continuing emphasis on transparencyand standards and codes, an equally importantelement of IFA reforms was the reform of the IFIs.Progress was mixed, with some improvements instreamlining conditionality in IMF programmes whilegovernance issues at the IMF (notably the issue ofIMF quotas) remained unresolved. The IMF’sIndependent Evaluation Office (IEO) beganoperations during the year, with the appointment ofthe Director of the IEO in August 2001. InDecember, the IEO outlined its work programme,which included plans to conduct an independentassessment of various aspects of IMF operations, asmandated by the IMF Board of Governors. Amongothers, the work programme included a study onfiscal adjustments and structural conditionality inIMF-supported programmes, an evaluation of the
IMF’s role in capital account crises, the role of IMFsurveillance in crisis prevention and the IMF’sapproach to capital account liberalisation.
The establishment of the IEO was in response to calls bythe IMF membership, including Malaysia, for anindependent evaluation of the IMF’s role and operationsand an objective assessment of issues related to the IMF.Following the Asian financial crisis, it was consideredimportant that the IMF drew lessons from the crisis andimproved its operations and capacity to respond moreeffectively to the changing needs of its diverse
membership. In doing so, it would be essential for theIEO to operate independently of the IMF management,as stated in its terms of reference.
During the year, the IMF introduced several reformsto streamline its financing facilities and the conditionsassociated with their use (IMF conditionality). Workin this area is ongoing. In addition to safeguardingIMF resources, the conditionality associated with IMFfinancing was seen as important in ensuring thesuccess of its financial assistance to membercountries. There was general consensus thatconditionality should be streamlined to focus on areasthat were critical to achieving the macroeconomicobjectives of the programme and enhanced countryownership of reforms. It was also agreed thatconditionality should aim to achieve a clearer divisionof labour and a more systematic and co-ordinatedworking relationship between the IMF and the WorldBank. During the year, the IMF organised severaloutreach seminars to seek the views of its memberson IMF conditionality. BNM forwarded a note to theseminar that was held in Tokyo on 10 July 2001 todiscuss these issues. The note highlighted theimportance for IMF conditionality to be more focusedand tailored to the requirements of its membercountries, and that the application of IMFconditionality needed to take into accountcountry-specific circumstances, and a country’s abilityor capacity to adopt and implement the requiredpolicy reforms. Malaysia also reaffirmed theimportance of enhancing the IMF’s capabilities in
Reforms in the international financial architecture in 2001 madefurther progress in the areas of transparency, and standards andcodes. Progress in fundamental reforms, particularly in addressinggovernance issues in the international financial institutions and riskmanagement of international capital flows, has been more limited.

186
IMF Meetings in 2001
International Monetary and Financial Committee (IMFC) Meetings in 2001• 29 April 2001, Washington D.C., United States of America• 17 November 2001, Ottawa, Canada
(The 2001 IMF-World Bank Annual Meetings were cancelled following the September 11 incident.)
Conclusion by IMFC Members• World Economic Outlook
- Noted that the September 11 incident would result in a more prolonged slowdown of the worldeconomy, despite policy actions to support a recovery in 2002.
- Emphasised the important responsibility of advanced economies to promote early recovery inglobal growth.
- Noted the importance of pursuing sound and proactive policies in emerging markets anddeveloping countries in the context of weakening global demand and higher risk aversion infinancial markets.
- Noted the importance of increased trade opportunities in promoting recovery.
• The Role of the IMF- Welcomed the move by the IMF to refocus its work on crisis prevention and supporting policies
aimed at sustainable growth and poverty reduction.- Considered the Contingent Credit Line to be an important signal of the strength of countries’
policies and a safeguard against contagion in financial markets.- Urged the IMF to work on outstanding issues in the area of private sector involvement in crisis
prevention and management.
• IMF Surveillance on Financial Markets and Crisis Prevention- Welcomed the decision to establish the International Capital Markets Department to enhance the
IMF’s understanding of and assessment on capital market issues; to enhance its early warningcapabilities; and to strengthen crisis prevention.
- Emphasised the need to make progress on early warning indicators of potential crises.- Noted the progress in the implementation of the IMF’s initiatives on crisis prevention and financial
sector surveillance, pertaining to the following:• Agreement on a list of international standards and codes; • The IMF’s work with countries to strengthen data underpinning external vulnerability analyses; • Implementation of initiatives on the IMF’s transparency policy; and• Progress in strengthening national and international financial sector surveillance, particularly on
the joint IMF-World Bank Financial Sector Assessment Programme.- Welcomed the expansion of the IMF’s financial sector work to include voluntary assessments of
offshore financial centres.
• Conditionality in IMF-supported Programmes- Welcomed the on-going review of conditionality and emphasised that it remained indispensable;
and reaffirmed that the objective of the streamlining was to make it more efficient, effective andfocused.
- Endorsed that conditionality should focus on measures critical to achieving macroeconomicobjectives of a programme.
- Noted the importance of taking into account the country’s decision-making processes and capacityto implement reforms, and the need for strong country ownership of a programme.
- Noted the importance of enhanced collaboration and clearer division of labour between the IMFand other international financial institutions in streamlining conditionality.

External Relations
187
analysing issues of political economy, to ensure thatprogramme design would address social and politicalconcerns as well as to ensure the successfulimplementation of a programme. Consideration ofthese factors would contribute towards enhancedcountry ownership of a programme. In this regard,closer consultation and collaboration with local orregional “experts” would enhance the IMF’sunderstanding of situations in a particular country.BNM’s views were recorded in the proceedings of theIMF seminar in Tokyo.
Malaysia also highlighted that the application ofconditionality must remain consistent with the IMF’sGuidelines on Conditionality, and not violate theprinciple of equal treatment across its membership.There was also a need for shared accountability by
the IMF in a programme. To the extent that an IMFprogramme adopted by any member country wasdesigned by IMF staff and based on the advice of theIMF, the IMF should also assume some responsibilityto ensure success of the programme.
The issue of IMF governance, notably theunder-representation of developing countries in thedecision-making process at the IMF, remainedunresolved in 2001 as discussions on this issue werefocused on the technical aspects only. The IMF heldan Executive Board seminar in October 2001 tofurther examine issues pertaining to the choice andspecification of the IMF quota formula (whichdetermined a member’s quota or capital subscriptionin the IMF). The aim was to develop a morerepresentative quota formula. The Executive Board
• Combating Financial Abuse/Money Laundering/Financing of Terrorism- Called on member countries to ratify and fully implement the United Nations instruments to
combat terrorism.- Agreed that the 40 Recommendations by the Financial Action Task Force (FATF) be accepted as the
international standard for combating money laundering, and that the Recommendations shouldbe made operational in the work of the IMF.
- Supported the Special Recommendations of the FATF to combat terrorist financing.- Urged international action to combat terrorist financing, and called for countries to take the
following measures, preferably by 1 February 2002: • Establish financial intelligence units to receive and process reports of suspicious transactions
from the country’s financial sector, and to monitor suspected terrorist funds; and• Institute mechanisms for sharing of information and co-operation among national financial
intelligence units.
• Efforts in Poverty and Debt Reduction in Poor Countries- Expressed concern at the adverse impact of the global slowdown on low-income and heavily
indebted poor countries, and called on the IMF and World Bank to respond flexibly and proactivelyto address the needs of these countries.
- Emphasised the different roles to be played by heavily indebted poor countries, developingcountries and advanced economies in fighting poverty.
- Recognised the importance of close collaboration and effective partnership among theinternational institutions in poverty and debt reduction efforts.
• Other Issues- Welcomed on-going measures to improve transparency, governance and accountability in the IMF,
with the expectation that the Independent Evaluation Office would improve IMF operations andenhance its accountability.
- Agreed that the IMF should address governance issues that had a significant macroeconomicimpact.
- Underscored the importance of open markets, and urged both the developed and developingcountries to find a common ground for the launch of a new round of multilateral tradenegotiations in 2001.
- Looked forward to further progress on the work on IMF quotas, which reflected the changingconditions in the international economy.

188
agreed that further work is needed to further developquota formulas that appropriately reflect members’position in the global economy. It noted that this taskis made difficult as quotas are overburdened byhaving to perform a variety of roles (quotas determinea member’s voting power in the IMF, its ability tocontribute resources to the IMF as well as accessto IMF financing facilities). The seminar was heldfollowing an independent review of the quotaformula carried out by the Quota Formula ReviewGroup (QFRG). The QFRG believed that quotasshould be adjusted to recognise the constantlychanging world economy, and the continual relativechange of the circumstances of individual members.
Malaysia remained concerned over the lack ofsignificant progress on the review of IMF quotas.To ensure a more equitable representation in thedecision-making process in the IMF, radical changesare needed to reform the quota structure. A newapproach or formula to governance may be necessaryto ensure that representation at the IMF ExecutiveBoard reflects the relative position of individualcountries in the current global economy.
A major activity of the IMF in 2001 was theimplementation of standards and codes to enhancetransparency. On the issue of adherence to thestandards and codes, adherence should bevoluntary and the IMF’s Report on Observance ofStandards and Codes and the Financial SectorAssessment Programme (FSAP) should not becomemandatory elements in the IMF Article IVConsultation process. Malaysia supported thetransparency initiative. However, also of importancewas the need to ensure that this greatertransparency resulted in more informed decision-making by investors. In this connection, theconclusions of an IMF economic forum entitled“Transparency at the IMF: The Road Ahead” on 13December 2001 provided useful insights. Theconsensus was that good transparency practices didnot necessarily guarantee economic and financialstability. It was also important that there was a clearlegal framework governing the IMF’s operating rulesand procedures to enable the public and the marketto understand how the IMF conducted its businessand made its policy decisions.
Malaysia has remained committed towardstransparency of its data and economic policies.Malaysia continues to meet all the requirements ofthe Special Data Dissemination Standard, includingthe forward-looking templates on Malaysia’s external
reserves as well as the continued publication of thePublic Information Notice of the IMF on the AnnualArticle IV Consultation on Malaysia.
Efforts toward enhancing greater transparencyby the private sector made further progress atthe 9th Manila Framework Group (MFG) Meeting inAuckland in December 2001. Malaysia hademphasised the need for a more balanced approachto the issues of transparency, in particular ondisclosure by the private sector. There was a generalconsensus that there should be greater disclosure bymarket participants. This should include thoseinstitutions that were of systemic importance, such asthe highly leveraged institutions and internationalcredit rating agencies whose activities hadimplications on market stability.
An issue of particular interest to Malaysia, namely, therisk management of capital flows, continued tofeature prominently on the agenda of severalinternational fora in 2001. Some progress was madeon work on capital flows, notably at the IMF and theBIS. The ongoing work programme of the IMF in thearea of crisis prevention and financial sectorsurveillance included wider use of the IMF’s SpecialData Dissemination Standard and the General DataDissemination System; expanded coverage of theIMF’s Coordinated Portfolio Investment Survey toinclude additional instruments and jurisdictions,including offshore financial centres (OFCs); andprogress made with respect to the FSAP.
During the year, the BIS continued with its efforts toreplace the existing capital adequacy framework (the1988 Capital Accord) with a more risk-sensitiveframework. In supporting this initiative, BNMprovided feedback and participated in discussions onissues related to the draft new Accord. The BaselCommittee on Banking Supervision planned toundertake a review of the impact of the new Accordon banks and issue a consultative paper in 2002. TheAccord will be finalised during 2002 forimplementation in 2005.
BNM had the opportunity to relate its experience onthe issue of capital flows and policy in emergingeconomies, which was the subject of a BIS MonthlyBoard meeting in September 2001. During the year,BNM also accepted the invitation by the BIS toparticipate in the BIS survey on international bankingstatistics. Data were submitted on a quarterly basis,based on currently available international bankingdata on a locational basis by instrument.

External Relations
189
Transparency at the IMF
IMF’s Publication PolicyOn 4 January 2001, the IMF Executive Board agreed on a set of principles for the IMF’s publication policy asfollows:
• The publication of country papers should aim at:i. Ensuring that frank policy discussions and reporting to the Board would be maintained;ii. Striking the appropriate balance between transparency and confidentiality in dealing with sensitive
issues; andiii. Continued improvement in the quality of IMF staff reports.
• Publication of country papers should be subjected to a uniform deletions policy, which would beminimal and limited to the highly market-sensitive information.
• The presumption that the Letters of Intent/Memoranda of Economic and Financial Policies wouldbe released. Such Letters would state a government’s policy intentions. These Letters would includeTechnical Memoranda of Understanding with policy content and Poverty Reduction Strategy Papers.
These documents would be published in full, subject to the agreed deletions policy. A member that didnot intend to publish these documents would explain its reason prior to the IMF’s approval of its requestfor an arrangement.
• The publication of Heavily Indebted Poor Countries (HIPC) Initiative papers and relevant PovertyReduction Strategy Papers and Chairman’s Statements, conveying key points to the public would becontinued.
• The Board would continue with the policy of voluntary publication of Public Information Notices (PINs)following Article IV Consultation and Board discussions on regional surveillance papers, concludingstatements of Article IV Consultation, Recent Economic Developments, Selected Issues, StatisticalAppendices and Reports on Observance of Standards and Codes (ROSCs).
Assessment of Implementation of Standards and CodesOn 29 January 2001, the IMF Executive Board reviewed the experiences in the implementation of standardsand codes, and discussed the next steps of action. The Executive Board agreed that:
• The development and implementation of standards in areas relevant to the effective functioning ofmembers’ economic and financial systems were central to strengthening the architecture of theinternational financial system;
• Increased attention to standards and the introduction of standards assessments would help sharpen thefocus of IMF policy discussions with country authorities and strengthen the functioning of markets; and
• ROSCs, as the principal tool for assessing implementation, would provide rigour, content and focus to thework on standards. The ROSCs were initiated in January 1999 as a pilot programme for the preparationand use of summary assessments of members’ implementation and observance of standards and codes.
Code of Good Practices on Fiscal Transparency On 23 March 2001, the IMF Executive Board approved a revision of the Code of Good Practices on FiscalTransparency as well as the Manual on Fiscal Transparency, with the objective of placing greater emphasis onthe importance of fiscal data quality.

190
During the 11th Summit of the Heads of State andGovernment of the Group of 15 (G-15) in May 2001,concern was expressed that increased reliance onprivate capital flows in financing developmentaccentuated the inequality in resource distributionamong countries while simultaneously inducing morevolatility in financial flows. Given the shortage ofcapital inflows in many developing countries despiterestructuring and reform efforts, participants calledfor effective public and private partnerships in effortsto increase such flows. Investors were called uponto give due cognisance to the development objectivesof their host countries.
At the regional level, Malaysia continued to play anactive role in the SEACEN Expert Group on CapitalFlows (SEG). Progress made included the developmentof a common set of data templates for SEG membersto exchange information on capital flows. Movingforward, the SEG would work towards developingconcrete and practical proposals that members couldimplement individually or collectively to enhance therisk management of volatile capital flows.
In the light of the challenges posed by increasedglobalisation and financial liberalisation, Malaysia
emphasised the need for additional initiatives at the9th Meeting of the MFG in December 2001. At theinternational level, Malaysia proposed that an IFIassume an increased role in promoting andsafeguarding international financial stability.Initiatives at the regional level could encompass thestrengthening of regional surveillance and theimprovement of regional financing arrangements.At the national level, an integrated risk managementframework could be developed to monitor debt- andnon-debt creating flows, identify acceptable levels ofrisk and develop the methodology and technology tomeasure and monitor increased risks.
During the year, there was some progressin ongoing initiatives with regard to the HighlyLeveraged Institutions (HLIs). The Joint WorkingGroup on HLIs (of the Basel Committee on BankingSupervision and International Organisation ofSecurities Commissions) reviewed issues related to thedealings of banks and securities firms with HLIs inMarch 2001. Encouraging progress in the firms’implementation of the HLI Sound Practicerecommendations made by both the Basel Committeeand International Organisation of SecuritiesCommissions was evident from the strengthening of
Review of the IMF’s Data Standards InitiativesOn 23 July 2001, the IMF Executive Board conducted its Fourth Review of the IMF’s Data StandardsInitiatives, and agreed on the following:
• Observance of the Special Data Dissemination Standard:- Observance issues would be addressed by placing notices on the observance of the Standard,
indicating the nature of non-observance, and stating the time-bound plans for coming intoobservance by subscribers; and
- Outreach efforts would be strengthened through seminars on international standards and codesand surveys on users of the Dissemination Standards Bulletin Board.
• A common voluntary database for reserves template data would be established and disseminated overthe IMF’s website.
• Work should continue on finalising the Debt Guide and raising awareness of the data disseminationstandard for external debt.
• Establishment of a General Data Dissemination System (GDDS) unit at the IMF. Meanwhile, the IMFand the World Bank would collaborate closely on the socio-demographic component of the GDDSand the development of metadata for countries wishing to participate.
• An assessment methodology to assess data quality called the Data Quality Assessment Frameworkwould be integrated into the structure of the data module of the ROSC as a central element of a DataQuality Assessment Programme.

External Relations
191
the oversight of senior managements throughimproved policies and a clearer definition of riskappetites. Additional progress was needed in theassessment of firms’ exposure to HLIs. Whiledisclosure by HLIs to their counterparties hadimproved, progress was inconsistent.
In its review in March 2001, the Financial StabilityForum (FSF) Working Group on HLIs reported similarfindings in the areas of counterparty risk managementand disclosure. In the area of market conduct, thePrinciples for Foreign Exchange Trading released inFebruary 2001 would be incorporated into existingcodes of market conduct. Progress in the developmentof legal documentation practices was good, althoughprogress in resolving issues in the area of improvingconsistency between different industry standards ofdocumentation had been difficult.
Despite the progress, the issue of HLIs remained amatter of concern in various fora, including the 11thSummit of the Heads of State and Government of theG-15 in May 2001 and the 9th Meeting of the ManilaFramework Group in December 2001. In view of theneed to maintain international financial stability, theG-15 Leaders called for the monitoring and regulationof HLIs to safeguard countries from the destabilisingeffects of their activities.
At the 9th Manila Framework Group Meeting,concern was expressed that not much attention hadbeen given to the impact of hedge fund activities onthe integrity and stability of small emerging markets,as current initiatives were focused on enhancingdisclosure by the HLIs and ensuring thatcounterparties strengthened risk managementpractices when dealing with the HLIs. Malaysiareiterated its stance that “self regulation” among HLIswas not a viable option. Additional measures wereproposed in the area of improving risk managementby both hedge funds and banks, dealing practices ofhedge funds, identifying incentives forobservance of practices by hedge funds andidentifying mechanisms to solve disputes betweeneconomies on hedge fund activities.
The issue of private sector involvement (PSI) inforestalling and resolving financial crises gainedfurther ground in 2001. Based on the basic principlethat a market economy required debtors and privatecreditors to bear the consequences of their decisions,principles for transparency and good communicationwere drawn up by the Working Group onCreditor-Debtor Relations set up by the IMF’s Capital
Markets Consultative Group. The latter comprised agroup of senior representatives of private financialinstitutions, which had an informal dialogue with theIMF on a regular basis.
Going forward, in November 2001, the IMF proposeda framework which would encourage both debtorsand creditors to restructure unsustainable sovereigndebts in a timely and efficient manner. The IMFmechanism offered the debtor country legalprotection from creditors who stood in the way of anecessary restructuring, while the debtor country wasobligated to negotiate with its creditors in good faithand implement policies to prevent a similar problemin the future. The proposed mechanism attempted todeal with the complex issue of sovereign debtrestructuring in an orderly, predictable and promptmanner. However, many issues, rangingfrom legal to political concerns, needed to beresolved before the mechanism could beimplemented. Further work would need to be doneto make the principles and rules of the mechanismclear, credible and operational.
Discussions on exchange rate regimes continued tofeature prominently among members of theinternational community, with widespreadacknowledgement that no one exchange rate regimewas suitable for all countries in all circumstances.Furthermore, there was consensus in the internationalcommunity, including the Executive Meeting of EastAsia and Pacific (EMEAP) Central Banks and theAsia-Europe Meeting (ASEM) as well as internationalfinancial institutions such as the IMF, that countriesshould adopt exchange rate regimes that supportedand complemented their macroeconomic andstructural policies.
Amid the debate on the costs and benefits of thetwo “corner regimes”, namely an independentfloating exchange rate or a hard peg, the IMFunderscored the importance for countries to adoptexchange rate regimes consistent with their specificmacroeconomic fundamentals. With respect toMalaysia’s pegged exchange rate system, the IMFobserved during its Annual Article IV Consultationwith Malaysia in August 2001 that the pegged systemwas sustainable as long as the level of the ringgitexchange rate was not misaligned from its long-termequilibrium and that economic fundamentalsremained strong. The issue, therefore, was not thetype of exchange rate regime itself thatwas adopted but whether the exchange rate regimewas supported by sound policies which served the

192
FSF Meetings in 2001
Meetings of the FSF• 22 - 23 March, Washington, D.C., United States of America• 6 - 7 September, London, United Kingdom
Issues Discussed• International Financial System Outlook
- Assessed the implications of the current global economic outlook on financial stability, and agreedon the need for continued vigilance.
- Reviewed the responses of key financial systems and markets to the world economic slowdown.
• Highly Leveraged Institutions (HLIs)- Reviewed the actions taken so far to address concerns raised in the report of its Working Group on
HLIs.- Welcomed the completion of the work of the Multidisciplinary Working Group on Enhanced
Disclosure and urged taking this initiative forward.- Welcomed and encouraged further progress by the Global Documentation Steering Committee in
efforts to improve the consistency of the documentation standards.
• OFCs- Welcomed the efforts of standard-setting bodies and international financial institutions to improve
supervisory, regulatory, and cooperation and information practices in OFCs.- Encouraged OFCs to further enhance their implementation of relevant international standards, seek
assistance from the IMF and World Bank, and participate in assessment programmes.- Noted that disclosure of action plans and assessment findings were a useful means for OFCs to
demonstrate their progress towards meeting such standards.- Reviewed the actions taken so far to address concerns raised in the March 2000 Report of the FSF
Working Group on OFCs.- Welcomed the proposal of the Basel Committee on Banking Supervision to set up a contact group
with offshore supervisors.
• Implementation of Standards- Reviewed work to foster the implementation of international standards for sound financial systems.- Discussed progress in providing incentives to foster the implementation of standards.
• International Guidance on Deposit Insurance Systems- Welcomed the development of guidance for the benefit of countries establishing or reforming a
deposit insurance system.
• Risk Management and Capital Regulation- Welcomed the work of the Joint Forum (Basel Committee on Banking Supervision, International
Association of Insurance Supervisors and International Organisation of Securities Commissions) in comparing approaches to risk management and capital regulation across the banking, insurance and securities sectors.
• Financial Sector Robustness- Welcomed the work of the Joint Forum in comparing the three sets of Core Principles for effective
banking supervision, insurance supervision and securities regulation.
• Developments in E-finance- Discussed developments in e-finance for supervision, regulation and market functioning.

External Relations
193
needs of the economy and did not createmacro-economic imbalances. In this regard, it wasconcluded that Malaysia’s pegged exchangerate was well sustained by strong fundamentals ofthe Malaysian economy.
Participation in IMF MeetingsAs part of its outreach programme, the IMF organisedperiodic study visits to member countries, in order tofamiliarise IMF Executive Directors with the currentsituation in member countries. Malaysia hosted a visitfrom a group of IMF Executive Directors on25-27 October 2001, who were on a study tour offour South-east Asian countries (the others beingCambodia, Thailand and Vietnam). The IMF Directorshad wide-ranging discussions with the Deputy PrimeMinister, the Governor of BNM, the Secretary-Generalof the Ministry of Finance, the Executive Director ofthe National Economic Action Council, the Chairmanof Securities Commission, other senior governmentofficials, and representatives from the private sector.Malaysia updated the IMF on the current economicsituation and policies in Malaysia. In response toquestions posed by the Executive Directors, Malaysiashared its concern that there should be greaterflexibility in IMF policy prescriptions, with dueconsideration being accorded to the institutionalframework and the specific economic, social andpolitical situation in individual countries. Malaysiaalso conveyed its view that while it supported theIMF’s efforts to improve the transparency of IMFoperations, there was a need to achieve a balance interms of preserving the confidentiality of its policyadvice to member countries.
On exchange rate policy, BNM highlighted that insmall, highly open trade-oriented economies such asMalaysia, stability in the exchange rate wasimportant. In Malaysia, the pegged exchange ratesystem was well supported by the macroeconomicfundamentals of low inflation, a strong externalbalance, low external indebtedness, a high level ofreserves, and a well-capitalised banking system. Thestable foreign exchange and financial marketenvironment allowed significant progress to occurin the reform in the financial and corporate sectors.
In the area of Islamic banking and finance at theinternational level, BNM participated in the IMFmeetings, both at the preparatory committee andGovernors’ consultative meetings, on RiskManagement and Regulatory Standards for IslamicFinancial Institutions. These meetings discussed anddeliberated on the feasibility of establishing a standard-
setting body for Islamic financial institutions that wasexpected, among others, to develop and disseminateuniform prudential, disclosure and regulatory standardsto govern risks inherent to Islamic financial products.Among the participants who attended the meetingswere Governors and senior officers of the central banksfrom Bahrain, Bangladesh, Egypt, Iran, Indonesia,Jordan, Kuwait, Malaysia, Pakistan, Saudi Arabia andSudan, and representatives from the IMF, the IslamicDevelopment Bank and Accounting and Auditing ofIslamic Financial Institutions (AAOIFI).
The preparatory committee met in March 2001(Washington D.C.), June 2001 (Kuala Lumpur), July2001 (Bahrain) and January 2002 (Paris) to preparethe framework and Articles of Agreement of thestandard-setting body for deliberation at theGovernors’ consultative meeting. The consultativemeetings of Governors were held in April 2001(Washington D.C.) and November 2001 (Paris).At their meeting in November, Governors agreed onthe establishment of a standard-setting body forIslamic financial institutions, with Malaysia as the hostcountry of the standard-setting body. During theyear, Bahrain and Malaysia also concluded aMemorandum of Understanding in October 2001with the objective of entering into greaterco-operation in the area of finance. This involved thecollaborative efforts with other countries to developthe International Islamic Financial Market.
FINANCIAL SECTOR LIBERALISATION
World Trade OrganisationThe most significant event for the World TradeOrganisation (WTO) in 2001 was the Fourth WTOMinisterial Conference (4th MC), which was held inDoha, Qatar, on 9 - 14 November 2001. The 4th MCagreed to launch a new round of multilateral tradenegotiations, to be called the Development Agenda.The new round of trade negotiations would includethe continuation of current negotiations in theagriculture and services sectors, as well asnegotiations or possible negotiations on a range ofissues, including market access for non-agriculturalproducts, implementation issues, environment,investment, competition policy and transparency ingovernment procurement. Negotiations under theDevelopment Agenda were scheduled to beconcluded by 1 January 2005.
Malaysia was supportive of a new round ofmultilateral trade negotiations but highlighted theimportance of having a balanced and manageable

194
agenda, which gave due consideration to the interestsand concerns of all members, particularly thedeveloping countries. In this regard, Malaysiasupported the inclusion of negotiations in theagriculture and services sectors, as well as marketaccess for non-agricultural products. In addition, thenew round also recognised the special needs of thedeveloping countries, particularly in implementing theexisting WTO agreements, and committed WTO
members to addressing the particular vulnerability ofthese countries through technical assistance andcapacity building. On the contentious issues ofinvestment, competition policy, transparency ingovernment procurement and trade facilitation, theeducative process with a more focused workprogramme would continue. In deference to theviews of a number of developing countries,negotiations on these areas would only start after the5th MC, provided that explicit consensus on themodalities of negotiations was achieved.
Negotiations to further liberalise the services sector,including the financial services sector, were formallylaunched on 25 February 2000. The 4th MC furtheragreed that member countries should submit initialrequests for specific commitments by 30 June 2002 andinitial offers by 31 March 2003. It was also agreed thatnegotiations on the services sector were to becompleted by no later than 1 January 2005.
BNM was involved in the services negotiations in 2001,especially in discussions relating to the furtherliberalisation of the financial services sector. Withnegotiations entering into the “request and offer”phase on 28 March 2001, a number of countries hadsubmitted negotiating proposals in the financial servicessector, identifying areas and issues that they intended topursue in the current round of negotiations. Theseincluded requests for the removal of existing restrictionson market access and any preferential treatmentcurrently accorded to domestic players, as well as callsfor national authorities to improve transparency in theregulation of the financial sector.
At the last round of negotiations on the financialservices sector, which were concluded in December
1997, Malaysia made a number of improvements inthe insurance and offshore financial sectors.Malaysia had committed under the GeneralAgreement on Trade in Services (GATS) to allow anaggregate maximum foreign equity limit in thedomestic banking institutions of 30%. In line withthe policy to consolidate the banking sector, nocommitment was made to issue new bankinglicences to either locals or foreigners. In the
insurance sector, a commitment was made to allowexisting original foreign shareholders to own up to51% of the insurance companies. In addition, newentry of foreign insurance companies was alsowelcomed through participation (up to 30% of totalequity) in locally-incorporated insurance companies.
The negotiations for the further liberalisation of thefinancial sector would be in accordance with thefinancial sector development path charted in theFinancial Sector Masterplan (FSMP). To date, theforeign presence in the domestic financial sector issignificant. Of the 27 commercial banks (includingtwo Islamic banks), 14 are wholly foreign-ownedand foreigners further owned an average of 18% ofthe total equity of five domestically-owned banks.Together, foreigners accounted for about 32% oftotal commercial bank assets. Similarly, foreignpresence is also significant in the domesticinsurance industry, with 25 out of 63 insurancecompanies being foreign-owned. The market shareof foreign-owned insurance companies operating inMalaysia amounts to 64% of life insurancepremiums and 39% of general insurance premiums.
In line with the commitment towards furtherliberalisation of the financial sector, the focus ofpolicy in 2001 was to strengthen the capacity andcapability of the domestically-owned financialinstitutions. This was aimed at enhancing theirability to compete on a more level playing fieldwith the foreign financial institutions. Thenegotiations to liberalise the financial services sectorunder the new round have further increased theurgency to strengthen the capacity of thedomestically-owned financial institutions. Anumber of capacity-building initiatives had been
A new round of multilateral trade negotiations, coveringnegotiations in the agriculture and services sectors as well asseveral new areas, was launched in 2001. Negotiations are to becompleted by 1 January 2005.

External Relations
195
identified under the FSMP, including appropriatestrategies to raise performance standards. Indeed,as part of the measures to further develop thefinancial sector, the FSMP had identified a numberof liberalisation measures that would be undertakenover the next 10-year period.
ASEAN Framework Agreement on ServicesThe ASEAN Framework Agreement on Services(AFAS) was signed on 15 December 1995 by theASEAN Economic Ministers at the Fifth ASEANSummit in Bangkok. The aim of AFAS was todevelop and enhance the competitiveness of theservices industry in ASEAN through, among others,liberalising trade in services beyond the commitmentsundertaken in the GATS (that is, “GATS-plus”). The
first round of negotiations under AFAS to liberalisethe services sector, including the financial servicessector, was concluded in 1998. Subsequently, asecond round of negotiations was launched inJanuary 1999, and scheduled to be concluded in2001. In this connection, in August 2000, the“Working Committee on ASEAN FinancialLiberalisation under AFAS” was formed to provide aforum for negotiations to liberalise the financialsector among the ASEAN countries. BNMparticipated in a number of meetings held by theWorking Committee throughout 2001, during whichASEAN member countries tabled and negotiatedtheir GATS-plus offers. The offers of commitments bymember countries had been finalised and the“Protocol to Implement the Package of
Schedule of WTO Negotiations on Trade in Services (2000-2005)
25 February 2000The new round of servicesnegotiations was formally launched
Negotiations began with the “rules-making” phase where Membersnegotiated the new rules and disciplines relating to specificprovisions of the General Agreement on Trade in Services (GATS),including on subsidies, emergency safeguards and governmentprocurement.
The discussions also focused on the procedures and guidelines forthe “request and offer” phase of negotiations, schedulingguidelines and disciplines on domestic regulation.
BNM was actively involved in negotiations to formulate anagreement on emergency safeguard measures for the servicessector (see BNM Annual Report 2000).
The adoption of negotiating guidelines by Members marked thestart of the “request and offer” phase of negotiations. Negotiationsfor further liberalisation would be conducted on the basis ofnegotiating proposals submitted by Members.
“Request and offer” is essentially a bilateral negotiating approach,whereby negotiations are conducted based on requests submittedby a country to a trading partner and offers submitted by thetrading partner.
Members to submit initial requests for specific commitments fromother Members by 30 June 2002.
Members to submit initial offers of specific commitments by 31March 2003.
Services negotiations to be completed.
28 March 2001Services negotiations entered intothe “request and offer” phase
30 June 2002
1 January 2005
31 March 2003

196
Commitments on Financial Services under the AFAS”was expected to be signed in April 2002.
REGIONAL CO-OPERATION INITIATIVES
ASEAN Financial Co-operationIn 2001, significant progress was achieved in anumber of initiatives to further enhance regional
co-operation. At the ASEAN level, BNM assumedthe chairmanship of the ASEAN Central Bank Forum(ACBF), a forum for the Deputy Governors of the
10 central banks and monetary authority in ASEANto exchange views on economic and financialdevelopments in the region. In this connection,BNM hosted the 8th and 9th ACBF Meetings,which were held in Kuala Lumpur on 3 April and13 September 2001 respectively. At the 9th ACBFMeeting, member central banks agreed tostrengthen the format of the ACBF in order
to further enhance the peer review processand encourage frank exchange of views amongthe members.
ASEAN Central Bank Forum (ACBF) Meetings in 2001
I. 8th ACBF, 3 April 2001, Kuala Lumpur, Malaysia II. 9th ACBF, 13 September 2001, Kuala Lumpur, Malaysia
Issues Discussed:• Peer Review: Members discussed extensively the implications of the global economic slowdown for
the ASEAN countries and exchanged views on the policy responses adopted by member countries to mitigate the consequent adverse effects. It was agreed that strengthening domestic demand was critical in mitigating the effects of the slowdown in external demand on the region’s economic growth. Members also agreed that it was important to maintain exchange rate and financial stability in the region, and to strengthen financial and corporate sector restructuring.
• Bilateral Swap Arrangements (BSA) under the Chiang Mai Initiative: Members discussed the progress of the implementation of the BSA.
• Proposed Modalities to Enhance Regional Economic Reviews and Policy Dialogues: Membersexchanged views on proposed ways to enhance existing economic reviews and policy dialogues among the ASEAN+3 countries.
• ASEAN Common Currency and Exchange Rate Mechanism: Members discussed the report presented by the Chairman of the ASEAN Currency and Exchange Rate Mechanism Task Force, and agreed that the Task Force should analyse the costs and benefits of having a common currency in ASEAN, and identify measures that would need to be undertaken for the common currency arrangement to be feasible.
• ASEAN Central Bank Governors’ Conference: Members discussed the proposal to hold an annual ASEAN Central Bank Governors’ Conference to complement the ACBF. The Conference would providea forum for the Governors to exchange views on recent economic and financial developments in the region as well as to identify possible areas for co-operation among the ASEAN central banks. A consensus was reached to hold the first Governors’ Conference tentatively in June 2002.
Efforts to strengthen regional co-operation intensified in 2001.Significant progress was made in the implementation of the ChiangMai Initiative and work had started on enhancing the effectivenessof regional economic reviews and policy dialogue.

External Relations
197
BNM, as the chair of the ASEAN Currency andExchange Rate Mechanism Task Force, organised aseminar on “Common Currency Arrangements andExchange Rate Mechanisms in ASEAN” in KualaLumpur on 6-7 August 2001, as well as hosted theinaugural meeting of the Task Force on 8 August 2001.The seminar provided an opportunity for participants tohear the views of experts on the preconditions, costsand benefits of common currency arrangements. Theinaugural meeting of the Task Force agreed that thework of the Task Force would focus on identifying thecosts, benefits and feasibility of having a commoncurrency arrangement in ASEAN.
Another important development in ASEAN financial co-operation in 2001 was the finalisation of thememorandum of understanding to establish the ASEANInsurance Training and Research Institute (AITRI) inMalaysia as the ASEAN network centre for insuranceeducation and research. Initially, the operations of the
AITRI would be co-ordinated by the MalaysianInsurance Institute. On 8 April 2001, the ASEAN FinanceMinisters signed the “Protocol to Establish an ASEANScheme of Compulsory Motor Vehicle Insurance”. Theimplementation of the Protocol represents the first steptowards the establishment of an insurance schemewithin ASEAN which would facilitate the movement ofgoods among the ASEAN countries by reducing delaysin cross-border crossings.
ASEAN+3 Financial Co-operationDuring 2001, significant progress was made in theimplementation of the Chiang Mai Initiative (CMI),which was launched by the ASEAN Finance Ministersand their counterparts from the People’s Republic ofChina, Japan and Korea (that is, the ASEAN+3 FinanceMinisters) on 6 May 2000.
BNM entered into two Bilateral Swap Arrangements(BSA) with the Bank of Japan, acting on behalf of the
ASEAN and ASEAN+3 Finance Ministers’ Meetings in 2001
I. 5th AFMM, 7-8 April 2001, Kuala Lumpur, MalaysiaII. AFMM+3, 9 May 2001, Honolulu, United States of America
Issues Discussed:• Peer Review: Ministers noted the deterioration in the global economic outlook and pre-emptive
measures taken by some of the member countries to alleviate the effects of lower external demand. Ministers agreed on the need to continue with financial and corporate sector restructuring, as well as to promote robust and strong financial systems to better withstand external shocks. Ministers also agreed to have closer policy dialogues and strengthen regional co-operation in the areas of monitoring capital flows, support mechanisms, and international financial reforms.
• ASEAN Finance Co-operation: Ministers welcomed progress made in implementing the ASEAN Finance Work Programme, including in the areas of strengthening the financial system, capital market development and liberalisation of the financial sector under AFAS.
• East Asia Finance Co-operation: Ministers noted the progress of the implementation of the BSA under the CMI and agreed to review the main principles of the BSA in three years, taking into accountthe actual operation of the BSA and other relevant factors.
• Study Group to Enhance the Effectiveness of Economic Reviews and Policy Dialogues: Ministers agreed to establish an ASEAN+3 Study Group to enhance the effectiveness of economic reviews and policy dialogues among the ASEAN+3 countries.
• Monitoring of Capital Flows: Ministers agreed to engage in regular exchange of information on short-term capital flows. In this connection, member countries agreed to exchange information on capital flows using an agreed format on a voluntary basis.
• International Financial Architecture: Ministers noted the latest developments in the G-7, G-20 andthe FSF in 2001.

198
Ministry of Finance, Japan, on 5 October 2001. Theagreements comprised a new US$1 billion BSA underthe CMI and the renewal of the existing swaparrangement of US$2.5 billion under the NewMiyazawa Initiative (NMI). These agreements are for aperiod of three years.
Regionally, Japan has also entered into a swaparrangement of US$2 billion with Korea on 4 July2001. This was in addition to their existing US$5billion swap arrangement with Korea under theNMI. Japan has also signed swap agreements withThailand amounting to US$3 billion on 30 July2001, and with the Philippines also for US$3billion on 27 August 2001. Thailand and thePeople’s Republic of China concluded anagreement for a swap arrangement of US$2 billionon 6 December 2001.
Another important milestone in the area of regionalfinancial co-operation was the establishment of an“ASEAN+3 Study Group to Examine Ways of Enhancingthe Effectiveness of Economic Reviews and PolicyDialogues” by the ASEAN+3 Finance Ministers at theirmeeting in Honolulu on 9 May 2001. The task of theStudy Group was to examine ways to further enhancethe effectiveness of economic reviews and policydialogues among the ASEAN+3 countries. Enhancedreviews and policy dialogues, encompassing peerreview, would aid in identifying emerging issues andpotential problems, and thus enable authorities to takeprompt corrective and pre-emptive policy actions andminimise the risk of contagion. In addition, anenhanced regional policy dialogue process would alsopromote sound macroeconomic policies and addressany moral hazard problem that might arise inimplementing the CMI. The Study Group wasco-chaired by Japan and Malaysia, and comprised seniorofficials from finance ministries and central banks of theASEAN+3 countries. The First Meeting of the StudyGroup was held in Kuala Lumpur on 22 November2001. The Meeting discussed the possible modalitiesto enhance regional economic reviews and policydialogues as proposed by Japan and BNM.
SEACENDuring the Thirty-sixth Conference of Governors ofSouth-East Asian Central Banks (SEACEN), which washeld in Singapore on 1-2 June 2001, Governorsshared their countries’ experiences in maintainingfinancial stability. Discussions ranged from the issue ofexchange rate management to upgrading supervisorycapabilities and framework; and the implementationof the New Basel Capital Accord.
A significant activity undertaken by the SEACENResearch and Training Centre (SEACEN Centre) was thecompletion and submission of the SEACEN StrategicReview to the SEACEN Board of Governors in June2001. The Board of Governors deliberated on theReview’s recommendations on the structure, resourcesand mode of operation of the SEACEN Centre. Theproposed changes were aimed at ensuring the Centre’srelevance in enhancing the skills capacity of its membersto meet the challenges of globalisation andstrengthening its role as a unique and reputable trainingand research institute in the region. In this regard, theGovernors agreed in principle to the proposals to realignand give greater focus to the Centre’s activities andorganisational structure. An immediate enhancement ofthe governing structure of the SEACEN Centre was theestablishment of an Executive Committee comprisingthe Deputy Governors of member central banks. Thenew governance structure would enable the Board ofGovernors to delegate the responsibility for themanagement and oversight of the SEACEN Centre’soperations, such as its annual work programme andbudget to the Executive Committee. This would allowthe Board of Governors, which remained the highestpolicy-making body of the SEACEN Centre, to focuson deliberations on key issues in monetary andfinancial policies.
To upgrade the quality of its training programmes,SEACEN continued to strengthen its strategic allianceswith international financial institutions such as theIMF, BIS and the Toronto Centre. The Centre’sfinancial resources were augmented by the Bank ofJapan’s pledge to provide financing for five SEACENtraining events a year as agreed by the Bank of Japan. During the SEACEN Centre’s operating year2001/2002, BNM hosted two training activities,namely the Workshop on Communication Strategyfor Monetary Policy (19-21 February 2002) and theSEACEN-Toronto Centre Leadership Seminar forSenior Management of Central Banks on FinancialSystem Oversight (18-22 March 2002).
The SEACEN Expert Group on Capital Flows (SEG)made further progress in developing a regionalframework to promote information sharing on capitalflows among its members. At its third meeting whichwas held in Kuala Lumpur on 3-4 May 2001,members agreed to provide information, based on acommon set of data templates, which sought toaddress current gaps in data on capital flows. Thedata would be shared via a secure electronic dataexchange facility at the SEACEN Centre. During themeeting, members exchanged country experiences on

External Relations
199
the risk management of capital flows. In addition, ahalf-day workshop on managing risks associated withcapital flows was held, with presentations by theWorld Bank and the private sector. Going forward,the SEG would commence work on the secondobjective of drawing up concrete and practicalproposals that members could implement individuallyor collectively to enhance the risk management ofvolatile capital flows.
Under the SEACEN Trust Fund (STF) Grant andScholarship Scheme, four scholarships were awardedto eligible member countries, while one was awardedto a SEACEN observer central bank. The Scheme,which began in 1993, provided financial assistance toeligible member and observer central bank officers toattend training programmes conducted by theSEACEN Centre.
EMEAPThe Executive Meeting of East Asia and Pacific (EMEAP)Central Banks continued to be an important forum formonetary and financial co-operation among centralbanks and monetary authorities in the East Asia andPacific region. During the year, the EMEAP Deputiesheld their bi-annual meetings in Beijing on 26 March,and in Auckland on 3 December. The 6th AnnualGovernors’ Meeting was held in Sydney on 7 July 2001.EMEAP, through the activities of its three working
groups, contributed to capacity building amongmember central banks. The Working Group on Paymentand Settlement Systems focused on ways to reduceforeign exchange settlement risk in the EMEAP region.The Working Group on Banking Supervision focusedmainly on the proposed new Basle Accord. Meanwhile,the Working Group on Financial Markets continued todiscuss the development of the continuous-linkedsettlement system for foreign exchange and itsimplications for central bank market operations andreserves management in the region. The major themesin EMEAP’s discussions in 2001 included promotingfinancial stability; focusing on progress and challenges;and asset prices and central bank policy.
A related development was the establishment of theAsian Consultative Council (ACC) of the BIS in March
2001, comprising all Governors of the EMEAP centralbanks in the BIS, including Malaysia. The ACCprovides a vehicle for communication between theAsian and Pacific members of the BIS and the Boardand Management of the BIS on matters of interestand concern to the Asian central banking community.Its inaugural meeting was held in Basel in June 2001.
Manila Framework GroupThe Manila Framework Group (MFG) of Finance andCentral Bank Deputies met twice in 2001, in Beijingon 27-28 March, and in Auckland on 4-5December, to review economic developments in theAsia-Pacific region and discuss relevant policy issues.On regional surveillance, the Group recognised thatthe prevailing weak global economy hadheightened the need for members to maintainsupportive macroeconomic policies and strongstructural policies to facilitate a return to growth,stability and poverty reduction. In view of theevents of 11 September, the Group agreed tosupport the Group of 20 Action Plan on TerroristFinancing and committed to implement steps in thePlan by February 2002.
The Group also discussed the report of the Task Forceof the MFG Financing Arrangement, with emphasison the possible principles to govern the operation ofa co-operative financing arrangement, as proposed in
the Manila Framework in 1997. The Group agreedthat any MFG financing arrangement would involvebilateral financing in support of IMF programmeson a case-by-case basis and that participation wouldbe voluntary. These issues would be revisited by theGroup to ensure its continued suitability to membersof the Group in terms of principles and modalitiesgoverning the financing arrangement.
Asia-Pacific Economic Co-operation Under the theme “Growth with Restructuring,Stability and Equity”, the Finance Ministers of APECmet in Suzhou, People’s Republic of Chinaon 8-9 September 2001 and focused their attentionon the policy challenges faced by APEC economiesin promoting sustainable economic growth andfinancial stability in the region. Finance Ministers
Discussions at the regional level (EMEAP, APEC, MFG and the ACCof the BIS) focused on macroeconomic policy options to managethe global economic slowdown. Collaborative work by workinggroups contributed to domestic capacity building among members.

200
agreed that wide-ranging structural reforms wereessential to strengthen the foundation formacroeconomic stability and sustainable improvementin living standards. APEC members also maintainedtheir collaborative efforts under various APECinitiatives during the year. In addition, to ensure thatAPEC kept abreast with emerging economic andfinancial challenges, Ministers also endorsed theStrategic Review of the APEC Finance Ministers’Process. The Strategic Review provided a newframework that would anchor the work undertakenin the finance process so as to complement APEC’soverall vision. The new framework took intoconsideration APEC’s unique characteristics,comparative advantages and limitations, such as thediversity of APEC’s membership, voluntary nature ofeconomies’ involvement and limitations on resourcesto develop policy initiatives.
As part of the collaborative effort, BNM continued toparticipate in APEC work programmes conductedunder the various initiatives. These work programmesincluded core group activities; policy dialogues; andtraining programmes. In this regard, BNM participatedin policy dialogues on banking supervision; and bank
failure management; as well as in trainingprogrammes organised under the FinancialRegulators’ Training Initiative. BNM also participatedin the APEC Working Group on Electronic FinancialTransactions Systems and the Working Group onFighting Financial Crimes.
Group of 15The 11th Summit of the Heads of State andGovernment of the Group of 15 (G-15) was held inJakarta, Indonesia on 30-31 May 2001. At theSummit, members expressed concern over the lackof progress in IFA reforms, which was vital ineffectively addressing the risks and challengesposed by globalisation. In order to sustain andaccelerate the reform effort, G-15 members agreedwith Malaysia’s proposal to establish an ExpertGroup on the Reform of the IFA. The Expert Grouphad been tasked to assess the progress of thecurrent work on IFA reform, and makerecommendations to address the concerns andinterests of developing countries, particularly that ofthe G-15. The establishment of the Expert Groupwould serve as a means by which the views of theG-15 members would be presented at the various
APEC Meetings in 2001
I. APEC Finance and Central Bank Deputies’ Meeting, 1 May, Washington D.C., United States of America 6-7 September, Suzhou, People’s Republic of China
II. 8th APEC Finance Ministers’ Meeting, 8-9 September, Suzhou, People’s Republic of China
Issues Discussed• Macroeconomic Challenges and Policy Responses
In view of the less favourable global economic environment, APEC stressed the importance for the international community to take the appropriate policy actions to facilitate an early recovery in global economic activities. APEC affirmed its commitment to enhance macroeconomic policy dialogue and co-operation in managing the economic difficulties faced by member economies and to build a strongfoundation for sustained and broad-based growth in the region. In addition, APEC emphasised the importance of continuing domestic structural reforms to enhance the ability to respond to economic and financial shocks.
On the trends in globalisation, APEC stressed the need for appropriate policies and framework to be in place to enable all member economies to benefit from the process of increased economic and financial integration.
• Strengthening the International Financial SystemAPEC welcomed current steps taken to reform the IFA and urged continued implementation of the reforms. Although APEC endorsed the implementation of international standards and codes, it was emphasised that the implementation and assessment of compliance with these standards and codes need to take into account individual country circumstances and institutional capacity.

External Relations
201
international fora. The Expert Group held itsmeeting in Kuala Lumpur on 26 February 2002.
Asia-Europe Meeting Subsequent to the 3rd Asia-Europe Meeting (ASEM)Finance Ministers’ Meeting which was held in Japanin January 2001, an ASEM Core Group Meeting washeld in Washington D.C., United States on13-14 April 2001. During the meeting, ASEMmembers reviewed the progress of on-going ASEMactivities such as the Kobe Research Project, ASEMTrust Fund II and ASEM Anti-Money LaunderingInitiative. In addition, ASEM members were updatedon recent initiatives in regional co-operation in Asiaand Europe. On the progress of regional co-operationin Asia, Malaysia updated ASEM members on thestatus of the CMI, that consisted of the expandedASEAN Swap Arrangement and the Bilateral SwapArrangement. Malaysia also informed the Meeting ondevelopments in the ASEAN surveillance process. Thenext ASEM Finance Ministers’ Meeting is scheduledto be held in Copenhagen, Denmark on 5-6 July2002. The ASEM Leaders’ Summit, which is held on abiennial basis, will also take place in Copenhagen,Denmark on 22-24 September 2002.
Asia/Pacific Group on Money Laundering International initiatives against money laundering,which were started more than a decade ago byinternational bodies and task forces, have intensifiedin recent months. In 2001, efforts to combat moneylaundering were stepped up after the 11 September2001 events. Malaysia has actively supported regionaland international efforts in fighting moneylaundering. Malaysia enacted the Anti-MoneyLaundering Act 2001, which came into force on 15January 2002. The initiative to put this Act in placecommenced with the formulation of the conceptpaper in October 2000, and the Act was gazetted aslaw on 5 July 2001. The Act criminalises moneylaundering and provides for related enforcementpowers; imposes customer identification, record-keeping and reporting requirements; and mandatesthe competent authority to receive, analyse anddisseminate financial intelligence relating to moneylaundering activities. For the purpose of carrying outits functions under the Act, BNM has established anew department in 2001 called the FinancialIntelligence Unit to implement measures for theprevention and detection of money laundering.
Malaysia became a member of the Asia/Pacific Groupon Money Laundering (APG) on 31 May 2000. TheAPG was formally established in February 1997 at the
4th Asia/Pacific Money Laundering Symposium inBangkok. The APG Secretariat is based in Sydney. Itsmission is “to provide a co-operative regional solutionto the global problem of money laundering”. TheAPG’s principal strategy is to facilitate the adoption,implementation and enforcement of internationallyaccepted anti-money laundering standards in the legal,financial and law enforcement sectors and to usemutual evaluations to encourage member compliance.
Malaysia together with Australia are the currentco-chairs of the APG. The co-chair arrangement is fora 2-year period, ending in mid-2002. BNM was thelead agency representing Malaysia at the APG, and asco-chair, assisted the APG Secretariat in preparing forits meetings. During the year, BNM was involved inorganising the 4th APG Annual General Meeting inKuala Lumpur (22-24 May 2001). The meeting wasthe largest APG meeting held to-date, attracting morethan 200 attendees, representing 38 jurisdictions, and13 international and regional bodies. Three newjurisdictions, namely, the Cook Islands, Macau andNiue, were admitted as APG members at themeeting, bringing the APG’s total membership to 22.The APG also included eight observer jurisdictions.The 4th APG meeting discussed:
• Four mutual evaluation reports on member jurisdictions;
• Current and future typologies workshops on money laundering methods and counter measures;
• International and regional co-operation; and• Global anti-money laundering initiatives.
In accordance with the APG membership, memberjurisdictions commit themselves to participate inmutual evaluations. The mutual evaluation processgives recognition when standard benchmarks are met,and identifies the areas for improvement. Malaysiawas evaluated by the APG during the year. The APGand the Offshore Group of Banking Supervisors jointlyevaluated the Labuan IOFC separately as an offshoreregime (2-6 April 2001). The APG also evaluatedMalaysia’s anti-money laundering programmeon 9-12 July 2001. The evaluators met the variousgovernment agencies and financial institutions inMalaysia during their mission. The mutual evaluationreport on Malaysia will be presented for discussionand acceptance at the 5th APG Annual Meetingin June 2002.
During the year, Malaysia participated in the APG’sMutual Evaluation Training Workshop in Bangkokand the Money Laundering Methods Typologies

202
Workshop in Singapore. Malaysia also became amember of the APG Working Group on InformationSharing. The primary objective of this WorkingGroup was to make recommendations for improvingthe efficiency and effectiveness of informationsharing between jurisdictions, in terms of accuracy,timeliness and reciprocity.
BILATERAL CO-OPERATION
Bilateral Payments ArrangementDuring the year, BNM continued to promote theBilateral Payments Arrangement (BPA) as part ofMalaysia’s effort to diversify its export markets and toenhance bilateral trade with other developing countries.
BNM also participated in a review on the Palm OilCredit and Payments Arrangement (POCPA), which wasunder the purview of the Ministry of Primary Industries.The review was conducted in the wake of an over-supply situation in the palm oil industry, which resultedin historically low prices for palm oil. To promote thePOCPA scheme, the counter trade arrangement wasintroduced as an alternative to cash settlement. Inaddition, the new POCPA credit would be offered on arevolving basis for three years, during which therecipient country could roll over the credit uponrepayment within a stipulated period of time.
BNM Technical Assistance and Information ExchangeIn 2001, BNM continued to actively promote closerco-operation with other central banks and monetaryauthorities, as well as with foreign public and privatesector institutions in line with the Bank’s policy toshare its experience and interact with interestedparties.
During the year, BNM received 58 foreign delegationsfor discussions, study visits and attachmentprogrammes. The delegations were from thecentral banks, government agencies and other publicand private sector organisations of Africa, Asia,Europe, North America and Oceania. Interest wasfocused on various aspects of central banking,including investment and treasury operations,
payment system, monetary and financial policy, bankregulation, bank supervision, information technology,exchange control, currency management andoperations, human resource management andtraining and Islamic banking.
In May 2001, BNM launched a two-year Technicaland Training Arrangement Programme, at therequest of the State Bank of Pakistan. Funding forthe programme was provided by the AsianDevelopment Bank. The programme included anattachment arrangement for officials of the StateBank of Pakistan in Kuala Lumpur.
Sixteen participants from the central banks of theAfrican, Asian, European and North Americancontinents joined mid-level BNM officers for the20th Central Banking Course conducted by BNMin Kuala Lumpur on 10-29 September 2001.Financing for the participants was provided underthe Malaysian Technical Co-operation Programme.To date, a total of 166 participants from 64 foreigncentral banks had attended this programme. Thecourse, covering topics such as monetary andfinancial policy formulation and the role of thecentral bank in regulating the financial system, wasstructured to prepare officers for their career ascentral bankers. At the end of the programme,participants are expected to have gained a broaderperspective beyond their own areas of work.
In 2001, BNM hosted three annual bilateralmeetings in Kuala Lumpur, with the Bank of Thailand,the Hong Kong Monetary Authority and theMonetary Authority of Singapore. These bilateralmeetings were considered important as they providedan opportunity for an exchange of views and sharingof experiences at a closer level. The meetingscontributed to the strengthening of co-operation andties between BNM and the other central banks.Among the issues discussed at these meetings werethe implications of the recent global economicdevelopments; policy strategies and common risks inmacro-economic management; exchange ratedevelopments; performance of the banking system;and risk management.

Organisation andPersonnel
204-206 Organisational Development and Human Resource Management
206-208 Risk Management in Bank Negara Malaysia

ORGANISATIONAL DEVELOPMENT & HUMAN RESOURCE MANAGEMENT
The year 2001 witnessed significant advancement inthe efforts to develop the capacity and capabilitiesof the Bank as an organisation to be in a positionto respond effectively to a changing environment.A key development is the process ofinstitutionalising knowledge management (KM)concepts and practices that will ensure the Bank’sdecision-making capabilities are more than able tomeet new challenges. As part of thisdevelopment, the Bank’s human resourcemanagement policies and practices were revampedto reflect the changing needs of a forward-lookingknowledge based organisation (KBO). Significantinvestments were also made in upgrading theinformation and communication technology (ICT)infrastructure and processes to promote operationalefficiency as well as to support the Bank’s growingneed for information and knowledge. Finally,changes were also made to the reporting structureto promote greater operational effectiveness andefficiency in executing the Bank’s role andfunctions.
In line with these initiatives, three new departmentswere created to discharge the Bank’s newresponsibilities. These departments were theDevelopment Financial Institution RegulationDepartment, the Financial Intelligence Unit (FIU) andthe Corporate Communications Department (CCD).The Development Financial Institution RegulationDepartment will serve as a one-stop centre toformulate policies, process applications and handlestrategic operational issues for developmentfinancial institutions (DFI) and ensure the orderlydevelopment of the DFI sector in Malaysiaparticularly in promoting the efficiency andsoundness of the sector. The FIU will be responsiblefor facilitating the implementation and enforcementof the Anti-Money Laundering Act (AMLA) 2001nationwide and co-operation with other countriesin the global fight against money laundering andserious financial crimes. The CCD on the otherhand, will be responsible for managing thecommunications and dissemination of informationon important areas of the Central Bank andfinancial developments and policies.
As part of the Bank’s continuous efforts to maintaina cadre of talented officers and managers, thehuman resource practices are periodicallybenchmarked against other leading world classorganisations. The year 2001 saw the introductionof several bold and highly innovative policies.These policies reflected the changes in both staffcomposition as well as expectations within theBank. The Bank now has a rapidly growing pool ofyoung, highly skilled and dynamic officers. It isreflected in the BNM Flex Plan, which forms thenew compensation scheme effective 1 March 2002.The BNM Flex Plan is a benefits plan that providesstaff the choice and flexibility to customise selectedbenefits that takes into account the changing anddiverse individual needs throughout the differentstages of their career path in the Bank.
To develop the next generation of managers andleaders, a comprehensive Mentoring Programme wasalso introduced during the year. The programmewas launched on 10 January 2002. Mentoring aimsto nurture future leaders in the Bank and enhancestaff personal development. The relationships thatare built through mentoring will also help inpreserving many of the time honoured values andbeliefs that have been the foundations of thisorganisation.
Organisational development efforts have also beengeared towards further improving performance. Inline with the changes taking place in the Bank, thePerformance Management System (a.k.a. PRIME -Performance Review in Managing Excellence) wasrefined to further improve its implementation andeffectiveness.
Changes were made to the PRIME system, theperformance appraisal system, designed to reflect theimportance of individual competencies for upwardmovements along a career path. Equally, the systemrecognises that performance is measured through theachievement of corporate goals. While short-termrewards are linked directly to achievement of goals,long term rewards are linked to development ofnecessary competencies. The Bank has introducedthe Staff Assistance Programme (ASSIST) tocomplement the performance management systemto ensure minimum expected performance targetsare being achieved.
204
Organisation and Personnel

Organisation and Personnel
205
The Bank also recognises talent through a formalRecognition Award. During the annual dinner heldon 8 September 2001, 6 winners received the bankwide Recognition Award for Excellent Performance,Teamwork, Quality Service, Leadership, Sports/Socialand Academic Achievement. The recognitionprogramme has also been extended down theorganisation to further nurture the culture ofexcellence at the departmental level in line with thespirit of empowerment.
The Bank has also enhanced its succession-planningprogramme to ensure continuity and availability ofexperienced and competent staff for key positions.The pool of possible successors has been enlarged,and a more comprehensive development programmecreated to equip the Bank’s future leaders with thenecessary skills and knowledge. The Bank is alsoimproving its Recruitment, Assessment andSelection process to meet its staffing requirementsfor the future.
The Board of Directors extends its deepestappreciation to all Bank staff for their continuoushard work, dedication and commitment in the year2001.
AwardsThe Board congratulates the Governor, Tan Sri Dato’Dr. Zeti Akhtar Aziz on being conferred the PingatPanglima Setia Mahkota (P.S.M) on the occasion ofthe birthday of His Majesty, the Yang di-PertuanAgong on 2 June 2001.
The Board extends its congratulations to DatukLatifah Merican Cheong on being conferred theDarjah Mulia Seri Melaka (D.M.S.M.) on theoccasion of the birthday of His Excellency, the Yangdi-Pertua Negeri Melaka on 13 October 2001.
The Board also congratulates Encik Hamzah bin AbuBakar on being conferred the Pingat Pekerti Terpilih(P.P.T.), Encik Nasaruddin bin Sulaiman,Puan V. Vijayaledchumy, Puan Azmah binti Abd Karimand Puan Alizah binti Ali on being conferred thePingat Jasa Kebaktian (P.J.K.) on the occasion ofthe birthday of His Royal Highness, the Sultan ofSelangor Darul Ehsan on 10 March 2001, Encik CheSab bin Ahmad on being conferred the KesatriaMangku Negara (K.M.N.) on the occasion of thebirthday of His Majesty, the Yang di-Pertuan Agongon 2 June 2001 and Pingat Kelakuan Terpuji (P.K.T.)on the occasion of the birthday of His Excellency,the Yang di-Pertua Negeri Pulau Pinang on 14 July
2001, Puan Khalijah binti Hashim on beingconferred the Ahli Mangku Negara (A.M.N.) on theoccasion of the birthday of His Majesty, the Yangdi-Pertuan Agong on 2 June 2001, Puan Goh HooiChoo on being conferred the Pingat Bakti Setia(P.B.S.) on the occasion of the birthday of HisExcellency, the Yang di-Pertua Negeri Pulau Pinang on14 July 2001, Encik John Teo and Encik Mukhtar binYusof on being conferred the Pingat JasaKebaktian (P.J.K.) on the occasion of the birthday ofHis Royal Highness, the Sultan of Terengganu DarulIman on 20 July 2001 and Encik Aziz @ Abdul Azizbin Abdul Manaf on being conferred the Darjah SeriMelaka (D.S.M.) on the occasion of the birthday ofHis Excellency, the Yang di-Pertua Negeri Melaka on13 October 2001.
RetirementThe Board wishes to place on record its appreciationand gratitude to the 28 retirees who have renderedloyal and dedicated service to the Bank. The staff whoretired from the services of the Bank in 2001 arelisted in Table 6.1.
ManpowerThe Bank’s staff strength as at 31 December 2001was 2049. This staff strength represents staff in theHead Office, six branches in Pulau Pinang, JohorBahru, Kota Kinabalu, Kuching, Kuala Terengganuand Shah Alam, the representative offices in Londonand New York and the Human Resource DevelopmentCentre (HRDC) in Petaling Jaya.
Staff TrainingThe main objective of the staff training programs in2001 was to close the performance gaps of staff.Training and learning interventions therefore focusedon building upon existing skills to enhance capacityfor sound diagnostic and implementation skills inorder to fulfill the functions of the Bank with greatereffectiveness. In this regard, the HRDC implementedseveral new initiatives aimed at ensuring that thetraining programs lead to higher levels ofperformance. These initiatives include:
• The development of a comprehensive Structured Modular Program for the Bank’s core competencies. The Bank identified these competencies as the minimum management skills required for all staff in order for them to function effectively in a K-driven economy. These competencies are part of the Bank’s performance assessment criteria, Performance Review in Managing Excellence (PRIME).

The skills included in this program address the various levels of competency requirements that are suitable for staff of various job ranks.
• The creation of a centralised Training and Development Committee. This Committee provides the guidance and focus for the overall goals and direction of training and learning taking place within the Bank.
• The carrying out of a comprehensive and systematic exercise in Training Needs Analysis (TNA) to more accurately gauge current and future staff training needs for technical skills. This, together with support from the Training and Development Committee, provided the basis to adjust training programmes to encompass specific requirements of line departments.
In closing the performance gaps of staff, efforts weremade to ensure that training and learninginterventions contributed towards expanding thetechnical and non-technical skills of staff to reinforcethe mission, objectives and shared values of the Bank.
In this environment, the bankwide trainingprogrammess organised by the HRDC in 2001 catered
to the development of core functional andmanagement skills. A total of 77 programs wasconducted by HRDC at a total training cost of RM1.4million. The focus of the training programs wascentred on upgrading functional skills and learning ofnew skills necessary to support the Bank’s policyformulation and supervisory role as well as strategicprojects of the Bank. Several of the projects wereundertaken to formulate strategies for the Bank toimplement its new mandates, including thesupervision and regulation of development financialinstitutions and the implementation of the Anti-Money Laundering Act. The HRDC also assisted inimplementing decentralised training, managed by linedepartments. Such training focused on buildingspecific technical skills to support each department’sfunctions and business goals. Total investments intraining managed by HRDC and the line departmentsamounted to RM5.2 million in 2001.
RISK MANAGEMENT IN BANK NEGARAMALAYSIA
In 2001, the Bank continued its efforts to enhance itsrisk management structure and practices, in line withits risk management policy issued in the previous year.The objective of the policy is to have in place soundpolicies and operations through the maintenance of
206
Table 6.1List of Retirees
No Name Department/Branch1 Datuk Dr. Awang Adek bin Hussin Governor’s Office2 Puan Zaini binti Osman Governor’s Office3 Puan Azizah binti Haji Talib Corporate Services Department4 Encik Juraimi bin Slamat Currency Management and Operation Department5 Encik Maraiah a/l Maradiah Currency Management and Operation Department6 Encik Shaari bin Mohd Shah Currency Management and Operation Department7 Encik Wan Ibrahim bin Embong Currency Management and Operation Department8 Encik Thangathurai a/l Kumaravelu Finance Department9 Cik Vijiah Ranjini Rethna Boi d/o E V Joseph Human Resource Development Centre10 Encik Chang Kum Weng IT Services Department11 Encik Sheikh Ismail bin S.M.Omar IT Services Department12 Puan Yim Siew Yean IT Services Department13 Encik Md Ghazali bin Kalam Payment Systems Department14 Encik Jamaludin bin Usoh PPPM Shah Alam15 Encik Maksom bin Kasan Widi Property and Services Department16 Encik Abdullah bin Ahmad Pulau Pinang Branch17 Encik Mohd. Zafarula Khan bin Mohd. Shariff Pulau Pinang Branch18 Encik Sabaruddin bin Said Pulau Pinang Branch19 Encik Abdul Halik bin Sarbini Security Department20 Encik Aladin bin Mohd Tahir Security Department21 Encik Baharom bin Yusof Security Department22 Encik Kasim bin Ahmad Security Department23 Encik Shahrudin bin Ahmad Security Department24 Encik Mohd. Kambar bin Mohd. Salleh Kota Kinabalu Branch25 Encik Abu Samah bin Abu Bakar Kuala Terengganu Branch26 Encik Ismail bin Abdullah Kuala Terengganu Branch27 Encik Mamat @ Ariffin bin Hj Mahmmud Kuala Terengganu Branch28 Encik Abas Anak Rebi Kuching Branch

Organisation and Personnel
207
safe, relevant and efficient work processes andprocedures; protection of its assets, including people;and the efficient use of resources. Information and itseffective communication are also key to theattainment of the policy objective.
Risk Management StructureDuring the year, the Bank set up the RiskManagement Committee (RMC) as the apex of therisk management governance structure. The RMC,comprising the executive management, addressesstrategic risk issues, oversees the management of riskthat has been delegated to the line departments anddrives the risk management work in the Bank. TheRMC assists the Board in discharging its governanceresponsibilities with respect to risk management.
The RMC, which meets at least once every quarter,provides a high level platform for a focusedconsideration and deliberation of all relevant issues onrisk management practices in the Bank. The RMCensures that there is regular upward reporting of riskissues and risk and control positions of thedepartments, as well as the downwardcommunication to departments to address existing orpotential risks.
Risk Management PracticesAs a measure to maintain the relevance and safety ofwork processes, departments are required to reportannually to Management a review of their processesand assessment of the state of their risks andcontrols. In the report, they are required to alsopropose action plans for the improvement of existingcontrols or the implementation of new ones. Inaddition, the requirement for reporting formalises theprocess for escalating potential risk issues toManagement.
From the line departments’ reports the RMU reportsits assessment on the state of risk and controls. Theobjective of the assessment is to ensure that the riskmanagement practices at the department level arenot only in place but are functioning. In 2001, toimprove the efficiency in monitoring of operationalrisk position of the Bank, the RMU also identified keyrisk indicators (KRIs) for monitoring. The purpose ofthe KRIs is to alert departments and Management ondirectional changes to operational safety andefficiency.
Financial RisksUndertaking its responsibilities in reservemanagement operation, the Bank is exposed to a
number of financial risks, which are credit, marketand operational risks. These risks are managed dailyby the Bank’s Middle Office, a unit that is separatefrom the dealing function, to ensure that the riskexposures remain within acceptable levels. In ensuringthat the Bank’s risk management effort in its reservemanagement operations remain relevant andeffective, the Middle Office carries out periodicreview of the existing operational procedures,investment guidelines and policies in relation tomarket developments to account for changesin risk factors.
a. Credit RisksThe Bank’s exposure to credit risk is kept to aminimum by stringent policies on high creditstandards required for the admission ofcounterparties, as well as, permissible investments,which are mainly limited to highly-rated governmentsecurities. Credit exposures are continuouslymonitored against limits approved in accordancewith the Bank’s credit policies. The Middle Officeperiodically reviews the adequacy of thecounterparties’ credit limits and its usage pattern toproactively manage counterparty exposures.Continuous effort is put in to achieve optimumdiversification and avoid concentration of risk inthe Bank’s exposure to counterparty credit riskthrough the rationalisation of limits and admissionof new qualified counterparties, whilst taking intoaccount the needs of the reserve managementoperations.
b. Market RisksIn managing its reserves, the Bank is guided by itsBenchmark policies, which incorporates the Bank’sobjectives of holding reserves and its risk tolerance.The benchmark allocations in terms of asset classes,currency mix and duration are periodically reviewed toensure that they continue to represent the optimalrisk/return trade-off whilst meeting the Bank’s reservemanagement objectives. A relative Value-At-Riskmeasure is used to quantify the excess market risk fordeviations from the Benchmark allocations to takeadvantage of expected changes in market conditions.Such deviations are made within the limits set by theBank’s Board. To enhance the Middle Office’s riskmanagement and performance measurementcapabilities, the Bank had in 2001 commenced theimplementation process of its new treasury system.With the enhanced system, the Bank’s benchmarkwould be maintained on-line in the treasury system toallow the dealers to conduct their analysis, stresstesting and track their current market risk exposure.

c. Operational RisksThe Middle Office works with the Back Office(which handles the settlement of trades andperforms the accounting function) to address theoperational risks arising from the Bank’s dealingactivities in a more comprehensive manner.Outstanding trades are tracked and irregularities inthe settlement of trades are studied in detail touncover weaknesses that may be attributed to theoperational procedures within the dealingoperations. As operational risks may arise directly orindirectly through inadequate controls, humanerrors and system malfunctions, it is vital that thesource of the operational risk is uncovered so thatappropriate action is taken to effectively eliminateminimise the recurrence of operational lapses.Operational lapses are formally tracked by theMiddle Office with detailed explanation on thecauses and recommendations for improvements inthe operational controls and procedures. Inaddition, statistics are maintained to track thedifferent type of operational errors to gaugewhether the new improved controls introduced areeffective. Statistics on errant counterparties thathave contributed to trade settlement problems arealso maintained to provide an input into the yearlycounterparty review exercise. With theimplementation of the Bank’s enhanced treasurysystem, existing controls and operational procedureswould be automated to further strengthen themanagement of operational risks in the Bank’sreserve management operations. To ensure thatadequate internal controls are in place, periodicreview of the existing workflow is undertaken.
Policy RisksIn improving the management of policy risks, the Bankrationalised the composition of the various policyworking groups and their terms of reference. To addressmore effectively the management of policy risks, activeformal and informal cross-functional consultations havebeen incorporated in the process of policy formulation.This process extends from policy design to post-implementation stage to enhance the prospect forpolicy objectives to be achieved.
Disaster Recovery Measures The backup facilities of the systems for trading,settlement and cheque clearing at the remote recoverycentre undergo regular and frequent testing. For themost critical systems, live runs are conducted to ensurepeople and system preparedness and data availability.The RMU continued to assess and report toManagement on the performance of the test and liveruns conducted at the remote Recovery Centre.
Inculcating a risk management cultureThe Bank continued to enhance the staff’sknowledge on risk and risk management conceptsand practices, to be well-informed on thedevelopments in the area. Seminars and courses, andsessions on risk management is a regular feature inthe Induction Programme for new recruits to informthem of the risk management approach andrequirements in the Bank and their role andresponsibilities in managing risks at work. Thecurrent risk management structure and practices inthe Bank have evolved to the present formalised andsystematic approach of managing risks.
208

209
BANK NEGARA MALAYSIAOrganisation Structure
BOARD OF DIRECTORS
Public Relations Adviser to GovernorZailah Tun Dr. Ismail
DEPUTY GOVERNORDato’ Mohd Salleh bin Haji Harun
GOVERNORDr. Zeti Akhtar Aziz
Internal AuditYahaya bin Haji Besah
DEPUTY GOVERNORDato’ Huang Sin Cheng
Monetary and Financial PolicyIsmail bin Alowi
EconomicsV. Vijayaledchumy
InternationalTan Sook Peng
Foreign Exchange Administration Mahdi bin Mohd. Ariffin
Investment Operations and Financial MarketMuhammad bin Ibrahim
New York Rep. Office
London Rep. Office
FinanceAbdul Aziz bin Abdul Manaf
LegalGopala Krishnan Sundaram
Corporate ServicesMohd Nor bin Mashor
SecurityChe Norudin bin Che Alli
IT ServicesHong Yang Sing
Human Resource ManagementMainor bin Awang
Strategic PlanningMior Mohd Zain bin Mior Mohd Tahir
Human Resource Development CentreLim Lai Hong
Payment SystemsAhmad Hizzad bin Baharuddin
Property and ServicesZulkifli bin Abd Rahman
ASSISTANT GOVERNORSUPERVISION
Datuk Zamani bin Abdul Ghani
Bank Supervision IAzizan bin Haji Abd Rahman
Bank Supervision IIDonald Joshua Jaganathan
Information Systems SupervisionRamli bin Saad
Insurance SupervisionWong Yew Sen
Bank RegulationNor Shamsiah binti Mohd Yunus
Insurance RegulationZakaria bin Ismail
Risk ManagementTeo Kee Tian
Islamic Banking and TakafulBakarudin bin Ishak
Special InvestigationChe Sab bin Ahmad
ASSISTANT GOVERNORORGANISATIONAL DEVELOPMENT
Dato’ Mohamad Daud bin Hj. Dol Moin
ASSISTANT GOVERNORINVESTMENT AND OPERATIONS
Vacant
ASSISTANT GOVERNORECONOMICS
Datuk Latifah Merican Cheong
ASSISTANT GOVERNORREGULATION
Mohd Razif bin Abd Kadir
Statistical ServicesChan Yan Kit
Corporate CommunicationsVacant
Secretary to the BoardMohd Nor bin Mashor
Financial IntelligenceKoid Swee Lian
Currency Management and OperationsHor Weng Keng
Branches (6)
DFI RegulationChe Zakiah binti Che Din

Annual Accounts
Balance Sheet as at 31 December 2001

212

213
CERTIFICATE OF THE AUDITOR GENERAL ON THE FINANCIAL STATEMENTS OF BANK NEGARA MALAYSIA
FOR THE YEAR ENDED 31 DECEMBER 2001
I have audited the Balance Sheet of Bank Negara Malaysia as at 31 December 2001 and the Profit and LossAppropriation Account for the year then ended. These financial statements are the responsibility of themanagement of Bank Negara Malaysia. My responsibility is to express an opinion on these financial statementsbased on my audit.
2. I conducted my audit in accordance with the Audit Act 1957 and in accordance with InternationalStandards on Auditing. These standards require an audit be planned and undertaken to obtain reasonableassurance that the financial statements are free of material misstatement. The audit includes examining on atest basis, evidence supporting the amounts and disclosures in the financial statements. It also includesassessment of the accounting principles used as well as evaluating the overall presentation of the financialstatements.
3. In my opinion, the financial statements give a true and fair view of the state of financial affairs of BankNegara Malaysia as at 31 December 2001 and of the results of its operations for the year then ended.
(DATUK DR. HADENAN BIN ABDUL JALIL)AUDITOR GENERAL
PUTRAJAYA14 MARCH 2002

214
STATEMENT BY DIRECTORS
We, Zeti Akhtar Aziz and Datuk Oh Siew Nam, being the Chairman and one of the Directors of Bank NegaraMalaysia, do hereby state that in the opinion of the Board, the accompanying Balance Sheet and Profit andLoss Appropriation Account together with the Notes thereto, are drawn up so as to give a true and fair view ofthe state of affairs of Bank Negara Malaysia as at 31 December 2001 and of the results of operations for theyear ended on that date.
On behalf of the Board, On behalf of the Board,
ZETI AKHTAR AZIZ
CHAIRMAN
8 MARCH 2002KUALA LUMPUR
DATUK OH SIEW NAM
DIRECTOR
8 MARCH 2002KUALA LUMPUR

215
DECLARATION BY THE OFFICER PRIMARILY RESPONSIBLE FORTHE FINANCIAL STATEMENTS OF BANK NEGARA MALAYSIA
I, Abdul Aziz Abdul Manaf, being the officer primarily responsible for the financial statements of Bank NegaraMalaysia, do solemnly and sincerely declare that the accompanying Balance Sheet and Profit and LossAppropriation Account together with the Notes thereto, are to the best of my knowledge and belief, correctand I make this solemn declaration conscientiously believing the same to be true, and by virtue of theprovisions of the Statutory Declarations Act, 1960.
Subscribed and solemnly declared )by the abovenamed at Kuala Lumpur )this 8th day of March 2002. )
Before me,

216
Bank Negara Malaysia
Balance Sheet as at 31 December 2001
2001 2000RM RM
LIABILITIES Note
Authorised Capital RM200,000,000Paid-up Capital 2 100,000,000 100,000,000 General Reserve Fund 3 5,067,022,733 4,860,967,368 Other Reserves 4 18,353,074,749 22,502,935,935 Currency in Circulation 25,385,434,696 26,708,936,975 Deposits:
Commercial Banks, Finance Companiesand Merchant Banks 54,655,303,228 58,153,159,586
Federal Government 25,236,916,020 17,845,321,152 Others 5 10,642,678,946 9,187,717,327
Bank Negara Papers 7,477,409,483 7,084,962,648 Allocation of Special Drawing Rights 6 664,034,013 688,434,713 Other Liabilities 2,096,375,475 1,775,697,797
149,678,249,343 148,908,133,501
Profit and Loss Appropriation Account for the Year Ended 31 December 2001
2001 2000RM RM
Transfer to General Reserve Fund 206,055,365 368,368,818Amount Payable to Federal Government 500,000,000 1,000,000,000
706,055,365 1,368,368,818
Notes on the following pages form part of these accounts.

Annual Accounts
217
2001 2000RM RM
ASSETS Note
Gold and Foreign Exchange 7 113,542,290,653 109,835,487,903 International Monetary Fund Reserve Position 3,193,521,377 3,310,871,020 Holdings of Special Drawing Rights 487,814,793 418,681,635 Malaysian Government Papers 8 280,689,715 125,513,697 Deposits with Financial Institutions 1,193,115,000 1,615,727,000 Loans and Advances 8,934,922,674 8,712,001,856 Deferred Expenditure 9 1,141,441,833 1,712,162,748 Other Assets 10 20,904,453,298 23,177,687,642
149,678,249,343 148,908,133,501
2001 2000RM RM
Net Profit 706,055,365 1,368,368,818
706,055,365 1,368,368,818

218
1. Accounting Policies
(a) Gold, Securities and InvestmentsGold, securities and investments are stated at cost and provisions have been made for diminution in value as at 31 December 2001.
(b) Foreign Currency TranslationAssets and liabilities in foreign currencies have been revalued into ringgit at rates of exchange ruling on the balance sheet date. Transactions in foreign currencies during the year have been translated into ringgit at rates of exchange ruling on value dates.
The US dollar equivalent of the International Reserves comprising Gold and Foreign Exchange, International Monetary Fund Reserve Position and Holdings of Special Drawing Rights at 31 December 2001 was US$30,848.3 million.
2. Paid-up CapitalThe entire issued and paid-up capital of RM100 million is owned by the Government of Malaysia.
3. General Reserve Fund
2001 2000RM RM
As at 1 January 4,860,967,368 4,492,598,550Net Profit 206,055,365 368,368,818
As at 31 December 5,067,022,733 4,860,967,368
4. Other ReservesOther reserves comprise the Exchange Rate Fluctuation Reserve and the Contingency Reserve.
5. Deposits - OthersA substantial part of these deposits comprises deposits from Federal Statutory Authorities.
6. Allocation of Special Drawing RightsInternational Monetary Fund (IMF) member countries are allocated Special Drawing Rights (SDR) in proportion to their subscriptions to the IMF. The allocation represents a dormant liability of the Bank to the IMF, against which assets are received in SDR from the IMF. The net cumulative of the allocation in SDR amounted to SDR139,048,000.
Notes To The Accounts - 31 December 2001

Annual Accounts
219
7. Gold and Foreign Exchange
2001 2000RM RM
Foreign Securities 73,906,519,326 49,430,594,309Foreign Deposits 22,979,839,902 32,481,791,188Balances with Other Central Banks, Bank
for International Settlements (BIS) and IMF 7,584,696,571 18,244,301,173Others 9,071,234,854 9,678,801,233
113,542,290,653 109,835,487,903
8. Malaysian Government Papers
2001 2000RM RM
Malaysian Government Securities 32,419,715 84,353,697Government Investment Certificates 248,270,000 41,160,000
280,689,715 125,513,697
9. Deferred ExpenditureThis represents the net deficiency arising from foreign exchange transactions in 1993. The Government has undertaken to make good this deficiency as and when required to do so by the Bank. The amount outstanding is being amortised over a period of 10 years, beginning from 1994.
10. Other AssetsOther assets include investments in shares and bonds of RM20,788,824,243 acquired under section 30(1)(j) and section 30(1)(oo)(i) of the Central Bank of Malaysia Act 1958 (Revised - 1994).
11. Contingent LiabilitiesTotal contingent liabilities as at 31 December 2001 amounted to RM4,280,564,633. These comprise:-
(a) an amount of RM4,225,348,536 which represents the obligation of the Bank to pay in full, in SDR or other convertible currencies, the amount of Malaysia’s quota in the IMF under the Articles of Agreement; and
(b) an amount of RM55,216,097 which represents the uncalled portion of the 3,000 units of shares held by the Bank in BIS. The amount is based on the nominal value (in gold francs) of the uncalled portion and gold price as at the balance sheet date.