letter - university of chicago
TRANSCRIPT

Letterhttps://doi.org/10.1038/s41586-018-0131-1
Rapid emergence of subaerial landmasses and onset of a modern hydrologic cycle 2.5 billion years agoI. N. Bindeman1*, D. O. Zakharov1, J. Palandri1, N. D. Greber2, N. Dauphas3, G. J. retallack1, A. Hofmann4, J. S. Lackey5 & A. Bekker4,6
The history of the growth of continental crust is uncertain, and several different models that involve a gradual, decelerating, or stepwise process have been proposed1–4. Even more uncertain is the timing and the secular trend of the emergence of most landmasses above the sea (subaerial landmasses), with estimates ranging from about one billion to three billion years ago5–7. The area of emerged crust influences global climate feedbacks and the supply of nutrients to the oceans8, and therefore connects Earth’s crustal evolution to surface environmental conditions9–11. Here we use the triple-oxygen-isotope composition of shales from all continents, spanning 3.7 billion years, to provide constraints on the emergence of continents over time. Our measurements show a stepwise total decrease of 0.08 per mille in the average triple-oxygen-isotope value of shales across the Archaean–Proterozoic boundary. We suggest that our data are best explained by a shift in the nature of water–rock interactions, from near-coastal in the Archaean era to predominantly continental in the Proterozoic, accompanied by a decrease in average surface temperatures. We propose that this shift may have coincided with the onset of a modern hydrological cycle owing to the rapid emergence of continental crust with near-modern average elevation and aerial extent roughly 2.5 billion years ago.
Changes in Earth’s surface environments between about 2.5 billion years ago (2.5 Gyr ago) and 2.32 Gyr ago are recorded in numerous isotopic and elemental systems, which point to a dramatic change in the oxygenation of the atmosphere and oceans at that time9,10. These changes were associated with a series of three to four ‘Snowball Earth’ glaciations11,12, whose origin and driving forces are still debated. The major geochemical and biogeochemical rearrangements in Earth’s surface environments at the Archaean–Proterozoic boundary (2.5 Gyr ago) also left numerous signatures in the geological record. Among these signatures is a steep rise in the oxygen isotopic 18O/16O ratio (expressed as δ18O, the deviation in the ratio in per mille rela-tive to the standard ratio in modern seawater, VSMOW) of shales and zircons in the Late Archaean, followed by a progressively decelerating increase in these values into the Phanerozoic13,14. This first-order trend was modulated by the assembly and break-up of supercontinents14. However, it is unclear how these changes in δ18O (as well as other parameters) relate to the isotopic evolution of continental crust, to the evolution of meteoric water, or to weathering conditions at Earth’s surface.
We present here triple-oxygen-isotope measurements of shales, which are the dominant sedimentary rocks on Earth and the prod-ucts of the chemical and physical weathering of landmasses that are exposed to the atmosphere. Shales consist mainly of clay minerals, secondary quartz and unmodified detrital minerals; studies of shales have been used previously to constrain the chemical evolution of Earth’s crust through time1,3,8,15,16. The triple-oxygen-isotope composition of shales is expressed here as δ′18O and Δ′17O values; the latter para-meter reflects linearized deviations in per mille (‰) of 17O/16O ratios relative to a mass-dependent 17O/16O versus 18O/16O fractionation
line with a reference slope of 0.5305 (see Fig. 1 and Supplementary Information section ‘Methods’ for details). Both parameters are inde-pendent functions of temperature and oxygen-isotope variations and fractionation processes in surface environments17–19.
The δ′18O–Δ′17O signature of bulk shales is defined by: first, the proportions of detrital versus authigenic mineral components; second, the temperature of weathering and diagenesis, which affects isotopic fractionation factors; and third, the isotopic composition of the altering water (Fig. 1). Although used extensively in the past, 18O/16O ratios alone14,20,21 are insufficient for disentangling the impact of these various processes on the shale composition. However, as we show here, the combined use of δ′18O and Δ′17O removes the ambiguities associated with using δ′18O alone, and allows us to reconstruct past surface conditions and the composition of meteoric waters involved in weathering.
The shale samples used here are the same as those used previously14, with the addition of 30 composite samples (formation-averaged) and 10 individual recent and Archaean samples (Fig. 1, Extended Data Tables 1–3). These 278 samples were collected from outcrops and drill holes on all continents and span 3.7 Gyr. The measured δ18O values agree with previously determined values for shales and other sediment types and detrital zircons (Fig. 2)7,13,14,16. The bulk shales cover a large field in the δ′18O–Δ′17O space (Fig. 1). The observed Δ′17O values range from those typical of mantle and crust (−0.05‰ to −0.09‰)18,22 to −0.3‰. Furthermore, the triple-oxygen-isotope data of shales fall on different mass-dependent fractionation lines, with slopes between the 18O/16O and 17O/16O ratios ranging from 0.529 to 0.516 (Fig. 1, Supplementary Information)—values that encompass the entire range of slopes described previously for mass-dependent processes on Earth22.
Our results confirm a gradual trend of increasing δ′18O values from 3.7 Gyr ago towards modern times. Meanwhile, the Δ′17O values of shales exhibit a stepwise shift to more negative and more diverse values during and after the Archaean–Proterozoic transition (Fig. 2a). Shales older than 2.5 Gyr define an average Δ′17O value of −0.047‰ ± 0.012‰ (±2σ), while shales younger than 2.2 Gyr—deposited in later stages and after the Great Oxidation Event (GOE) roughly 2.32 Gyr ago, during which O2 appeared in the atmosphere—yield an average Δ′17O value of −0.118‰ ± 0.024‰. This difference in the triple-oxygen- isotope composition of the two age groups cannot be explained solely by different equilibration temperatures, or by the mixing of different proportions of variably weathered detrital materials, as the shale record cuts across the δ′18O–Δ′17O trends defined by these processes (Fig. 1), requiring different initial δ′18O meteoric waters. Moreover, there is no difference in the chemical index of alteration (CIA23) or in the pro-portions of minerals (determined by X-ray diffraction, XRD) of the studied shales across the GOE (Extended Data Table 2, Fig. 2) that could explain the observed shift in the Δ′17O values of the shales. The invariable titanium-isotope values8 and constant characteristic elemen-tal ratios of the studied shales14 (Extended Data Fig. 1) suggest that
1Department of Earth Sciences, University of Oregon, Eugene, OR, USA. 2Department of Earth Sciences, University of Geneva, Geneva, Switzerland. 3Origins Laboratory, Department of the Geophysical Sciences and Enrico Fermi Institute, The University of Chicago, Chicago, IL, USA. 4Department of Geology, University of Johannesburg, Auckland Park, South Africa. 5Department of Geology, Pomona College, Claremont, CA, USA. 6Department of Earth Sciences, University of California, Riverside, CA, USA. *e-mail: [email protected]
2 4 M A Y 2 0 1 8 | V O L 5 5 7 | N A t U r e | 5 4 5© 2018 Macmillan Publishers Limited, part of Springer Nature. All rights reserved.

LetterreSeArCH
the parental, atmospherically exposed continental crust undergoing weathering was similar in chemical composition to the modern crust, and has had similar proportions of mafic and felsic rocks since at least 3.5 Gyr ago, with a greater contribution of komatiites in the Archaean8,16. Higher-temperature Archaean oceans24, or a greater contribution of hydrothermal clays to Archaean shales, would result in less-positive δ′18O and less-negative Δ′17O values. Although this could help to explain the lower δ′18O values that we observe24, it cannot explain the vertically extending trend of lower Δ′17O values (Fig. 1, Extended Data Fig. 2) or the step change in Δ′17O values 2.5 Gyr ago (Fig. 2). In addition, our shales show no geological or mineralogical evidence for a substantial change in hydrothermal contribution or weathering inten-sity in the CIA parameter across the Archaean–Proterozoic boundary14. Taking a cue from the modern world, where meteoric water shows variable δ′18O–Δ′17O compositions17, the simplest explanation for some of the oxygen-isotope variations measured in ancient shales is that they were in part inherited from the waters involved in rock alteration on the continents.
We applied recently established isotope-fractionation factors for 18O/16O and 17O/16O between quartz and water at different temperatures19 to transform our measured, raw δ′18O–Δ′17O data for shales into actual surface weathering conditions. We also calculated the equilibrium fractionation of oxygen isotopes between bulk shale and water, at different temperatures and initial δ′18O–Δ′17O water values along the meteoric water line (MWL; Fig. 1, Extended Data Figs. 3–5). Oxygen-isotope fractionation between clay minerals and water under low temperatures is less than that for water and secondary quartz20, but the two mineral/water pairs follow the same fractionation law (ref. 18; see also Supplementary Information and Extended Data Fig. 6). The bulk shale/water fractionation lines (blue curves in Fig. 1a) define a negative slope in δ′18O–Δ′17O space. Mixing detrital material derived from the continental crust with authigenic minerals follows a subparallel curve (grey line in Fig. 1a) within the field defined by the isotope-fractionation curves. The calculation shows that variations in temperature, in the initial oxygen-isotope composition of altering waters, and in mixing ratios between detrital material and weathering
products can explain the overall trend and negative co-variations in our data.
The proportion of weathering products in a shale can be assessed independently via its mineralogical composition (through XRD) and/or its chemical composition (such as through the CIA23). Combining this estimate with the δ′18O and Δ′17O values of the shales and the pristine detrital components (igneous rocks) allows us to calculate, by mass balance, the δ′18O and Δ′17O values of the weathering products (Extended Data Fig. 3). The CIA index has remained nearly constant through time14 (Extended Data Fig. 7), suggesting that a secular trend in weathering intensity is unlikely to introduce a systematic bias in this approach. The equations for isotopic fractionation during water–rock interactions and the equation of the MWL in δ′18O–Δ′17O space (Fig. 1) can be used to independently calculate the water–rock interaction temperature and the oxygen- isotopic composition (δ′18OW and Δ′17OW) of waters involved in weathering and diagenesis (Extended Data Figs. 3, 4). This approach is likely to be oversimplified, because detrital components in shale precursors were probably altered by a range of meteoric and dia genetic waters at different temperatures in watersheds. But, given that we compare shales with shales, all of which have comparable CIAs, these complexities do not affect the first-order interpretations afforded by quantitative modelling.
We find that the temperatures of interacting water and rock derived from the inversion of shale δ′18O–Δ′17O values were higher during the Archaean than after it (Extended Data Fig. 5). This modelling exercise also shows that—although our measurements reveal trends towards heavier average δ′18O and lighter average Δ′17O values in shales over time—the waters involved in surface alteration and weathering processes became lighter in δ′18O, heavier in Δ′17O, and more variable in both δ′18O and Δ′17O after roughly 2.5 Gyr ago. Although the quantitative analysis makes important simplifications, it does capture the essential features of weathering conditions on conti-nents through time.
Another explanation for the stepwise change in Δ′17O values during the GOE could be the appearance of atmospheric oxygen and ozone.
l
l
ll
l
–0.4
–0.3
–0.2
–0.1
0.0
0.1
–20 –10
δ′18O (‰ VSMOW)
Δ′17
O (‰
VS
MO
W)
2.2 Gyr ago to present
2.2–2.5 Gyr ago
2.5–3.7 Gyr ago
3.8-Gyr-old granite
l
l
l
l
l
Altered MORB
MORB
Granite
Chert
Low-temperature silica
UWG−2
Clay
Diatomite, quartz
a bMWL
MWL
Ocean
wat
er
MantleMantle
100 °C
15 °C
75 °C
300 °C
Qz/water equilibrium
Bulk shale/water equilibrium15 °C
l l
l
l
Ep
Qz
300 °C
75 °C
l
l
IL
Mixing
15 °Cl
–5‰–15‰–28‰ –28‰–40‰
0‰
–15‰
1 °C
1 °C
l
45 °C
1 °Cl
15 °C l
1 °C
l
l
15 °C
15 °C
Δ′17
O (‰
VS
MO
W)
0.53050.5230.516
Juvenile crust
Secondary sili�cation
0 10 20 30 40–0.4
–0.3
–0.2
–0.1
0.0
0.1
–20 –10
δ′18O (‰ VSMOW)
0 10 20 30 40
Fig. 1 | Triple-oxygen-isotope systematics of ancient and modern terrestrial materials. a, Ancient materials. b, Modern materials. The coloured fields in b correspond to the ancient-shale data shown with coloured dots in a. The concave blue curves represent isotopic fractionation between weathering products and meteoric water. The labels on the blue curves show the δ′18O values of meteoric waters, ranging from −5‰ to −40‰, and of modern ocean water (black open circle; 0‰). The modern meteoric water line is labelled MWL. In a, the fractionation curves for bulk shale/water equilibration were constructed assuming a weathering product of 70% illite and 30% quartz (see Supplementary Information). In b, the fractionation curves are based on experimentally determined quartz/water triple-oxygen-isotope fractionations19. In a, the grey convex mixing curve connects unweathered terrestrial materials (such as mantle or upper crust) with the weathering products located
on the blue fractionation lines; the grey secondary silicification curve connects modern high-δ′18O and low-Δ′17O materials (such as cherts and sponge spicules; individual data are shown in b). In b, the various Earth materials analysed here (red symbols) and in refs18,19 (black symbols) are normalized to a mantle Δ′17O value of −0.05‰; the double-headed red arrow, with a slope of 0.528, connects coexisting hydrothermal quartz (Qz) and epidote (Ep) from the modern deep-ocean core 504B, which formed at about 300 °C in equilibrium with roughly 0‰ seawater. In a, the blue arrows and associated values depict the slopes of triple-oxygen fractionation in linearized δ′17O–δ′18O space, with the values reflecting logarithmic linearization of the delta scales32 (see Supplementary Information); 0.5305 is characteristic of infinitely high temperatures and smaller slopes are characteristic of lower-temperature fractionations. IL, illite; VSMOW, Vienna Standard Mean Ocean Water.
5 4 6 | N A t U r e | V O L 5 5 7 | 2 4 M A Y 2 0 1 8© 2018 Macmillan Publishers Limited, part of Springer Nature. All rights reserved.

Letter reSeArCH
The formation of ozone with highly positive Δ′17O values (+30‰ to +100‰) via ultraviolet photolysis in the stratosphere leaves atmos-pheric oxygen with the slightly negative Δ′17O value of −0.3‰ in today’s 21 vol% oxygen atmosphere22,25, but probably much less in Proterozoic conditions of less than 1 vol% oxygen. However, not only was the atmospheric Δ′17O signal small, there is also no mechanism by which to transfer this signature into the meteoric water cycle and hence into crustal silicate weathering products such as shales.
As argued above, we favour an explanation by which the difference in the Δ′17O values of pre- and post-GOE shales occurred through a change in the meteoric water cycle (Fig. 3). Starting roughly at the Archaean–Proterozoic transition, the emerged crust would have inter-acted with waters that had more variable and on average more negative δ′18OW values and more positive Δ′17OW values than before the GOE (with Δ′17OW shifted by approximately +0.1‰). The observed shift in the triple-oxygen-isotope composition of shales would also have required lower post-GOE surface temperatures (Extended Data Fig. 5). This is broadly consistent with the findings of previous studies of δ′18O values in cherts24.
In the modern world, the oxygen-isotope composition of precipita-tion depends on the cumulative history of water loss from the air parcel
that is travelling inland away from the coasts towards higher latitudes and higher altitudes (http://www.waterisotopes.org), resulting in lower δ′18OW values, higher Δ′17OW values, and more diverse compositions overall17 (as in the MWL on Fig. 1). This combined effect, which we call ‘continentality’ (Fig. 3), is shown through the shale record’s step change that coincides with the Archaean–Proterozoic boundary (Figs. 2a, 3). It is most likely that the observed change in the shale triple-oxygen-isotope record reflects the appearance of larger conti-nents (Fig. 3) and higher elevations from the Proterozoic onwards—a period that is broadly contemporaneous with the final stages in the assembly of the first documented supercontinent, Kenorland2,26, or with the formation of several supercratons12,15 immediately before the GOE27. Supercontinent assembly and orogenic events result in high mountain ranges and plateaus, as occurred when India collided with Asia, forming the Himalayas and Tibet. Rising moun-tains in even quite low to mid latitudes result in precipitation with very light δ′18O values (http://www.waterisotopes.org) that correlate with elevation, with a roughly 2‰–3‰ drop in δ′18O per kilometre of altitude gain28.
Supporting our interpretations of triple-oxygen variations in shales is the strontium-isotope record of marine carbonates, which suggests
ba Fig. 3 | Conceptual palaeohypsometry of Archean and Proterozoic worlds. These images are based on palaeomagnetic and tectonic reconstructions (see refs 12,26 and references therein). a, The late Archaean era (shortly before 2.5 Gyr ago) during the assembly of the supercontinent Kenorland. b, The early/mid Paleoproterozoic era, after the occurrence of the GOE. The oceans are shallower in a compared with b, and the (excessively flooded) continents are smaller and lower, resulting in different hydrologic and weathering cycles, as described here.
Fig. 2 | Oxygen-isotopic compositions of shales through time. a, Δ′17O record of shales (red points) and calculated oxygen-isotopic composition of weathering products (yellow points), showing a stepwise change in composition between 2.5 Gyr ago and 2.2 Gyr ago. The blue dashed lines represent the mean Δ′17O values, weighted by the composite sample size (n), for shales before 2.5 Gyr ago and after 2.2 Gyr ago. The boxes represent the medians, interquartile ranges and extreme values (see legend). A t-test reveals that the Archaean and post-Archaean Δ′17O
values are statistically distinct (0.004 < P < 0.02, well below a statistical significance value of 0.05). We attribute the different δ′18O and Δ′17O values of pre- and post-Archaean shales in this diagram to a change from a coast-dominated to a more continental hydrological cycle and weathering conditions (see text for details). The blue vertical bars at the top indicate major glacial episodes. b, δ′18O record of shales (red points) from our dataset superimposed on the dataset from ref. 14 (white diamonds).
5
10
15
20
30
0 0.5 1.0 1.5 2.0 2.5 3.0 3.5
–0.25
–0.15
–0.10
–0.05
0.000 1 2 3 4
Age (Gyr)
Shale
Weatheringproduct
–0.20
Mantle
±1
75%
25%
+2.7
–2.7
n = 20 25
Mantle
Ref. 14Shales (this work)
Age (Gyr)
a b
n = 12n = 5n = 1
Δ′17
Osh
ale
(‰ V
SM
OW
)
δ′18
O (‰
VS
MO
W)
GOE
2 4 M A Y 2 0 1 8 | V O L 5 5 7 | N A t U r e | 5 4 7© 2018 Macmillan Publishers Limited, part of Springer Nature. All rights reserved.

LetterreSeArCH
that the area of emerged continental crust increased substantially and irreversibly at roughly the Archaean–Proterozoic boundary29. From a geodynamic perspective, models of a cooling Earth call for a thickening of the lithosphere and the establishment of a higher continental free-board by about 2.5 Gyr ago owing to increased mantle viscosity5,30,31. The emergence of large landmasses (Fig. 3) would also have led to a larger weathering sink for carbon dioxide, which occurred at greater concentrations in the Archaean, resulting in a transition to moderate surface temperatures after the GOE. We conclude that this set of large-scale tectonic and near-surface changes best explains the observed shift in the δ′18O–Δ′17O composition of shales between 2.5 Gyr ago and 2.2 Gyr ago (Fig. 2).
The rapid increase in Earth’s subaerial surface and overall hypsom-etry 2.5 Gyr ago that we infer here (Fig. 3) would have also increased Earth’s albedo, the flux of nutrients to the oceans8 from continents undergoing subaerial weathering, and the extent of continental margins, additionally resulting in a higher rate of burial of organic carbon and reducing the concentration of carbon dioxide in the air. Together, these changes could have contributed to the cooling of the planet and to the snowball glaciations of the early Palaeoproterozoic, followed by the GOE, highlighting how Earth’s interior could have influenced surface redox conditions and chemistry. The most dramatic change in Earth’s history was marked by a transition from hot and largely anoxic surface conditions to an oxygenated atmos-phere with moderate surface temperatures. Our study suggests that this transition might have been modulated by long-term cooling of the subcontinental mantle and lithosphere, rendering it capable of supporting a thicker crust1,2,30,31. This would have led to the emergence of extensive landmasses at the Archaean–Proterozoic boundary, with life and surface conditions adjusting to—rather than triggering—the change in atmospheric oxygen concentrations.
Data availabilityData are provided in Extended Data Tables 1–3.
Online contentAny Methods, including any statements of data availability and Nature Research reporting summaries, along with any additional references and Source Data files, are available in the online version of the paper at https://doi.org/10.1038/s41586-018-0131-1.
Received: 2 October 2017; Accepted: 7 March 2018; Published online 23 May 2018.
1. Taylor, S. R. & McLennan, S. M. The geochemical evolution of the continental crust. Rev. Geophys. 33, 241–265 (1995).
2. Condie, K. C. Plate Tectonics and Crustal Evolution 3rd edn (Pergamon Press, Oxford, 2013).
3. Belousova, E. A. et al. The growth of the continental crust: constraints from zircon Hf-isotope data. Lithos 119, 457–466 (2010).
4. Keller, C. B., Schoene, B., Barboni, M., Samperton, K. M. & Husson, J. M. Volcanic–plutonic parity and the differentiation of the continental crust. Nature 523, 301–307 (2015).
5. Dhuime, B., Wuestefeld, B. & Hawkesworth, C. J. Emergence of modern continental crust about 3 billion years ago. Nat. Geosci. 8, 552–555 (2015).
6. Lee, C.-T. A. et al. Deep mantle roots and continental emergence: implications for whole-Earth elemental cycling, long-term climate, and the Cambrian explosion. Int. Geol. Rev. 60, 431–448 (2017).
7. Hawkesworth, C. J., Cawood, P. A., Dhuime, B. & Kemp, A. I. S. Earth’s continental lithosphere through time. Annu. Rev. Earth Planet. Sci. 45, 169–198 (2017).
8. Greber, N. D. et al. Titanium isotopic evidence for felsic crust and plate tectonics 3.5 billion years ago. Science 357, 1271–1274 (2017).
9. Farquhar, J. & Wing, B. A. The terrestrial record of stable sulphur isotopes: a review of the implications for evolution of Earth’s sulphur cycle. Geol. Soc. Lond. Spec. Publ. 248, 167–177 (2005).
10. Bekker, A. et al. Dating the rise of atmospheric oxygen. Nature 427, 117–120 (2004).
11. Hoffman, P. F. The Great Oxidation and a Siderian snowball Earth: MIFS based correlation of Paleoproterozoic glacial epochs. Chem. Geol. 362, 143–156 (2013).
12. Gumsley, A. P. et al. Timing and tempo of the Great Oxidation Event. Proc. Natl Acad. Sci. USA 114, 1811–1816 (2017).
13. Valley, J. W. et al. 4.4 billion years of crustal maturation: oxygen isotope ratios of magmatic zircon. Contrib. Mineral. Petrol. 150, 561–580 (2005).
14. Bindeman, I. N., Bekker, A. & Zakharov, D. O. Oxygen isotope perspective on crustal evolution on early Earth: a record of Precambrian shales with emphasis on Paleoproterozoic glaciations and Great Oxygenation Event. Earth Planet. Sci. Lett. 437, 101–113 (2016).
15. Bleeker, W. The late Archean record: a puzzle in ca. 35 pieces. Lithos 71, 99–134 (2003).
16. Gaschnig, R. M. et al. Compositional evolution of the upper continental crust through time, as constrained by ancient glacial diamictites. Geochim. Cosmochim. Acta 186, 316–343 (2016).
17. Luz, B. & Barkan, E. Variations of 17O/16O and 18O/16O in meteoric waters. Geochim. Cosmochim. Acta 74, 6276–6286 (2010).
18. Pack, A. & Herwartz, D. The triple oxygen isotope composition of the Earth mantle and understanding δ17O variations in terrestrial rocks and minerals. Earth Planet. Sci. Lett. 390, 138–145 (2014).
19. Sharp, Z. D. et al. A calibration of the triple oxygen isotope fractionation in the SiO2-H2O system and applications to natural samples. Geochim. Cosmochim. Acta 186, 105–119 (2016).
20. Savin, S. & Epstein, S. The oxygen and hydrogen isotope geochemistry of ocean sediments and shales. Geochim. Cosmochim. Acta 34, 43–63 (1970).
21. Land, L. S. & Lynch, F. L. δ18O values of mudrocks: more evidence for an 18O-buffered ocean. Geochim. Cosmochim. Acta 60, 3347–3352 (1996).
22. Bao, H. M., Cao, X. B. & Hayles, J. Triple-oxygen isotopes: fundamental relationships and applications. Annu. Rev. Earth Planet. Sci. 44, 463–492 (2016).
23. Nesbitt, H. W. & Young, G. N. Early Proterozoic climates and plate motions inferred from major element chemistry of lutites. Nature 299, 715–717 (1982).
24. Knauth, L. P. & Lowe, D. R. High Archean climatic temperature inferred from oxygen isotope geochemistry of cherts in the 3.5 Ga Swaziland Supergroup, South Africa. Geol. Soc. Bull. 115, 566–580 (2003).
25. Young, E., Yeung, L. Y. & Kohl, I. On the 17O budget of atmosphere. Geochim. Cosmochim. Acta 135, 102–125 (2014).
26. Mertanen, S. & Pesonen, L. J. in From the Earth’s Core to Outer Space (ed. Haapala, I.) 11–35 (Springer, Berlin, 2012).
27. Barley, M. E., Bekker, A. & Krapez, B. Late Archean to early Paleoproterozoic global tectonics, environmental change and the rise of atmospheric oxygen. Earth Planet. Sci. Lett. 238, 156–171 (2005).
28. Rowley, D. B., Pierrehumbert, R. & Currie, B. A new approach to stable isotope-based paleoaltimetry: implications for paleoaltimetry and paleohypsometry of the High Himalaya since the Late Miocene. Earth Planet. Sci. Lett. 188, 253–268 (2001).
29. Flament, N., Coltice, N. & Rey, P. F. A case for late-Archaean continental emergence from thermal evolution models and hypsometry. Earth Planet. Sci. Lett. 275, 326–336 (2008).
30. Vlaar, N. J. Continental emergence and growth on a cooling earth. Tectonophysics 322, 191–202 (2000).
31. Korenaga, J., Planavsky, N. J. & Evans, D. A. D. Global water cycle and the coevolution of the Earth’s interior and surface environment. Phil. Trans. R. Soc. A 375, 20150393 (2017).
32. Miller, M. F. Isotopic fractionation and the quantification of 17O anomalies in the oxygen three-isotope system: an appraisal and geochemical significance. Geochim. Cosmochim. Acta 66, 1881–1889 (2002).
Acknowledgements This work was supported by National Science Foundation (NSF) grant EAR1447337 and by the University of Oregon. N.D. was supported by NSF grant EAR1502591. A.B. was supported by National Sciences and Engineering Research Council (NSERC) Discovery and Accelerator grants. We thank P. Hoffman, S. Mertanen and D. Evans for discussions about Precambrian palaeogeography and environmental changes; K. Johnson for technical help with vacuum lines; and O. Melnik for help with programming.
Reviewer information Nature thanks C. Hawkesworth and the other anonymous reviewer(s) for their contribution to the peer review of this work.
Author contributions I.N.B. conceived the study and wrote the paper; D.O.Z., J.P. and I.N.B. built the purification line and collected the data; N.D.G. and N.D. provided composite shale samples studied previously for titanium isotopes; A.B., A.H. and G.J.R. provided samples; J.S.L. performed major- and trace-element analyses; I.N.B. and N.D. discussed the inversion approach and I.N.B. implemented the model; D.O.Z. contributed to statistical treatment; A.B., N.D., N.D.G. and G.J.R. contributed to discussions on Precambrian environments and crustal evolution. All authors contributed to writing and editing the paper.
Competing interests The authors declare no competing interests.
Additional informationExtended data is available for this paper at https://doi.org/10.1038/s41586-018-0131-1.Supplementary information is available for this paper at https://doi.org/10.1038/s41586-018-0131-1.Reprints and permissions information is available at http://www.nature.com/reprints.Correspondence and requests for materials should be addressed to I.N.B.Publisher’s note: Springer Nature remains neutral with regard to jurisdictional claims in published maps and institutional affiliations.
5 4 8 | N A t U r e | V O L 5 5 7 | 2 4 M A Y 2 0 1 8© 2018 Macmillan Publishers Limited, part of Springer Nature. All rights reserved.

Letter reSeArCH
Extended Data Fig. 1 | Comparison of isotopic and key elemental ratios of the shales studied here, illustrating the relative constancy of the composition of the exposed crust that is undergoing weathering, and in particular proportion of exposed mafic versus silicic rocks. See, for example, refs 1,33. The δ49Ti data are from ref. 8, which used a large dataset
that included many of the samples studied here. The elemental data are from Extended Data Table 3 and ref. 14. Variation in the composition of the exposed crust cannot explain the oxygen-isotope trends that we have identified here.
33. McLennan, S. M., Hemming, S., McDaniel, D. K. & Hanson, G. N. Geochemical approaches to sedimentation, provenance and tectonics. Geol. Soc. Am. Spec. Pap. 284, 21–40 (1993).
© 2018 Macmillan Publishers Limited, part of Springer Nature. All rights reserved.
LetterreSeArCH
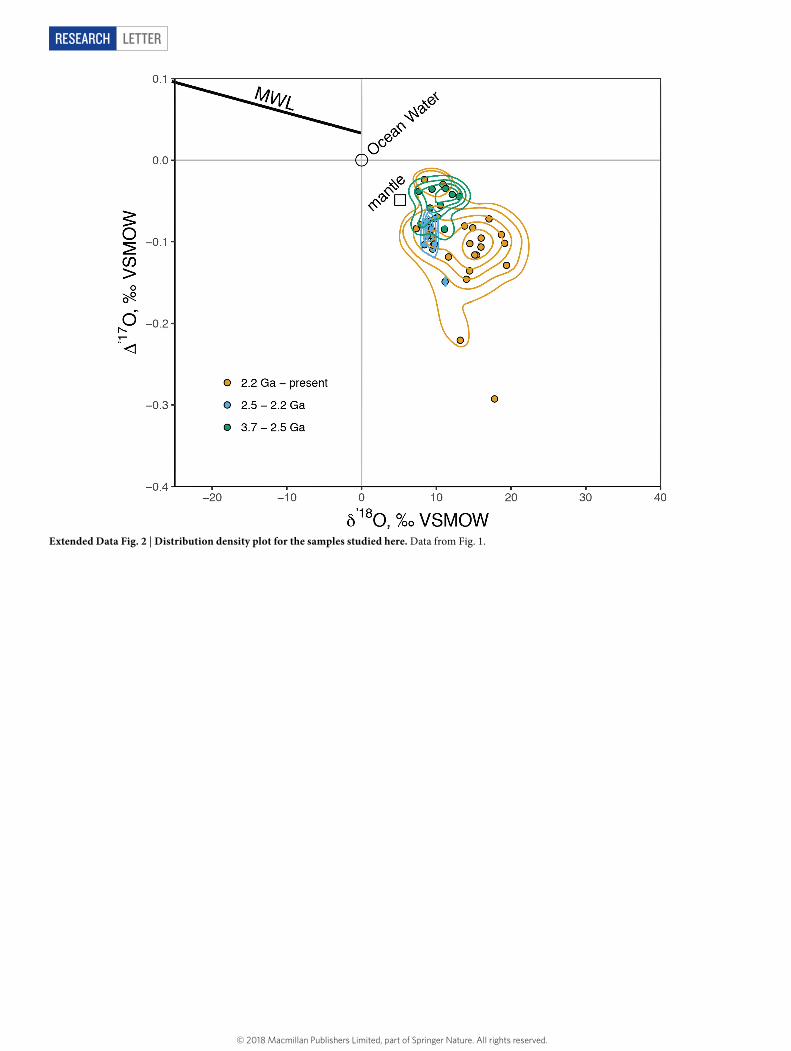
Extended Data Fig. 2 | Distribution density plot for the samples studied here. Data from Fig. 1.
© 2018 Macmillan Publishers Limited, part of Springer Nature. All rights reserved.
Letter reSeArCH
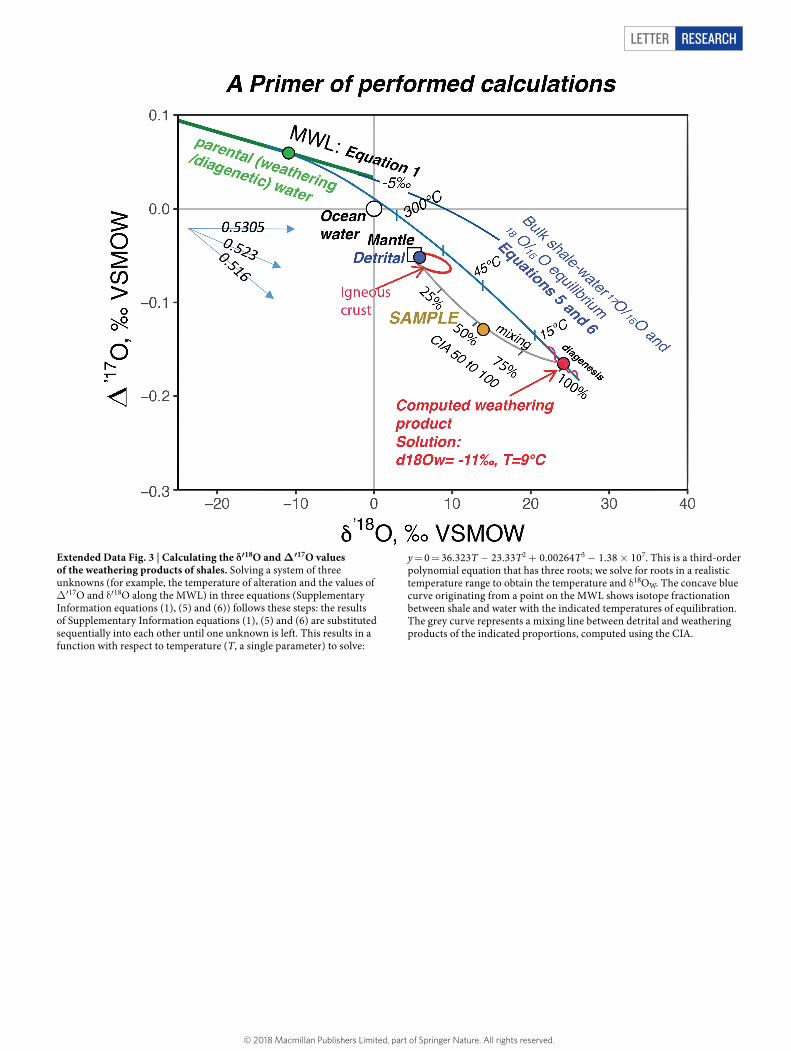
Extended Data Fig. 3 | Calculating the δ′18O and Δ′17O values of the weathering products of shales. Solving a system of three unknowns (for example, the temperature of alteration and the values of Δ′17O and δ′18O along the MWL) in three equations (Supplementary Information equations (1), (5) and (6)) follows these steps: the results of Supplementary Information equations (1), (5) and (6) are substituted sequentially into each other until one unknown is left. This results in a function with respect to temperature (T, a single parameter) to solve:
y = 0 = 36.323T − 23.33T2 + 0.00264T3 − 1.38 × 10⁷. This is a third-order polynomial equation that has three roots; we solve for roots in a realistic temperature range to obtain the temperature and δ18OW. The concave blue curve originating from a point on the MWL shows isotope fractionation between shale and water with the indicated temperatures of equilibration. The grey curve represents a mixing line between detrital and weathering products of the indicated proportions, computed using the CIA.
© 2018 Macmillan Publishers Limited, part of Springer Nature. All rights reserved.
LetterreSeArCH
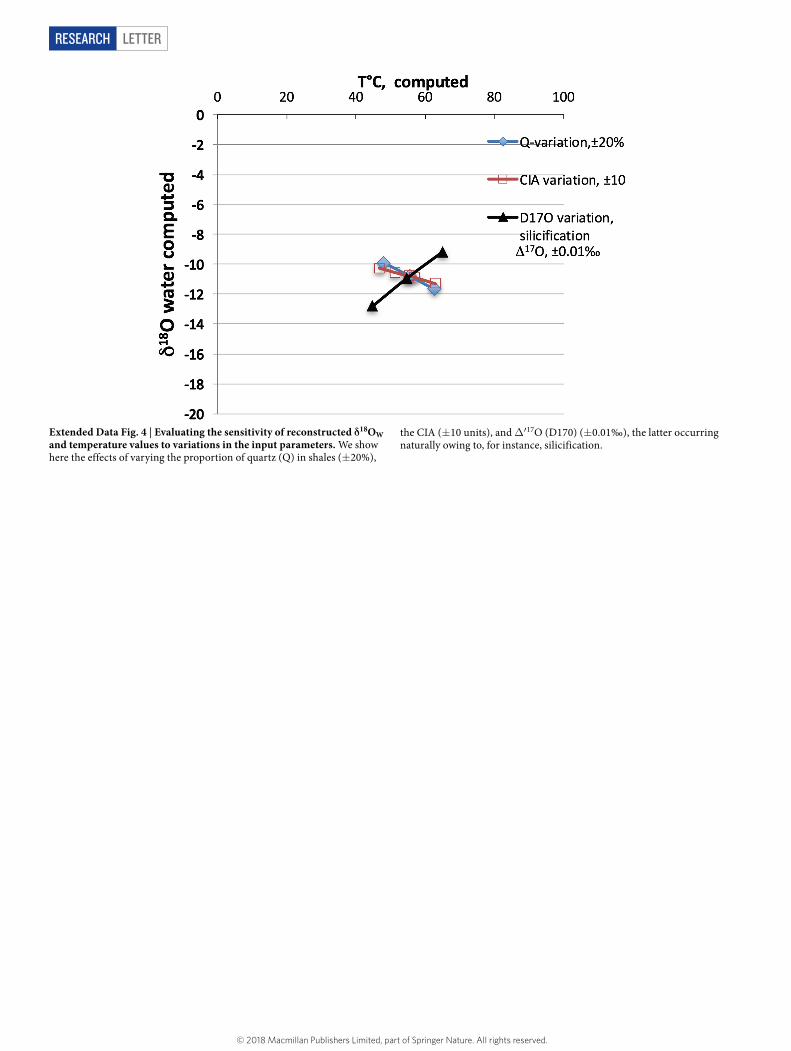
Extended Data Fig. 4 | Evaluating the sensitivity of reconstructed δ18OW and temperature values to variations in the input parameters. We show here the effects of varying the proportion of quartz (Q) in shales (±20%),
the CIA (±10 units), and Δ′17O (D170) (±0.01‰), the latter occurring naturally owing to, for instance, silicification.
© 2018 Macmillan Publishers Limited, part of Springer Nature. All rights reserved.

Letter reSeArCH
Extended Data Fig. 5 | See next page for caption.
© 2018 Macmillan Publishers Limited, part of Springer Nature. All rights reserved.

LetterreSeArCH
34. Frieling, J. et al. Paleocene–Eocene warming and biotic response in the epicontinental West Siberian Sea. Geology 42, 767–770 (2014).
Extended Data Fig. 5 | Calculated temperature, δ18OW and Δ17OW values plotted against age of shales. a, δ18OW versus age; b, temperature versus age; c, Δ17OW versus age; d, δ18OW versus temperature. These values are based on the solution of three equations with three input parameters: δ′18Oshale, δ′17Oshale and the proportion of quartz (see Extended Data Fig. 3). Sensitivity analysis is provided in Extended Data Fig. 4. Most measurements yielded solved roots (plus signs within symbols); when equations could not be solved, small variations in the input parameters (Extended Data Table 1) allowed us to find roots. In particular, correcting for secondary silicification (see Extended Data Table 1) by decreasing Δ′17Oshale by 0.01‰ to 0.08‰ along the silicification line allowed us to find roots in all but two cases. Note that the overall calculated δ18OW and temperature ranges agree with modern and recent values for surface, diagenetic, basinal and pore waters measured in drillholes21. Note also
that the absolute calculated values for the temperature of water–rock interaction (weathering) and δ18OW depend on the assumed isotopic fractionations in Extended Data Fig. 6; however, given that these values solved within realistic bounds, the fractionations of ref. 19 and the MWL defined in ref. 17 are probably well constrained and calibrated in absolute triple-oxygen-isotope space. The lowest δ18OW and temperature are computed for recent clay samples from Antarctica, and for 2.5–2.2-Gyr-old synglacial Palaeoproterozoic shales, confirming the participation of low-δ18Ow synglacial waters in diagenesis, as proposed previously14. The highest recent temperature and δ18OW values are for Palaeocene–Eocene (55-million-year-old) thermal maximum shales (ref. 34 and Extended Data Table 1). e–g, Interquartile range statistics and running averages for the parameters computed in a–d.
© 2018 Macmillan Publishers Limited, part of Springer Nature. All rights reserved.

Letter reSeArCH
35. Zheng, Y. F. Calculation of oxygen isotope fractionation in hydroxyl-bearing silicates. Earth Planet. Sci. Lett. 120, 247–263 (1993).
Extended Data Fig. 6 | Quartz/water, illite/water and bulk-shale/water 18O/16O fractionation factors. The quartz/water and illite/water 1,000lnα (18O/16O) fractionation factors are based on refs 19,35. The bulk-shale/water 1,000lnα (18O/16O) fractionation factors are based on the assumption that bulk shale comprises 70% illite and 30% quartz (that is, Q = 0.3). The blue line (for quartz/water fractionation) corresponds to Supplementary
Information equation (2) and equation (9) in ref. 19. The green line (for illite/water fractionation) is the best-fit second-order polynomial with two fit coefficients based on the equation in ref. 35 that includes three fit coefficients. We used these coefficients to solve equations for bulk-shale/water triple-oxygen-isotope fractionations according to the proportion of quartz (determined through X-ray-diffraction; Extended Data Table 2).
© 2018 Macmillan Publishers Limited, part of Springer Nature. All rights reserved.

LetterreSeArCH
Extended Data Fig. 7 | Chemical index of alteration (CIA) plotted against time. CIA = Al2O3/(Al2O3 + CaO + Na2O + K2O)mol. Data are taken from this work (triangles), ref. 14 (diamonds), and literature data (circles).
© 2018 Macmillan Publishers Limited, part of Springer Nature. All rights reserved.

Letter reSeArCH
36. Ovey, C. D. Preliminary results from the study of an ocean core obtained by the Swedish Deep-Sea Expedition, 1947-48. J. Glaciol. 1, 370–373 (1950).
37. Kah, L. C. et al. δ13C stratigraphy of the Proterozoic Bylot Supergroup, Baffin Island, Canada: implications for regional lithostratigraphic correlations. Can. J. Earth Sci. 36, 313–332 (1999).
38. Campbell, A. S. & Clark, B. L. Miocene radiolarian faunas from southern California. Geol. Soc. Am. Spec. Pap. 51, 1–78 (1944).
39. Retallack, G. J. Lateritization and bauxitization events. Econ. Geol. 105, 665–667 (2010).
40. Ryu, I.-C. Petrography, diagenesis and provenance of Eocene Tyee Basin sandstones, southern Oregon Coast Range: new view from sequence stratigraphy. Isl. Arc 12, 398–410 (2003).
41. McKee, E. H. & Gangloff, R. A. Stratigraphic distribution of archaeocyathids in the Silver Peak Range and the White and Inyo Mountains, western Nevada and eastern California. J. Paleontol. 43, 716–726 (1969).
42. Pecoits, E. et al. U–Pb detrital zircon ages from some Neoproterozoic successions of Uruguay: provenance, stratigraphy and tectonic evolution. J. S. Am. Earth Sci. 71, 108–130 (2016).
43. Thomson, D., Rainbird, R. H., Planavsky, N., Lyons, T. W. & Bekker, A. Chemostratigraphy of the Shaler Supergroup, Victoria Island, NW Canada: a record of ocean composition prior to the Cryogenian glaciations. Precambr. Res. 263, 232–245 (2015).
44. Key, R. M. et al. The western arm of the Lufilian Arc in NW Zambia and its potential for copper mineralization. J. Afr. Earth Sci. 33, 503–528 (2001).
45. Podkovyrov, V. N. et al. Provenance and source rocks of Riphean sandstones in the Uchur-Maya region (east Siberia): implications of geochemical data and Sm-Nd isotopic systematics. Stratigr. Geol. Correl. 15, 41–56 (2007).
46. Cullers, R. L. & Podkovyrov, V. N. The source and origin of terrigenous sedimentary rocks in the Mesoproterozoic Ui group, southeastern Russia. Precambr. Res. 117, 157–183 (2002).
47. Vinogradov, V. I., Veis, A. F., Bujakaite, M. I. & Golovin, D. I. Isotopic evidences of epigenetic transformations and the problem of the age of Precambrian rocks in the Yudoma-Maya trough, eastern Siberia. Lithol. Miner. Resour. 35, 141–152 (2000).
48. Addison, W. D., Brumpton, G. R., Davis, D. W., Fralick, P. W. & Kissin, S. A. Debrisites from the Sudbury impact event in Ontario, north of Lake Superior, and a new age constraint: are they base-surge deposits or tsunami deposits? Geol. Soc. Am. Spec. Pap. 465, 245–268 (2010).
Extended Data Table 1 | Triple-oxygen-isotope analyses of the shale samples used here
Details of the shale samples are taken from refs 12,14,36–64.*Normalized to the mantle value, −0.05‰ Δ17O.†Data from ref. 8.‡CIA is calculated using X-ray fluorescence (XRF) analysis of rocks where available. A generically average CIA of 75 is assumed for samples without chemical analysis or for which inductively coupled plasma mass spectrometry (ICPMS) analysis shows the calcium carbonate content to be greater than 5 wt% (most likely because of to secondary carbonate). A CIA of 100 is assumed for samples of 100% clay.¶Corrected using the δ′18O and Δ′17O values of igneous crust, namely 7‰ and −0.07‰ respectively.
49. Sheppard, S. et al. A new Paleoproterozoic tectonic history of the eastern Capricorn Orogen, Western Australia, revealed by U-Pb zircon dating of micro-tuffs. Precambr. Res. 286, 1–19 (2016).
50. Kipp, M. A., Stüeken, E. E., Bekker, A. & Buick, R. Selenium isotopes record extensive marine suboxia during the Great Oxidation Event. Proc. Natl Acad. Sci. USA 114, 875–880 (2017).
51. Rouxel, O. J., Bekker, A. & Edwards, K. J. Iron isotope constraints on the Archean and Paleoproterozoic ocean redox state. Science 307, 1088–1091 (2005).
52. Rasmussen, B., Bekker, A. & Fletcher, I. R. Correlation of Paleoproterozoic glaciations based on U–Pb zircon ages for tuff beds in the Transvaal and Huronian Supergroups. Earth Planet. Sci. Lett. 382, 173–180 (2013).
53. Rasmussen, B., Blake, T. S. & Fletcher, I. R. U–Pb zircon age constraints on the Hamersley spherule beds: evidence for a single 2.63 Ga Jeerinah-Carawine impact ejecta layer. Geology 33, 725–728 (2005).
54. Hofmann, A., Bolhar, R., Dirks, P. & Jelsma, H. The geochemistry of Archaean shales derived from a mafic volcanic sequence, Belingwe greenstone belt, Zimbabwe: provenance, source area unroofing and submarine versus subaerial weathering. Geochim. Cosmochim. Acta 67, 421–440 (2003).
55. Planavsky, N. J. et al. Evidence for oxygenic photosynthesis half a billion years before the Great Oxidation Event. Nat. Geosci. 7, 283–286 (2014).
56. Kositcin, N. & Krapež, B. Relationship between detrital zircon age-spectra and the tectonic evolution of the Late Archaean Witwatersrand Basin, South Africa. Precambr. Res. 129, 141–168 (2004).
57. Armstrong, R. A., Compston, W., Retief, E. A., Williams, I. S. & Welke, H. J. Zircon ion microprobe studies bearing on the age and evolution of the Witwatersrand triad. Precambr. Res. 53, 243–266 (1991).
58. Javaux, E. J., Marshall, C. P. & Bekker, A. Organic-walled microfossils in 3.2-billion-year-old shallow-marine siliciclastic deposits. Nature 463, 934–938 (2010).
59. Byerly, G. R., Kröner, A., Lowe, D. R. & Todt, W. Prolonged magmatism and time constraints for sediment deposition in the early Archean Barberton greenstone belt: evidence from the Upper Onverwacht and Fig Tree groups. Precambr. Res. 78, 125–138 (1996).
60. Mukhopadhyay, J. et al. Dating the oldest greenstone in India: a 3.51-Ga precise U-Pb SHRIMP zircon age for dacitic lava of the Southern Iron Ore Group, Singhbhum Craton. J. Geol. 116, 449–461 (2008).
61. Myers, J. S. Protoliths of the 3.8–3.7 Ga Isua greenstone belt, West Greenland. Precambr. Res. 105, 129–141 (2001).
© 2018 Macmillan Publishers Limited, part of Springer Nature. All rights reserved.

LetterreSeArCH
62. Liu, D. Y., Nutman, A. P., Compston, W., Wu, J. S. & Shen, Q. H. Remnants of ≥3800 Ma crust in the Chinese part of the Sino-Korean craton. Geology 20, 339–342 (1992).
63. Retallack, G. J. & Krull, E. S. Neogene paleosols in the Sirius Group, Dominion, Antarctica. US Antarctic J. 30, 10–14 (1997).
64. Bell, M. A. & Haglund, T. R. Fine-scale temporal variation of the Miocene stickleback Gasterosteus doryssus. Paleobiology 8, 282–292 (1982).
© 2018 Macmillan Publishers Limited, part of Springer Nature. All rights reserved.

Letter reSeArCH
Extended Data Table 2 | Quantitative XRD data for a selection of studied shales
*Run as CO2 for δ18O only; previously published14.
© 2018 Macmillan Publishers Limited, part of Springer Nature. All rights reserved.

LetterreSeArCH
Extended Data Table 3 | New XRF analyses of samples studied here
bdl, below detection limit; LOI, loss on ignition; p.p.m., parts per million.*Secondary carbonate present.
© 2018 Macmillan Publishers Limited, part of Springer Nature. All rights reserved.