level 1 mathematics and statistics (91028) 2017iv) holes are drilled through a 2 m long horizontal...
TRANSCRIPT

910280
1SUPERVISOR’S USE ONLY
9 1 0 2 8
© New Zealand Qualifications Authority, 2017. All rights reserved.No part of this publication may be reproduced by any means without the prior permission of the New Zealand Qualifications Authority.
ASSESSOR’S USE ONLY
TOTAL
Level 1 Mathematics and Statistics, 201791028 Investigate relationships between tables,
equations and graphs
9.30 a.m. Monday 20 November 2017 Credits: Four
Achievement Achievement with Merit Achievement with ExcellenceInvestigate relationships between tables, equations and graphs.
Investigate relationships between tables, equations and graphs, using relational thinking.
Investigate relationships between tables, equations and graphs, using extended abstract thinking.
Check that the National Student Number (NSN) on your admission slip is the same as the number at the top of this page.
You should attempt ALL the questions in this booklet.
Show ALL working.
Grids are provided on some pages. This is working space for the drawing of a graph or a diagram, constructing a table, writing an equation, or writing your answer.
If you need more space for any answer, use the page(s) provided at the back of this booklet and clearly number the question.
Check that this booklet has pages 2 – 15 in the correct order and that none of these pages is blank.
YOU MUST HAND THIS BOOKLET TO THE SUPERVISOR AT THE END OF THE EXAMINATION.

QUESTION ONE
(a) Rent A Car is a car rental company. The graph below shows the cost per day ($C), of hiring one of their standard-sized cars, as the number of days the car is hired for (d) increases.
0 2 4 6 8 10 12 14 16 18 20
140
130
120
110
100
90
80
70
60
50
40
30
20
10
0
Number of days (d) the car is hired for
Cos
t per
day
($C
) of h
iring
the
car
2
Mathematics and Statistics 91028, 2017

(i) How much cheaper per day is it to hire the car for 3 days than 1 day?
(ii) Give the equation for the cost per day of hiring the car:
(1) for 4 to 6 days
(2) forthefirst3days.
3
Mathematics and Statistics 91028, 2017
ASSESSOR’S USE ONLY

(b) Rent A Car decides to introduce a special deal, and produces a sign as shown on the right.
Mereistryingtofindthecheapestoptionforrentingacar.She asks what this ‘SPECIAL DEAL’ actually means.
The company gives Mere the formula they use to work out the daily rate.
C = 140 × 0.9 d – 1
where C is the daily cost and d is the number of days for which the car is hired.
Investigate, using an equation, table, or graph, whether Mere is any better off with this ‘special deal’ offer compared to the original price, as shown on the graph from page 2 (reproduced below).
Justify your answer.
Graph repeated from Page 2
0 2 4 6 8 10 12 14 16 18 20
140
130
120
110
100
90
80
70
60
50
40
30
20
10
0
Number of days (d) the car is hired for
Cos
t per
day
($C
) of h
iring
the
car
RENT A CARSPECIAL DEAL
Maximum daily price $140reducing daily by 10% for each additional day
the car is hired.(Minimum price charged
per day is $80)
4
Mathematics and Statistics 91028, 2017

5
Mathematics and Statistics 91028, 2017
ASSESSOR’S USE ONLY
QUESTION TWO
(a) (i) Sketch the graph of y = 2x.
(ii) Givetheequationofthisgraphifitistranslateddownby3units,andthenreflectedinthe y-axis.
6
Mathematics and Statistics 91028, 2017
ASSESSOR’S USE ONLY

(b) In a children’s playground there is a rope hanging from two points, A and B, on a horizontal beam.
A and B are 6 metres apart.
The lowest point of the rope is 1 m above the ground.
The shape of the rope can be modelled by
y = x
3x p( ) + 4
where y is the height above the ground, and x is the distance from A.
(i) How high above the ground is A?
(ii) Give the value of p.
(iii) On the grid below sketch the graph that models the shape of the rope.
2
2
–2
4
6
8
–2 4 6 8
6 m
1 m
A B
7
Mathematics and Statistics 91028, 2017
ASSESSOR’S USE ONLY
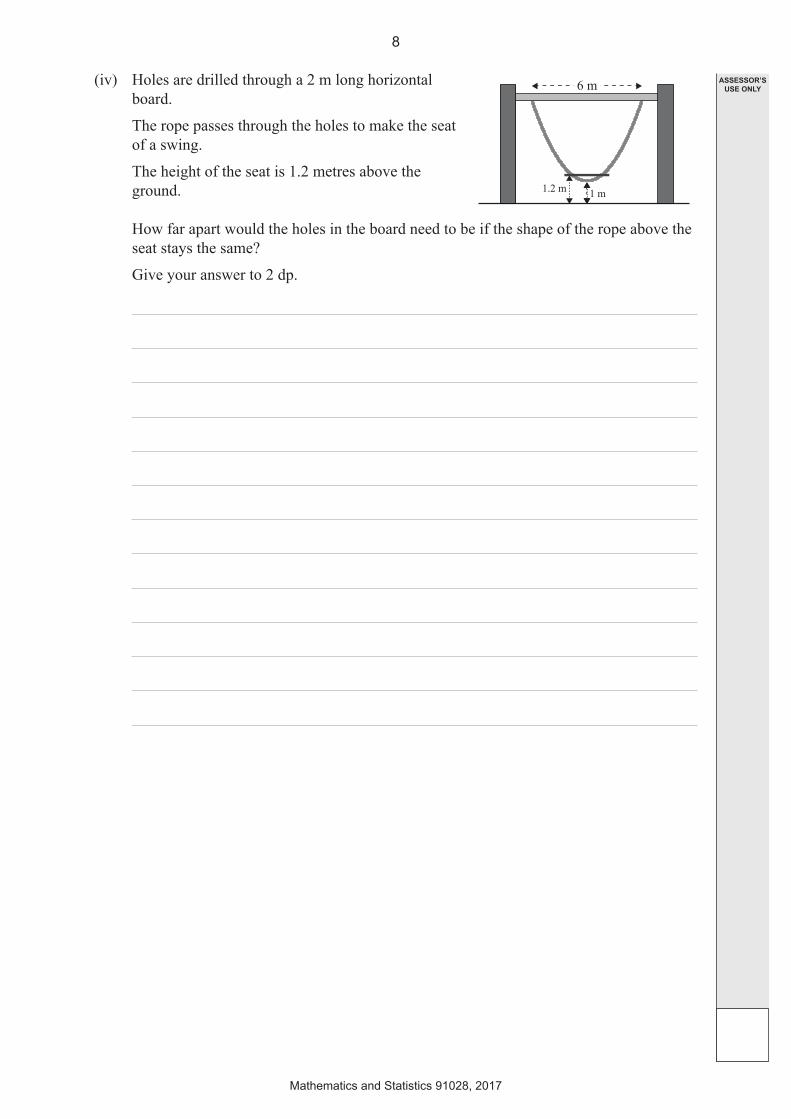
(iv) Holes are drilled through a 2 m long horizontal board.
The rope passes through the holes to make the seat of a swing.
The height of the seat is 1.2 metres above the ground.
How far apart would the holes in the board need to be if the shape of the rope above the seat stays the same?
Give your answer to 2 dp.
6 m
1 m1.2 m
8
Mathematics and Statistics 91028, 2017
ASSESSOR’S USE ONLY
QUESTION THREE
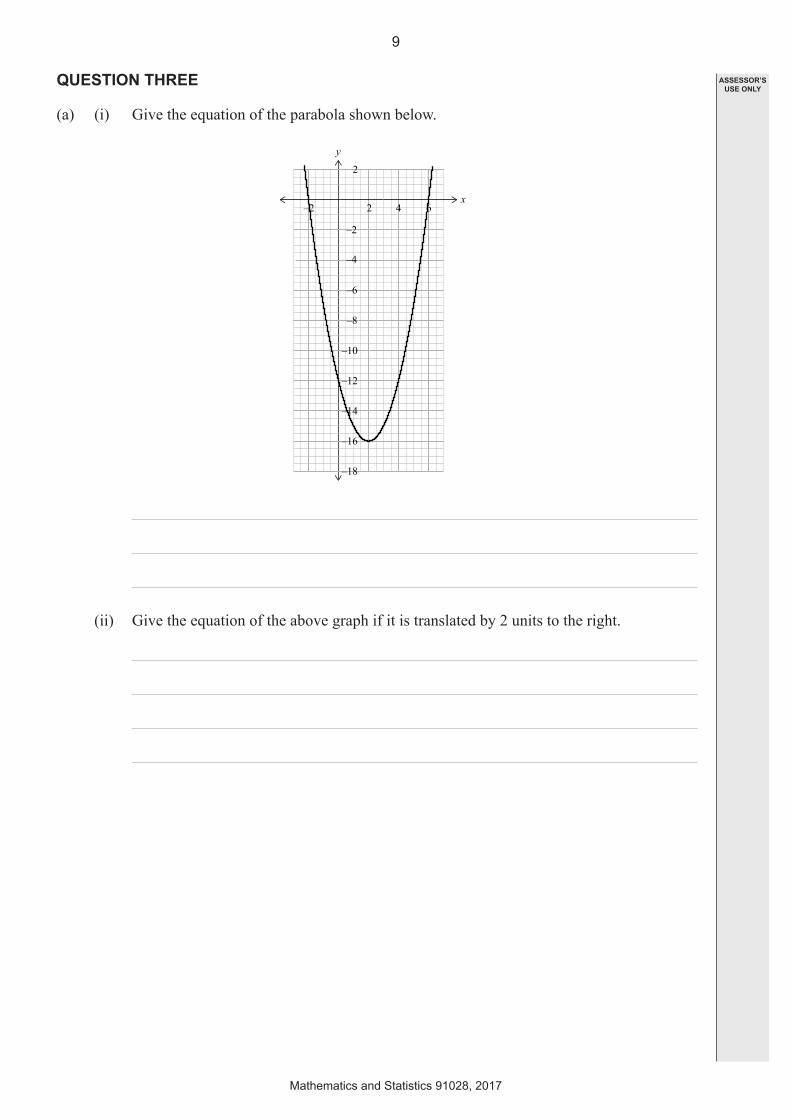
(a) (i) Give the equation of the parabola shown below.
2–2 64
–6
–8
–10
–12
–14
–16
–18
–2
–4
2
x
y
(ii) Give the equation of the above graph if it is translated by 2 units to the right.
9
Mathematics and Statistics 91028, 2017
ASSESSOR’S USE ONLY

(b) Jono has some strips of plastic that are each 12 cm long.
He cuts one of these strips into two pieces and uses them as the two shorter sides of a right-angled triangle.
He starts by cutting a piece 4 cm long from a 12 cm strip, and uses this as one side of a right-angled triangle. He places the remaining 8 cm piece at right angles as the second side, as shown below.
4 cm
8 cm
He then calculates the area of the triangle that would be formed by joining the two end points.
(i) Use a table, equation, or graph to investigate the relationship between the area of the triangle, and the different lengths of the piece of plastic that can be cut from the 12 cm strip.
State the equation that best represents the relationship between the area of the triangle and the length of plastic cut from the 12 cm strip.
10
Mathematics and Statistics 91028, 2017
ASSESSOR’S USE ONLY

(ii) What features can be noticed about the area when Jono increases the length of the strip of plastic that he cuts from the 12 cm strip?
11
Mathematics and Statistics 91028, 2017
ASSESSOR’S USE ONLY

(iii) Clearly describe how the features of the graph of the relationship would change if the total length of the strip of plastic was n cm longer.
Include the co-ordinates of the vertex of the parabola.
NOTE: You do not need to draw the graph.
12
Mathematics and Statistics 91028, 2017
ASSESSOR’S USE ONLY

13
Mathematics and Statistics 91028, 2017
ASSESSOR’S USE ONLY
QUESTION NUMBER
Extra paper if required.Write the question number(s) if applicable.

14
Mathematics and Statistics 91028, 2017
ASSESSOR’S USE ONLY
QUESTION NUMBER
Extra paper if required.Write the question number(s) if applicable.

15
Mathematics and Statistics 91028, 2017
ASSESSOR’S USE ONLY
QUESTION NUMBER
Extra paper if required.Write the question number(s) if applicable.

91
02
8