leveraging auxiliary text for deep recognition of unseen
TRANSCRIPT
LEVERAGING AUXILIARY TEXT FOR DEEP RECOGNITION OF UNSEEN VISUAL RELATIONSHIPS
Leveraging Auxiliary Text for Deep Recognition of Unseen Visual Relationships
Gal S.Kenigsfield [email protected] of Electrical EngineeringTechnionHaifa, Israel
Ran El-Yaniv [email protected]
Deparment of Computer ScienceTechnionHaifa, Israel
Abstract
One of the most difficult tasks in scene understanding is recognizing interactions between objects in an image. Thistask is often called visual relationship detection (VRD). We consider the question of whether, given auxiliary textualdata in addition to the standard visual data used for training VRD models, VRD performance can be improved. Wepresent a new deep model that can leverage additional textual data. Our model relies on a shared text–imagerepresentation of subject-verb-object relationships appearing in the text, and object interactions in images. Ourmethod is the first to enable recognition of visual relationships missing in the visual training data and appearingonly in the auxiliary text. We test our approach on two different text sources: text originating in images and textoriginating in books. We test and validate our approach using two large-scale recognition tasks: VRD and SceneGraph Generation. We show a surprising result: Our approach works better with text originating in books, andoutperforms the text originating in images on the task of unseen relationship recognition. It is comparable to themodel which utilizes text originating in images on the task of seen relationship recognition.
1. Introduction
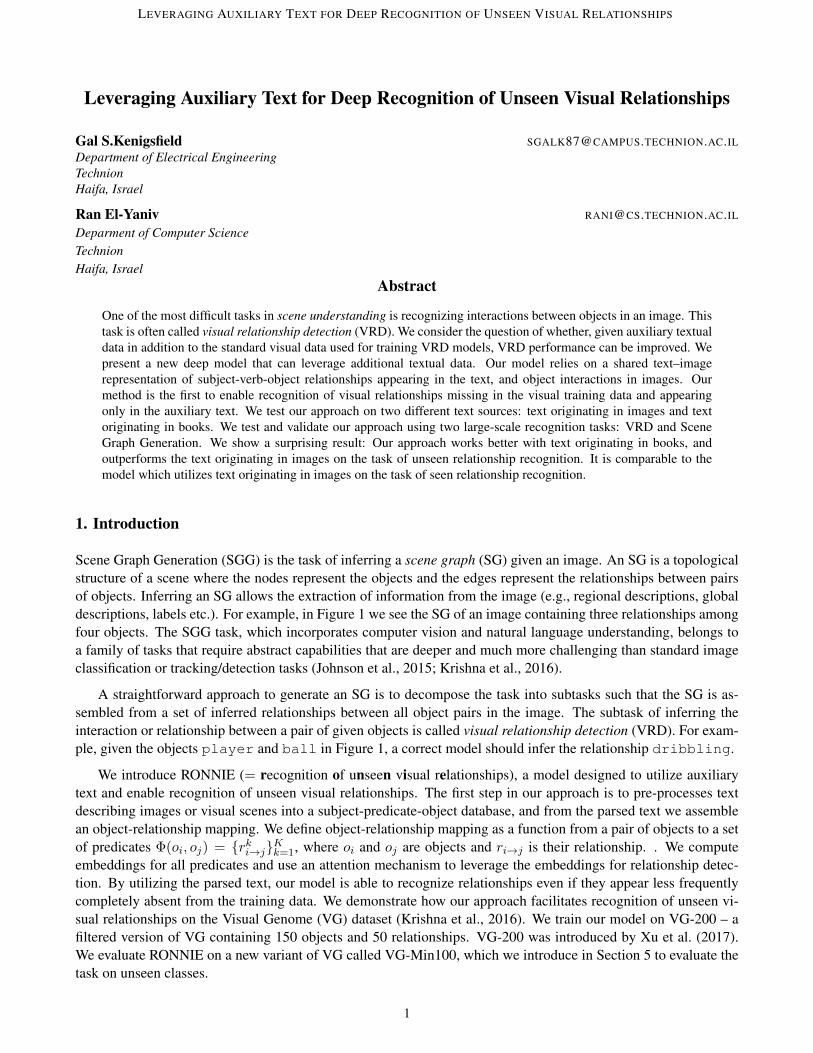
Scene Graph Generation (SGG) is the task of inferring a scene graph (SG) given an image. An SG is a topologicalstructure of a scene where the nodes represent the objects and the edges represent the relationships between pairsof objects. Inferring an SG allows the extraction of information from the image (e.g., regional descriptions, globaldescriptions, labels etc.). For example, in Figure 1 we see the SG of an image containing three relationships amongfour objects. The SGG task, which incorporates computer vision and natural language understanding, belongs toa family of tasks that require abstract capabilities that are deeper and much more challenging than standard imageclassification or tracking/detection tasks (Johnson et al., 2015; Krishna et al., 2016).
A straightforward approach to generate an SG is to decompose the task into subtasks such that the SG is as-sembled from a set of inferred relationships between all object pairs in the image. The subtask of inferring theinteraction or relationship between a pair of given objects is called visual relationship detection (VRD). For exam-ple, given the objects player and ball in Figure 1, a correct model should infer the relationship dribbling.
We introduce RONNIE (= recognition of unseen visual relationships), a model designed to utilize auxiliarytext and enable recognition of unseen visual relationships. The first step in our approach is to pre-processes textdescribing images or visual scenes into a subject-predicate-object database, and from the parsed text we assemblean object-relationship mapping. We define object-relationship mapping as a function from a pair of objects to a setof predicates Φ(oi, oj) = {rk
i→j}Kk=1, where oi and oj are objects and ri→j is their relationship. . We computeembeddings for all predicates and use an attention mechanism to leverage the embeddings for relationship detec-tion. By utilizing the parsed text, our model is able to recognize relationships even if they appear less frequentlycompletely absent from the training data. We demonstrate how our approach facilitates recognition of unseen vi-sual relationships on the Visual Genome (VG) dataset (Krishna et al., 2016). We train our model on VG-200 – afiltered version of VG containing 150 objects and 50 relationships. VG-200 was introduced by Xu et al. (2017).We evaluate RONNIE on a new variant of VG called VG-Min100, which we introduce in Section 5 to evaluate thetask on unseen classes.
1
KENIGSFIELD AND EL-YANIV
player
in front of
man
dribbling ball
Figure 1: Left: an image from VG with ground truth bounding boxes and labels. Right: an example of a scenegraph. The graph contains the objects player and ball. The interaction between them, which we would like toinfer is dribbling, is absent from the training data.
2. Related Work
2.1 Scene Graph Generation
Scene graphs (SGs) were first introduced by Johnson et al. (2015), who utilized them for image retrieval. An SG isa topological description of a scene with the nodes corresponding to objects and the (directed) edges correspondingto the relationship between pairs of objects. An early approach proposed by Lu et al. (2016) detected all theobjects in the scene and later utilized object appearances to detect relationships between objects. Xu et al. (2017)used graph-based inference to propagate information in both directions between objects and relationships. Zellerset al. (2018) investigated recurring structures in VG-SG and employed a global context network to predict thegraphs. They also introduced a strong frequency baseline based on VG statistics. Herzig et al. (2018) proposed apermutation-invariant prediction model.
2.2 Visual Relationship Detection
Early studies in visual relationship detection tended to rely on data statistics (Mensink et al., 2014), or adopt a jointmodel for a relationship triplet (subject-relationship-object). Lu et al. (2016) showed how to utilize a relationshipembedding space from the subject and object appearance model for visual relationship prediction. Zhuang et al.(2017) and Zhang et al. (2017) used visual embedding networks, which embed objects in a low-dimensional spaceand integrate them as context for VRD.
To solve the SGG task, we follow Lu et al. (2016) and decompose it into two independent subtasks: (1) De-tecting the set of N objects, and (2) detecting O(N2) relationships (potentially, between all object pairs). Due tothe complexity of VRD, integrating data from various sources may be necessary. All recent approaches demon-strated success using small vocabularies, e.g., 150 objects and 50 relationships. We introduce a novel approach tointegrating data from various sources and enable scaling VRD onto larger vocabularies.
2.2.1 LARGE-SCALE VISUAL RELATIONSHIP DETECTION
Real-world visual scenes are populated with a vast number of objects and visual relationships. Systems designedto recognize visual relationships are usually limited to a fixed number of pre-defined classes. This limitation is inpart due to the difficulty in acquiring training data as well as sparsity along the long tail of the object-relationshipdistribution.
Zhang et al. (2018) were the first to demonstrate large-scale visual relationship detection by constructing amodel for the challenging VG-80K dataset (see Section 5). Our work is inspired by the seminal paper by Fromeet al. (2013) who showed how to predict the labels of visual objects that were not present in the training set. Thiswas accomplished by utilizing auxiliary word embedding. Our model can be viewed as a substantial extension ofthe Frome et al. (2013) result for relationships (rather than objects).
2

LEVERAGING AUXILIARY TEXT FOR DEEP RECOGNITION OF UNSEEN VISUAL RELATIONSHIPS
3. Problem Formulation
Following Zellers et al. (2018) and Chen et al. (2019), we define an SG for a given image I as a directed graphGIM=
(O,R,B), whereO M= {o1, o2, . . . , on} is a set of (visual) objects appearing in I ,R M= {r1→2, r1→3, . . . , r(n−1)→n}is a set of directed edges representing (non-symmetric) relationships, potentially between all object pairs, andB
M= {b1, b2, . . . , bn} is a set of bounding boxes, where biM= (x, y, w, h) is the bounding box of object oi. The
bounding box definition is standard, with (x, y) being the center coordinates of the box, and w, h its width andheight, respectively. For example, Figure 1 (right) is the SG of the image in Figure 1 (left).
Setting p(G|I) M= p(B,O,R|I), we decompose the probability distribution p(GI |I) of the graph GI into threecomponents:
p(GI |I) = p(B|I)p(O|B, I)p(R|O,B, I). (1)
This decomposition, and the three components, motivate three computation steps that are sufficient for assemblingthe SG. The first term,
p(B|I) = ΠNi=1p(bi|I), (2)
corresponds to the first step whereby the bounding boxes in the image are identified. Given these bounding boxes,the second term,
p(O|B, I) = ΠNi,j=1p(oi|bi), (3)
corresponds to predicting class labels for the objects (within their bounding boxes). The third term,
p(R|O,B, I) = ΠNi=1p(ri→j |oi, oj), (4)
corresponds to the last step where relationships are predicted for object pairs. This task of identifying a relationshipgiven two objects is called visual relationship detection (VRD) (Lu et al., 2016).
Following (Lu et al., 2016; Xu et al., 2017; Zellers et al., 2018; Chen et al., 2019), we consider a supervisedstructure learning approach to generating SGs. Given a set of training examples, Sm
M={(I(i), SG(i)), i = 1 . . .m},where I(i) is an image and SG(i) is its corresponding SG, the goal is to train a model to predict SGs for unseenimages. The common performance measure for both the VRD and SGG tasks is recall at K (R@K) (Lu et al., 2016),which computes the fraction of correctly predicted object-relationship-object triplets among the top-K confidentpredictions.
Recognition of unseen relationships We now formulate the task of recognizing unseen visual relationships,and then describe the evaluation metrics adopted for this task. Given a set of training examples Sm, containing aset of relationships Rtrain, and an auxiliary text corpus T containing a set of relationships RT , we follow the sametraining protocol as for SGG; the only difference is that here we use T to facilitate detection of relationships unseenin Rtrain. To test our model’s effectiveness on the task of recognizing unseen visual relationships, we proposea new variant of VG, called VG-Min100, which is based on a relationship set RMin100 containing relationshipsunseen in Rtrain. At test time we aim to assign the correct relationship r∗ to a pair of objects even though r∗ is notnecessarily contained in Rtrain. We use top-5 accuracy, top-10 accuracy, and R@K as evaluation metrics for ourunseen visual relationship predictions.
4. RONNIE
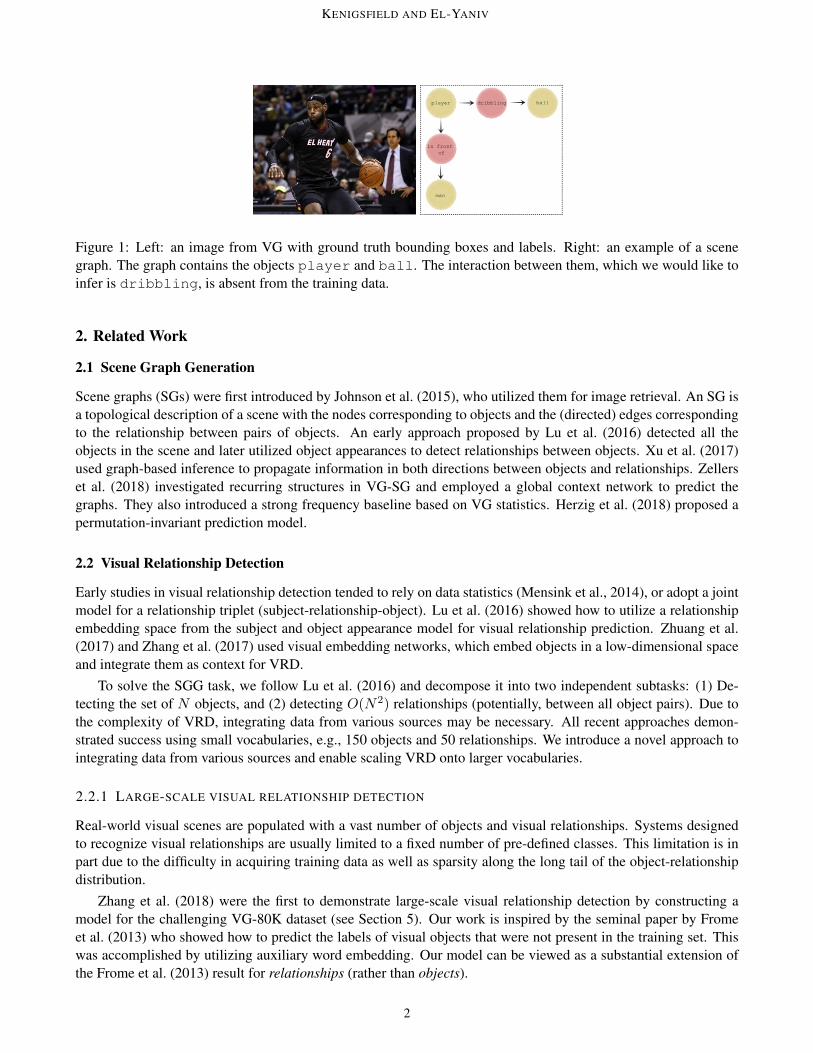
Our method, acronymed RONNIE (= recognition of unseen visual relationships), is schematically illustrated inFigure 2. It comprises four main components: (a) an object detector, (b) an object attention mechanism, (c) anobject-relationship mapping (ORM), and (d) a relationship attention mechanism.
For the object detector, one can use any known detector such as Faster-RCNN (Ren et al., 2015), YOLO(Redmon et al., 2016) or RetinaNet (Lin et al., 2017). We now describe all other (novel) components (we usedFaster-RCNN, see below).
3

KENIGSFIELD AND EL-YANIV
Object Detector
Draw Top M Relationships
Randomly Draw K RelationshipsLorem ipsum
in
stands with
wears
wearing
in wears
manball
shirt
Classification Layer
Neighbor Self Attention
Geometric Encoding
Fi, Bi
Draw Top M Relationships
Randomly Draw K RelationshipsLorem ipsum
in
stands with
wears
wearing
in wears
Neighbor Self Attention
Geometric Encoding
Classification Layer
AuxiliaryText Attention
S, O Self Attention
man ball
shirt
dribbling
wearing
man
ball
shirt
}N }Nx(N-1)
Figure 2: An overview of RONNIE. Our model comprises four components: (1) an object detector, (2) an objectattention mechanism, i.e., neighbor self-attention mechanism, (3) an object-relationship mapping (ORM), and (4)a relationship attention mechanism. An image is fed into an object detector to extract visual features, the visualfeatures of the objects go through a self-attention mechanism and then are classified. At this stage, we pool visualfeatures for the relationships using a CNN. We extract relationship candidates given the object classes we detectedwith the ORM. Lastly, we feed the top-K relationship candidates into a relationship attention mechanism to leveragethe linguistic text and classify the relationships.
4.1 Attention Mechanism
Our model utilizes attention mechanisms for various purposes. We now describe a general attention procedure(Schuster et al., 2015). Let q ∈ Rn be a query sample and, C = [c1, . . . , ck], C ∈ Rk×n, be the context samples.First, we obtain the attention coefficient ai: ai = C · q, ai ∈ R. Next, we calculate the attention weights wi:wi = Softmax(ai), wi ∈ R. The attention vector v = 1
k
∑ki=1wici is the weighted sum of the context vector and
the attention weights. The final vector q′ is a concatenation of the query and attention vector that we fuse using alinear layer:
q′ = Watt · [q, v], q′ ∈ Rn. (5)
Throughout the paper we denote this attention procedure as q′ = A(q, c).
4.2 Detecting Objects
We now describe our object detection methodology. Given an image, the output of the object detector is a setof object proposals, as well as their corresponding bounding boxes, B = {b1, b2, . . . , bn}, with matching visualfeatures, F M= {f1, . . . , fn}, extracted from the detector, such that fi ∈ Rd (so F 0 ∈ Rn×d). To enrich F , weutilize two elements: (1) spatial information, and (2) a self-attention mechanism over neighboring visual features,i.e., neighbor self-attention. To combine spatial information with the visual features, we project each bounding boxquadruplet (x, y, w, h) (recall that x and y are the center coordinates of the bounding box, w is the width, and his the height), using a single linear layer fB(B) = B ·Wspat + bspat, where, B ∈ Rn×4 and Wspat ∈ R4×r. The
4

LEVERAGING AUXILIARY TEXT FOR DEEP RECOGNITION OF UNSEEN VISUAL RELATIONSHIPS
enriched spatial and visual feature vector, F ′, is obtained by concatenation, F ′ M= [F, fB(B)]1, so F ′ ∈ Rn×(d+r).To further enhance F , we employ a self-attention mechanism (Vaswani et al., 2017) over the visual features. Each{f1
i }ni=1 ∈ F 1 interacts with its neighboring visual features, {f11 , f
12 , . . . , f
1n}nk=1,k 6=i, as follows.
f ′i = Aobj,self (fi, [f1, . . . , fj ,n ]). (6)
We apply this mechanism to all bounding boxes such that F ′ = [f ′1, . . . , f ′n]. Our final object prediction is O =Softmax(Wo · F ′ + bo), where Wo ∈ Rn×|O|.
4.3 Object-Relationships Mapping
Our model relies on utilizing auxiliary text. We consider two different sources of auxiliary text: (1) text describingimages from various captioned image datasets (Krishna et al., 2016; Lin et al., 2014; Plummer et al., 2015), de-noted as RONNIE , and (2) text from books taken from Project Gutenberg (Lebert, 2008) denoted as RONNIEgut
. We follow Schuster et al. (2015), and parse the text into subject-relationship-object (s-r-o) triplets. For ex-ample, in Figure 1, player is the subject, dribbling is the relationship, and ball is the object. Denotingthe subject-relationship-object distribution in the auxiliary text by P , we can express and estimate the empiricalsubject-relationship-object distribution, P , using standard counting statistics,
P (rs→o|s, o)M= Count(s− r − o)
Count(s− o) . (7)
We define an object-relationship mapping that maps object pairs to a set of relationships and their correspondingprobabilities,
Φ: S ×O → {(RS→O, P (RS→O|S,O))}, (8)
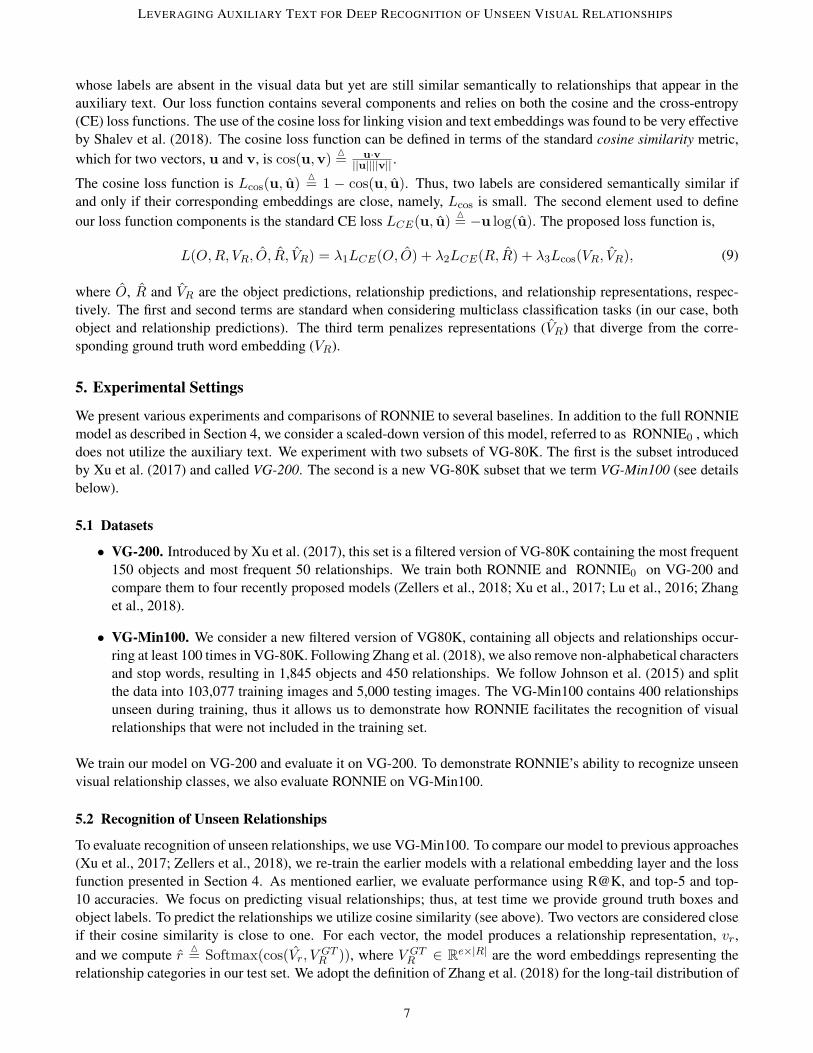
where S and O are the set of object categories,RS→O is the set of relationships, and P (RS→O|S,O)} is their cor-responding probabilities; for example, consider an object pair from Figure 3(a): Φ(man, helmet) = {’wearing’:0.54,. . . , ’stands with’:1e-4}. To utilize the output of Φ, we use a pre-trained word embedding model introducedby Mikolov et al. (2013), such that the output of the object-relationship mapping, RS→O, is fed into an embeddinglayer, namely, a relational embedding layer.
4.4 How to Recognize Relationships
To facilitate recognition of visual relationships we combine three elements that enrich the visual features: (1)geometric encoding, to better express geometric relationships, (2) an object-relationship mapping that maps ob-ject pairs to a set of relationship candidates extracted from the auxiliary text, and (3) a subject-object attentionmechanism, which utilizes the objects’ visual features. First, we extract visual features from the union of all corre-sponding bounding boxes {bi∪bj}N×(N−1)
i,j=1,i 6=j . We pool the visual features, fi→j , by applying an ROI-Align function,a two-layer convolutional neural network (CNN) and a single linear layer, fi→j ∈ Rd. We denote the set of visualfeatures by Fi→j
M= [f01→2, f
01→3, . . . , f
0(n−1)→n], where Fi→j ∈ Rm×d.
4.4.1 GEOMETRIC ENCODING
Many relationships appearing in datasets such as VG-200 are geometric (Zellers et al., 2018), e.g., under, ontop of, next to. Following Hu et al. (2018), to support recognition of geometric relationships, we utilize ageometric relationship encoding, gi→j = [xi−xj
wi,
yi−yj
hi,
wj
wi,
hj
hi] ·Wgeo + bgeo, where Wgeo ∈ R4×r is a learned
weight matrix, vg ∈ Rr, and (xi, yi, wi, hi), (xj , yj , wj , hj) are the subject and object bounding boxes, respectively.We denote the set of geometric encoding features gi→j ∈ Rr, and apply concatenation of these features such that,f ′i→j = [fi→j , gi→j ], where F ′i→j ∈ Rm×(d+r).
1. All concatenation operations are column-wise concatenation unless stated otherwise.
5

KENIGSFIELD AND EL-YANIV
4.4.2 AUXILIARY TEXT UTILIZATION
We now describe how to utilize the auxiliary text, which is a key element of this work. The intuition is that fusionof the auxiliary text into the SGG training process facilitates recognition of unseen relationships. We use objectrelationship mapping (Φ) to combine information from the text with the visual information. Consider Figure 3(a).The set of object detections in the given image is O, where oi signifies man, and oj signifies helmet. We mapall possible object pairs {oi, oj}Ni,j=1 using Φ. We obtain Ri→j = Φ(oi, oj) = {rk
ij , pkij} – that is, the set of
relationships and their probabilities. Using {pki→j}Kk=1, we rank the relationship candidates in descending order,
and randomly draw a subset of k relationships from the top-M relationships to prevent our model from stagnating.Next we feed the relationship candidates to a relational embedding layer. The output of the relational embeddinglayer is a distributed word representation, {vk
ri→j}Kk=1, where vk
ri→j∈ Re. The relational embeddings are then
projected into the dimension of F ′i→j by using a single linear layer, Vri→j = [v0ri→j
, v1ri→j
, . . . , vkri→j
] ·Wtxt + btxt,where Wtxt ∈ Re×(d+r), and Vri→j ∈ Rk×(d+r). To leverage the relational embeddings with the visual features,we apply an attention mechanism f ′′i→j = Arel,aux(f ′i→j , Vri→j ).
}Nx(N-1)
Map Pair With ORM
Draw Top-M Relationships
Randomly Draw K Relationships from the Top-M Relationships
man helmet
in
stands with
wears
wearing
in wears
(a) Left: an image from VG with its ground truth bounding boxes. Right:for each pair of objects we perform the procedure illustrated on the right toextract relationships from the auxiliary text. We perform three steps: (1) feedthe subject-object pair to φ(·), (2) rank the top M relationships from φ, and (3)randomly draw K relationships from the top-M relationships.
wearshat woman
next to
man
wearshat woman
next to
man
(b) Left: an image from VG. Right: an SG obtainedby RONNIE without a subject-object attention mecha-nism; the triplet {hat,wearing,woman} in bold isa obviously the result of subject-object confusion. Onthe bottom right: an SG obtained by RONNIE witha subject-object attention mechanism that was able toovercome this confusion.
Figure 3
4.5 Subject-Object Confusion
In the process of relationship detection we propose the union of possible pairs of bounding boxes as ROIs forthe visual relationship. One problem that arises from this procedure is subject-object confusion. In Figure 3(b),the left graph is obtained by RONNIE without a subject-object attention mechanism and we can see that there isconfusion between the subject woman and object hat. To resolve this problem we propose our subject-objectattention mechanism. For each union of bounding boxes, we apply an attention mechanism such that f
′′′i→j =
Arel,s−o(f ′′i→j , [[f ′i , fj ], [fj , fi]]. Our final relationships prediction is R = Softmax(Wr ·F
′′′i→j + br). We also train
an embedding layer for unseen relationship recognition (see Section 5), such that Vr = Wr,e · F′′′i→j + br,e
4.6 Loss Function
Our loss function is designed to optimize both SG generation and recognition of unseen visual relationships byleveraging the availability of auxiliary text. The main idea is to encourage our model to learn visual relationshiprepresentations that are similar to text-induced representations. Such representations enable inferring relationships
6
LEVERAGING AUXILIARY TEXT FOR DEEP RECOGNITION OF UNSEEN VISUAL RELATIONSHIPS
whose labels are absent in the visual data but yet are still similar semantically to relationships that appear in theauxiliary text. Our loss function contains several components and relies on both the cosine and the cross-entropy(CE) loss functions. The use of the cosine loss for linking vision and text embeddings was found to be very effectiveby Shalev et al. (2018). The cosine loss function can be defined in terms of the standard cosine similarity metric,which for two vectors, u and v, is cos(u,v) M= u·v
||u||||v|| .
The cosine loss function is Lcos(u, u) M= 1 − cos(u, u). Thus, two labels are considered semantically similar ifand only if their corresponding embeddings are close, namely, Lcos is small. The second element used to defineour loss function components is the standard CE loss LCE(u, u) M= −u log(u). The proposed loss function is,
L(O,R, VR, O, R, VR) = λ1LCE(O, O) + λ2LCE(R, R) + λ3Lcos(VR, VR), (9)
where O, R and VR are the object predictions, relationship predictions, and relationship representations, respec-tively. The first and second terms are standard when considering multiclass classification tasks (in our case, bothobject and relationship predictions). The third term penalizes representations (VR) that diverge from the corre-sponding ground truth word embedding (VR).
5. Experimental Settings
We present various experiments and comparisons of RONNIE to several baselines. In addition to the full RONNIEmodel as described in Section 4, we consider a scaled-down version of this model, referred to as RONNIE0 , whichdoes not utilize the auxiliary text. We experiment with two subsets of VG-80K. The first is the subset introducedby Xu et al. (2017) and called VG-200. The second is a new VG-80K subset that we term VG-Min100 (see detailsbelow).
5.1 Datasets
• VG-200. Introduced by Xu et al. (2017), this set is a filtered version of VG-80K containing the most frequent150 objects and most frequent 50 relationships. We train both RONNIE and RONNIE0 on VG-200 andcompare them to four recently proposed models (Zellers et al., 2018; Xu et al., 2017; Lu et al., 2016; Zhanget al., 2018).
• VG-Min100. We consider a new filtered version of VG80K, containing all objects and relationships occur-ring at least 100 times in VG-80K. Following Zhang et al. (2018), we also remove non-alphabetical charactersand stop words, resulting in 1,845 objects and 450 relationships. We follow Johnson et al. (2015) and splitthe data into 103,077 training images and 5,000 testing images. The VG-Min100 contains 400 relationshipsunseen during training, thus it allows us to demonstrate how RONNIE facilitates the recognition of visualrelationships that were not included in the training set.
We train our model on VG-200 and evaluate it on VG-200. To demonstrate RONNIE’s ability to recognize unseenvisual relationship classes, we also evaluate RONNIE on VG-Min100.
5.2 Recognition of Unseen Relationships
To evaluate recognition of unseen relationships, we use VG-Min100. To compare our model to previous approaches(Xu et al., 2017; Zellers et al., 2018), we re-train the earlier models with a relational embedding layer and the lossfunction presented in Section 4. As mentioned earlier, we evaluate performance using R@K, and top-5 and top-10 accuracies. We focus on predicting visual relationships; thus, at test time we provide ground truth boxes andobject labels. To predict the relationships we utilize cosine similarity (see above). Two vectors are considered closeif their cosine similarity is close to one. For each vector, the model produces a relationship representation, vr,and we compute r M= Softmax(cos(Vr, V
GTR )), where V GT
R ∈ Re×|R| are the word embeddings representing therelationship categories in our test set. We adopt the definition of Zhang et al. (2018) for the long-tail distribution of
7

KENIGSFIELD AND EL-YANIV
visual relationships in VG, namely, rare relationships, with less than 1,024 instances. We follow the same split ofVG-80K as described in Zhang et al. (2018) regarding VG-Min100.
5.3 Scene Graph Generation
For VG-200, we use the same evaluation protocol used by Zellers et al. (2018) and Xu et al. (2017) who consideredthe following two tasks. In the first task, denoted Pred-Cls, the goal is to predict relationship labels, given thecorrect labels for subjects and objects. The objective in the second and harder task, denoted SG-Cls, is to predictsubject and object labels, given their correct bounding boxes as input. In addition, correct relationships must bepredicted.
6. Results
6.1 Recognition of Unseen Relationships
The task of recognizing unseen relationships is the main focus of this paper. Our results for RONNIE and thebaselines appear in Table 1. The table has two sections for all relationships (both seen and unseen) from the VG-Min100 dataset, and for rare (long-tail) unseen relationships. The table presents R@K, top-5 and top-10 accuracyresults for RONNIE and for all baselines. It is evident that RONNIE has no competition at all in both typesof relationships. Moreover, in the case of rare relationships, none of the baselines including RONNIE0 yieldsmeaningful results despite the enhancements we applied to them (see Section 4). Lastly, consider the two last rowsin Table 1 as a comparison between the two text sources. This result is particularly interesting as it shows that textoriginating in prose (books) has clear advantage (using our model) over text originating in image captions.
Model Top-5 Top-10 R@50 R@100All Classes
Motifs 68.5 74.3 52 55RONNIE0 74.5 79.8 57 62RONNIE 78 82.4 65 69
RONNIEgut 78.25 81.87 62 66.5Rare Relationships
Top-5Motifs 22
RONNIE0 30RONNIE 37.9
RONNIEgut 44.4
Table 1: SGG results on VG-200.
SG-Cls Pred-ClsModel R@50 R@100 R@50 R@100LP Lu et al. (2016) 11.8 14.1 27.9 35IM Xu et al. (2017) 21.7 24.4 44.8 53Motifs Zellers et al. (2018) 35.8 36.5 65.2 67.1LS Zhang et al. (2018) 36.7 36.7 68.4 68.7RONNIE0 36.2 37 67.9 68RONNIE 37 37.7 68 69.1RONNIE gut 36.4 37.5 68 68.9
Table 2: Results on VG-Min100. All classes refer to allvisual relationships with # occurrences > 1, 024. Thelong-tail classes follow Zhang et al. (2018)’s definition# occurrences < 1, 024.
6.2 Scene Graph Generation
In Table 2, we present results achieved by RONNIE on VG-200. We compare its performance to four previousmethods (Lu et al., 2016; Xu et al., 2017; Zellers et al., 2018; Zhang et al., 2018), all of which do not utilizeauxiliary text (see Section 2). To examine the effect of utilizing the auxiliary text with object-relationship mapping,consider the second-to-last row in Table 1. On the SG-Cls task, RONNIE achieved an R@100 of 37.7, and anR@50 of 37, outperforming all baselines. In general, it is evident that RONNIE is slightly better than all baselinemethods at SGG. We emphasize, however, that RONNIE is using auxiliary text that cannot be utilized by the othercontenders.
8

LEVERAGING AUXILIARY TEXT FOR DEEP RECOGNITION OF UNSEEN VISUAL RELATIONSHIPS
readinggirl-1 book-1
behind
chair-1 sticker-1
on
man-1 paper-1
arm-1
reading
has
under umbrella-1
player-1 racket-1holding
ball-1
swinging at
girl-1chair-1
sticker-1
book-1
man-1
arm-1
unbrella-1
paper-1
racket-1
player-1
ball-1
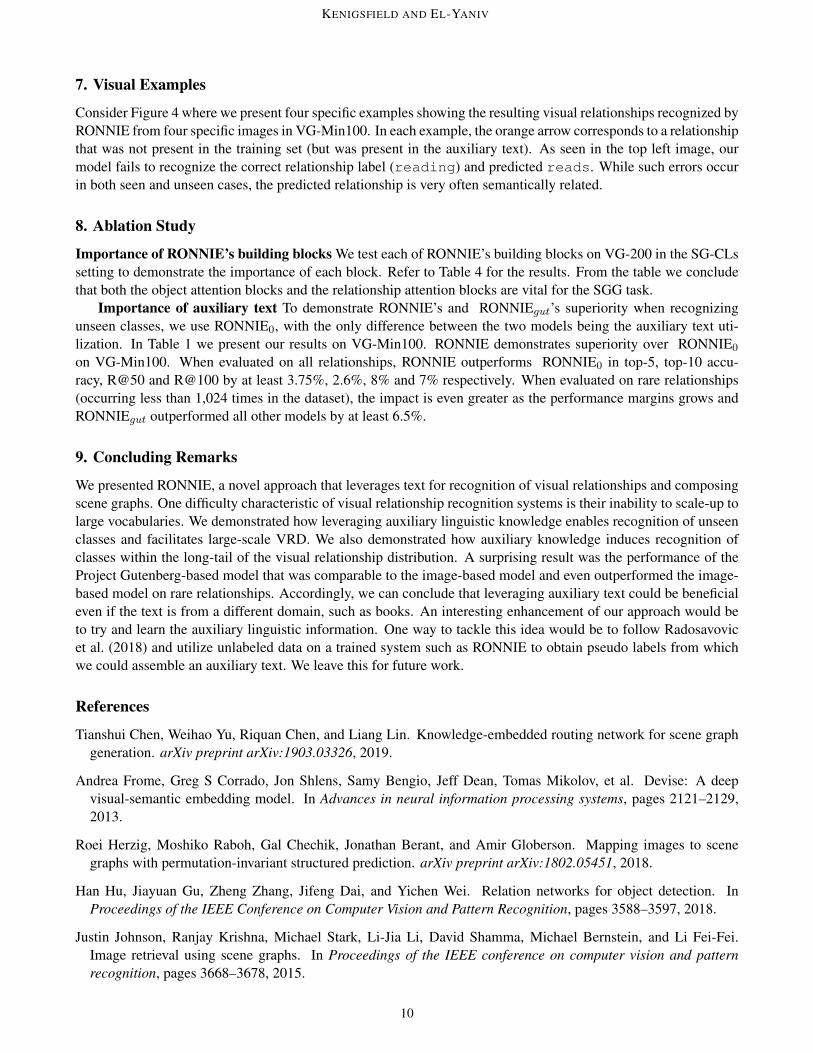
Figure 4: Qualitative results from our RONNIE model. The blue circle is unseen relationship class recognized byRONNIE and the red circles are seen classes.
Mechanism R@50 R@100
Objectattention
Geometricencoding
Relationshipgeometricencoding
Subject-object
attentionX 35.5 36.3X X 35.6 36.3X X X 36 36.7X X X X 36.2 37
Table 3: Results of the SG-CLs setup on VG-200. For each row we add a mechanism, asdescribed in Section 4, to our baseline model.
Relationship Top-5 acc # synonyms# synonyms
instancesdriving on 96 2 2,004parked in 77.6 12 6,556
growing in 57 6 3,664riding on 46.6 3 525hold up 27.3 6 45,580
standing by 7.3 14 20,630connected 25 1 10,096
cutting 50 0 874standing behind 25.8 14 20,603
walking 22.3 14 9,343
Table 4: Results of the top 10 relationships inthe long-tail distribution. The metric we useis top-5 accuracy.
6.2.1 EXAMINING SPECIFIC RARE RELATIONSHIPS
In this section we focus on specific rare relationships. Of the set of rare relationships whose occurrence count inthe entire dataset was less than 1,024, we inspect the top 10. Consider Table 3 showing the top-5 test accuracy inpredicting each rare relationships. For example, row 11 corresponds to the standing by relationship, which has14 near-synonyms in VG-Min100 (e.g., standing on, standing on top of, standing, standingnext to). Our method was able to recognize this relationship with a low 7.3% top-5 accuracy. This poor perfor-mance is perhaps not surprising given the relatively large number of near-synonyms, and the number of times theyappear in the dataset (see the last column of Table 2). Moreover, one of these synonyms, namely, standing on,appears extremely frequently in the VG-Min100 dataset (14, 185 instances). In contrast, the relationship drivingon, on which RONNIE achieved a top-5 accuracy of 96%, has only two other near-synonyms (driving anddriving down) that are also rare. While these extreme cases may hint that there is some regularity in the func-tional relationship between accuracy achieved and the number of synonyms and their occurrence rate, we notethat there exist severe failures even in cases where there are few rare synonyms, or no synonyms at all (see, e.g.,cutting).
9
KENIGSFIELD AND EL-YANIV
7. Visual Examples
Consider Figure 4 where we present four specific examples showing the resulting visual relationships recognized byRONNIE from four specific images in VG-Min100. In each example, the orange arrow corresponds to a relationshipthat was not present in the training set (but was present in the auxiliary text). As seen in the top left image, ourmodel fails to recognize the correct relationship label (reading) and predicted reads. While such errors occurin both seen and unseen cases, the predicted relationship is very often semantically related.
8. Ablation Study
Importance of RONNIE’s building blocks We test each of RONNIE’s building blocks on VG-200 in the SG-CLssetting to demonstrate the importance of each block. Refer to Table 4 for the results. From the table we concludethat both the object attention blocks and the relationship attention blocks are vital for the SGG task.
Importance of auxiliary text To demonstrate RONNIE’s and RONNIEgut’s superiority when recognizingunseen classes, we use RONNIE0, with the only difference between the two models being the auxiliary text uti-lization. In Table 1 we present our results on VG-Min100. RONNIE demonstrates superiority over RONNIE0on VG-Min100. When evaluated on all relationships, RONNIE outperforms RONNIE0 in top-5, top-10 accu-racy, R@50 and R@100 by at least 3.75%, 2.6%, 8% and 7% respectively. When evaluated on rare relationships(occurring less than 1,024 times in the dataset), the impact is even greater as the performance margins grows andRONNIEgut outperformed all other models by at least 6.5%.
9. Concluding Remarks
We presented RONNIE, a novel approach that leverages text for recognition of visual relationships and composingscene graphs. One difficulty characteristic of visual relationship recognition systems is their inability to scale-up tolarge vocabularies. We demonstrated how leveraging auxiliary linguistic knowledge enables recognition of unseenclasses and facilitates large-scale VRD. We also demonstrated how auxiliary knowledge induces recognition ofclasses within the long-tail of the visual relationship distribution. A surprising result was the performance of theProject Gutenberg-based model that was comparable to the image-based model and even outperformed the image-based model on rare relationships. Accordingly, we can conclude that leveraging auxiliary text could be beneficialeven if the text is from a different domain, such as books. An interesting enhancement of our approach would beto try and learn the auxiliary linguistic information. One way to tackle this idea would be to follow Radosavovicet al. (2018) and utilize unlabeled data on a trained system such as RONNIE to obtain pseudo labels from whichwe could assemble an auxiliary text. We leave this for future work.
References
Tianshui Chen, Weihao Yu, Riquan Chen, and Liang Lin. Knowledge-embedded routing network for scene graphgeneration. arXiv preprint arXiv:1903.03326, 2019.
Andrea Frome, Greg S Corrado, Jon Shlens, Samy Bengio, Jeff Dean, Tomas Mikolov, et al. Devise: A deepvisual-semantic embedding model. In Advances in neural information processing systems, pages 2121–2129,2013.
Roei Herzig, Moshiko Raboh, Gal Chechik, Jonathan Berant, and Amir Globerson. Mapping images to scenegraphs with permutation-invariant structured prediction. arXiv preprint arXiv:1802.05451, 2018.
Han Hu, Jiayuan Gu, Zheng Zhang, Jifeng Dai, and Yichen Wei. Relation networks for object detection. InProceedings of the IEEE Conference on Computer Vision and Pattern Recognition, pages 3588–3597, 2018.
Justin Johnson, Ranjay Krishna, Michael Stark, Li-Jia Li, David Shamma, Michael Bernstein, and Li Fei-Fei.Image retrieval using scene graphs. In Proceedings of the IEEE conference on computer vision and patternrecognition, pages 3668–3678, 2015.
10

LEVERAGING AUXILIARY TEXT FOR DEEP RECOGNITION OF UNSEEN VISUAL RELATIONSHIPS
Ranjay Krishna, Yuke Zhu, Oliver Groth, Justin Johnson, Kenji Hata, Joshua Kravitz, Stephanie Chen, YannisKalantidis, Li-Jia Li, David A Shamma, Michael Bernstein, and Li Fei-Fei. Visual genome: Connecting languageand vision using crowdsourced dense image annotations. 2016. URL https://arxiv.org/abs/1602.07332.
Marie Lebert. Le Projet Gutenberg (1971-2008). Project Gutenberg, 2008.
Tsung-Yi Lin, Michael Maire, Serge Belongie, James Hays, Pietro Perona, Deva Ramanan, Piotr Dollár, andC Lawrence Zitnick. Microsoft coco: Common objects in context. In European conference on computer vision,pages 740–755. Springer, 2014.
Tsung-Yi Lin, Priya Goyal, Ross Girshick, Kaiming He, and Piotr Dollár. Focal loss for dense object detection. InProceedings of the IEEE international conference on computer vision, pages 2980–2988, 2017.
Cewu Lu, Ranjay Krishna, Michael Bernstein, and Li Fei-Fei. Visual relationship detection with language priors.In European Conference on Computer Vision, pages 852–869. Springer, 2016.
Thomas Mensink, Efstratios Gavves, and Cees GM Snoek. Costa: Co-occurrence statistics for zero-shot classifi-cation. In Proceedings of the IEEE Conference on Computer Vision and Pattern Recognition, pages 2441–2448,2014.
Tomas Mikolov, Ilya Sutskever, Kai Chen, Greg S Corrado, and Jeff Dean. Distributed representations of words andphrases and their compositionality. In Advances in neural information processing systems, pages 3111–3119,2013.
Bryan A Plummer, Liwei Wang, Chris M Cervantes, Juan C Caicedo, Julia Hockenmaier, and Svetlana Lazeb-nik. Flickr30k entities: Collecting region-to-phrase correspondences for richer image-to-sentence models. InProceedings of the IEEE international conference on computer vision, pages 2641–2649, 2015.
Ilija Radosavovic, Piotr Dollár, Ross Girshick, Georgia Gkioxari, and Kaiming He. Data distillation: Towardsomni-supervised learning. In Proceedings of the IEEE Conference on Computer Vision and Pattern Recognition,pages 4119–4128, 2018.
Joseph Redmon, Santosh Divvala, Ross Girshick, and Ali Farhadi. You only look once: Unified, real-time objectdetection. In Proceedings of the IEEE conference on computer vision and pattern recognition, pages 779–788,2016.
Shaoqing Ren, Kaiming He, Ross Girshick, and Jian Sun. Faster r-cnn: Towards real-time object detection withregion proposal networks. In Advances in neural information processing systems, pages 91–99, 2015.
Sebastian Schuster, Ranjay Krishna, Angel Chang, Li Fei-Fei, and Christopher D Manning. Generating semanti-cally precise scene graphs from textual descriptions for improved image retrieval. In Proceedings of the fourthworkshop on vision and language, pages 70–80, 2015.
Gabi Shalev, Yossi Adi, and Joseph Keshet. Out-of-distribution detection using multiple semantic label represen-tations. In Advances in Neural Information Processing Systems, pages 7386–7396, 2018.
Ashish Vaswani, Noam Shazeer, Niki Parmar, Jakob Uszkoreit, Llion Jones, Aidan N Gomez, Łukasz Kaiser,and Illia Polosukhin. Attention is all you need. In Advances in Neural Information Processing Systems, pages5998–6008, 2017.
Danfei Xu, Yuke Zhu, Christopher B Choy, and Li Fei-Fei. Scene graph generation by iterative message passing.In Proceedings of the IEEE Conference on Computer Vision and Pattern Recognition, volume 2, 2017.
Rowan Zellers, Mark Yatskar, Sam Thomson, and Yejin Choi. Neural motifs: Scene graph parsing with globalcontext. In Conference on Computer Vision and Pattern Recognition, 2018.
11

KENIGSFIELD AND EL-YANIV
Hanwang Zhang, Zawlin Kyaw, Shih-Fu Chang, and Tat-Seng Chua. Visual translation embedding network forvisual relation detection. In Proceedings of the IEEE conference on computer vision and pattern recognition,pages 5532–5540, 2017.
Ji Zhang, Yannis Kalantidis, Marcus Rohrbach, Manohar Paluri, Ahmed Elgammal, and Mohamed Elhoseiny.Large-scale visual relationship understanding. arXiv preprint arXiv:1804.10660, 2018.
Bohan Zhuang, Lingqiao Liu, Chunhua Shen, and Ian Reid. Towards context-aware interaction recognition forvisual relationship detection. In Proceedings of the IEEE International Conference on Computer Vision, pages589–598, 2017.
12