leveraging clinical data for public health and ... document has not been subjected to ... clinical...
TRANSCRIPT

0
0
Leveraging Clinical Data for Public Health and Hypertension Surveillance
January 2018

1
Leveraging Clinical Data for Public Health and Hypertension Surveillance
Acknowledgments This report was made possible through cooperative agreement no. #U38OT000216 from the Centers for Disease Control and Prevention (CDC). This document has not been subjected to agency review and approval for publication as a CDC report. The content of this document should not be interpreted as official CDC approval, endorsements, or recommendations. The Public Health Informatics Institute (PHII) is grateful for the contributions of collaborators at AllianceChicago, City of Chicago Health Department, Illinois Department of Public Health, Regenstrief Institute, Indiana Network for Patient Care, and the Marion County Public Health Department in Indiana. These organizations have shared experiences and insights that inform the guidance offered in this document.

2
Leveraging Clinical Data for Public Health and Hypertension Surveillance
Table of Contents Executive Summary .................................................................................................................... 3 Introduction ............................................................................................................................... 5 Overview of Clinical Systems ............................................................................................................ 6 Opportunities with Electronic Health Records and Clinical Quality Measurement .......................... 6 EHRs and Chronic Disease Surveillance............................................................................................. 7
Table 1: EHR-Based Surveillance Information Lifecycle ............................................................ 8
Public Health Surveillance Approaches ....................................................................................... 9 Figure 1: Overview of Clinical Data Repository’s Role in Generating Disease Prevalence Indicators ................................................................................................................................ 10
Table 2: Steps for Disease Prevalence Indicator Generation, Hypertension Example ............ 11
Analyzing Clinical Data and Workflows ..................................................................................... 11 Data Capture ................................................................................................................................... 11 Data Extract, Transform, and Load ................................................................................................. 12 Hypertension Example .................................................................................................................... 14
Table 3: Questions and Considerations for Hypertension ...................................................... 14
Validity and Reliability of Patient-Level Data .................................................................................. 15 Optimizing Data Quality and Use .............................................................................................. 15 Data Analysis ................................................................................................................................... 15 Hypertension Example .................................................................................................................... 17
Table 3: Summary of Population Cohort Data Set .................................................................. 17
Defining a case definition algorithm ....................................................................................... 18
Table 4: Select Million Hearts Clinical Quality Measure Alignment for Hypertension Control ................................................................................................................................................ 18
Figure 2: Use of Hypertension Control Quality Measure Data for Hypertension Prevalence . 19
Table 5: Data Options for Hypertension Case Definition Algorithms (Inclusion Criteria) ....... 19
Table 6: Sample Hypertension Control Denominator Algorithm ............................................ 20
Table 7: Sample Hypertension Control Numerator Algorithm ................................................ 20
Calculating prevalence rates ................................................................................................... 20
Table 8: Example Hypertension Prevalence Calculations ....................................................... 21
Validity and Reliability of Population-Level Data ............................................................................ 21 Assessing Query Results .......................................................................................................... 21
Comparing Prevalence to Gold Standard ................................................................................ 22
Conclusion ................................................................................................................................ 23 Appendix A: Select Examples of Existing Chronic Disease Surveillance Data Sources ................ 24 Appendix B: Sample Hypertension Algorithms ......................................................................... 25

3
Leveraging Clinical Data for Public Health and Hypertension Surveillance
Executive Summary The purpose of this document is to provide guidance to public health agencies seeking to implement chronic disease surveillance using electronic health record (EHR) data, including considerations that should be discussed with clinical health information technology (IT) stakeholders, and suggest approaches for evaluating the reliability and validity of EHR-based surveillance indicators. While this document should aid planning for any chronic disease surveillance program, it utilizes specifics related to hypertension to illustrate important considerations. EHRs have the potential to improve chronic disease surveillance and management. While there are several useful models for data exchange between EHRs and public health systems, an emphasis is placed here on leveraging clinical data repositories and clinical quality data for public health surveillance purposes. As part of the HITECH Act and CMS EHR Incentive program known as “Meaningful Use,” electronic clinical quality measures, or eCQMs, were promulgated as the standard EHR data format for population-level health indicators and quality reporting. These eCQMs include measures endorsed by the National Quality Forum, such as NQF #0018, Hypertension: Controlling High Pressure. This document references NQF #0018 as an example of an eCQM that can be used for chronic disease surveillance. The Million Hearts initiative has encouraged the use of clinical quality measures by clinicians and health care systems to address the “ABCS” of cardiovascular disease prevention: aspirin when appropriate, blood pressure control, cholesterol management, and smoking cessation. NQF #0018 is the most reported Million Hearts clinical quality measure, with 26-27% of eligible health care providers reporting data. EHR systems and clinical data repositories can provide public health agencies with data for surveillance purposes. This can be done through various data exchange models including a push model, in which a clinical entity sends data to a public health agency in response to pre-determined criteria, and a pull model, in which a public health agency can submit a data query to an EHR system or clinical data repository. This document focuses on a pull surveillance model in which eCQM data reflecting aggregated case counts are extracted from clinical data repositories and shared with public health. It is important to assess the clinical processes used to capture patient data in an EHR and load them into a clinical data repository. Many providers are unaware that the data they enter in the EHR might later be used for public health surveillance purposes, so long as patient privacy requirements are met. An understanding of data capture context, including who is collecting the data and why, will help determine the level of confidence in the data and improve interpretation. Prior to storage in a clinical data repository or HIE, data are extracted from the original data source, which may include multiple EHR, pharmacy, and laboratory systems. These data are often then transformed to a format optimized for storage and loaded into the clinical data repository. Information technology professionals refer to this process as

4
Leveraging Clinical Data for Public Health and Hypertension Surveillance
data extract, transform, and load (ETL), and it may introduce issues impacting the suitability of the data for public health surveillance purposes. To conduct chronic disease surveillance, there is a need to develop case definition algorithms that detect, aggregate, and report patient data reflecting diseases or conditions of interest. Public health agencies should consider aligning chronic disease algorithms to those already used by clinicians, such as eCQMs and others used for clinical quality reporting. Measure alignment can increase the number of EHR systems that can provide data, as vendors are more likely to include commonly used clinical quality measures in their products. NQF #0018, Hypertension: Controlling High Blood Pressure is defined as the percentage of patients aged 18 through 85 years who had a diagnosis of hypertension and whose blood pressure was adequately controlled (<140/90) during the measurement period. This document illustrates how NQF #0018 data could be used to calculate hypertension prevalence rates for public health purposes if it deems there are sufficient clinical repository data to provide adequate representation of the agency’s jurisdiction. Assessing EHR data validity for surveillance of hypertension or other chronic diseases entails consideration of data issues at both the patient level and population level. Patient-level validation involves sampling patient records and reviewing the data to confirm that a patient record in a clinical data repository matches the source patient data extracted from the EHR. Population-level validation should entail comparing EHR-based prevalence measures to existing prevalence indicators, such as BRFSS, to determine if outcomes met expectations. EHRs can be used for chronic disease surveillance, but implementation requires careful consideration of each step of the data flow process. Prior to the receipt of data reports from a clinical data repository, it is important to understand how data are captured and stored. It is also necessary to experiment with procedures for assessing the reliability and validity of the individual patient data, case detection algorithms, and population-based prevalence measures. This holds true for public health agencies that receive data transmissions that must be interfaced into their surveillance systems as well as agencies that receive disease prevalence indicators developed by partners. Public health agencies and collaborators in health care and HIE organizations are implementing and evaluating different techniques for surveillance of hypertension and other chronic diseases. Traditional surveillance data sources will need to be maintained as the practice of EHR-based public health surveillance matures. As these efforts unfold and experience grows, the guidance reflected in this document will evolve accordingly.

5
Leveraging Clinical Data for Public Health and Hypertension Surveillance
Introduction Chronic diseases are consistently ranked as the leading causes of mortality in the world.1 Currently in the United States, seven of the top ten causes of death are due to chronic diseases, which include heart disease, cancer, diabetes, obesity, and arthritis.2 In 2014, heart disease and cancer together caused 45.9% of all deaths.3 Although chronic diseases lead in the causes of mortality, they are also among the most preventable of health problems with proper management of health risk behaviors. The purpose of this document is to provide guidance to public health agencies seeking to implement chronic disease surveillance using electronic health record (EHR) data. This document will describe the considerations that should be discussed with clinical health information technology (IT) stakeholders and suggest approaches for evaluating the reliability and validity of EHR-based surveillance indicators. Health care organizations and public health agencies are developing a variety of techniques for data exchange supporting chronic disease surveillance. At this early stage of development, it is premature to recommend a single best approach. Instead, this guidance is intended to help implementers better understand options. Electronic health records have the potential to improve chronic disease surveillance and management. More timely and localized chronic disease indicators can be generated from EHRs. Also, EHRs create opportunities for case management through integration with data reflecting patients’ social determinants of health. While this document references different models for data exchange between EHRs and public health systems, an emphasis is placed on leveraging clinical data repositories and their capability to generate clinical quality data that can be used for public health surveillance purposes. While this document should aid planning for any chronic disease surveillance program, it will utilize specifics related to hypertension to illustrate important considerations. Disease surveillance involves the collection and analysis of patient data to assess a population’s disease burden, reduce harm, and predict patterns for prevention initiatives. Chronic disease surveillance, however, comes with its unique challenges. Unlike many infectious diseases, such as measles or meningitis, chronic disease cases are often not required to be reported to public health agencies. Chronic disease surveillance oftentimes relies on survey-based approaches, which have their limitations. Surveys to assess health status are commonly conducted through random digit dialing telephone calls, a method which has become more difficult to execute as the use of landlines has decreased. Surveys also depend on self-reported data, which may be subject to recall or social desirability bias. Lastly, chronic disease data collected through surveys tend to have coarse geographic resolution, limiting indicators to relatively large areas like states and counties, while public health interventions often need to be targeted at sub-county and neighborhood levels. Appendix A compares BRFSS with
1 World Health Organization. “Chronic diseases and health promotion.” http://www.who.int/chp/en/ 2 Centers for Disease Control and Prevention. “Leading causes of death.” https://www.cdc.gov/nchs/fastats/leading-causes-of-death.htm 3 National Center for Health Statistics. Health, United States, 2015: With Special Feature on Racial and Ethnic Disparities. Hyattsville, MD. 2016. http://www.cdc.gov/nchs/hus.htm.
6
Leveraging Clinical Data for Public Health and Hypertension Surveillance
other chronic disease prevalence data sources to illustrate their strengths and limitations.
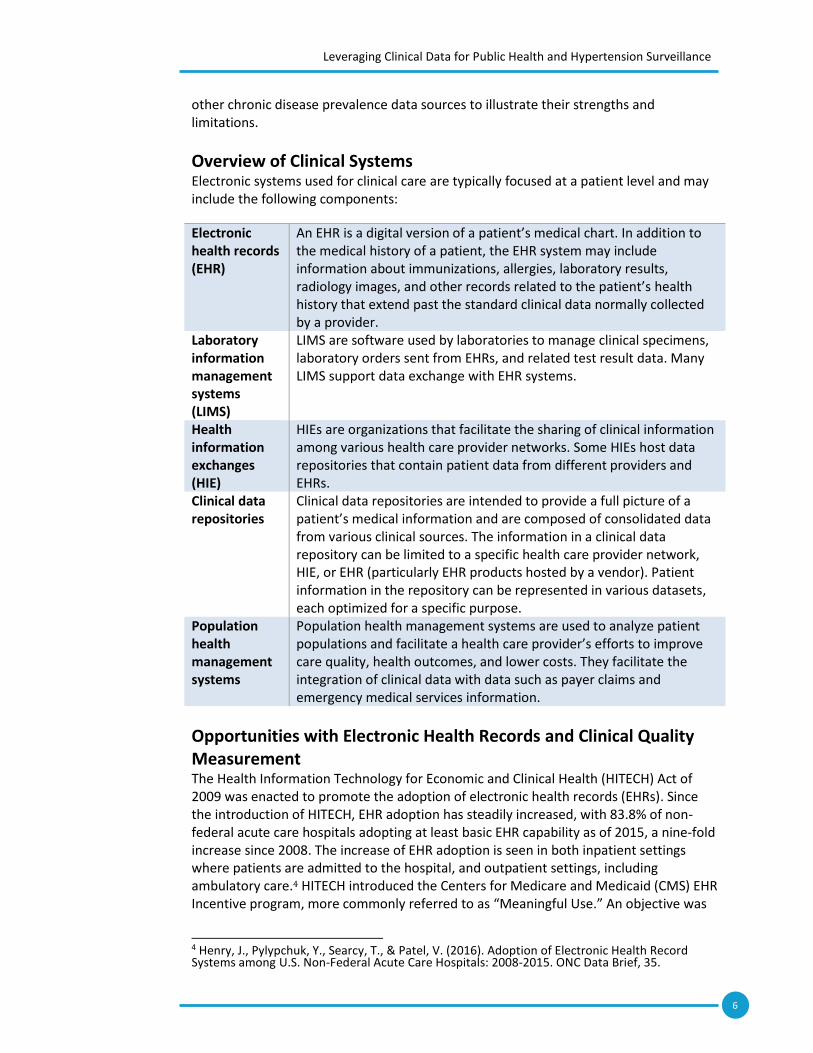
Overview of Clinical Systems Electronic systems used for clinical care are typically focused at a patient level and may include the following components:
Electronic health records (EHR)
An EHR is a digital version of a patient’s medical chart. In addition to the medical history of a patient, the EHR system may include information about immunizations, allergies, laboratory results, radiology images, and other records related to the patient’s health history that extend past the standard clinical data normally collected by a provider.
Laboratory information management systems (LIMS)
LIMS are software used by laboratories to manage clinical specimens, laboratory orders sent from EHRs, and related test result data. Many LIMS support data exchange with EHR systems.
Health information exchanges (HIE)
HIEs are organizations that facilitate the sharing of clinical information among various health care provider networks. Some HIEs host data repositories that contain patient data from different providers and EHRs.
Clinical data repositories
Clinical data repositories are intended to provide a full picture of a patient’s medical information and are composed of consolidated data from various clinical sources. The information in a clinical data repository can be limited to a specific health care provider network, HIE, or EHR (particularly EHR products hosted by a vendor). Patient information in the repository can be represented in various datasets, each optimized for a specific purpose.
Population health management systems
Population health management systems are used to analyze patient populations and facilitate a health care provider’s efforts to improve care quality, health outcomes, and lower costs. They facilitate the integration of clinical data with data such as payer claims and emergency medical services information.
Opportunities with Electronic Health Records and Clinical Quality Measurement The Health Information Technology for Economic and Clinical Health (HITECH) Act of 2009 was enacted to promote the adoption of electronic health records (EHRs). Since the introduction of HITECH, EHR adoption has steadily increased, with 83.8% of non-federal acute care hospitals adopting at least basic EHR capability as of 2015, a nine-fold increase since 2008. The increase of EHR adoption is seen in both inpatient settings where patients are admitted to the hospital, and outpatient settings, including ambulatory care.4 HITECH introduced the Centers for Medicare and Medicaid (CMS) EHR Incentive program, more commonly referred to as “Meaningful Use.” An objective was
4 Henry, J., Pylypchuk, Y., Searcy, T., & Patel, V. (2016). Adoption of Electronic Health Record Systems among U.S. Non-Federal Acute Care Hospitals: 2008-2015. ONC Data Brief, 35.

7
Leveraging Clinical Data for Public Health and Hypertension Surveillance
to ensure the use of certified EHR technology to achieve important clinical and public health outcomes. Those outcomes include providers’ electronic submission of messages to public health systems and clinical quality metrics to the U.S. Department of Health and Human Services (HHS). Facilitating the development and adoption of clinical quality measures, the National Quality Forum (NQF) is a not-for-profit, membership-based organization that endorses standards used to measure and report the quality and efficiency of health care. Clinical quality measures (CQMs) were created to measure the quality of care provided by health care professionals. Electronic clinical quality measures, or eCQMs, are the standard data formats extracted from EHRs and used to represent population-level health indicators and satisfy quality reporting requirements.5 Indicators represented by eCQMs include health outcomes, clinical processes, patient safety, care coordination, and public health improvement. An NQF-endorsed eCQM representing health outcomes is NQF #0018, Hypertension: Controlling High Pressure.6 In this document, we will use NQF #0018 as an example of an electronic clinical quality measure that can be used for chronic disease surveillance. In 2012, HHS launched the Million Hearts initiative to impact cardiovascular disease by aligning prevention activities with evidence-based public health and clinical goals. The Million Hearts initiative has encouraged the use of clinical quality measures by clinicians and health care systems to address the “ABCS” of cardiovascular disease prevention: aspirin when appropriate, blood pressure control, cholesterol management, and smoking cessation.7 NQF #0018 is the most reported Million Hearts clinical quality measure, with 26-27% of eligible health care providers reporting data.8 NQF #0018 is incorporated into many CMS programs, including the Physician Quality Reporting System, the Medicare Electronic Health Record (EHR) Incentive Program, and will be in the CMS Quality Payment Program.9 As a result, clinicians using their EHRs to manage the health of their patient populations and report eCQMs are likely to be familiar with NQF #0018. This makes that measure of particular interest to public health practitioners seeking to use EHR data as inputs to surveillance efforts.
EHRs and Chronic Disease Surveillance PHII developed the EHR Toolkit, an online resource for planning public health surveillance activities utilizing EHR data.10 Using this toolkit, health departments can apply public health informatics strategies to gain access to EHR data. The EHR Toolkit is organized by a surveillance information lifecycle that describes steps a public health
5 Office of the National Coordinator for Health Information Technology. “Glossary of eCQI Terms.” eCQI Resource Center. https://ecqi.healthit.gov/content/glossary-ecqi-terms 6 Office of the National Coordinator for Health Information Technology. “Eligible Hospital / Critical Access Hospital eCQMs.” eCQI Resource Center. https://ecqi.healthit.gov/eligible-hospital-critical-access-hospital-ecqms and “Eligible Professional / Eligible Clinician eCQMs.” eCQI Resource Center. https://ecqi.healthit.gov/eligible-professional-eligible-clinician-ecqms 7 Department of Health and Human Services. “Million Hearts.” https://millionhearts.hhs.gov/ 8Dawn Heisey-Grove et al. “Using Electronic Clinical Quality Measure Reporting for Public Health Surveillance.” MMWR. Morbidity and Mortality Weekly Reports. Retrieved from https://www.cdc.gov/mmwr/preview/mmwrhtml/mm6416a3.htm 9 Department of Health and Human Services. “Million Hearts Clinical Quality Measures,” https://millionhearts.hhs.gov/data-reports/cqm.html 10 The Public Health Informatics Institute. “Toolkit for planning an EHR-based surveillance program: The surveillance information lifecycle.” http://phii.org/ehrtoolkit

8
Leveraging Clinical Data for Public Health and Hypertension Surveillance
agency should take as it engages with clinical partners to access and use EHR data (see Table 1). This document is intended to supplement the EHR Toolkit and will highlight strategies applicable to the “Analyzing Clinical Data and Workflows” and “Optimizing Data Quality and Use” steps in the surveillance information lifecycle. For additional information on other steps in the lifecycle, please see PHII’s EHR Toolkit. Table 1: EHR-Based Surveillance Information Lifecycle
Lifecycle step Description
Making the Value Case Establishing the programmatic and cost justification for EHR-based surveillance through identification of needs, gaps, and opportunities.
Clarifying Legal and Policy Issues Understanding how existing law or regulations covers your proposed collection of or access to EHR-based clinical data and identifying areas that may require additional clarity from legal counsel or legislative liaisons.
Forming Partnerships Developing formal and informal relationships with health care organizations that could serve as data suppliers.
Analyzing Clinical Data and Workflows Developing the technical design considerations including required data elements, assessing clinical processes, intended data use, and the types of surveillance reports that will be created.
Analyzing Technical Options Assessing organizational technical capabilities and aligning technical approaches to exchange.
Implementing Data Exchange Implementing a technical design to exchange data with health care entities and scaling limited pilot initiatives to broader production exchange.
Optimizing Data Quality and Use Developing and implementing techniques to analyze, visualize, report, and evaluate information.
The “Analyzing Clinical Data and Workflows” section of this document addresses clinical data flow processes and considerations to guide conversations with clinical partners. The “Optimizing Data Use and Quality” section provides guidance to develop queries, analyze data, and assess the reliability and validity of disease prevalence measures based on EHR data.

9
Leveraging Clinical Data for Public Health and Hypertension Surveillance
Public Health Surveillance Approaches EHR systems and clinical repositories can provide your public health agency with clinical health data for surveillance purposes. Clinical systems can provide that data to public health through various models:11
● In a push model, a clinical entity sends data to a public health agency in
response to pre-determined criteria. This model reflects traditional public
health reporting, such as electronic lab, immunizations, and various disease
registry reporting. In some public health jurisdictions, a push model is facilitated
by an HIE that receives messages from a provider and routes them to a public
health registry.12
● In a pull model, an authorized public health agency can submit a data query to
an EHR system or clinical data repository. The queries could be made directly to
an EHR or to an intermediary broker, such as an HIE, that passes the query to
multiple data sources and aggregates the results. A limited number of public
health agencies have technical infrastructure to electronically query data from
EHRs and clinical data repositories. For public health agencies lacking this
technical infrastructure, an alternative is to collaborate with managers of clinical
data repositories so they can query information and generate surveillance
reports on behalf of a public health agency.
It is important to note that both the push and pull surveillance models can return individual case reports containing protected health information, de-identified individual case reports, or aggregated case counts. In addition, both models can accommodate various temporal triggers or intervals that specify when data are pushed or pulled from clinical systems. Both push and pull models rely on health IT interoperability standards.13 These include standards for:
Terminology, which describe how medical concepts will be encoded.
Content, which describe how electronic messages and documents should be
structured.
Transport, which describe methods for exchanging data between discrete
computer systems.
Historically, information exchange between health care organizations and public health agencies have required event- or disease-specific efforts to negotiate system interfaces utilizing terminology, content, and transport standards. While these efforts will and should continue, public health agencies are also beginning to examine how clinical data
11 The Public Health Informatics Institute. “Alternative Models for Accessing EHR Data for Surveillance.” Retrieved from http://phii.org/ehrtoolkit/introduction 12 Office of the National Coordinator for Health Information Technology. “Connecting Public Health Information Systems and Health Information Exchange Organizations: Lessons from the Field.” (2017) Retrieved from https://www.healthit.gov/sites/default/files/FINAL_ONC_PH_HIE_090122017.pdf 13 Healthcare Information Management Systems Society. “Types of Standards.” (2017) Retrieved from http://www.himss.org/library/interoperability-standards/types-standards

10
Leveraging Clinical Data for Public Health and Hypertension Surveillance
repositories might supply disease prevalence indicators in ways that avoid costs associated with implementing data exchange interfaces.14
This document will focus on pull surveillance models from clinical data repositories that result in aggregated case counts that do not include individual patients’ protected health information. Figure 1 depicts a generalized overview of how clinical data repositories can be populated with patient data from various systems and provide chronic disease surveillance indicators to public health agencies and community partners. An overview of the steps in this process using hypertension as an example is provided in Table 2. Additional details, considerations relevant to public health surveillance, and hypertension examples are provided in the sections “Analyzing Clinical Data and Workflows” and “Optimizing Data Quality and Use” below. Figure 1: Overview of Clinical Data Repository’s Role in Generating Disease Prevalence Indicators
14 Institute of Medicine. “Collaboration Between Health Care and Public Health: Workshop Summary”. Washington, DC: The National Academies Press (2016). https://doi.org/10.17226/21755.Retrieved from https://www.nap.edu/catalog/21755/collaboration-between-health-care-and-public-health-workshop-summary

11
Leveraging Clinical Data for Public Health and Hypertension Surveillance
Table 2: Steps for Disease Prevalence Indicator Generation, Hypertension Example
Step Description
Data capture Clinic staff enter patient blood pressure vital sign data into the EHR during each encounter. Once a patient has two recorded blood pressure measurements greater than 140/90, the EHR record is flagged as a potential essential hypertension diagnosis. The doctor selects the ICD code for essential hypertension.
Data extract, transform and load (ETL)
EHR data are sent to the clinical repository once the patient record is saved. The data are then validated and standardized by an ETL system to the particular format used by the repository. Patient-level data validation is designed to ensure concordance between the original EHR record and the data stored in the clinical repository.
Data analysis Public health collaborates with community partners to develop a hypertension algorithm based on the NQF #0018 clinical quality measure and provides the algorithm to the clinical data repository team. The clinical data repository team uses the algorithm to develop a report with disease prevalence indicators and sends the information to public health. Public health works with the clinical partner to assess the reliability and validity of the algorithm by sampling individual patient data to determine if hypertension cases were correctly identified. Public health also assesses the validity of the aggregate prevalence indicators by comparing to existing data sources such as BRFSS or NHANES.
Analyzing Clinical Data and Workflows It is important to assess the clinical processes used to capture patient data in an EHR and load it into a clinical data repository. This assessment allows a better understanding of the data needed to meet public health surveillance goals. This section will discuss clinical processes and related chronic disease surveillance considerations.
Data Capture The use of EHR data for public health surveillance is fairly new, and many providers are unaware that the data they enter in the EHR might later be used for public health surveillance purposes, so long as patient privacy requirements are met. The primary focus of the provider is to capture data from the clinical encounter to meet provider and patient needs. As a result, it is important to understand the context of data collection, including who is collecting the data, the format, the purpose, and the attention to quality. An understanding of data capture will help determine the level of confidence in the data, assess data quality, and improve interpretation of data and data elements. Data capture considerations:
What type of clinical encounters are the data originating from?
EHR data may include in-patient and out-patient data. The chronic disease condition of interest may determine which type of encounter is most likely to capture data of interest. For example, primary care settings that serve as a patient’s medical home may be a more reliable source for demographic and

12
Leveraging Clinical Data for Public Health and Hypertension Surveillance
vital sign data. Additional clinical characteristics, including longer use of EHRs meeting technical certification criteria and participation in health care delivery reform efforts, are associated with higher quality data.15
How often are the data captured during a clinical encounter?
Chronic disease data may be captured once or multiple times during a single encounter. Your data requirements may need to include identification of the primary data for an encounter to select the most reliable data to identify the condition of interest.
What data quality safeguards are used as data are entered?
EHRs often utilize features intended to ensure that patient data are captured in the appropriate data field. Requiring data to be entered into specific fields is one technique. To counter against a clinician circumventing required fields by entering bogus values, an EHR can check a field to ensure the entered value is medically or biologically plausible. While helpful from a data quality perspective, the user prompts associated with such safeguards have contributed to a phenomenon known as “alert fatigue” and provider dissatisfaction with EHRs.
Are the data structured or unstructured?
Structured data follow a prescribed data model and value set, limiting the users
to pre-determined values. Unstructured data do not follow a preset list of
values, allowing users to enter free text descriptive information. Structured data
tend to be more consistent from record to record, but may limit the kind of
information collected, while unstructured data are more challenging to
aggregate and categorize, but may include additional information that is not
easily reflected in structured data fields.
Data Extract, Transform, and Load Prior to storage in a clinical data repository or HIE, data are extracted from the original data source, which may include multiple EHR, pharmacy, and laboratory systems. These data are often then transformed to a format optimized for storage and loaded into the clinical data repository. Information technology professionals refer to this process as data extract, transform, and load (ETL), and it may introduce errors or issues impacting the suitability of the data for public health surveillance purposes. The more data elements are transformed to meet clinical data repository format requirements or to consolidate multiple data sources, the more the possibility for error increases. Another common issue when aggregating EHR data is duplication of patient records. When data from disparate EHR systems in similar geographic locations are aggregated, the possibility of duplicate records increases. Patient-level data validation should be completed after the loading process and before chronic disease surveillance data are reported to a public health agency. Data extract, transform, and load considerations:
15 Heisey-Grove, et al. “Electronic clinical quality measure reporting challenges: findings from the Medicare EHR incentive program’s controlling high blood pressure measure”. Journal of the American Medical Informatics Association (2017). Retrieved from https://doi.org/10.1093/jamia/ocx049

13
Leveraging Clinical Data for Public Health and Hypertension Surveillance
What are the data sources contributing clinical data to the repository, and how
heterogeneous are they?
A clinical data repository can contain data from one provider or multiple providers, one health care delivery system or multiple health care delivery systems, and one type of EHR or multiple types of clinical information systems. The more heterogeneous the data sources, the more likely the data will be modified as they are transformed into the clinical data repository’s format.
Are patient data de-duplicated as they are loaded into a clinical data repository?
Clinical data repositories often utilize a “master patient index” (MPI) that allows for de-duplication of individual patients and the creation of a longitudinal medical record for an individual reflecting clinical data from a variety of sources.
Are the data transformed by the clinical data repository? If so, how does the
transformation affect data quality?
Errors are often associated with transformations (also known as “mappings”) of values related to race, ethnicity, lab data, and data stored in unstructured formats at the source. Data can also be missing in clinical source systems. Upon transformation and loading into a clinical data repository, empty fields should be mapped to values that reflect acknowledgement of the missing value or to an authoritative alternative. For example, patient race and ethnicity fields are often empty upon loading into a repository. However, a given patient’s demographic information may already exist in the repository. Those historical data may be mapped to missing fields by using the repository’s MPI to match the patient records. Unstructured data in the EHR (e.g., clinician’s notes) may indicate a patient has the condition of interest. However, effective use of unstructured data and useful mappings of unstructured to structured data may not be feasible until additional advances in natural language processing and machine learning are achieved.
Is there a routine patient-level validation process for data contained in the
clinical data repository?
A percentage of a total patient cohort can be sampled for validation using a validation spreadsheet or tool. Each data element should be validated against the patient data in the source system, including missing values.
How frequently are data extracted from the sources?
EHR data are often loaded into a clinical data repository on a scheduled, batch processing basis. It is worthwhile to ascertain if those schedules align with public health surveillance information requirements. This will likely be less of an issue for chronic disease surveillance, but might be an issue in an infectious disease context when rapid case detection is a consideration.
What are the most common errors identified during the ETL process? If missing
data are a problem, which fields often exhibit missing data?
The stewards of a clinical data repository should have data quality procedures
and metrics associated with their ETL process and will likely be able to describe

14
Leveraging Clinical Data for Public Health and Hypertension Surveillance
what EHR data elements are often missing or more frequently generate errors
during transformation and mapping steps. Some data elements important from
a public health surveillance perspective can be deemed by some health care
providers as less important from a clinical perspective (e.g., race and ethnicity).
As a result, these data elements may be more likely to be skipped during a
clinical encounter.
Are the stewards of the clinical data repository confident in the performance and
maintenance of their information technology infrastructure as well as the clinical
systems providing the source data?
System performance should be carefully monitored with mechanisms for communicating technical issues to clinical end users. Assessments of system performance issues should address data latency, frequency of occurrence, network connectivity, and number of users impacted.
Hypertension Example Hypertension data may be captured in several ways, such as vital signs or diagnosis codes. Blood pressure is considered a vital sign and is typically captured at both in-patient and out-patient encounters as structured data. In some cases, blood pressure may be captured at multiple times during the encounter, both during intake and by the physician. The physician may also record a hypertension diagnosis code or prescribe medication. These data are usually recorded in structured fields, but may be captured in a free text notes field as well. As you work with your clinical partners, ask questions about likely fields for inclusion in your data request. Table 3: Questions and Considerations for Hypertension Data element Questions and considerations
Vital signs In a clinical setting, who typically takes blood pressure measurement? What clinical training do they have? What incentive do they have to ensure accurate measurement?
Are blood pressure measurements recorded directly into the EHR at the time of measurement, or are they entered later from handwritten notes?
If multiple measures are taken, are they all recorded? If so, which would you consider to be the most accurate value? If not, which measure is recorded (highest, lowest, or an average?)
Diagnosis Is the hypertension diagnosis typically captured in a structured field or in unstructured free text?
Does an elevated blood pressure measurement trigger a diagnosis recommendation, or does the diagnosis have to be manually entered?
If the diagnosis code is manually entered, does the clinician select a diagnosis from a list of pre-determined values (structured data), or do they manually type values intended to represent hypertension (unstructured data)?
15
Leveraging Clinical Data for Public Health and Hypertension Surveillance
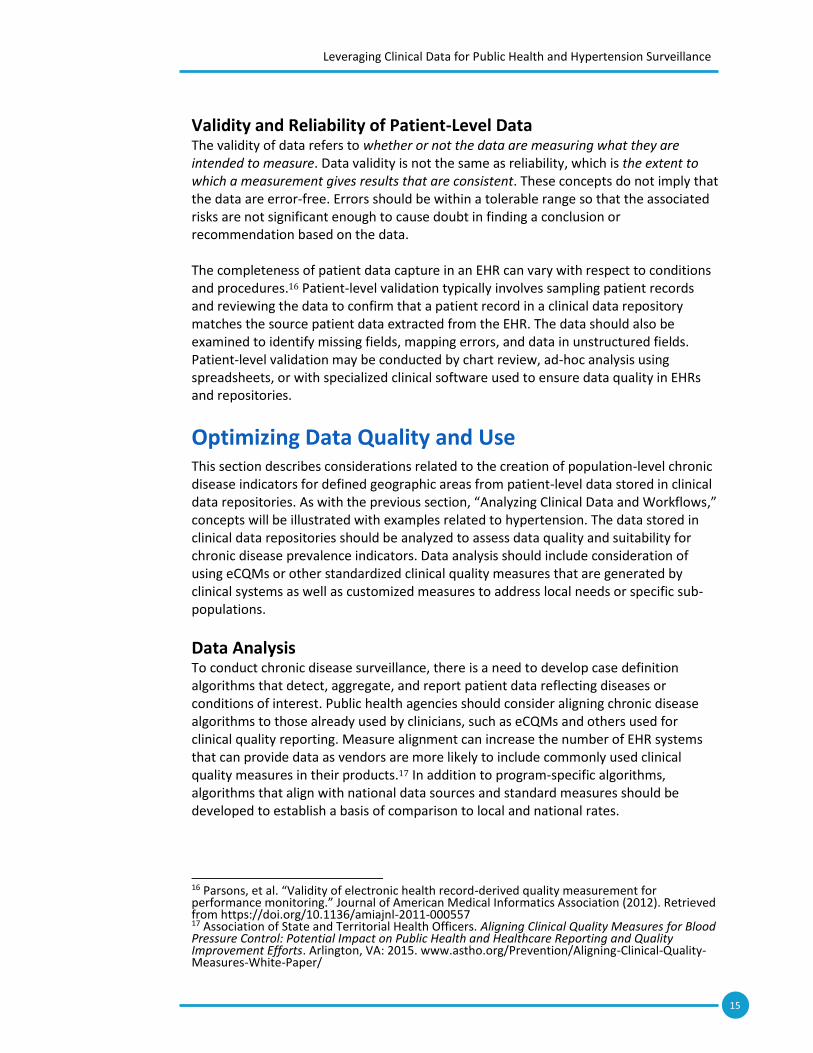
Validity and Reliability of Patient-Level Data The validity of data refers to whether or not the data are measuring what they are intended to measure. Data validity is not the same as reliability, which is the extent to which a measurement gives results that are consistent. These concepts do not imply that the data are error-free. Errors should be within a tolerable range so that the associated risks are not significant enough to cause doubt in finding a conclusion or recommendation based on the data. The completeness of patient data capture in an EHR can vary with respect to conditions and procedures.16 Patient-level validation typically involves sampling patient records and reviewing the data to confirm that a patient record in a clinical data repository matches the source patient data extracted from the EHR. The data should also be examined to identify missing fields, mapping errors, and data in unstructured fields. Patient-level validation may be conducted by chart review, ad-hoc analysis using spreadsheets, or with specialized clinical software used to ensure data quality in EHRs and repositories.
Optimizing Data Quality and Use This section describes considerations related to the creation of population-level chronic disease indicators for defined geographic areas from patient-level data stored in clinical data repositories. As with the previous section, “Analyzing Clinical Data and Workflows,” concepts will be illustrated with examples related to hypertension. The data stored in clinical data repositories should be analyzed to assess data quality and suitability for chronic disease prevalence indicators. Data analysis should include consideration of using eCQMs or other standardized clinical quality measures that are generated by clinical systems as well as customized measures to address local needs or specific sub-populations.
Data Analysis To conduct chronic disease surveillance, there is a need to develop case definition algorithms that detect, aggregate, and report patient data reflecting diseases or conditions of interest. Public health agencies should consider aligning chronic disease algorithms to those already used by clinicians, such as eCQMs and others used for clinical quality reporting. Measure alignment can increase the number of EHR systems that can provide data as vendors are more likely to include commonly used clinical quality measures in their products.17 In addition to program-specific algorithms, algorithms that align with national data sources and standard measures should be developed to establish a basis of comparison to local and national rates.
16 Parsons, et al. “Validity of electronic health record-derived quality measurement for performance monitoring.” Journal of American Medical Informatics Association (2012). Retrieved from https://doi.org/10.1136/amiajnl-2011-000557 17 Association of State and Territorial Health Officers. Aligning Clinical Quality Measures for Blood Pressure Control: Potential Impact on Public Health and Healthcare Reporting and Quality Improvement Efforts. Arlington, VA: 2015. www.astho.org/Prevention/Aligning-Clinical-Quality-Measures-White-Paper/

16
Leveraging Clinical Data for Public Health and Hypertension Surveillance
When developing the algorithm, it is important to consider both inclusion and exclusion criteria. The algorithm should be carefully developed and tested to ensure that the correct cases are identified. Electronic clinical quality measure documentation often includes detailed descriptions of the inclusion and exclusion criteria and can be used to develop the algorithm.
Data analysis considerations:
How is the population under analysis being defined?
Public health agencies are primarily interested in the entire population of individuals residing in their respective jurisdiction. Clinical data repositories, however, will only include data on individuals seeking care from a provider that shares information with that repository. Clinical data repositories containing data from multiple providers and health care delivery systems will likely be better suited to public health surveillance purposes. While some public health jurisdictions have the potential to leverage a single clinical data repository that represents a significant proportion of its jurisdictional population, other agencies may need to work with multiple providers or HIEs to obtain data from multiple clinical data repositories.
How is patient duplication addressed?
Chronic disease surveillance measures generated from a clinical data repository that utilizes a master patient index (MPI) will likely be more valid than measures that are based on a clinical data source that does not use an MPI to de-duplicate patients. Disease surveillance measures based on data sourced and aggregated from multiple clinical data repositories that do not share an MPI are more likely to reflect duplicated case counts. Best practices from the immunization information systems (IIS) domain can guide patient de-duplication when an MPI is not available.18 Comparing an EHR-based disease surveillance measure to other surveillance measures can help assess its validity (see the section “Validity and Reliability of Population-Level Data,” below).
How is a case definition algorithm defined?
Chronic disease cases can be defined using various patient data elements reflecting demographics, diagnoses, vital signs, and medications. These categories can be used as inclusion or exclusion criteria for case definition algorithms. For each data element, specific values will need to be specified. Examples for hypertension are provided below.
How should patient privacy be observed during data analysis?
As case definition algorithms are used to define data queries that will be executed in a clinical data repository, steps should be taken to de-identify the case records returned by the query. This can entail replacing patient identifiers used by the clinical data repository and MPI with randomly generated identifiers. The data stewards of the clinical data repository may use a similar process to extract data used for research studies.
How can neighborhood-level or sub-county disease prevalence measures be
18 Centers for Disease Control and Prevention. Immunization Information Systems Patient-Level De-Duplication Best Practices. Atlanta, GA: 2013. https://www.cdc.gov/vaccines/programs/iis/interop-proj/downloads/de-duplication.pdf
17
Leveraging Clinical Data for Public Health and Hypertension Surveillance
calculated?
The geographic resolution of EHR-based disease prevalence measures will be a function of the geographic representativeness of the patient data in the clinical data repositories. Some repositories are associated with health information exchanges (HIEs) that receive data from multiple providers and as a result represent a significant proportion of a public health agency’s jurisdiction. Other clinical data repositories may be associated with specific health care delivery networks that have significant market share in specific areas. Many clinical data repositories are able to geocode a patient’s address to sub-county geographic areas such as postal ZIP codes and U.S. Census units (e.g. Census tracts). Then the number of de-duplicated patients in a given sub-county geographic area can be compared to the total population in that area. If the public health agency and its stakeholders deem the proportion of total patients to the total population high enough, then representative prevalence measures might be generated.
Hypertension Example The following description illustrates how patient information in a clinical data repository could be used to calculate hypertension prevalence rates for public health purposes. In this example, the agency is seeking to generate rates based on data from one clinical data repository believed to provide adequate representation of the agency’s county jurisdiction. The general steps entail 1) defining the population cohort, 2) defining a case definition algorithm, and 3) calculating prevalence rates. Considerations related to reliability and validity are offered in the following section of this document.
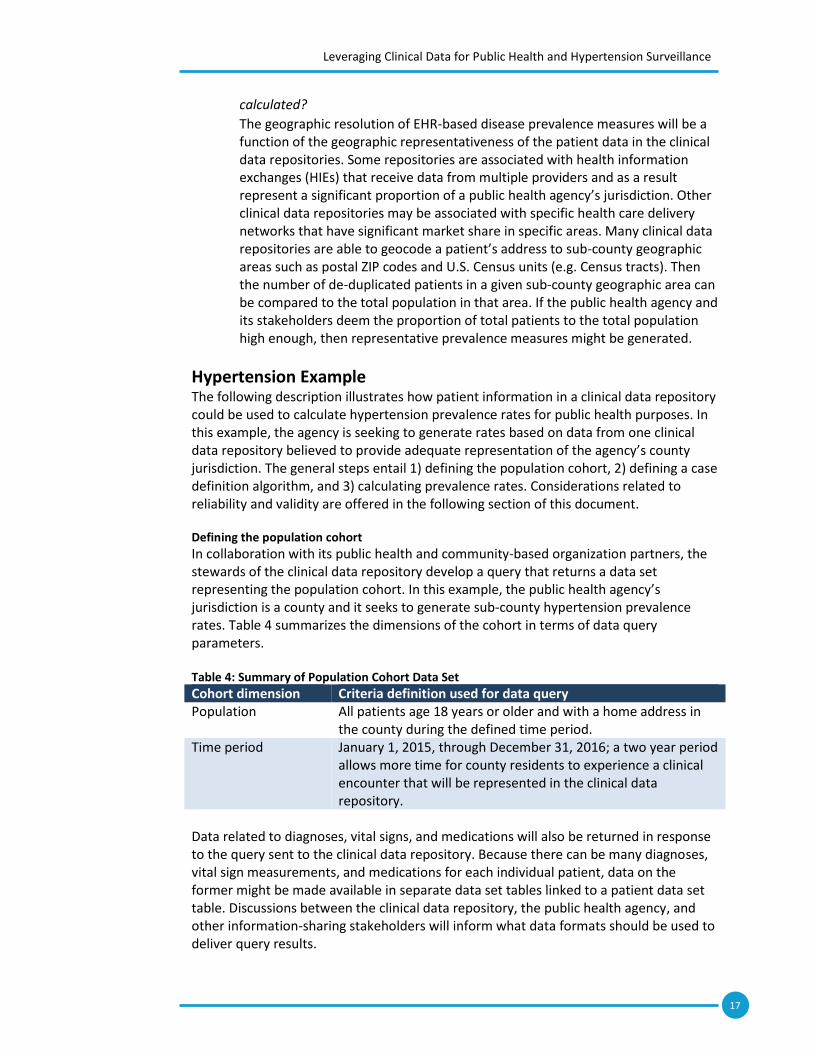
Defining the population cohort
In collaboration with its public health and community-based organization partners, the stewards of the clinical data repository develop a query that returns a data set representing the population cohort. In this example, the public health agency’s jurisdiction is a county and it seeks to generate sub-county hypertension prevalence rates. Table 4 summarizes the dimensions of the cohort in terms of data query parameters. Table 4: Summary of Population Cohort Data Set
Cohort dimension Criteria definition used for data query Population All patients age 18 years or older and with a home address in
the county during the defined time period. Time period January 1, 2015, through December 31, 2016; a two year period
allows more time for county residents to experience a clinical encounter that will be represented in the clinical data repository.
Data related to diagnoses, vital signs, and medications will also be returned in response to the query sent to the clinical data repository. Because there can be many diagnoses, vital sign measurements, and medications for each individual patient, data on the former might be made available in separate data set tables linked to a patient data set table. Discussions between the clinical data repository, the public health agency, and other information-sharing stakeholders will inform what data formats should be used to deliver query results.

18
Leveraging Clinical Data for Public Health and Hypertension Surveillance
Defining a case definition algorithm
The Million Hearts measure for hypertension control is included in numerous quality reporting initiatives, as described in Table 4. Table 5: Select Million Hearts Clinical Quality Measure Alignment for Hypertension Control19
Measure National Quality Forum (NQF)
CMS Physician Quality Reporting System
CMS Medicare EHR Incentive Program
Hypertension (HTN): Controlling High Blood Pressure Percentage of patients aged 18 through 85 years who had a diagnosis of HTN and whose blood pressure was adequately controlled (<140/90) during the measurement year.
#0018 #236 CMS165
The NQF 00018 measure can be used to develop a hypertension control prevalence indicator and identify EHR data elements for data analysis. Figure 2 illustrates how the denominator for the hypertension control measure can be used as the numerator for a hypertension prevalence measure. The hypertension denominator for NQF 0018 is patients with a diagnosis of essential hypertension. This diagnosis should be represented as ICD-9 or ICD-10 codes (see Table 5 below for specific values). Both ICD-9 and ICD-10 are included in the event, as some clinical settings still contribute discontinued ICD-9 values to the clinical data repository and the extract, transform, load process described above fails to convert them to ICD-10 values. Hypertensive patients often lack a hypertension diagnosis in their medical record.20 To compensate for missing diagnoses, information indicating hypertension may be found in vital sign and medication data. Some experimentation may be necessary to determine which patient data to include in case definition algorithms for hypertension. Different algorithms may have advantages and disadvantages. Table 5 summarizes patient data available for inclusion criteria for hypertension case definition algorithms and related considerations.
19 Department of Health and Human Services. “Million Hearts: Clinical Quality Measures.” https://millionhearts.hhs.gov/data-reports/cqm/measures.html 20 Mingkai Peng, et al. “Methods for defining hypertension in electronic medical records: validation against national survey data.” Journal of Public Health (2015). Retrieved from https://www.ncbi.nlm.nih.gov/pubmed/26547088

19
Leveraging Clinical Data for Public Health and Hypertension Surveillance
Figure 2: Use of Hypertension Control Quality Measure Data for Hypertension Prevalence
Table 6: Data Options for Hypertension Case Definition Algorithms (Inclusion Criteria)
Data Hypertension case criteria Considerations Diagnosis ≥1 of the following ICD-9 or ICD-10 codes
associated with an inpatient admission or outpatient encounter during time period:
ICD-9 Code and Description 401 ESSENTIAL HYPERTENSION 401.1 BENIGN HYPERTENSION 401.0 MALIGNANT HYPERTENSION 401.9 HYPERTENSION NOS 405 SECONDARY HYPERTENSION 405.0 MAL SECOND HYPERTENSION 405.9 SECOND HYPERTENSION NOS 405.91 RENOVASC HYPERTENSION 405.99 SECOND HYPERTENSION NEC
ICD-10 Code and Description I10 ESSENTIAL HYPERTENSION I15 SECONDARY HYPERTENSION
Consider using diagnosis data in conjunction with vital sign or medication data, if available, to increase specificity (i.e., reduce false positives) when the hypertension prevalence rate for the population is believed to be under 50%.
Vital signs Systolic blood pressure of ≥140 mm Hg or a diastolic blood pressure of ≥90 mm Hg
Consider using vital sign data in conjunction with diagnosis or medication data to account for variability in vital sign data resulting from measurements taken in various clinical environments.
Consider whether one high blood pressure measurement will suffice or if requiring more than one measurement improves specificity.
A hypertension case definition algorithm that is met if a patient has ≥1 hypertension diagnosis code OR ≥1 high blood pressure measurement can balance sensitivity and specificity and result in useful prevalence estimates when the true population prevalence is approximately 30%.
Medication ≥1 filled prescriptions for any medications associated with hypertension
Consider using medication data in conjunction with diagnosis or vital sign data.
A case definition algorithm where only hypertension medication, without vital sign and diagnosis data indicating hypertension, may misclassify patients as hypertensive.
# of hypertensive patients (18 – 85 years old) during measurement period
(denominator)
# total population (18 – 85 years old) during measurement period (denominator)
NQF 0018 Measure: Hypertension Prevalence Measure:
# of hypertensive patients (18 – 85 years old) whose blood pressure was adequately controlled during measurement period
(numerator)
# of hypertensive patients (18 – 85 years old) during measurement period
(numerator)

20
Leveraging Clinical Data for Public Health and Hypertension Surveillance
Sample hypertension control denominator algorithms are included in Appendix B. The NQF #0018 documentation also includes detailed explanations for exclusion criteria. Tables 6 and 7 show a sample algorithm for NQF #0018 using vital signs as criteria. Table 7: Sample Hypertension Control Denominator Algorithm
Patients to include
Variable
Condition 1 Patients aged 18-85
and
Condition 2 One eligible visit in first half of measurement year
and
Condition 3 One elevated blood pressure measurement ≥140/90
Patients to exclude
Description
Condition 1 End stage renal disease on or prior to the end of the measurement year
and/or
Condition 2 Pregnancy during the measurement year
and/or
Condition 3 Dialysis
and/or
Condition 4 Renal transplant Table 8: Sample Hypertension Control Numerator Algorithm
Calculating prevalence rates
Continuing with the example of a public health agency seeking to produce hypertension prevalence rates at a sub-county level, Table 8 describes numerators and denominators that could be used. As described above in the section “Optimizing Data Quality and Use: Data Analysis,” the utility of EHR-based prevalence rates for a given geographic area will be limited by the proportion of area residents represented in EHR systems contributing to a clinical data repository. In this example, the public health agency has determined the clinical data repository providing the hypertension case counts is sufficiently representative of the underlying population of the geographic units it wants to analyze. The population in the denominator reflects the two-year “look back” period described above in Table 3. Additional considerations on EHR-based prevalence are addressed in the section “Validity and Reliability of Population-Level Data” below.
Patients to include
Variable
Condition 1 Meet the conditions of the denominator
and
Condition 2 Ever controlled in measurement year <140/90
and
Condition 3 Controlled at last visit during measurement year <140/90

21
Leveraging Clinical Data for Public Health and Hypertension Surveillance
Table 9: Example Hypertension Prevalence Calculations Indicator Numerator Denominator County prevalence
Number of patients from population cohort (see Table 6) meeting hypertension inclusion and exclusion criteria
Total county population of adults 18 years or older during two-year population cohort time period (may require averaging two years of population data)
ZIP code prevalence (hypothetical ZIP codes A, B, C, etc.) County ZIP code A Number of patients from
population cohort (see Table 6) meeting hypertension inclusion and exclusion criteria and geocoded to ZIP code A
Total ZIP code A population of adults 18 years or older during two-year population cohort time period (may require averaging two years of population data)
County ZIP code B Number of patients from population cohort (see Table 6) meeting hypertension inclusion and exclusion criteria and geocoded to ZIP code B
Total ZIP Code B population of adults 18 years or older during two-year population cohort time period (may require averaging two years of population data)
Repeat for all county ZIP codes
Census tract prevalence (hypothetical tracts 1, 2, 3, etc.) County Census tract 1 Number of patients from
population cohort (see Table 6) meeting hypertension inclusion and exclusion criteria and geocoded to Census tract 1
Total Census tract 1 population of adults 18 years or older during two-year population cohort time period (may require averaging two years of population data)
County Census tract 2 Number of patients from population cohort (see Table 6) meeting hypertension inclusion and exclusion criteria and geocoded to Census Tract 2
Total Census Tract 2 population of adults 18 years or older during two-year population cohort time period (may require averaging two years of population data)
Repeat for all county Census tracts
Validity and Reliability of Population-Level Data There should be a structured and logical method to assess and describe the validity and reliability of population-level chronic disease prevalence indicators generated from EHR data. This should include 1) an assessment of the results of a query based on the case definition algorithm and 2) a comparison of EHR-based prevalence rates to existing information that can serve as a gold standard, such as BRFSS. Assessing Query Results
The reliability of the case definition algorithm used as the basis for a data query will most likely need to be conducted at the clinical data repository level. Validity of the case

22
Leveraging Clinical Data for Public Health and Hypertension Surveillance
detection algorithms can be assessed by testing the algorithm against a sample of the EHR data to identify records that meet the case definition for the condition of interest. The sample data should be assessed to determine if the algorithm criteria were met for each identified record. The results can be used to calculate the sensitivity and positive predictive value of the algorithm. The results can then be used to adjust the algorithm as needed. To check exclusion criteria, clinical data repository queries can be run to find patients with the exclusion criteria, and these patient are verified not to be in the query results based on the case definition criteria. Reliability of the algorithm can be assessed with expert review of medical charts.21 The inter-rater review method requires independent chart reviewers to access individual patient records and determine if patients were included and excluded appropriately with respect to case definition criteria. Inter-rater agreement is then calculated to assess the reliability of the case definition algorithm.22 Comparing Prevalence to Gold Standard
Assessing the validity of EHR-based prevalence measures should entail comparisons to existing gold standard prevalence indicators to determine if outcomes met expectations. Expectations reflect judgements on the similarity of EHR-based indicators to reference indicators such as those based on surveys.23 The data source used for comparison should be comparable by measurement time period and geographic location. Equivalence testing such as Pearson correlation coefficient24 or two one-sided t-test (TOST)25 can be used to conduct the comparison. The data sources described in Appendix A are available for comparative analysis in addition to community health assessment and other local and state maintained data sources.
21 Klompas, et al. “Automated detection and classification of type 1 versus type 2 diabetes using electronic health record data.” Diabetes Care (2013). Retrieved from https://doi.org/10.2337/dc12-0964 22 Cave, et al. “Development of a validated algorithm for the diagnosis of paediatric asthma in electronic medical records.” Npj Primary Care Respiratory Medicine (2016). Retrieved from https://www.nature.com/articles/npjpcrm201685 23 McVeigh, et al. “Can electronic health records be used for population health surveillance? Validating population health metrics against established survey data.” eGEMs (2016). Retrieved from https://egems.academyhealth.org/articles/abstract/10.13063/2327-9214.1267 24 Klompas, et al. “State and local chronic disease surveillance using electronic health record systems.” American Journal of Public Health (2017). Retrieved from http://ajph.aphapublications.org/doi/abs/10.2105/AJPH.2017.303874 25 Thorpe, et al. "Monitoring prevalence, treatment, and control of metabolic conditions in New York City adults using 2013 primary care electronic health records: a surveillance validation study," eGEMs (2016). Retrieved from http://repository.edm-forum.org/egems/vol4/iss1/28

23
Leveraging Clinical Data for Public Health and Hypertension Surveillance
Conclusion EHRs can be used for chronic disease surveillance, but implementation requires careful consideration of each step of the data flow process. Prior to receiving data reports from a clinical data repository, it is important to understand how data are captured and stored. It is also necessary to experiment with procedures for assessing the reliability and validity of the individual patient data, case detection algorithms, and population-based prevalence measures. This holds true for public health agencies that receive data transmissions that must be interfaced into their surveillance systems as well as agencies that receive disease prevalence indicators developed by partners. This document offers preliminary guidance for building partnerships and establishing a strategy for EHR-based chronic disease surveillance. Public health agencies and collaborators in health care and HIE organizations are implementing and evaluating different techniques. These include push models,26 pull models,27, 28 and collaborations with clinical data repository stewards.29 In the coming years, experience should indicate which model should be prioritized given the information needs and informatics capabilities of a given public health agency and its stakeholders. The guidance in this document reflects input from health care providers, public health agencies, and research organizations committed to improving both patient care and population health outcomes. The use of EHR data for public health purposes, including chronic disease surveillance, is an emergent practice. Traditional surveillance data sources will need to be maintained as the practice of EHR-based public health surveillance matures. As these efforts unfold and experience grows, the guidance reflected in this document will evolve accordingly.
26 Kranz, et al. Using Electronic Health Record Data for Healthy Weight Surveillance in Children, San Diego, California, 2014. Prev Chronic Dis 2016;13:150422. DOI: http://dx.doi.org/10.5888/pcd13.150422 27 Denver Public Health. Colorado health observation regional data service (CHORDS). Retrieved from http://denverpublichealth.org/home/health-information-and-reports/data-and-informatics-tools/colorado-health-observation-regional-data-service-chords 28 Vogel, et al. MDPHnet: secure, distributed sharing of electronic health record data for public health surveillance, evaluation, and planning. American Journal of Public Health (2014). Retrieved from http://ajph.aphapublications.org/doi/10.2105/AJPH.2014.302103 29 Health Chicago 2.0. Chicago health atlas. Retrieved from https://www.chicagohealthatlas.org/

24
Leveraging Clinical Data for Public Health and Hypertension Surveillance
Appendix A: Select Examples of Existing Chronic Disease Surveillance Data Sources
Name of data source
Granularity (National, state, county, sub-county)
Source of data (surveys, medical records, etc.)
Methodology (self-reported, data collected directly, etc.)
Frequency of data updates and availability
Hypertension metric
Limitations
BRFSS State (at times states will oversample to generate county or MSA-level estimates.)
Telephone surveys
Cross-sectional telephone survey conducted by state health departments over landline and cellular telephones using random digit dialing (self-report)
Annually “Have you ever been told by a doctor, nurse, or other health professional that you have high blood pressure?” “Are you currently taking medicine for your high blood pressure?”
Relies on self-report Excludes individuals without a telephone Excludes children and adolescents Limited to English and Spanish speakers Samples not locally representative
NHANES National Interviews and medical examinations
Self-report from interviews Data collected directly through medical examinations
Annually Told by doctor to have high blood pressure Blood pressure taken during medical examination
Relies on self-report Examination data subject to measurement variation Does not collect data on incidence of acute CVD events Cohort not large enough to generate state or local prevalence estimates
500 Cities
Sub-county (includes 497 largest cities in the United States plus the largest cities in Vermont, West Virginia and Wyoming.)
BRFSS surveys and U.S. Census
Multi-level regression and post-stratification (MRP) model-based small-area estimates from BRFSS data stratified with U.S. Census data
To be determined
Told by doctor to have high blood pressure
Small-area estimates may underestimate areas with high prevalence or overestimate areas with low prevalence
25
Leveraging Clinical Data for Public Health and Hypertension Surveillance
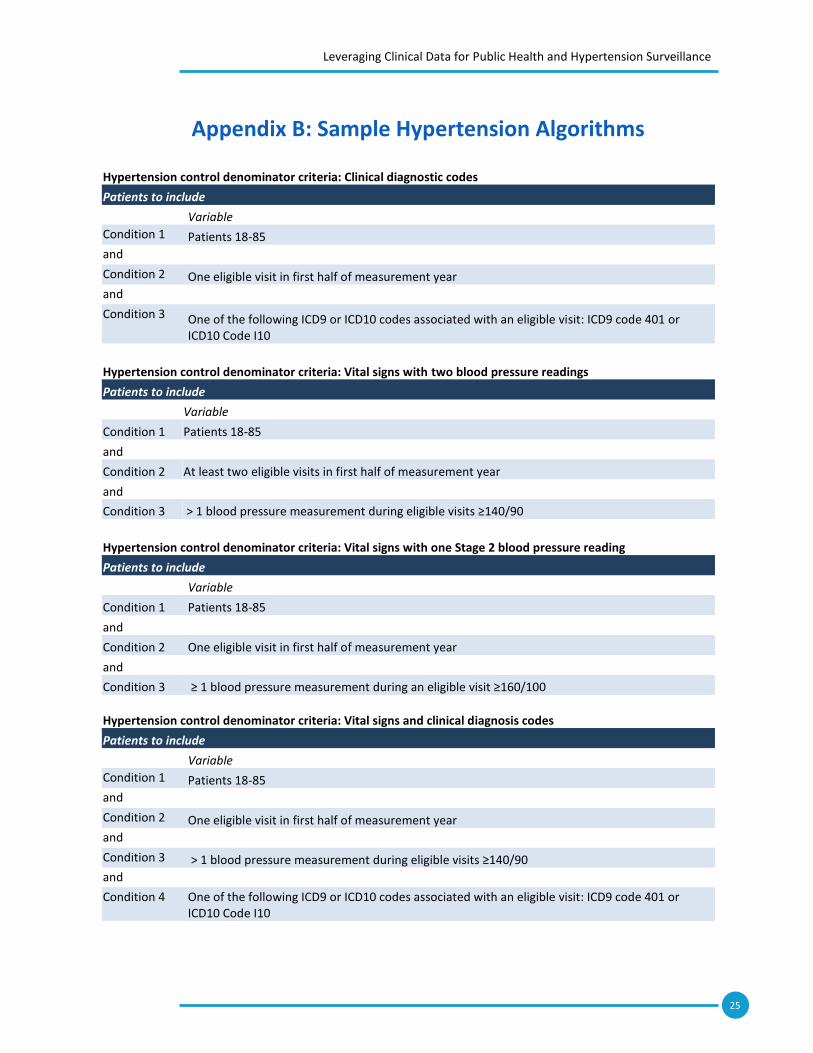
Appendix B: Sample Hypertension Algorithms
Hypertension control denominator criteria: Clinical diagnostic codes
Patients to include
Variable
Condition 1 Patients 18-85
and
Condition 2 One eligible visit in first half of measurement year
and
Condition 3 One of the following ICD9 or ICD10 codes associated with an eligible visit: ICD9 code 401 or ICD10 Code I10
Hypertension control denominator criteria: Vital signs with two blood pressure readings
Patients to include
Variable
Condition 1 Patients 18-85
and
Condition 2 At least two eligible visits in first half of measurement year
and
Condition 3 > 1 blood pressure measurement during eligible visits ≥140/90
Hypertension control denominator criteria: Vital signs with one Stage 2 blood pressure reading
Patients to include
Variable
Condition 1 Patients 18-85
and
Condition 2 One eligible visit in first half of measurement year
and
Condition 3 ≥ 1 blood pressure measurement during an eligible visit ≥160/100
Hypertension control denominator criteria: Vital signs and clinical diagnosis codes
Patients to include
Variable
Condition 1 Patients 18-85
and
Condition 2 One eligible visit in first half of measurement year
and
Condition 3 > 1 blood pressure measurement during eligible visits ≥140/90
and
Condition 4 One of the following ICD9 or ICD10 codes associated with an eligible visit: ICD9 code 401 or ICD10 Code I10