leveraging the mam to improve biotherapeutic ...€¦ · rich rogers. successful ... fully...
TRANSCRIPT

Leveraging the MAM to Improve Biotherapeutic Characterization
Rich Rogers

Successful characterization of a Biotherapeutic requires 3 components
1.High-resolution/High-mass accuracy mass spec
2.Accurate and fast DDA search software
3.New peak detection software

Outline
• What is the Multi-Attribute Method (MAM)?
–Workflow
–Biopharma Finder Search
–Attribute Analytics
–Mass Spec based new peak detection
• Detecting new peaks with a stressed monoclonal antibody
• How we are using the MAM at Just
–Molecular Optimization
–Real-time monitoring
• MAM Consortium
• Acknowledgements

Single attribute testing used to ensure product quality
Just. | Confidential.
1. CE-SDS
2. CEX/cIEF
3. Glycan Map
4. ID ELISA
5. HCP ELISA
6. pA ELISA
7. Color
8. Clarity
9. Osmolality
10. pH
11. SEC
12. A280
13. qPCR
14. Endotoxins
15. Bioburden
16. Bioassay

Mass Spec based Multi-Attribute Method (MAM) for Product Attribute Control (PAC) and Release
Attribute Current Method PAC and Release
Clips rCE-SDS
Multi-Attribute
Method
Charge Variants CEX-HPLC
Glycans Glycan Map
Identity Immunoassay
Process ImpuritiesHCP-ELISA,
Prot-A-ELISA
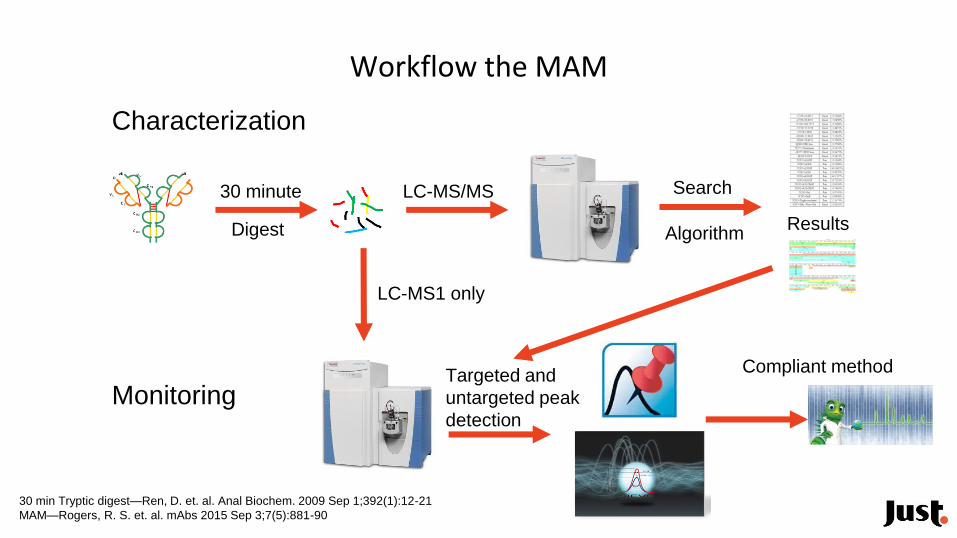
Workflow the MAM
30 minute
Digest
LC-MS/MS
Characterization
Search
AlgorithmResults
LC-MS1 only
MonitoringTargeted and
untargeted peak
detection
Compliant method
30 min Tryptic digest—Ren, D. et. al. Anal Biochem. 2009 Sep 1;392(1):12-21
MAM—Rogers, R. S. et. al. mAbs 2015 Sep 3;7(5):881-90

BioPharma Finder Search
• Trypsin digest
• Searched for glycosylation, N-
terminal cyclization, C-terminal
lysine, oxidation, deamidation,
glycation, and isomerization.
• Allowed a variable mass
change from -58 to 162.
• Sequence coverage for the light
chain and heavy chain were
>98%.

Targeted Attribute Analytics

Attribute Analytics using Pinpoint
Analytical Group
1. CQAs are observed by a DDA method (orbi
or QE)
2. Enter the peptides
3. Add PTMs
4. Add the isotopic distribution

Attribute Analytics Results

Comparison to traditional assays—Glycans

The MAM provides site specific glycosylation
The HILIC glycan assay only provides a global snapshot of glycosylation
1
2
3
4
5
Abbreviated list of
glycans on each siteMAM
HILIC
Fc-Fusion Molecule
N1 N2 N3 N4 N5A2S2F NG A2S1G1 A1S1 A2G1F
A2S1G1F A2S1G1F M5 A1G0 A2G0F
Gn A2S2F A1S1M4 M3 A2G2F
A3S3F A2G2F A1S1M5 M4 A2G0
A3S2G1F A3S2G1F A1S1 M5 A2G1
GnF A3S3F A2S1G1F A2S1G1 A2S1G1F
A2S1Sg1F A3S1G2F A2G2 A1G1 A2G2
A2G2F A2S1G1 A2S2 A2S1G1F A1G1F
A3S1G2F A2S1G0F A1G1M5 M6 A1G0F
A2S1G0F A2G1F A1G1M4 A1G1M4 A1G1
NG A1G1F A2S1 A2S2 NG
A1S1F A1S1M5F A1G1 A2G1 A1S1F

Comparison to traditional assays—Deamidation
0
5
10
15
20
25
30
35
3 4 5 6 7 8 9 10 11 12 13 14 15 16 17 18 19 20 21 22 23 24 25
%A
ttri
bu
te
Day of Culture
CEX (Acidic)
Deamidation

Comparison to traditional assays—Clips
0
20
40
60
80
100
120
100 99 95 90 50 0
%Cl
ips
%ABP970
Expected Level
rCE-SDS (%Clips corrected)
MAM
% unclipped mAb

Comparison to traditional assays--HCP
MAM provides orthogonal selectivity compared
with ELISA
0
50
100
150
200
250
300
0.E+00
1.E+06
2.E+06
3.E+06
4.E+06
5.E+06
6.E+06
7.E+06
8.E+06
NVIP AEX UFD DS
EL
ISA
HC
Ps
(p
pm
)
MA
M H
CP
Pe
ak
Are
a
MAM HCP 1 MAM HCP 2 ELISA HCPs
Slide courtesy Yi Wang (Merck)
Attributes that can be monitored with the MAM
• Deamidation
• Glycation
• Glycosylation
• Oxidation
• Pre-monomer
• Clips
• Unusual Glycosylation
• C-term K
• HCP and pA
• Mutations
• NGHC
• Isomerization
• Pyro-Glu

Mass Spec based new peak detection
• Absolutely essential for releasing biotherapeutics from QC
• Automated new peak detection is more sensitive than current purity tests employed by QC
• Incredibly powerful tool for detecting new critical quality attributes (revealed during stability assessment)
• Use of filters limits false positives
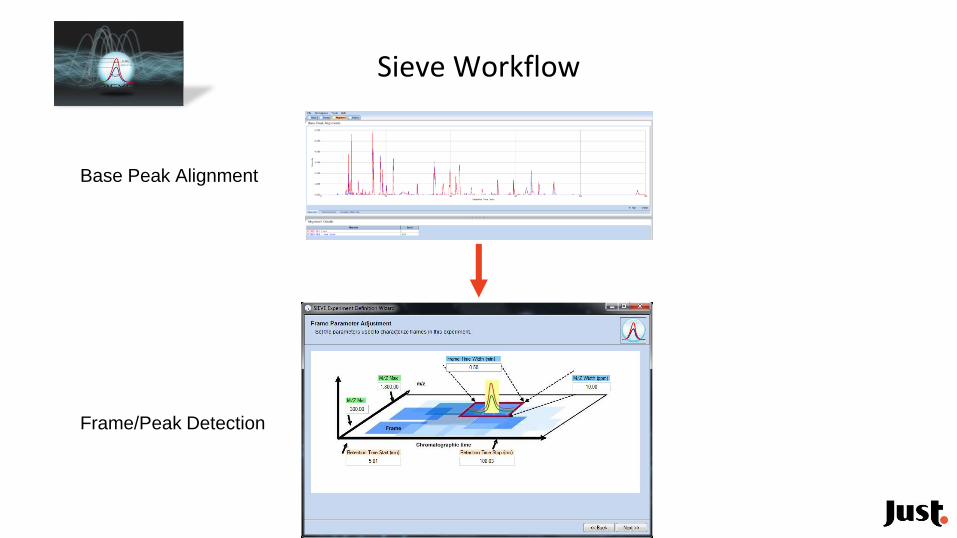
Sieve Workflow
Base Peak Alignment
Frame/Peak Detection

New Peak Detection
Overlay of control and 500 fmol spike
15 peptides spiked into an IgG1
SIEVE can detect peaks that co-elute or are below the visible base peak threshold.
SIEVE detected 13 of 15 peptides • 4 peptides were visible in the base peak chromatogram
• 6 peptides co-eluted with the IgG1 peptides
• 3 peptides below base peak threshold when visually inspected
• 2 peptides not detected did not meet the criteria for a 2nd isotope above LOD threshold
• 0 false positives
Example of 1 peptide detected
in 500 fmol spike
Control trace
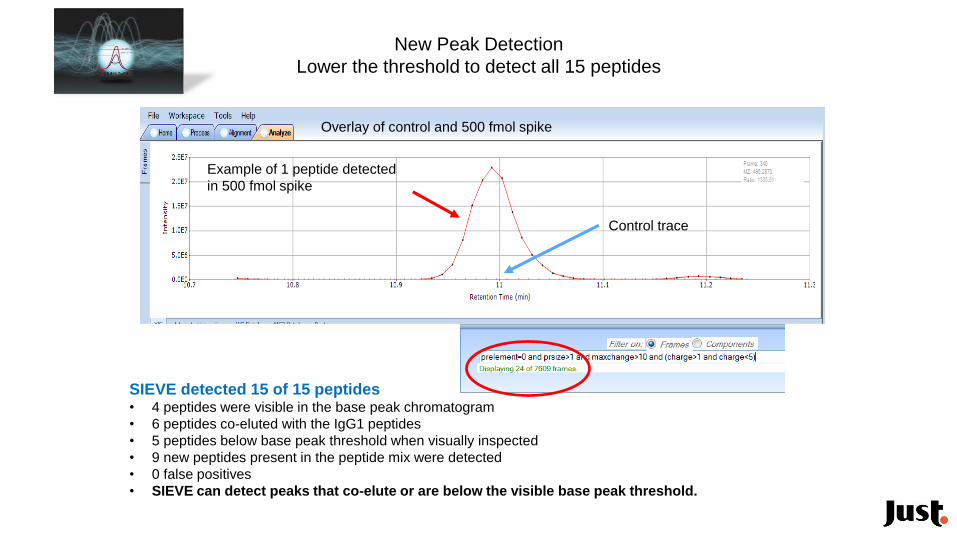
New Peak Detection
Lower the threshold to detect all 15 peptides
Overlay of control and 500 fmol spike
SIEVE detected 15 of 15 peptides • 4 peptides were visible in the base peak chromatogram
• 6 peptides co-eluted with the IgG1 peptides
• 5 peptides below base peak threshold when visually inspected
• 9 new peptides present in the peptide mix were detected
• 0 false positives
• SIEVE can detect peaks that co-elute or are below the visible base peak threshold.
Example of 1 peptide detected
in 500 fmol spike
Control trace
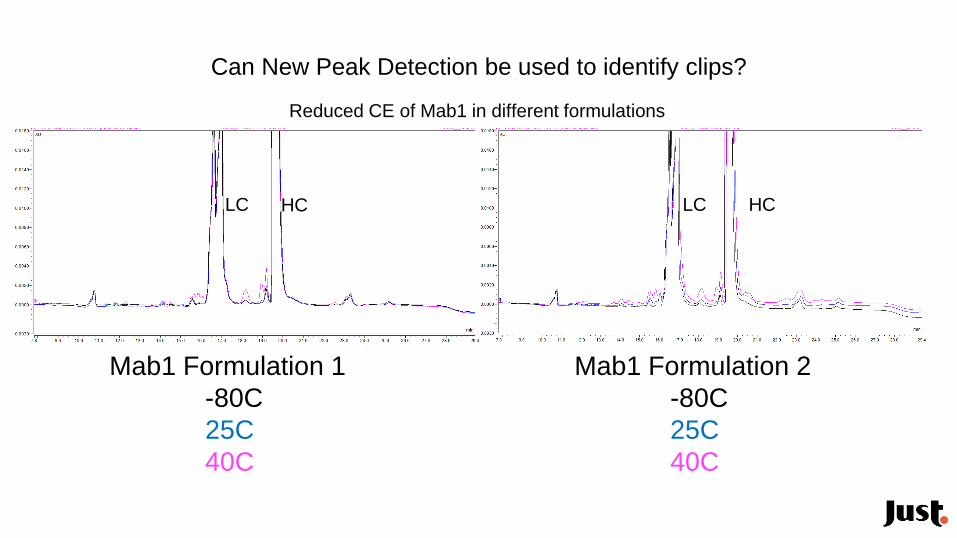
Can New Peak Detection be used to identify clips?
Mab1 Formulation 1
-80C
25C
40C
Mab1 Formulation 2
-80C
25C
40C
Reduced CE of Mab1 in different formulations
HCHC LCLC
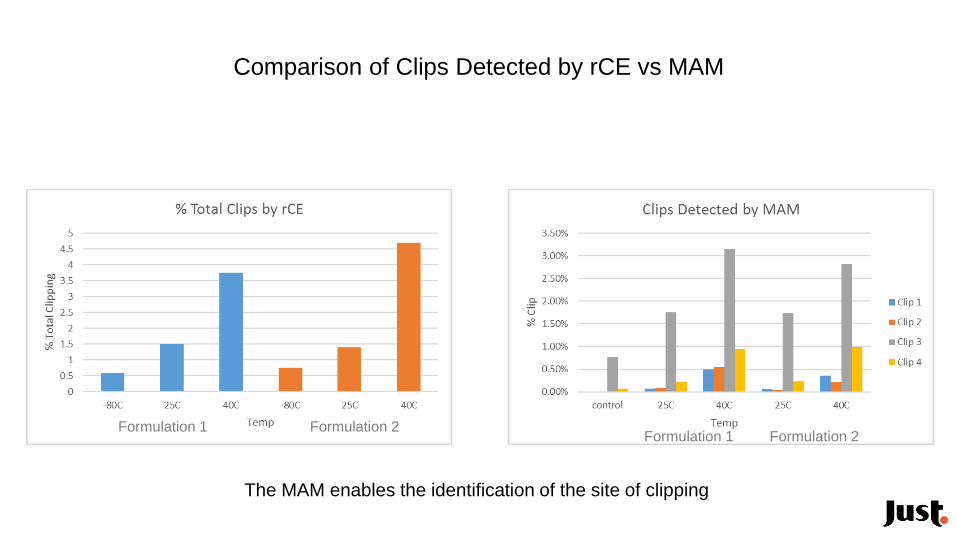
Comparison of Clips Detected by rCE vs MAM
Formulation 1 Formulation 2Formulation 1 Formulation 2
The MAM enables the identification of the site of clipping

Applying the MAM at Just
1. Molecular Optimization
2. Real-time monitoring

MAM and molecular optimization
Table 1: Color Scheme Used for Antibody Region Coloring.
Region/Feature Color Light Chain SILVER Heavy Chain DIM_GRAY LC-CDR1 DODGER_BLUE LC-CDR2 MEDIUM_PURPLE LC-CDR3 CYAN HC-CDR1 BLUE HC-CDR2 DARK_ORCHID HC-CDR3 DARK_CYAN CL LIGHT_SLATE_GRAY CH1 DARK_SLATE_GRAY Hinge GRAY CH2 LIGHT_GRAY CH3 LIGHT_STEEL_BLUE Post-CH3 SLATE_GRAY
Table 2: Color Scheme Used for Hot Spot Coloring.
Hot Spot Color Non-Standard Cys YELLOW Potential N-linked glycosylation site
LIGHT_SALMON
Covariance Site RED Potential Isomerization Site (CDR) FUCHSIA Potential Deamidation Site (CDR) LIGHT_GREEN Potential Trp Oxidation Site (CDR3) FIREBRICK Humanization GREEN Tier 3 Hot Spots CHOCOLATE
Table 3: ABHAND Residue Coloring by Type.
Type Residues Color Acidic DE RED Basic KRH BLUE Hydrophobic ALIMCVP GREEN Aromatic FWY VIOLET Neutral Polar
NQSTBZ GOLD
Deletion G*X BLACK
LC HC

MAM and molecular optimization
LC HC

How do we apply the MAM to a
manufacturing facility?

Real-Time Monitoring
Aseptic cell-free
sampling
Cell culture changes
based on MAM data
MAM
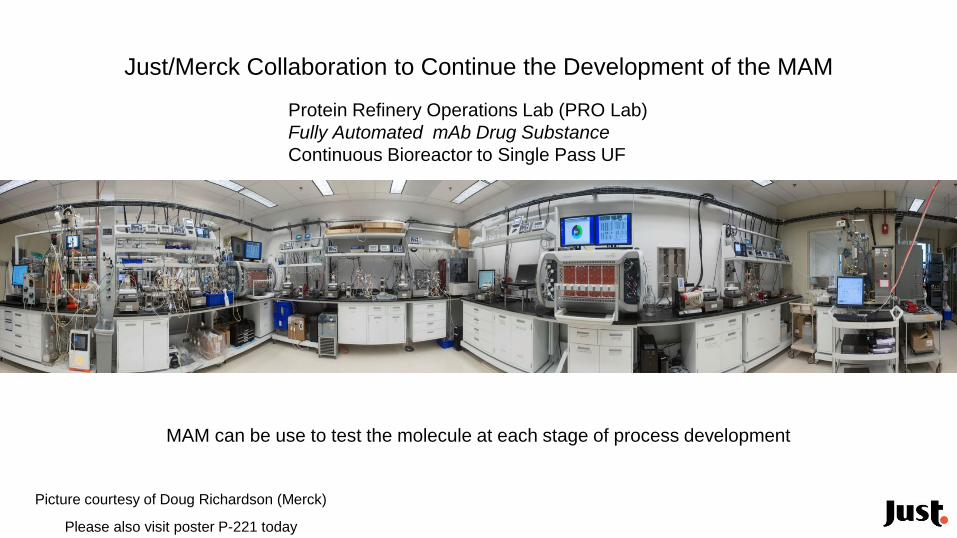
Just/Merck Collaboration to Continue the Development of the MAM
Protein Refinery Operations Lab (PRO Lab)
Fully Automated mAb Drug Substance
Continuous Bioreactor to Single Pass UF
MAM can be use to test the molecule at each stage of process development
Picture courtesy of Doug Richardson (Merck)
Please also visit poster P-221 today

MAM Consortium
• The purpose of the consortium is to enable the BioPharma community to implement a robust
mass spec based method for biotherapeutic characterization and release of biotherapeutics from
QC.
• The Multi-Attribute Method has significantly improved the characterization of biotherapeutics and
can reduce the number assays required for QC release.
• The current format has 1 presentation at each meeting followed by discussion.
• We are going to use the NIST mAb to evaluate similarity between companies and vendors
(focusing on new peak detection).

Summary
• Fully leveraging the MAM for characterizing biotherapeutics requires 3 components
–High-resolution/High-mass accuracy mass spec
–Accurate and fast DDA search software
–New peak detection software
• The MAM is precise and can track attribute trends similar to conventional assays
• The MAM can directly monitor attributes (Man5, c-terminal K, NGHC, deamidation, and Iso D)
• Automated new peak detection using the MAM is more sensitive and robust than the conventional
purity assays
• Automated new peak detection can identify new modifications
• The MAM can be used for molecular optimization, PAC and real-time release of biotherapeutics.
• The MAM consortium is bringing together leaders from the biopharma community to make the
MAM successful for process development and QC release.

Acknowledgments
Just Biotherapeutics—Nancy Nightlinger and Randal Bass
ThermoFisher—Scott Peterman, Amol Prakash, Jennifer Sutton, Hongxia Wang, Tonya
Second, Kevin Wheeler, Mary Lopez, Zhiqi Hao, Betty Woo, Ryo Komatsuzaki,
Christopher Nickel, and Jonathan Josephs
Amgen Current and Alumni—Da Ren, Brittney Livingston, Sihong Deng, Amanda Miller,
Jennifer Kerr, Yuling Zhang, Becky Scott, Lowell Brady, Brittany Affholter, Quanzhou
Luo, Wenzhou Li, Oleg Borisov, Sabrina Benchaar, Armineh Stone, Jim Navratil, Jay
Stimpson, Jim Bailey, Steve Cockrill, David Basset, Vinny Browning III, Izydor Apostol,
Gang Huang, Jette Wypych, Catherine Eakin, Bob Bailey, and Alain Balland
Merck—Doug Richardson, Yi Wang, Bhumit Patel, David Pollard