lgt private banking asia report 2012/2013 · lgt private banking asia report 2012/2013 an...
TRANSCRIPT
LGT Private Banking AsiaReport 2012/2013An examination of the investment behavior of high net worth individuals in Hong Kong, Singapore and Switzerland
Prof. Dr. Teodoro D. Cocca, Department of Asset Management, Johannes Kepler University LinzContributors: Prof. Annie Koh, Singapore Management University; Prof. Kalok Chan, Hong Kong University of Science & Technology Commissioned by LGT Group


3
Contents
Editorial 4
Management summary – key results 5
1 Objective and methodology 7
2 Portfolio make-up 8
2.1 Use of different forms of investment 8
2.2 Asset allocation 9
2.2.1 Asset allocation (country comparison) 9
2.2.2 Explanatory model for asset allocation 13
2.3 Diversification 15
3 Correlation between return, risk and knowledge 19
3.1 Risk appetite 19
3.2 Level of knowledge 21
3.3 Correlation between risk appetite and knowledge 22
3.4 Focus in terms of return on investment 22
3.5 Belief in market efficiency 24
3.6 Expectations in terms of returns 27
4 Investment decisions and advice 32
4.1 Investment decisions 32
4.2 Relevance and fulfillment of advisory needs 34
4.3 Use of technology in the advisory process 39
5 Conclusion 40
Authors 41
Annex 43

4
Editorial
Dear Reader
Few companies are currently receiving more attention from the media and the general public
than the banks. Rarely have headlines, discussions and analyses concerning the financial
sector been as critical as they are now. While all this has been going on, the users of banking
services, namely bank clients, have slipped off the radar somewhat. The economic and social
benefit provided by the banks depends in large part on how well and how efficiently they
meet their clients’ needs. To do this, they need to know their expectations, objectives and at-
titudes inside out. For a bank to be successful, therefore, the principle “know your customer”
is much more than a legal requirement.
In spring 2010, LGT Group commissioned a broad-based study in Switzerland, Germany and
Austria to gather, for the first time, detailed information about private banking clients and their
investment behavior. This was carried out against the backdrop of the financial crisis, which
had passed its peak and been replaced by the sovereign debt crisis in the euro zone. The
results of that study showed a profound uncertainty on the part of bank clients, a loss of con-
fidence in the stability of the financial system and, as a result, a shift in portfolio weightings in
favor of liquidity and commodities, particularly gold. The fact that good advisory services con-
tinue to be essential for making investment decisions was illustrated by the rather surprising
revelation that private investors’ risk appetite often failed to match their investment behavior
and that they paid too little attention to scientific findings.
Much has changed since 2010, although the underlying situation facing investors remains just
as difficult. We wanted to find out to what extent the results from the 2010 study still held
true, what had changed, and what the main concerns for private investors are now. In addi-
tion, we wanted to learn more about private banking clients in Asia. With this in mind, LGT
Group commissioned a new, extensive study covering private banking clients in Switzerland,
Hong Kong and Singapore in autumn 2012. Some of the results are surprising; others re-
inforce earlier findings. Not very surprisingly, we found that clients from these three markets
differ significantly in a number of ways – proof, if proof were needed, that private banking
clients cannot be lumped together, but rather have their own individual requirements and
expectations.
We hope that this second private banking study will contribute toward a better understanding
of the needs and goals of private investors.
H.S.H. Prince Max von und zu Liechtenstein
CEO LGT Group

5
Management summary – key results
Under the leadership of Prof. Dr. Teodoro D. Cocca, the Department of Asset Management
at the Johannes Kepler University in Linz was commissioned by LGT Group to undertake a
survey of the investment behavior of private banking clients in Hong Kong, Singapore, and
Switzerland during the first half of 2012. A total of 515 people were surveyed (155 in Swit-
zerland and 180 in both Hong Kong and Singapore). The key criterion for participating in the
survey was a minimum amount of available assets: in Switzerland more than CHF 900 000
excluding real estate, in Hong Kong and Singapore more than USD 1 million including real
estate provided that this was not used as the first or second home.
Portfolio make-up
Large cash portfolios in Asia: Private banking clients in Singapore currently invest around
half their assets in cash funds. In Hong Kong this share is around one third, and around
one quarter in Switzerland.
Commodities and gold popular in Asia: The share of assets (excluding cash) invested in
commodities/gold or precious metals is 28% in Singapore and 14% in Hong Kong. In
Switzerland this share only amounts to 8%.
Popularity of shares varies in Asia: The proportion of assets (excluding cash) invested in
shares is 61% in Hong Kong but only 47% in Singapore.
Swiss tend to back bonds: The share of assets (excluding cash) invested in bonds
amounts to 18% in Switzerland. In Hong Kong the share is just 14%, and only 13% in
Singapore.
Low diversification also common in Asia: 67% of interviewees in Singapore do not
have sufficient diversification, i.e. less than four asset classes. In Hong Kong this group
accounts for 45%, and in Switzerland for 53%.
Correlation between return, risk and knowledge
Willingness to take risks in Hong Kong: A feature among interviewees from Hong Kong
is their willingness to take risks. Almost half of those questioned describe themselves as
being comfortable with risk (Singapore: 26%, Switzerland: 23%).
Very good level of knowledge in Hong Kong: The proportion of interviewees who stated
that they have a very good knowledge of investment matters is at 30% considerably
higher than in the other two countries.
Positive correlation between risk appetite and knowledge: A statistically positive, signifi-
cant correlation can be established between appetite for risk and level of knowledge for
all three countries.
Hong Kong and Swiss investors aim for inflation-adjusted growth in value: In relation to
the current year, inflation-adjusted growth in value is the most frequently cited return-on-
investment objective of interviewees in both Hong Kong (31%) and Switzerland (27%).
Singapore is benchmark-oriented: In Singapore the majority of interviewees is guided
by the average performance of the market in relation to the return on their investments
(40%).
Who wants to outperform the market? 19% of those surveyed in Hong Kong aim to
outperform the market (16% in Switzerland, 5% in Singapore).

6 Management Summary
Higher expectations for returns in Asia: The mean return strived for from assets over the
next five years is 5.5% p.a. for those surveyed in Switzerland, 15.2% p.a. for Hong Kong
and 13.3% p.a. for Singapore. 58% of interviewees in Hong Kong and 43% in Singapore
anticipate a return of 10% or more per annum over the next five years – in Switzerland
only 6% have such high expectations.
Belief in market efficiency: A majority of interviewees believe that returns on shares
cannot be predicted and that consequently financial markets are efficient (50% in Switzer-
land, 53% in Hong Kong and 67% in Singapore).
Asian clients do not have faith in Europe: Taking into consideration risk and anticipated
return, European blue chip equities and EUR bonds perform the worst as far as the clients
surveyed in Hong Kong and Singapore are concerned.
Singapore backs gold: Taking into consideration risk and anticipated return, gold is the
asset class most attractive to interviewees in Singapore for the next two years.
Hong Kong backs CNY bonds: Taking into consideration risk and anticipated return,
CNY bonds are the asset class most attractive to interviewees in Hong Kong for the
next two years.
Investment decisions and advice
Independent investment decisions in Hong Kong: The proportion of investors who make
their own investment decisions (without a consultant) is the highest in Hong Kong at 55%
(Singapore 33%, Switzerland 39%).
Low level of client loyalty towards the relationship manager in Singapore: 60% of those
surveyed in Singapore would “certainly not” follow their relationship manager if the latter
moved bank (Hong Kong 37%, Switzerland 33%).
Achieving a better return is the most important need in Asia: Achieving a better return on
investments thanks to advice from the bank is considered the principal need of private
banking clients in both Hong Kong and Singapore.
Need to achieve a better return is fulfilled better in Asia: In Hong Kong and Singapore
those surveyed give higher ratings to the fulfillment of the need for a better return than do
those in Switzerland.
Technology-minded Hong Kong investors: Although the differences between the countries
are not huge, those surveyed in Hong Kong proved to be more technology-minded than
the other participants in the survey.

7
1 Objective and methodology
Under the leadership of Prof. Dr. Teodoro D. Cocca, the Department of Asset Management
at the Johannes Kepler University in Linz was commissioned by LGT Group to undertake a
survey of the investment behavior of private banking clients in Hong Kong, Singapore, and
Switzerland during the first half of 2012. The survey focused on, among other things, the
make-up of portfolios, attitude to risk, expectations in terms of return, and advisory needs of
private banking clients.
A total of 515 people were questioned (155 in Switzerland and 180 in both Hong Kong and
Singapore). In Switzerland the survey was carried out through CAWI (computer-assisted web
interviews) on the basis of an online panel,1 while PAPI (personal paper and pencil interviews)
were used in Hong Kong and Singapore.2 The key criterion for participating in the survey was
a minimum amount of available assets: in Switzerland more than CHF 900 000 excluding real
estate, in Hong Kong and Singapore more than USD 1 million including real estate provided
that this was not used as the first or second home.3
The present study is based on the “LGT Private Banking Report 2012” study published in June
2012, which examines the investment behavior of private investors in Switzerland and Austria.
The data on Switzerland published in that report are used in this study to provide a compari-
son with the two Asian financial centers of Hong Kong and Singapore.
When comparing the results of the countries we primarily comment on those differences that
are statistically significant.4
1 The survey in Switzerland was conducted by the LINK Institute in the German and French-speaking parts of the country using an existing online panel that is recruited by phone and represents a permanent pool of questionees about whom socio-demographic information is available and who are regularly invited to participate in online surveys.
2 The surveys in Asia were conducted by the Research Pacific Group. In Singapore an English questionnaire was used. In Hong Kong the interviews were conducted in either English or Chinese.
3 For details of the samples used in the different countries, please refer to figures A1, A2 and A3 in the annex.4 Statistical significance is examined using t-tests for proportional values and z-tests for mean values.

8
2 Portfolio make-up
Key results
Large cash portfolios in Asia: Private banking clients in Singapore currently invest around half
their assets in cash funds. In Hong Kong this share is around one third, and around one quar-
ter in Switzerland.
Commodities and gold popular in Asia: The share of assets (excluding cash) invested in com-
modities/gold or precious metals is 28% in Singapore and 14% in Hong Kong. In Switzerland
this share only amounts to 8%.
Popularity of shares varies in Asia: The proportion of assets (excluding cash) invested in shares
is 61% in Hong Kong but only 47% in Singapore.
Swiss tend to back bonds: The share of assets (excluding cash) invested in bonds amounts to
18% in Switzerland. In Hong Kong this share is just 14%, and only 13% in Singapore.
LowdiversificationalsocommoninAsia:67%ofintervieweesinSingaporedonothavesuffi
cientdiversification,i.e.lessthanfourassetclasses.InHongKongthisgroupaccountsfor45%,
andinSwitzerlandfor53%.
2.1 Use of different forms of investment
The use the interviewees make of different forms of investment is illustrated in Figure 1.
When interpreting the figures below it is important to note that the values relate to frequency
and not to the distribution of assets on a percentage basis (cf. section 2.2).
As a general principle, it can be seen that use of the different forms of investment is very
similar in Switzerland and Hong Kong. However, significant differences emerge when these
two countries are compared with Singapore.
In Switzerland and Hong Kong almost all those surveyed hold shares, this being the asset
class with the greatest frequency. This is followed by funds5 and bonds with a penetration
of approximately 70% and 50% respectively among interviewees in Switzerland and Hong
Kong. Some 40% of investors surveyed from both countries stated that they invest in com-
modities/gold or precious metals. Derivatives are held by 30% (Switzerland) and 24% (Hong
Kong) of the interviewees, and alternative investments (e.g. hedge funds, private equity etc.)
are used by some 15% of people surveyed.
Compared with Switzerland and Hong Kong, a statistically significantly lower frequency of
shares, bonds, and investment funds is apparent in Singapore. Of particular note is the fact
that in Singapore commodities/gold or precious metals is the third most frequent asset class,
even ahead of bonds (which is the third most frequent in Switzerland and Hong Kong).
5 The term “fund” is used synonymously with the term “investment fund”.

9Portfolio make-up
0% 10% 20%
Shares
Bonds
Investment funds
Derivatives
Commodities
Alternative investments
98% (B)
83%
95% (B)
54% (B)
29%47% (B)
74% (B)
49%71% (B)
24%
30%30%
41%
35%38%
17%
13%16%
30% 40% 50% 60% 70% 80% 90% 100%
Figure 1: Use of different forms of investment (country comparison)
n = interviewed investors
A, B, C: frequency significantly higher than in country A, B, C (p <0.05)
Hong Kong [n 180] (A)Switzerland [n 155] (C)
Singapore [n 180] (B)
2.2 Asset allocation
2.2.1 Asset allocation (country comparison)
Figure 2 shows the average asset portfolio resulting from an aggregation of the individual
portfolios of the interviewees. The individual portfolios were weighted according to size. The
respective asset class contains direct and indirect assets. Fund assets are thus allocated to
the respective original asset class. Only mixed investment funds are shown separately, as
they cannot be allotted to an asset class. In addition, in Figure 2 the cash share is shown first
as a percentage of the total assets, and below this the percentage shares of the individual
asset classes are shown without regard to the cash share.
The cash shares vary significantly between the individual countries. Private banking clients in
Singapore currently invest around half of their assets in cash funds. In Hong Kong this share
amounts to around one third, and around one quarter in Switzerland.
There are significant differences between the countries with regard to invested funds for
2012. Private banking clients in Hong Kong invest an average of 61% in shares, 14% each
in bonds and commodities/gold or precious metals and 4% each in derivatives and alter-
native investments. In Singapore the average investment portfolio consists of 47% shares,

10 Portfolio make-up
0% 10% 20%
Cash
Shares
Asset allocationexclusive of cash
(sum: 100%)
Bonds
Mixed investment funds
Derivatives
35% (C)
52% (A, C)
27%
61% (B)
47%60% (B)
14%
13%18% (B)
3% (B)
1%5% (A, B)
4%
8% (A)6%
Commodities
14% (C)
28% (A, C)8%
Alternative investments
4%
3%3%
30% 40% 50% 60% 70% 80% 90% 100%
Figure 2: Average asset allocation (country comparison)
n = interviewed investors,weighted by investment capital
A, B, C: frequency significantly higher than in country A, B, C (p <0.05)
Hong Kong [n 180] (A)Switzerland [n 155] (C)
Singapore [n 180] (B)
28% commodities/gold or precious metals, 13% bonds, 8% derivatives and 3% alternative in-
vestments. In Switzerland on the other hand, 60% was invested in shares, 18% in bonds, 8%
in commodities/gold or precious metals, 6% in derivatives and 3% in alternative investments.
There are thus significant differences between the countries examined with regard to the
percentage of shares, which is lowest in Singapore. On the other hand, the proportion of
investments in commodities/gold or precious metals is substantially higher in Singapore than
in the other two countries. Statistically, the percentage of derivatives is significantly higher in
Singapore than in Hong Kong. The bond share is highest in Switzerland at 18%.
If a comparison were to be made between Switzerland and the two Asian financial centers, it
would be apparent that Asian clients account for a higher share of cash funds, and also invest
considerably more assets in commodities/gold or precious metals. In addition, bonds are less
popular with Asian investors than with Swiss investors.

11Portfolio make-up
It is interesting to note the lower investment percentage into derivatives for Hong Kong, given
that Hong Kong investors are known to be more risk-taking and also possess good knowledge
in the derivatives market. In fact, the derivatives warrant market in Hong Kong has been con-
sistently ranked among the top in the world in terms of market turnover. The lower percentage
inderivativesprobablyreflectsthefactthatHongKonginvestorshavealowerappetiteforstruc-
turedproductssincethe20082009financialcrisis,asalotofinvestorslostsignificantamount
of their wealth in structured products such as Lehman minibonds and accumulators.6 They
havelostconfidenceinstructuredproducts,especiallythosethathavemorecomplexdesigns
and are riskier.
Furthermore, the regulators in Hong Kong have also introduced more stringent measures to
regulatethederivativesproductssoldbythebanksandotherfinancialinstitutions,making
itmoredifficultforinvestorstobuystructuredproducts.Forexample,banksusedtobeable
to sell structured products easily to the public, as long as the denominations were at least
HKD500000(aroundUSD62500).Theunderlyingassumptionwasthatanyonebuyingthat
volume was sophisticated enough to understand the risks of the investment. As a result, a lot
ofinvestorsboughtHongKong’sminibonds,andwhentheminibondsdeclinedsignificantly,
many investors went to the street to protest and demand full compensation from the banks.
Afterthefinancialcrisis,theHongKongSecuritiesandFuturesCommissionandHongKong
MonetaryAuthority,theregulatoryagenciesinHongKong,requiredthebanksandotherfinan-
cial institutions to assess investors’ experience and knowledge before selling them products.
Banks will sell investment products that suit investors’ needs, risk appetite and to those who
understand the products. But since all structured products involve some form of optionality,
this means banks also have to assess investors’ experience in trading derivatives before selling
them the investment products. This presents a challenge to the selling process. Investors have
tofillinaquestionnaireassessingtheirinvestmentexperienceandriskappetite,alongwith
otherpaperwork.Thebanksandfinancialinstitutionsneedtorecordconversationswithin
vestors about their trading experience before they can sell them the product.
Prof. Kalok Chan
6 Prof. Kalok Chan: Accumulators are high-risk structured products whereby investors agree to purchase a fixed amount of securities, commodities or currency from the bank on a daily basis at a predetermined price. A minibond is not really a bond but a high-risk, credit-linked note linked to a basket of securities. It guarantees investors a regular interest payment, which makes it look like a bond. But during the 2008-2009 financial crisis, following the collapse of Lehman Brothers – an issuing bank for minibonds – the value of minibonds declined significantly and in some cases the minibonds became almost worthless.

12 Portfolio make-up
The Singapore investor
Why overweight in cash?
Cash is an asset class which risk-averse Singaporean investors usually perceive as a safe and
attractive investment with minimal risks, providing generally high liquidity and akin to a “safety
net”intheseuncertaintimes.Inaddition,suchasignificantcashportfolioprovidesSingaporean
investorswiththeflexibilitytofundasubstantialexpenseorpropertyinvestmentoutlaywithout
liquidating assets from one’s long-term investment portfolio.
Why gold?
During the period of H1 2012 when this survey was undertaken, the commodity price indices
were still trending rather strongly. As such, it is not surprising that Singaporean investors have
embraced gold as a safe haven investment with them allocating about 14% of their assets (ex-
cludingcash)tocommodities,goldandotherpreciousmetals(vs.9%inHongKongand5%
in Switzerland).
Even without yielding interest or dividend income, gold continues to be an attractive asset given
thattheSingaporeinterestrateaveragedaround0.15%for3monthSGDdepositsthroughout
2012. As such the opportunity cost for holding cash is so low that even without interest yields, the
potential capital gains of gold are more attractive.
7 Cf. Neumann and Morgenstern (1944)8 Cf. Levinson and Peng (2007)9 Cf. Chui, Titman and Weil (2010)
Cultural influence on investment behavior
According to the traditional theory of decision-making,7 an investor’s asset allocation is deter-
mined by the optimization of his risk preferences, taking into account his risk capacity. From this
pointofview,therearenosystematicbiaseswithrespecttoriskperception.Traditionalfinan-
cial economics thus assumes that cultural factors do not play a role. According to this mode of
thinking, where investment decisions are concerned investors are to be considered the same all
over the world. In recent years, economists have begun to apply their analytical frameworks and
empirical tools to the issue of culture and economic outcomes. Better techniques and expand-
ed data have made it possible to identify systematic differences in people’s preferences. New
researchresultsfrombehavioralfinanceshowthatculturaldifferencescansometimeshave
a “dramatic”8influenceoninvestmentbehavior.Thepresentdescriptivestudyisinlinewith
theseworksandrevealssignificantdifferences,aswellas,insomecases,unexpectedcommon
featuresbetweenculturallydifferentinvestorgroups.Thefactthatculturenotonlydirectlyinflu-
encesinvestmentbehaviorinitselfbutalsoinfluencesmarketreturnsisreflectedinthefinding
that excess returns from momentum strategies compared with market returns can be explained
by the dimension of intolerance towards uncertainty.9 However, it is not only academic research
that is increasingly concerned with these issues. In the business area of private banking, too, the
increasing number of high net worth clients from Asian countries as well as increasing activities
in Asian onshore banking are leading to a more detailed examination of different cultures and
the implications of this for strategies and the range of products in these markets.
Prof. Annie Koh
Prof. Dr. Teodoro D. Cocca

13Portfolio make-up
2.2.2 Explanatory model for asset allocation
Figure 3 looks at the correlations that exist between the proportion of shares and other vari-
ables of the study. This is an attempt to understand better which factors could explain the
differences in share quotas in the asset portfolio mentioned in section 2.2.1.
The regression analysis shows that in Hong Kong the readiness to assume risk10 and the
belief in the efficiency of the market have a significant correlation with the proportion of
shares.11 It reveals that an increased readiness to assume risk is associated with a higher
proportion of shares. Conversely, there is a negative correlation between a strong belief in
market efficiency and the proportion of shares.
In Singapore, on the other hand, different factors seem to influence the proportion of shares.
It even appears that the two significant factors for Hong Kong – readiness to assume risk
and belief in an efficient market – are not at all significant for Singapore. In Singapore the
proportion of shares is related to a tendency to avoid losses12 and to knowledge of investment
matters. The lower the fear of losses and the greater the knowledge, the higher the proportion
of shares.
For the Swiss interviewees there is only one significant factor: the readiness to assume risk.
The greater this is, the larger the proportion of shares.
This is simply because Hong Kong investors tend to buy individual stocks on their own, rather
than buying into the market as a whole through ETFs. In Hong Kong, the more successful ETFs
are those related to Hong Kong and China. However, the trading volume in ETFs is still small
compared with the trading volume in individual stocks. It is only those investors who think that
themarketisefficientwhoinvestmoreinETFsandlessinindividualshares.
Many Hong Kong investors follow commentaries of individual stocks through different media
sources. Many newspapers carry detailed coverage of the stock market and individual stocks,
and there are also stock market commentators on radio and TV programs. As a result, there is no
shortageoffinancialnewsandstockmarketanalysis,evenforlessknowledgeableinvestors.As
a result, the investors can have a false sense of control, thinking that they have obtained useful
informationthatwillhelpthemtoselectwinningstocks.Themoreconfidentthattheyareabout
theinformationtheycanreceive,thelesslikelytheybelieveinstockmarketefficiency.
Prof. Kalok Chan
10 The questionees’ own assessment of their readiness to assume risk has been used (the wording of the question was: “How would you categorize yourself with respect to your readiness to assume risk when investing? Risk averse, risk neutral, comfortable with risk?”).
11 The coefficient of determination, R-squared, of the various regressions is relatively low (between 0.11 and 0.17). This means that the proportion of variation that is explained by the regression model is small, and consequently the variables used cannot conclusively explain the differences in the proportions of shares.
12 This refers to the question regarding the benchmark for expectations in terms of return (wording: “What is your most important objective with regard to the return on your assets in 2012?” Questionees who gave “not to suffer any losses” as an answer are expressing a high degree of fear of losses.

14 Portfolio make-up
The results do not indicate that different factors in the different countries are basically as-
sociated with a high proportion of shares. The two factors of “readiness to assume risk”
and “avoidance of losses,” which seem to exert the most influence on the quota of shares,
produce very similar behavior or attitude characteristics.
Figure 3: Regression analysis for the proportion of shares
0.26Readiness to assume risk
Readiness to assume risk
n.s.Avoidance of losses
n.s.Knowledge
Percentage of shares
0.19Believe in efficient market
n.s.
0.16Avoidance of losses
0.28Knowledge
n.s.Believe in efficient market
0.17
0.16
Percentage of shares
Readiness to assume risk 0.33
n.s.Avoidance of losses
n.s.Knowledge
n.s.Believe in efficient market
0.11
Percentage of shares
n = interviewed investors
Hong Kong [n 180]
Singapore [n 180]
Switzerland [n 155]
Effect size: regression coefficient beta, p <0.05, n.s. = not significantModel fit: R-squared
x.xxy.yy

15Portfolio make-up
2.3 Diversification
To record the level of diversification of investments, two aspects of asset allocation were
taken into consideration:
1. Number of asset classes used
2. Spread of assets over the various asset classes
From the data collected on these two dimensions that measure the distribution of the assets,
an index was established which measures the level of diversification on a scale of one (mini-
mal diversification)17 to five (maximum diversification).18 Figure 4 shows the results of this
approach, with the numerical index values calculated for each country shown in three groups
(“low” for values <2, ”medium” for values = 3, “high” for values >4).
For Hong Kong we see that investments are in an average of 3.5 asset classes, with 17%
investing in fewer than two asset classes and 56% in more than four asset classes. Conse-
quently, this results on average in a good diversification as far as asset classes are concerned.
For Switzerland the figures are almost identical and therefore so is the evaluation. In Singa-
pore, on the other hand, those surveyed have a worse level of diversification. On average only
three asset classes are held and 30% of interviewees are considered to have a poor level of
diversification.
Measuring cultural characteristics
Culturecanbedefinedas“thosecustomarybeliefsandvaluesthatethnic,religious,andsocial
groups transmit fairly unchanged from generation to generation.”13 According to the Dutch so-
ciologistGeertHofstede,socialbehavior(investmentbehaviorispartofsocialbehavior)canbe
describedusingfivedimensions:powerdistance,individualism,uncertaintyavoidance,mascu
linity, and long-term orientation.14 For the purposes of this study, the “uncertainty avoidance”
and“longtermorientation”dimensionsareconsideredparticularlyrelevant.Usingthesedimen
sions,aclassificationofthethreecountriesexaminedinthisstudycanbecarriedout.15 This is
ex panded on in the text boxes on page 17 and 23. A study that appeared recently in Science
attempts to describe countries using different criteria. It makes a distinction between countries
or societies that are “tight” or “loose.” The criterion “tight” describes countries that have strong
norms and a low tolerance of deviant behavior. The criterion “loose,” on the other hand, describes
countries that have weak norms and a high tolerance for deviant behavior. In this context,
Singapore is referred to as more of a “tight” culture, while Hong Kong displays similar values to
GermanyorAustria(Switzerlandwasnotincludedinthestudy).16
Prof. Dr. Teodoro D. Cocca
13 Guiso, Sapienza and Zingales (2006)14 Cf. Hofstede (2001); Hofstede and Gert (2005)15 It should be pointed out that, in some cases, there are significant differences between the different linguis-
tic regions of Switzerland with regard to the characteristics of Hofstede’s five dimensions, which will not be dealt with in detail here.
16 Cf. Gelfand et al. (2001)17 A score of 1 would mean that a questionee holds all his assets in one asset class, e.g. all in cash.18 A score of 5 would, for example, mean that a questionee spreads all his assets equally over all available
asset classes.

16 Portfolio make-up
If the spread between the asset classes is considered, rather than the number of asset
classes held, it emerges that those surveyed in Hong Kong have the highest level of diversi-
fication compared with the other two countries: 64% of interviewees are considered to have
a high level of diversification from this perspective.
In order to obtain an overall picture, an aggregated index of diversification level was establis-
hed that is calculated as a mean from the two sub-indexes calculated in this way (cf. Figure
5). It is apparent from this that when the three countries are compared and the parameters
used here are taken into account, the investors surveyed in Singapore have a narrower diver-
sification than those in Hong Kong and Switzerland. A quarter of those surveyed in Singapore
can be classified as having a low level of diversification, whereas this group is much smaller
in Switzerland and Hong Kong at 9% and 7% respectively. If the clients with a medium level
of diversification are also taken into account, it can be ascertained that in Singapore 67%
have insufficient diversification. In Hong Kong this group stands at 45%, and in Switzerland
at 53%.
0% 10% 20% 30% 40% 50% 60% 70% 80% 90% 100%
Figure 5: Aggregated diversification index
Switzerland [n 155] (C)
Singapore [n 180] (B)
Hong Kong [n 180] (A)
3.5 (B)9% 44% 37%47%
3.224% 43% 33%
7% 38% 55%
A, B, C: mean significantly higher than in country A, B, C (p <0.05) n = interviewed investors
low ( 2) high ( 4) Meanmedium (3)
3.6 (B)
0% 10% 20% 30% 40% 50% 60% 70% 80% 90% 100%
Figure 4: Level of diversification measured in number and spread index
A, B, C: mean significantly higher than in country A, B, C (p <0.05) n = interviewed investors
Hong Kong [n 180] (A)
Number of asset classes
Singapore [n 180] (B)
low ( 2) high ( 4) Meanmedium (3)
30% 37% 33%
17% 27% 56% 3.5 (B)
(B)
(B, C)
3.0
Switzerland [n 155] (C) 17% 30% 53% 3.5
Hong Kong [n 180] (A)
Spread of asset classes
Singapore [n 180] (B) 17% 32% 51%
4% 32% 64% 3.7
3.4
Switzerland [n 155] (C) 13% 43% 44% 3.4

17Portfolio make-up
ThehigherlevelofdiversificationisalsoanindicationthatHongKonginvestorshavemore
investmentknowledgeindifferentfinancialinstruments,sotheyinvestindifferentassetclasses.
It is quite typical for investors to invest in shares and equity mutual funds. But on the other hand,
theconcernabouttherisksoffinancialinvestmentsafterthefinancialcrisispushedtheminto
diversifying their asset classes, like buying the bonds that promise regular payments. In particu-
lar,highyieldbondshavebecomequitepopularamonginvestors,whofindthatsomecorporate
bonds provide quite attractive returns. At the same time, because investors are concerned about
theinflationarypressurearisingfrommonetaryeasingintheUnitedStates,EuropeandChina,
theyalsoinvestinthecommoditieswhichprovideagoodhedgeagainstinflation.
The Singaporean investor and low diversification
GiventheobservationthatmanySingaporeaninvestorssurveyedareholdingasignificant
proportionoftheirwealthincashandthatanothersignificantproportiongoestogoldandother
commodities, it is not surprising to observe that the average Singaporean is not diversifying be-
yond two or three asset classes. They are likely holding on to cash and learning about investments
and increasing their knowledge and understanding of the intricacies of the diverse investment
products across different asset classes before making the necessary investment commitments.
The astute investment advisor should see this as an opportunity to serve as a knowledge partner
andwinthetrustoftheSingaporeaninvestor,tohelphimorherlearnaboutthebenefitsof
diversification.
Comparison of the inclination toward long-term orientation
According to Hofstede, the long-term orientation dimension is closely related to the teachings of
Confucius and can be interpreted as dealing with society’s search for virtue, the extent to which
a society shows a pragmatic future-oriented perspective rather than a conventional historical
short-term point of view. The Swiss score high on this dimension, making it a short-term orienta-
tion culture. Societies with a short-term orientation generally exhibit great respect for tradi-
tions, a relatively small propensity to save, strong social pressure to “keep up with the Joneses,”
impatience for achieving quick results, and a strong concern with establishing the truth. Western
societies are typically found at the short-term end of this dimension. Singapore scores almost
like Switzerland. Yet Singapore shows cultural qualities supporting long-term investment such
as perseverance, sustained efforts, slow results, thrift, being sparse with resources, ordering rela-
tionships by status and having a sense of shame (see also again Confucian teachings). Whereas
Westerners search for the truth, the Singaporeans emphasize virtue and the way you do things.
Prof. Kalok Chan
Prof. Annie Koh
Prof. Dr. Teodoro D. Cocca

18 Portfolio make-up
Ontheotherhand,whileHongKongisinfluencedbyConfucius,itspeoplearemoreshortterm
oriented and more entrepreneurial. Some say this is because Hong Kong was a British colony
until 1997 before the handover to China, and a lot of Hong Kong residents treated Hong Kong as a
“borrowed place.” Many Hong Kong residents migrated to other countries before the handover in
1997, as they were concerned about the political uncertainty and afraid of losing their economic
freedom afterwards. Consequently, they adopted a short-term attitude and were much more
willing to take risks, as they hoped to make money so that they could emigrate to other countries.
Even though Hong Kong enjoyed a smooth handover and a lot of residents who have emigrated
to other countries returned to Hong Kong, the short-term mindset still persists. Indeed a lot of
Hong Kong residents who emigirated left money before they emigrated. This leads them to be
more short-term-oriented and more prone to risk-taking. Even investment in real estate prop-
er ties can be simply for short-term speculation in Hong Kong, as the Hong Kong’s real estate
market is also very volatile.
Prof. Kalok Chan
They always keep their options open as there are many ways to skin a cat. Westerners believe that
if A is right, B must be wrong, whereas people from East and Southeast Asian countries see that
both A and B combined produce something superior. This mindset allows for a more pragmatic
approach to business.19
The entrepreneurial orientation described by Hofstede could be seen to be a way of explaining
the high level of readiness to assume risk of those surveyed in Hong Kong for this study.
19 http://geert-hofstede.com/switzerland.html; http://geert-hofstede.com/singapore.html; http://geert-hofstede.com/hong-kong.html

19
3 Correlation between return, risk and knowledge
Key results
Willingness to take risks in Hong Kong: A feature among interviewees from Hong Kong is their
high degree of willingness to take risks. Almost half of those questioned describe themselves
as being comfortable with risk (Singapore 26%, Switzerland 23%).
Very good level of knowledge in Hong Kong: The proportion of interviewees who stated that
they have a very good knowledge of investment matters is at 30% considerably higher than in
the other two countries.
Positivecorrelationbetweenriskappetiteandknowledge:Astatisticallypositive,significant
correlation can be established between appetite for risk and level of knowledge for all three
countries.
HongKongandSwissinvestorsaimforinflationadjustedgrowthinvalue:Inrelationtothe
currentyear,inflationadjustedgrowthinvalueisthemostfrequentlycitedreturnoninvest-
ment objective of interviewees in both Hong Kong (31%) and Switzerland (27%).
Singapore is benchmark-oriented: In Singapore the majority of interviewees is guided by the
average performance of the market in relation to the return on their investments (40%).
Who wants to outperform the market? 19% of those surveyed in Hong Kong aim to outperform
themarket(Switzerland16%,Singapore5%).
Higher expectations for returns in Asia: The mean return strived for from assets over the next
fiveyearsis5.5%p.a.forthosesurveyedinSwitzerland,15.2%p.a.forHongKongand13.3%p.a.
forSingapore.58%ofintervieweesinHongKongand43%inSingaporeanticipateareturnof10%
ormoreperannumoverthenextfiveyears–inSwitzerlandonly6%havesuchhighexpectations.
Beliefinmarketefficiency:Amajorityofintervieweesbelievethatreturnsonsharescannot
bepredictedandthatconsequentlyfinancialmarketsareefficient(50%inSwitzerland,53%in
Hong Kong and 67% in Singapore).
Asian clients do not have faith in Europe: Taking into consideration risk and anticipated return,
EuropeanbluechipequitiesandEURbondsperformtheworstasfarastheclientssurveyedin
Hong Kong and Singapore are concerned.
Singapore backs gold: Taking into consideration risk and anticipated return, gold is the asset
class most attractive to interviewees in Singapore for the next two years.
Hong Kong backs CNY bonds: Taking into consideration risk and anticipated return, CNY bonds
are the asset class most attractive to interviewees in Hong Kong for the next two years.
3.1 Risk appetite
In answer to the question of how investors would classify themselves with regard to willing-
ness to assume risk, 65% of Swiss interviewees placed themselves in the risk-neutral group
(cf. Figure 6). The proportion of investors who are comfortable with risk stands at 23%, and
those averse to risk at 12%. In Singapore the percentage of private banking clients willing to
take risks is similar; however, the proportion of those averse to risk is higher in Singapore at
25%. Hong Kong, on the other hand, stands out with almost half those surveyed stating that
they were comfortable with risk.

20 Correlation between return, risk and knowledge
20 Cf. Fan and Jiao (2006)21 Cf. Weber and Hsee (1998); Statman and Klimek (2008)22 Framing effects are the changes in a decision-making process based on how the decision is framed. The
rational theory of choice assumes description invariance: equivalent formulations of a choice problem should give rise to the same preference order. Contrary to this assumption, there is much evidence that variations in the framing of options (e.g., in terms of gains or losses) yield systematically different preferences (Tversky and Kahneman (1986)).
23 Cf. Wang and Fishbeck (2004); Levinson and Peng (2006)
0% 10% 20% 30% 40% 50% 60% 70% 80% 90% 100%
Figure 6: Self-assessment of willingness to assume risk
Switzerland [n 155]
Singapore [n 180]
Hong Kong [n 180]
12% 65% 23%
25% 49% 26%
7% 46% 47%
n = interviewed investorsaverse to risk comfortable with riskrisk neutral
Risk behavior
Studies into risk behavior reveal great differences between regions with different cultural iden-
tities. Overall, these studies show that Asian investors display more risk tolerance and less loss
aversion than European investors when it comes to investment risks.20 An explanatory model of
this is provided in the literature by the “cushion hypothesis” by Weber and Hsee.21 This suggests
that people in a collectivist society, such as China, are more likely to receive help from their
familyandfriendsiftheyareinfinancialneed.Themonetaryriskis,therefore,notperceivedto
be so great. A higher reference point or aspiration level could also serve as an explanatory model.
Higher expectations in relation to the target return would logically lead to behavior that was
morecomfortablewithrisk(andviceversa).Thisisclearlyshowninthepresentstudy.Research
is still ongoing into the way in which these expectations are formed. What has been demonstrat-
ed, however, is that Chinese investors are more prone to the so-called framing effect22 and are
morestronglyinfluencedbytheirsocialenvironmentwhenpurchasingfinancialproducts.23 In
addition, it is worth mentioning Hsee and Weber’s observation (1999) that Chinese investors are
morecomfortablewithriskspecificallywhenmakinginvestmentdecisionsandnotsocomfort
able in other, everyday decision-making situations.
AsHongKongandSingaporeareinternationalfinancialcenters,theirinvestorshavemore
experienceindealingwithstockmarketfluctuationsandaremorecomfortableintolerating
investment risks.
Prof. Dr. Teodoro D. Cocca
Prof. Kalok Chan

21Correlation between return, risk and knowledge
3.2 Level of knowledge
In answer to the question of how investors rate their own knowledge of investment matters,
39% of those surveyed from Switzerland stated that they have a good level of knowledge, 16%
even very good (cf. Figure 7). In Singapore the values are similar. Hong Kong, on the other hand,
reveals a very different picture: the percentage of those surveyed who believe that they have
a very good level of knowledge is at 30% considerably higher than in the other two countries.
0% 10% 20% 30% 40% 50% 60% 70% 80% 90% 100%
Figure 7: Self-assessment of knowledge
Switzerland [n 155]
Singapore [n 180]
Hong Kong [n 180]
45% 39% 16%
48% 45% 7%
36% 34% 30%
n = interviewed investorsno or basic knowledge very good knowledgegood knowledge
Who is (not) similar to whom?
In this study, the data predominantly show a certain similarity in the behavior of investors in
Hong Kong and Switzerland. This is not the case across the board, but a similarity in investment
behavior is more discernible between Switzerland and Hong Kong than between Singapore and
Hong Kong or between Switzerland and Singapore. This does not conclusively tally with the
findingsofHofstede’scomparisonoftheculturaldimension“uncertaintyavoidance,”inwhich
Hong Kong and Singapore are closer together. What is surprising in this context is the aspect of
self-assessment of willingness to assume risk. As expected, the proportion of investors comfort-
able with risk in Hong Kong is considerably larger than in Switzerland, but (unexpectedly) also
considerably larger than in Singapore. This last fact is, to a certain extent, contradictory to the
literature and could be related to the higher level of knowledge among Hong Kong investors (see
section3.2).Accordingtofindingsofbehavioralfinance,thehigherlevelofknowledgeinvolves
the risk of overestimating one’s capabilities, which could explain the greater willingness to
assume risk.24 The greater willingness to assume risk is also revealed in a higher percentage
of interviewees in Hong Kong who aim to outperform the market. And the picture of a certain
“overestimationofone’scapabilities”iscompletedbythehighertargetreturnsspecifiedby
Hong Kong investors compared with those of the other two countries. These observations are
confirmedbythefactthatsomescientificworksindicatethatthereisagreatertendencytoover
estimate one’s capabilities in Asian countries than in Western nations. This can be attributed to
a collectively shaped culture that promotes compliant behavior over the tendency to question
knowledge.25 It is, however, also argued that investors from individualistic cultures should be
more prone to overestimating their capabilities because they are encouraged from childhood
tobedifferentfromothersandbecauseselfconfidenceisvigorouslyfostered.26
Prof. Dr. Teodoro D. Cocca
24 Cf. Chen et al. (2007)25 Cf. Wright and Phillips (1980); Yates et al. (1996) 26 Cf. Chui, Titman and Wei (2005)

22 Correlation between return, risk and knowledge
3.3 Correlation between risk appetite and knowledge
Figure 8 examines the correlation between risk appetite and the investors’ level of knowledge.
Those surveyed evaluated their own appetite for risk and level of knowledge. A statistically
positive, significant correlation can be established: the higher an investor rates his level of
knowledge, the greater the appetite to assume risk and vice versa. There are no fundamental
differences between the countries.
3.4 Focus in terms of return on investment
In relation to the current year, inflation-adjusted growth in value is the most frequently cited
return-on-investment objective of interviewees in both Hong Kong (31%) and Switzerland
(27%). However, in Singapore the majority of interviewees focuses on the average perfor-
mance of the market (40%). In addition, a feature of Singapore is that a smaller than average
number has the intention of outperforming the market (only 5%).
Figure 9 also shows the mean return expectation that those questioned have for the next
five years. This reveals that expectations for returns are considerably higher in the two Asian
countries than in Switzerland. For example, investors in Hong Kong who want to outperform
the market anticipate a return of 17%, those in Singapore a return of 19.2%, and in Switzer-
land 8.8%.
Figure 8: Correlation between knowledge and risk
0% 10% 20%
Averse to risk
3%
20%
9%
40%30% 0% 10% 20%
3%4%
2%
40%30% 0% 10% 20% 30%
1%1%
1%
40%
0% 10% 20%
Risk neutral
23%
19%
31%
40%30% 0% 10% 20%
16%27%
27%
40%30% 0% 10% 20% 30%
7%3%
7%
40%
0% 10% 20%
Comfortablewith risk
10%
8%
5%
40%30% 0% 10% 20%
16%14%
10%
40%30% 0% 10% 20% 30%
21%4%
8%
40%
n = interviewed investorsSwitzerland [n 155]Singapore [n 180]Hong Kong [n 180]
no or basic knowledge good knowledge very good knowledge

23Correlation between return, risk and knowledge
0% 10% 20%
Not to suffer any losses
To achieve absolute growth in value
To achieve inflation-adjusted growth in value
To achieve the averageperformance of the market
To outperform the market
6%
10%
17% (A)
20%
19%17%
31%
25%27%
24%
40% (A,C)24%
19% (B)
5%16% (B)
30% 40% 50% 60% 70% 80% 90% 100%
Figure 9: Benchmark for expected returns on investment
n = interviewed investors
Mean
A, B, C: frequency significantly higher than in country A, B, C (p <0.05)
Hong Kong [n 180] (A)Switzerland [n 155] (C)
Singapore [n 180] (B)
13.1
12.8
3.9
18.0
13.8
5.6
13.0
14.6
4.8
14.7
11.9
4.6
17.0
19.2
8.8
Comparison of the inclination toward uncertainty avoidance
According to Hofstede, “(…) the dimension ‘uncertainty avoidance’ has to do with the way that
a society deals with the fact that the future can never be known. This ambiguity brings with it
anxiety and different cultures have learnt to deal with this anxiety in different ways. The extent
to which the members of a culture feel threatened by ambiguous or unknown situations and
havecreatedbeliefsandinstitutionsthattrytoavoidtheseisreflectedintheinclinationtoavoid
uncertainty and is measured by a score. Switzerland scores high on this dimension and thus has
a strong preference for avoiding uncertainty. Countries exhibiting high uncertainty avoidance
maintain rigid codes of belief and behavior and are intolerant of unorthodox behavior and ideas.
In these cultures there is an emotional need for rules, ‘time is money’ is an often cited slogan,
people have an inner urge to be busy and work hard, precision and punctuality are the norm,
innovation may be resisted, security is an important element in individual motivation. Decisions
are taken after careful analysis of all available information. In contrast, Singapore scores very
low on this dimension. In Singapore people abide by many rules not because they have need for
structure but because people in Singapore accept that power is distributed unequally. Singapor-
eanscalltheirsocietya‘Finecountry.You’llgetafineforeverything.’HongKong,ontheother
hand, has a score on uncertainty avoidance between Switzerland and Singapore. Adherence to
lawsandrulesmaybeflexibletosuittheactualsituationandpragmatismisafactoflife.The
people in Hong Kong are comfortable with ambiguity; the Chinese language is full of ambiguous
meaningsthatcanbedifficultforWesternpeopletofollow.Theyareadaptableandentrepre-
neurial.”27 The data in the present study only partially agrees with the characteristic features
Prof. Dr. Teodoro D. Cocca
27 http://geert-hofstede.com/switzerland.html; http://geert-hofstede.com/singapore.html; http://geert-hofstede.com/hong-kong.html

24 Correlation between return, risk and knowledge
3.5 Belief in market efficiency
The question as to whether the financial market is regarded as efficient is hotly debated
in academic circles. It is interesting to learn now what high net worth private clients think
about this. If it is assumed that markets are (totally) efficient, then returns on shares cannot
be predicted and outperforming the market is only possible by taking on additional risk. By
indicating their agreement with the statements shown in Figure 10, those surveyed revealed
their attitude to market efficiency. The questions were worded in such a way that agreement
equates to expressing the belief that the market can be beaten, and thus markets are to be
considered inefficient. Conversely, disagreement is seen as stating that the market cannot be
beaten and so is considered efficient.
recordedbyHofstede.Asignificantcongruencyisapparentinthedescriptionoftheinvestment
behaviorofSwissinterviewees,whichclearlyreflectsHofstede’sfindings(lowwillingnessto
assume risk and a high proportion who want to avoid losses). Singapore and Hong Kong lie
further toward the other end of the spectrum, as is to be expected, as far as the two criteria are
concerned. However, a greater inclination toward uncertainty avoidance emerges from the data
for Singapore than for Hong Kong.
0% 10% 20% 30% 40% 50% 60% 70% 80% 90% 100%
Figure 10: Market efficiency (country comparison)
n = interviewed investors
Hong Kong [n 180]
Stock returnscan be predicted.
Singapore [n 180]
disagree – efficient market agree – beatable marketundecided
67% 25% 8%
53% 32% 15%
Switzerland [n 155] 50% 20% 30%
Hong Kong [n 180]
Investment strategiesexist that consistently
beat average marketreturns without taking
above average risk.
Singapore [n 180] 12% 60% 28%
41% 39% 20%
Switzerland [n 155] 64% 23% 13%
Hong Kong [n 180]
Given sufficient timeand resources a bank
could implement aninvesting strategy that
would consistently beatthe market.
Singapore [n 180] 10% 57% 33%
14% 42% 44%
Switzerland [n 155] 57% 27% 16%

25Correlation between return, risk and knowledge
The results clearly show that a majority of interviewees believe in the efficiency hypothesis
of financial markets. 53% of those surveyed in Hong Kong disagree with the statement that
share returns can be predicted. They are thus expressing their belief in an efficient market. In
Singapore the number expressing a belief in an efficient market through this statement is as
high as 67%, and it is 50% in Switzerland.
The picture in relation to the other two statements is not quite so clear-cut. Only 12% in
Singapore disagree with the statement “Investment strategies exist that consistently beat
average market returns without taking above average risk,” whereas 64% disagree in Swit-
zerland. A similar picture emerges for the statement “Given sufficient time and resources a
bank could implement an investing strategy that would consistently beat the market”: while
only 10% disagree in Singapore, 57% disagree in Switzerland.
Thus it appears that Swiss interviewees gave consistent answers through all three state-
ments, whereas the third statement in particular was assessed differently in Hong Kong and
Singapore. While there is thus a belief in the two Asian states in an efficient market (in the
sense of the non-predictability of returns), the banks are thought capable of finding an invest-
ment strategy that, with an appropriate use of resources, can outperform the market.
The replies from Figure 10 were then arranged into groups: if an interviewee agreed with at
least two of the statements given he was assigned to the “Belief in beatable market” group;
if he did not agree with any of the statements, then he was assigned to the “Belief in efficient
market” group (cf. Figure 11).
Consequently, those in particular who represent the belief in a beatable market also try to
actually outperform the market. 29% of those in Switzerland who believe in a beatable market
and 13% of those in Singapore actually try to outperform the market. In Hong Kong, on the
other hand, there is a contradictory group of 19% that does not believe that the market can
be beaten, but nevertheless aims to do so!
Belief in market efficiency as a cultural dimension
This study brings individual understanding of the nature of the equity market into the debate
asaculturaldimensiontobeconsidered.Inrecordingassessmentsofthemarketefficiencyof
the equity market, an absolutely fundamental element of the mental construct “equity market”
emerges.Boththeoreticallyandempirically–supportedbytheresultsshownhere–thepre-
vailing basic assumption about the ability to predict returns on shares plays a decisive role in
subsequent decisions made when creating the asset portfolio. It is striking here that, unlike Swiss
interviewees, those surveyed in Hong Kong and Singapore acknowledge that a bank can out-
perform the market. Whether the greater belief in the abilities of institutions (authorities) that
generally comes from a hierarchically, strictly organized social structure can be cited for Hong
Kong and Singapore or whether it is simply the lack of adeptness of those surveyed that plays a
role here, is still unclear.
Prof. Dr. Teodoro D. Cocca

26 Correlation between return, risk and knowledge
It is furthermore worth noting that, among those who believe in a beatable market, a high
proportion set the aim of achieving absolute growth as the benchmark for returns (in Singa-
pore and Switzerland).
Figure 11: Benchmark for returns for 2012 vs. belief in efficient market
0% 20%
Not to sufferany losses
10%
6%
60%40% 0% 20% 60%40% 0% 20% 60%40%
12%
3%
16%
Believe in efficient market [n 81]Believe in efficient market [n 85]Believe in efficient market [n 72]Believe in beatable market [n 17]Believe in beatable market [n 32]Believe in beatable market [n 34]
Hong Kong Singapore Switzerland
To achieveabsolute growth
in value
19%
12%11%
37%16%
35%
To achieveinflation-adjusted
growth in value
31%
41%23%
16%30%
24%
To achieve theaverage performance
of the market
21%
20%51%
31%28%
12%
To outperformthe market
19%
21%
3%
13%
10%
29%
n = interviewed investors
Risk appetite, level of knowledge and belief in market efficiency – how do all these combine
to affect the Singaporean investors’ behavior?
GiventhatSingaporeanculturetendstopromoteasafeandstableethos,Singaporeansaregen
erallyregardedasaversetorisks.Thisisborneoutbythesurveyresultswhere25%oftheSinga-
porean respondents acknowledged that they are risk-averse (compared to 7% in Hong Kong and
12% in Switzerland). This cultural inclination is compounded by the respondents’ self-estimation
of their level of investment knowledge. Whereas 30% of Hong Kong investors and 16% of the Swiss
investors regard themselves as having very good investment knowledge, only 7% of Singaporean
investorshadsimilarconfidenceintheirinvestmentknowledge.
Thecouplingofagenerallyriskaverseinclinationwithlessthanoptimalconfidenceinone’sin-
vestment knowledge leads one to deduce that Singaporean investors will tend to allocate a signif-
icant portion of their investment portfolio to safe assets with moderate returns. In addition, only
5%ofSingaporeaninvestorsexpectedtheirinvestmentstooutperformthemarketvs.19%ofthe
HongKonginvestorsand15%oftheSwissinvestorsexpectingtheirinvestmentstodolikewise.
Furthermore, 67% of the Singaporean investors disagree that stock prices can be predicted, which
thereforesuggeststhatSingaporeaninvestorsarenotasinclinedtoinvestsignificantlyinthe
less predictable asset class of shares is therefore considered riskier. As such, it is not surprising
that Singaporean investors only invest about 21% of their investment capital in shares versus 40%
forHongKonginvestorsand45%percentforSwissinvestors.
Prof. Annie Koh

27Correlation between return, risk and knowledge
3.6 Expectations in terms of returns
The mean return strived for from investments over the next five years is 5.5% p.a. for interview-
ees in Switzerland, 15.2% p.a. for Hong Kong and 13.3% p.a. for Singapore. The significantly
higher expectation in terms of return in the Asian countries is also apparent in the fact that in
Hong Kong 58% and in Singapore 43% of those surveyed anticipate a return of 10% or more
p.a. for the next five years – in Switzerland only 6% have such high expectations.
In addition to the mean total return expected, investors’ expectations for returns from indi-
vidual asset classes are also of particular significance. As the anticipated risk of each asset
class was also ascertained for each interviewee, both elements can be combined.
The investors surveyed were first asked about the return they expected in the next one to two
years for various asset classes. They were then asked about the general risk from fluctuations
in value for the corresponding asset class. Figures 13 to 15 show the average return/risk graph
produced in this way for various asset classes for the three countries.
ThehigherreturnexpectationinHongKongreflectsthefactthatHongKonginvestorsareconfi-
dent of their investment skills, and that they might over-estimate their ability in stock picking or
choosing the best performing asset class.
Prof. Kalok Chan
0% 10% 20% 30% 40% 50% 60% 70% 80% 90% 100%
Figure 12: Expectation in terms of returns for the next five years (country comparison)
Switzerland [n 137] (C)
Singapore [n 176] (B)
Hong Kong [n 180] (A)
5.544% 28% 22% 6%
4% 17% 36% 43%
6% 34% 58%
A, B, C: mean significantly higher than in country A, B, C (p <0.05) n = interviewed investors
Meanup to 4% return6% to 10% return more than 10% return
5% return
15.2 (C)
13.3 (C)
2%

28 Correlation between return, risk and knowledge
The average assessments made by the investors surveyed in Switzerland show that the
following asset classes are to be categorized as inefficient28 from the point of view of risk/
return: EUR/JPY/USD bonds, blue chips Japan, private equity and hedge funds. The invest-
ment universe should therefore be made up only of CHF bonds, gold, blue chips USA/Europe
and China. It is furthermore worth noting that many equity classes are rated the same as
bond classes in terms of risk. Investments in gold enjoy a unique positioning. Moreover, there
is an obvious focus on the domestic market with a preference for domestic bonds, and for
the European equity markets. In this respect the very similar assessment of European and
USA equity markets is striking. In addition, the attractive classification of CNY bonds should
be noted.
0.0
-0.5
-1.0
0.5
1.0
1.5
2.0
2.5
3.0
2 3 4 5 6 7 8 9 10
Risk assessment (scale 0 to 10)
n = 155 interviewed investors
Ret
urn
assu
mpt
ion
with
in t
he n
ext 1
to 2
yea
rs (s
cale
-5 t
o +
5)
Figure 13: Anticipated return and risk assessment of asset classes (Switzerland)
CNY bonds
CHF bonds
Gold
Blue Chips China
Private equity
Blue Chips Europe
Hedge funds
JPY bonds
EUR bonds
Blue Chips Japan
USD bonds
Blue Chips USA
28 An asset class is described as inefficient if there is another asset class that realizes a higher return for the same risk, or if there is a higher risk for the same return.

29Correlation between return, risk and knowledge
Investors interviewed in Hong Kong differ strikingly in some of their risk/return ratings from
those in Switzerland. The efficient asset classes are CNY/USD and JPY bonds. Differences
in the assessment can be attributed to the “home-bias effect,” by which “local” bonds and
shares are regarded as the most attractive. Alternative investments and private equity fare
slightly better than in Switzerland. Of particular note is the consistently very negative assess-
ment of European investments (shares and bonds), which come out the worst when com-
pared with other asset classes.
0.0
-0.5
-1.0
0.5
1.0
1.5
2.0
2.5
3.0
2 3 4 5 6 7 8 9 10
Risk assessment (scale 0 to 10)
n = 180 interviewed investors
Ret
urn
assu
mpt
ion
with
in t
he n
ext 1
to 2
yea
rs (s
cale
-5 t
o +
5)Figure 14: Anticipated return and risk assessment of asset classes (Hong Kong)
Blue Chips USA Private equity
Hedge funds
CHF bonds
Gold
CNY bonds
USD bonds
Blue Chips JapanJPY bonds EUR bonds
Blue Chips Europe
Blue Chips China
30 Correlation between return, risk and knowledge
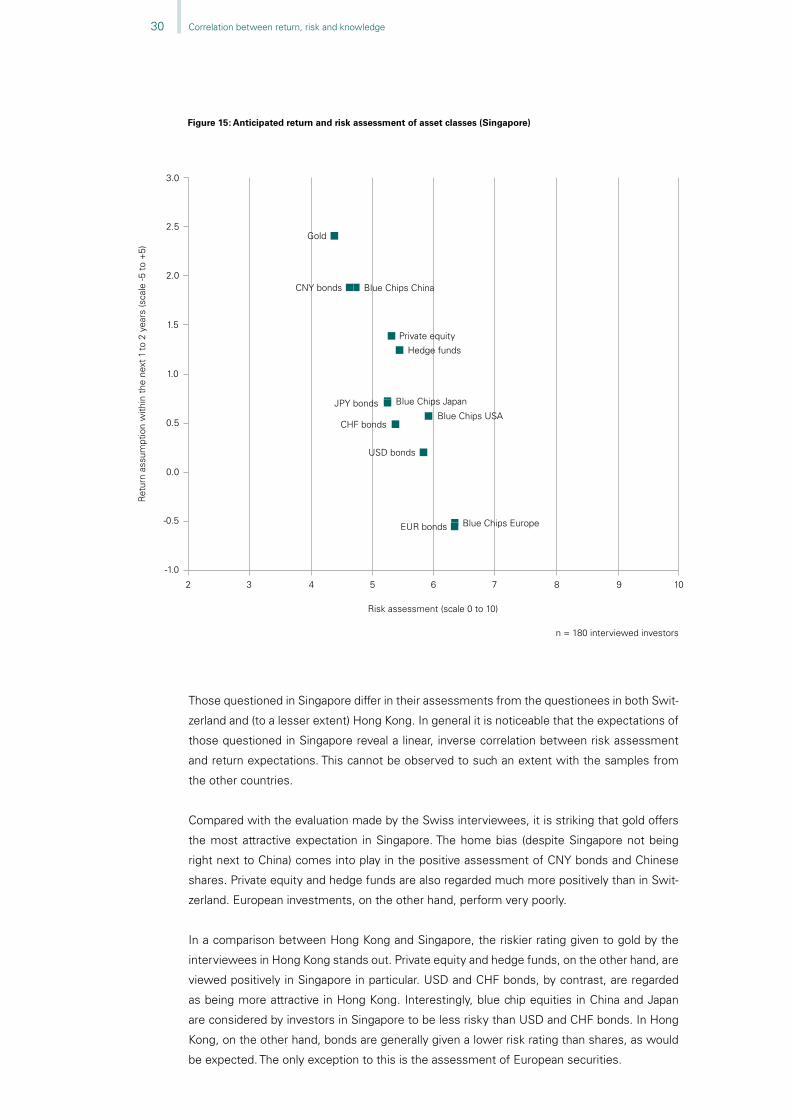
Those questioned in Singapore differ in their assessments from the questionees in both Swit-
zerland and (to a lesser extent) Hong Kong. In general it is noticeable that the expectations of
those questioned in Singapore reveal a linear, inverse correlation between risk assessment
and return expectations. This cannot be observed to such an extent with the samples from
the other countries.
Compared with the evaluation made by the Swiss interviewees, it is striking that gold offers
the most attractive expectation in Singapore. The home bias (despite Singapore not being
right next to China) comes into play in the positive assessment of CNY bonds and Chinese
shares. Private equity and hedge funds are also regarded much more positively than in Swit-
zerland. European investments, on the other hand, perform very poorly.
In a comparison between Hong Kong and Singapore, the riskier rating given to gold by the
interviewees in Hong Kong stands out. Private equity and hedge funds, on the other hand, are
viewed positively in Singapore in particular. USD and CHF bonds, by contrast, are regarded
as being more attractive in Hong Kong. Interestingly, blue chip equities in China and Japan
are considered by investors in Singapore to be less risky than USD and CHF bonds. In Hong
Kong, on the other hand, bonds are generally given a lower risk rating than shares, as would
be expected. The only exception to this is the assessment of European securities.
0.0
-0.5
-1.0
0.5
1.0
1.5
2.0
2.5
3.0
2 3 4 5 6 7 8 9 10
Risk assessment (scale 0 to 10)
n = 180 interviewed investors
Ret
urn
assu
mpt
ion
with
in t
he n
ext 1
to 2
yea
rs (s
cale
-5 t
o +
5)
Figure 15: Anticipated return and risk assessment of asset classes (Singapore)
Blue Chips China
Blue Chips USA
CNY bonds
Blue Chips Japan
Private equity
Hedge funds
JPY bonds
USD bonds
CHF bonds
Gold
EUR bonds Blue Chips Europe

31Correlation between return, risk and knowledge
29 Cf. Grinblatt and Keloharju (2001) 30 Cf. Anderson et al. (2011)
Explaining Singaporean investors’ behavior by looking at risk-return expectations across
different asset classes
For an overall perspective, Singaporean investors have indicated in H1 2012 that they expect
averagereturnsof13.3%forthenextfiveyearsandthattheyexpectgold,bluechipPRCshares
andtopratedRMBbondstodeliverthemostpositivereturnsoverthenextonetotwoyears.This
captures what is termed a home bias in terms of what investors feel most familiar with when it
comestotheirriskperceptionsofassetclasses.GivenSingapore’sproximitytoChinaandthe
expected growth opportunities in Asia over the next decade, it was not surprising to have Singa-
porean investors rating the above three asset classes as being the least risky, compared with blue
chipEURsharesandtopratedEURbondsthatareseenasthemostriskyassetclasses.
Willingness to assume risk, home bias and gold
The results of this study support the view that artifacts of the willingness to assume risk (mea-
sured on the basis of “readiness to assume risk” or “avoidance of loss”) when allocating invested
fundsisahighlysignificantfactorforallthreecountriesconsidered(seesection2.2.2).Never
theless,cleardifferencesemergefirstinthegeneralwillingnesstoacceptrisksatall(seesection
3.1), and second in the perception of the risks of individual investment instruments (see section
3.6). In relation to the latter, the home bias29 plays a central role, which has been substantiated in
many studies including with regard to countries outside of Asia.30 However, the home bias can-
not be cited as an explanatory model for investments in gold. Whereas gold is considered to be
the investment with the lowest risk in Singapore, those surveyed in Hong Kong judge gold to be
asriskyasUSbluechipequities.Thusthereisanastonishinglywidevariationintheassessment
of commodities/gold or precious metals: from less risky than bonds to more volatile than shares.
Prof. Annie Koh
Prof. Dr. Teodoro D. Cocca

32
4 Investment decisions and advice
Key results
Independent investment decisions in Hong Kong: The proportion of investors who make their
owninvestmentdecisions(withoutaconsultant)ishighestinHongKongat55%(Singapore
33%, Switzerland 39%).
Low level of client loyalty towards the relationship manager in Singapore: 60% of those sur-
veyed in Singapore would “certainly not” follow their relationship manager if the latter moved
bank (Hong Kong 37%, Switzerland 33%).
Achieving a better return is the most important need in Asia: Achieving a better return on in-
vestments thanks to advice from the bank is considered the principal need of private banking
clients in both Hong Kong and Singapore.
NeedtoachieveabetterreturnisfulfilledbetterinAsia:InHongKongandSingaporethose
surveyedgivehigherratingstothefulfillmentoftheneedforabetterreturnthanthosein
Switzerland.
Technology-minded Hong Kong investors: Although the differences between the countries are
not huge, those surveyed in Hong Kong prove to be more technology-minded than the other
participants in the survey.
4.1 Investment decisions
In Switzerland 39% of private banking clients surveyed generally make their own investment
decisions (soloists) (cf. Figure 16)31. 57% make investment decisions with others or an invest-
ment consultant (validators) and a very small proportion of 4% leaves investment decisions
completely to the investment consultant (delegators).
0% 10% 20% 30% 40% 50% 60% 70% 80% 90% 100%
Figure 16: Investment decisions
Switzerland [n 155]
Singapore [n 180]
Hong Kong [n 180]
39% 30% 27% 4%
33% 49% 18%
55% 21% 24%
n = interviewed investorsSoloists Validators (personal environment)Validators (investment consultant) Delegators
31 cf. Koye, 2004, p. 142f.
33Investment decisions and advice
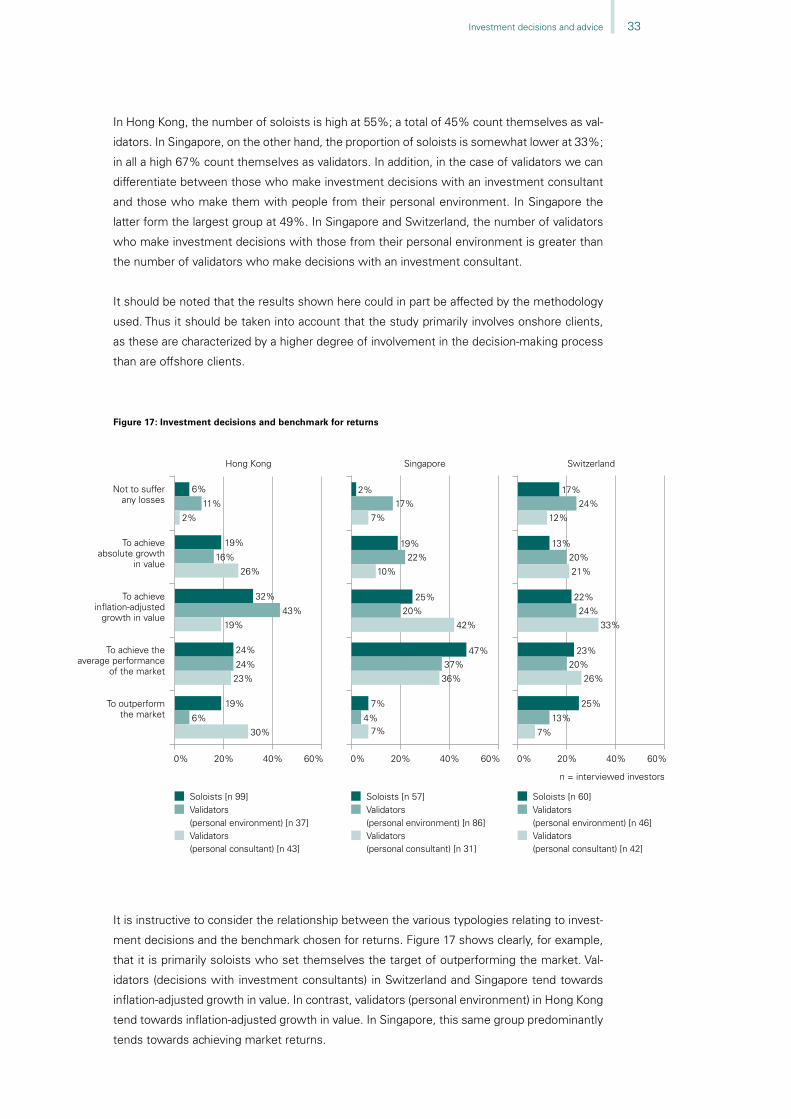
In Hong Kong, the number of soloists is high at 55%; a total of 45% count themselves as val-
idators. In Singapore, on the other hand, the proportion of soloists is somewhat lower at 33%;
in all a high 67% count themselves as validators. In addition, in the case of validators we can
differentiate between those who make investment decisions with an investment consultant
and those who make them with people from their personal environment. In Singapore the
latter form the largest group at 49%. In Singapore and Switzerland, the number of validators
who make investment decisions with those from their personal environment is greater than
the number of validators who make decisions with an investment consultant.
It should be noted that the results shown here could in part be affected by the methodology
used. Thus it should be taken into account that the study primarily involves onshore clients,
as these are characterized by a higher degree of involvement in the decision-making process
than are offshore clients.
It is instructive to consider the relationship between the various typologies relating to invest-
ment decisions and the benchmark chosen for returns. Figure 17 shows clearly, for example,
that it is primarily soloists who set themselves the target of outperforming the market. Val-
idators (decisions with investment consultants) in Switzerland and Singapore tend towards
inflation-adjusted growth in value. In contrast, validators (personal environment) in Hong Kong
tend towards inflation-adjusted growth in value. In Singapore, this same group predominantly
tends towards achieving market returns.
Figure 17: Investment decisions and benchmark for returns
0% 20%
Not to sufferany losses
6%
11%
60%40% 0% 20% 60%40% 0% 20% 60%40%
2%17%
2% 7%
24%
12%
17%
Soloists [n 60]Soloists [n 57]Soloists [n 99]ValidatorsValidatorsValidators(personal environment) [n 46](personal environment) [n 86](personal environment) [n 37]ValidatorsValidatorsValidators(personal consultant) [n 42](personal consultant) [n 31](personal consultant) [n 43]
Hong Kong Singapore Switzerland
To achieveabsolute growth
in value
19%
16%19%
22%13%
20%
26% 10% 21%
To achieveinflation-adjusted
growth in value
32%
43%25%
20%22%24%
19% 42% 33%
To achieve theaverage performance
of the market
24%
24%47%
37%23%
20%
23% 36% 26%
To outperformthe market
19%
6%
7%
4%
25%
13%
30% 7% 7%
n = interviewed investors

34 Investment decisions and advice
The loyalty of a client towards his relationship manager can be established by asking whether
the client would follow his relationship manager if the latter were to move to another bank. Fig-
ure 18 illustrates that in Switzerland only some 5% of clients state that they would definitely
follow their relationship manager and 17% would probably follow them. The numbers are very
similar for Hong Kong: 2% would certainly follow their relationship manager and 22% proba-
bly would. However, a completely different picture emerges in Singapore, where loyalty to the
relationship manager is considerably lower: only 1% would certainly follow their relationship
manager and 5% would probably go with him. 60% of those surveyed in Singapore were
quite forthright in saying that they would “certainly not” follow their relationship manager.
4.2 Relevance and fulfillment of advisory needs
The question as to the needs relevant to a private banking client and how these requirements
are weighted in respect of their importance is a subject that has been much debated for the
purposes of banking practice as well as among researchers. In addition, the extent to which
these needs are met is an important indication of the client’s perspective of the services
provided by the bank. These questions are examined in Figures 19 to 21, where the inter-
viewees were asked to allocate 100 points to various requirement categories as a way of
indicating their personal preferences (the higher the number of points allocated, the greater
the relevance of the corresponding aspect). On the right of the chart, the level of fulfillment of
the respective criterion is contrasted with its relevance from the interviewees’ point of view.
0% 10% 20% 30% 40% 50% 60% 70% 80% 90% 100%
Figure 18: Move because of the relationship manager
Switzerland [n 155]
Singapore [n 180]
Hong Kong [n 180]
5% 17% 45% 33%
34% 60%
22% 40% 36%
n = interviewed investorsyes, certainlyyes, probably no, certainly not
no, probably not
2%
1% 5%
Client loyalty
ClientsinHongKongandSingaporeseemtohavesignificantlylessofabondwiththeirrelation
ship managers than in Switzerland. This indicates that a private banking culture does not yet
exist along the same lines as in Switzerland, where a close bond with the relationship manager
is achieved through long-term relationships. The question as to whether this type of private
banking will be established or accepted in the Asian countries is still uncertain. From the point of
view of business policy, the outcome is very relevant, because it calls into question the frequently
pursued strategy of European banks aimed at enticing senior private bankers away from the
competition at a high price. If there is a low level of client loyalty, success will not be achieved
using this strategy.
Prof. Dr. Teodoro D. Cocca

35Investment decisions and advice
From the point of view of a Swiss private banking client, the primary need when using the
services of a private banking provider is to obtain transparent and understandable advice,
and to achieve a better return on investment thanks to that advice. Transparent advice was
considered of the greatest relevance with an average of 20.5 points. It appears that the main
criterion – the expectation of transparent advice – is fulfilled well (fulfillment ranking of 7.0).32
Less satisfactory is the fulfillment of the second-most important need, namely the achieve-
ment of a better return on investment. With a fulfillment ranking of 4.6, this need is the least
met of any.
For those surveyed in Hong Kong, achieving a better return on investment is the most im-
portant need. Compared with Switzerland, this achieves a higher level of fulfillment. Under-
standing information better is the second-most important aspect, while getting transparent,
understandable advice is the third most important. The level of fulfillment of these two needs
is consistently satisfactory.
7 vs. 6Discussing matters which have nothing
to do with the investment process5.0
6 vs. 3Understanding information better
thanks to the explanations6.0
5 vs. 5With the personal advice received,
arriving at overall solutions5.1
4 vs. 4Obtaining independent advice 5.9
3 vs. 1Obtaining advice
where discretion is guaranteed8.2
17.6
15.3
13.9
13.3
11.5
8.0
2 vs. 7Achieving a better return
on investment thanks to advice
1 vs. 2Obtaining transparent
and understandable advice
Ranking: relevance vs. fulfillment
4.6
20.5 7.0
0 1030 20 10
Figure 19: Advisory needs: relevance ranking and fulfillment (Switzerland)
Relevance (sum = 100) Fulfillment (scale 0 to 10) n = 155 interviewed investors
32 Fulfillment is measured on a scale of 0 to 10, with 0 for poor fulfillment and 10 for very good fulfillment.
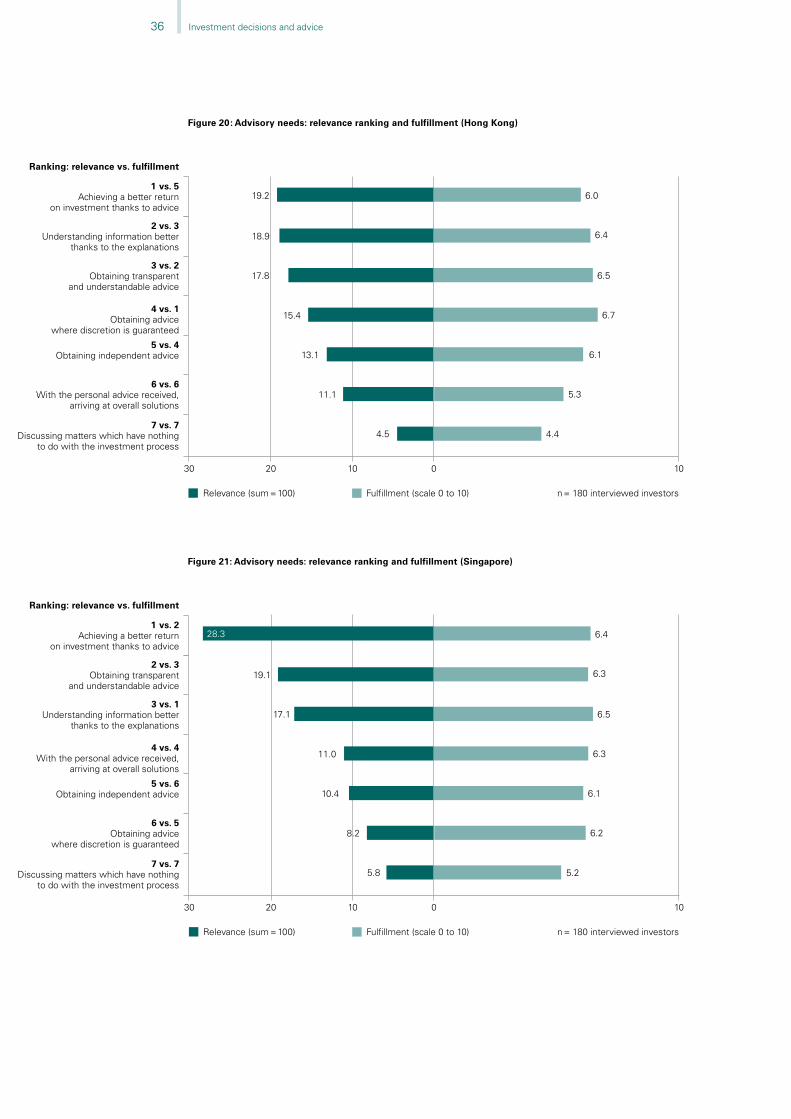
36 Investment decisions and advice
7 vs. 7Discussing matters which have nothing
to do with the investment process4.4
6 vs. 6With the personal advice received,
arriving at overall solutions5.3
5 vs. 4Obtaining independent advice 6.1
4 vs. 1Obtaining advice
where discretion is guaranteed
6.7
3 vs. 2Obtaining transparent
and understandable advice6.5
18.9
17.8
15.4
13.1
11.1
4.5
2 vs. 3Understanding information better
thanks to the explanations
1 vs. 5Achieving a better return
on investment thanks to advice
Ranking: relevance vs. fulfillment
6.4
19.2 6.0
0 1030 20 10
Figure 20: Advisory needs: relevance ranking and fulfillment (Hong Kong)
Relevance (sum = 100) Fulfillment (scale 0 to 10) n = 180 interviewed investors
7 vs. 7Discussing matters which have nothing
to do with the investment process5.2
6 vs. 5Obtaining advice
where discretion is guaranteed6.2
5 vs. 6Obtaining independent advice 6.1
4 vs. 4With the personal advice received,
arriving at overall solutions
6.3
3 vs. 1Understanding information better
thanks to the explanations6.5
19.1
17.1
11.0
10.4
8.2
5.8
2 vs. 3Obtaining transparent
and understandable advice
1 vs. 2Achieving a better return
on investment thanks to advice
Ranking: relevance vs. fulfillment
6.3
6.4
0 1030 20 10
Figure 21: Advisory needs: relevance ranking and fulfillment (Singapore)
Relevance (sum = 100) Fulfillment (scale 0 to 10) n = 180 interviewed investors
28.3
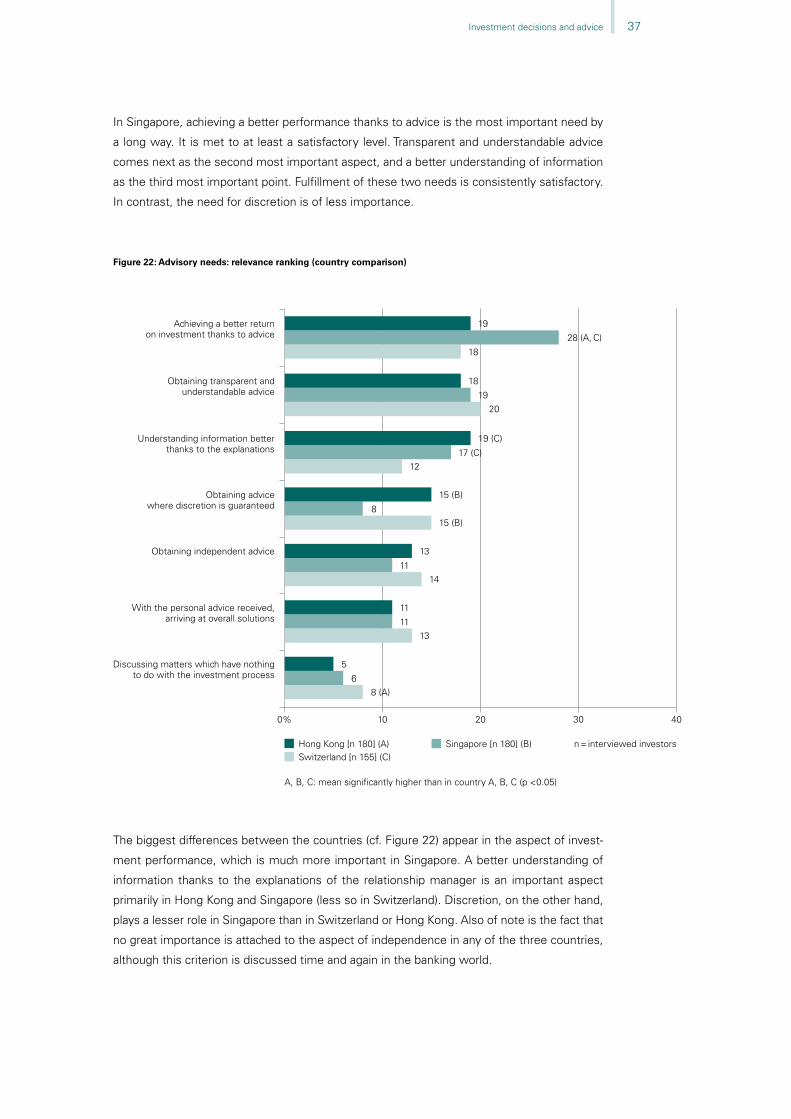
37Investment decisions and advice
In Singapore, achieving a better performance thanks to advice is the most important need by
a long way. It is met to at least a satisfactory level. Transparent and understandable advice
comes next as the second most important aspect, and a better understanding of information
as the third most important point. Fulfillment of these two needs is consistently satisfactory.
In contrast, the need for discretion is of less importance.
The biggest differences between the countries (cf. Figure 22) appear in the aspect of invest-
ment performance, which is much more important in Singapore. A better understanding of
information thanks to the explanations of the relationship manager is an important aspect
primarily in Hong Kong and Singapore (less so in Switzerland). Discretion, on the other hand,
plays a lesser role in Singapore than in Switzerland or Hong Kong. Also of note is the fact that
no great importance is attached to the aspect of independence in any of the three countries,
although this criterion is discussed time and again in the banking world.
0% 10
Achieving a better returnon investment thanks to advice
Obtaining transparent andunderstandable advice
Understanding information betterthanks to the explanations
Obtaining advicewhere discretion is guaranteed
Obtaining independent advice
19
28 (A, C)
18
18
1920
19 (C)
17 (C)12
15 (B)
815 (B)
13
1114
With the personal advice received,arriving at overall solutions
11
1113
Discussing matters which have nothingto do with the investment process
5
68 (A)
20 30 40
Figure 22: Advisory needs: relevance ranking (country comparison)
n = interviewed investors
A, B, C: mean significantly higher than in country A, B, C (p <0.05)
Hong Kong [n 180] (A)Switzerland [n 155] (C)
Singapore [n 180] (B)

38 Investment decisions and advice
Performance
The challenges Asian clients pose for Swiss and Liechtenstein private banking are apparent
from the great importance private banking clients from Hong Kong and Singapore attach to
investment performance. In addition, the expectations regarding target returns are, on average,
considerably above a 10% return per year and are therefore very ambitious, at least from a Euro-
pean point of view. This shows unequivocally that the investment product range must be tailored
to these local requirements and that very different investment products are required to meet
the expectations of Asian clients. There seems to be a paradox in the fact that the lower target
returnsinSwitzerlandareaccompaniedbyaverylowdegreeoffulfillmentoftherequirementfor
abetterreturn,whereasthehightargetreturnsinAsiaareratedasbeingfulfilledtoasatisfac-
tory extent. The various macroeconomic conditions of the European and Asian markets must
be considered as an explanatory model for this. They differ considerably with regard to interest
level,inflationandhistoricgrowthratesforthepastfewyears,sohistoricalexperiencehasledto
higher expectations on the one hand and higher realized returns on the other.
Managing Singaporean private banking clients – opportunities and challenges
Everyone speaks about the Asian opportunity in wealth management, especially in the growth
markets of Hong Kong and Singapore. That said, wealth management in Asia also presents
private banks with considerable challenges. For one, it is often said that private banking is a
marathon and not a sprint which means that private banks should set priorities and value client
relationships beyond the short term. However, this often-accepted truism seems to be at odds
with internal performance pressure within private banks and with external client expectations
in Asia, including Singapore.
Thesurveyresults,forexample,confirmedthatthemostsignificantobjectiveofSingaporeinves-
torsinengagingaprivatebankistoachieveabetterrateofreturnoninvestment–28%scoring
amongstSingaporeaninvestors–andprivatebanks’performancewasperceivedtobeonlyata
satisfactorylevelforthisobjective.Withthisparadigm,managingwealthprofitablyhasbecome
an increasingly complex activity for both private banks and their private clients alike. These
(oftenshortterm)investmentpressureswereexacerbatedbythe2008financialcrisiswhen
Asia’s wealthy lost their trust in their private banks, arising from unhappiness with less-than-
satisfactory investment products and returns relative to the high-growth performance of Asia’s
economies.
ItwouldappearthatAsia’sprivateclientscomewithunrealisticexpectationsaswell–67%of
Singaporeaninvestorsbelievethatmarketsareefficientandyetonly12%disagreewhenasked
if investment strategies exist that can consistently beat average market returns without taking
above-average risk! We are still some way from regarding private bankers as long-term trusted
advisors who could provide their private clients with independent, transparent and discreet
advice on an entire range of issues, and not merely investment advice.
The challenge is to personalize the impersonal nature of private banking in Asia. The survey re-
sults indicated that 60% of the private banking respondents would not follow their private banker
to his/her new bank which means that it would be challenging to invoke client loyalty among
Prof. Dr. Teodoro D. Cocca
Prof. Annie Koh

39Investment decisions and advice
4.3 Use of technology in the advisory process
“New technologies and devices – e.g. the iPad – enable computer programs to be used even
in advisory meetings. In your opinion how useful are the following applications in advisory
meetings with relationship managers?” The attitudes to this issue are presented in Figure
23. Three possibilities for the use of technology in the advisory process were addressed. The
use of computer programs for recording a client’s needs in detail is only considered to be
useful by a small majority of 51% in Hong Kong; in Singapore and Switzerland this proportion
only amounts to 39%. The use of computer programs to simulate the effects of investment
decisions on a portfolio is considered useful by 40% of those surveyed in all three countries.
The use of computer programs for presenting products again found the highest level of agree-
ment in Hong Kong, at 57%. In Switzerland and Singapore only 46% and 38% respectively
regarded such applications as useful. Although the differences between the countries were
not huge, those surveyed in Hong Kong proved to be more technology-minded than the other
participants in the survey.
0% 10% 20% 30% 40% 50% 60% 70%
Figure 23: Use of technology in the advisory process
n = interviewed investors
Hong Kong [n 180] (A) The use of computer programsfor recording my needs in detail(investment objectives, attitude toaccepting risk etc.)
Singapore [n 180] (B)
useful very useful
31% 8% 39%
43% 8% 51%
Switzerland [n 155] (C) 24% 15% 39%
Hong Kong [n 180] (A) The use of computer programsto simulate the effects of investmentdecisions on my portfolioSingapore [n 180] (B) 34% 6% 40%
32% 8% 40%
Switzerland [n 155] (C) 24% 16% 40%
Hong Kong [n 180] (A) The use of computer programsfor presenting products
Singapore [n 180] (B) 32% 6% 38%
46% 11% 57% (B)
Switzerland [n 155] (C) 27% 19% 46%
A, B, C: mean significantly higher than in country A, B, C (p <0.05)
Singaporean investors. Truly, the private banking landscape is still evolving in Asia and culture,
family and business drivers in diverse countries in Asia will be key variables shaping private in-
vestment behavior going forward. Deep knowledge about these variables will enhance the overall
value proposition that private banks can offer to private clients in Asia.

40
5 Conclusion
Despite all the trends toward globalization, the present study shows that, when it comes to
money matters, the principle that investors are all the same does not apply. On the contrary,
it is clear that deep-seated cultural characteristics play a decisive role in financial matters,
leading to a variety of attitudes and behavior. This reflects on the design and strategy of a
private banking offering in Asian markets. It should also be noted here that the often used
term “Asian market” is insufficient and does not cover the variety of attitudes and behavior
in the different Asian countries. The data obtained reveals many differences between the
two financial centers of Hong Kong and Singapore and Switzerland. However, it also reveals
differences between Hong Kong and Singapore, which are no less diverse. Many common
features are also apparent between the financial centers. Due to the deep-rootedness of the
cultural features, a fundamental change in investment behavior cannot be expected in the
short term. As Becker (1996, p. 16) writes: “Individuals have less control over their culture
than over other social capital. They cannot alter their ethnicity, race or family history, and only
with difficulty can they change their country or religion. Because of the difficulty of changing
culture and its low depreciation rate, culture is largely a ‘given’ to individuals throughout their
lifetimes.” The study does at least reinforce the fact that a detailed understanding of the
perceptions, attitudes and characteristics of the clients of a region is essential for successful
market cultivation. An impartial perspective can help here to avoid being deceived by ready-
made clichés.

41
Authors
Prof. Dr. Teodoro D. Cocca
Teodoro D. Cocca is Professor for Asset Management at the Johannes Kepler University Linz.
Previously he worked for several years at Citibank in investment and private banking, was a
research fellow at the Stern School of Business in New York and taught at the Swiss Banking
Institute in Zurich.
A Swiss citizen with Italian roots, Teodoro Cocca is also Adjunct Professor at the prestigious
Swiss Finance Institute in Zurich and a lecturer in banking and finance at the University of
Zurich. He also advises financial companies in Switzerland and abroad on strategic issues, and
investment funds on their investment strategies.
In 2010, Teodoro Cocca was elected as a banking expert to the Board of Directors of Zurich-
based Geneva Group International, one of the largest alliances of independent audit, legal and
trust firms in the world. Since April 2011, he has been a member of the Board of Directors of
Verwaltungs- und Privat-Bank in Vaduz. In October 2011 he was appointed Dean of the Faculty
of Social Sciences, Economics and Business at the Johannes Kepler University Linz.
Prof. Annie Koh (PhD, New York University)
Annie Koh is Vice President for Business Development and External Relations at the Singa-
pore Management University (SMU). An Associate Professor of Finance, Annie also holds the
positions of Academic Director for the Financial Training Institute (FTI), the Center for Profes-
sional Studies (CPS), the International Trading Center (ITC) and the Business Families Institute
(BFI) at SMU. Her previous portfolio includes positions as Associate Dean, Lee Kong Chian
School of Business and Dean, Office of Executive and Professional Education. She received
her PhD in International Finance from New York University (Stern School of Business) where
she was a Fulbright scholar.
Annie is a frequently sought-after conference speaker at the World Economic Forum, panel
moderator and expert commentator. She also sits on several advisory boards, governing
councils and steering committees in SMU as well as in the financial services and government
sectors. She chairs the Asian Bond Fund 2 Supervisory Committee of the Monetary Authority
of Singapore. Currently, she is on the Advisory Boards of a number of family businesses and
on the investment committee of i-Globe (a private equity firm) as well as a member of the
Research and Publications Committee of the Singapore Chinese Chamber of Commerce and
Industry. She was also recently appointed to the Board of Directors of k1 Ventures Limited
which is listed on the Singapore Stock Exchange and which is an investment holding company
of the Keppel Group. Annie is a recipient of the Public Administration Medal (Bronze), a pres-
tigious National Day Award for 2010.

42 Authors
Annie’s research interests are in Family Office and Family Business Research, Investor Be-
havior, Alternative Investments, and Enterprise Risk Management. Her paper, “An Analysis of
Extreme Price Shocks and Illiquidity Among Systematic Trend Followers” (2010), co-written
with Bernard Lee and Cheng Shih-Fen was published in the “Review of Futures Markets” and
the “Social Science Research Network”. Other academic articles of hers have been published
in “The Review of Future Markets, SIMEX Papers” and “Pulses”. Annie is also author of Inter-
national Enterprise Singapore’s book “Financing Internationalization – Growth Strategies for
Successful Companies” (2004), which has been translated into Chinese.
Prof. Kalok Chan (PhD, Ohio State University)
Kalok Chan is Synergis-Geoffrey YEH Chair Professor of Finance and Head of Finance Depart-
ment at the Hong Kong University of Science and Technology, where he holds a concurrent
position as the Associate Dean of HKUST Business School. He is also the Director of the
Value Partners Centre for Investing at HKUST and was the founding director of the HKUST-
NYU Joint Master in Global Finance program.
Professor Chan actively participates in the profession. He has been serving as the Chairman
of the HKIB Organizing Committee for Outstanding Financial Management Planner Awards in
the last few years, and is currently a member of Hang Seng Index Service Limited, Hospital
Authority Investment Committee, and the FTSE Asia Regional Committee. He was the Presi-
dent of the Asian Finance Association from 2008 to 2010, and has served as a member of the
Advisory Committee on Human Resource Development (Financial Services), the Risk Man-
agement Committee of Hong Kong Exchanges and Clearing Limited, the Committee on Unit
Trusts and the Committee on Investment-Linked Assurance and Pooled Retirement Funds of
Hong Kong SFC. He served as a panel member of the Hong Kong Research Grants Council
from 2004 to 2009.
Professor Chan obtained his BSc in Economics from the Chinese University of Hong Kong,
his Ph.D. in Finance from Ohio State University, and taught at Arizona State University from
1990 to 1997 before joining the HKUST. He is also a CFA charterholder.

43
Annex
0% 10% 20% 30% 40% 50% 60% 70% 80% 90% 100%
Figure A1: Age (country comparison)
Switzerland [n 155] (C)
Singapore [n 180] (B)
Hong Kong [n 180] (A)
25% 21% 35% 19%
47% 35% 16% 2%
51% 34% 13% 2%
n = interviewed investors
up to 49 years 50 to 59 years60 to 69 years 70 years and older
59.5 (A, B)
50.4
49.7
Mean age
A, B, C: mean significantly higher than in country A, B, C (p <0.05)
0% 10% 20% 30% 40% 50% 60% 70% 80% 90% 100%
Figure A2: Gender (country comparison)
Switzerland [n 155]
Singapore [n 180]
Hong Kong [n 180]
75% 25%
55% 45%
57% 43%
n = interviewed investorsmale female
0% 10% 20% 30% 40% 50% 60% 70% 80% 90% 100%
Figure A3: Available assets excluding real estate (country comparison)
Singapore [n 180]
Hong Kong [n 180]
8% 50% 34% 8%
8% 53% 23% 16%
up to USD 1 million USD 1 to 2.5 millionUSD 2.5 to 5 million USD 5 million and more
0% 10% 20% 30% 40% 50% 60% 70% 80% 90% 100%
Switzerland [n 155] 48% 45% 7%
n = interviewed investorsup to CHF 1.5 million CHF 1.5 to 6 millionCHF 6 million and more

Imprint
ImprintPublisherLGT Group Foundation, Vaduz, www.lgt.com
AuthorProf. Dr. Teodoro D. Cocca, Department of Asset Management, Johannes Kepler University Linzwww.ibfw.jku.at
ContributorsProf. Annie Koh, Singapore Management University,Prof. Kalok Chan, Hong Kong University of Science & Technology Methodological advice, data analysis and field managementJörg Schneider, js_studien+analysen, Zurich, [email protected]
LayoutLGT Marketing & Communications, Vaduz Printing3Drums Limited, Hong Kong © LGT Group and Prof. Dr. Teodoro D. Cocca
44

