liability modeling ii - life insurance products...liability modeling h -- life insurance products...
TRANSCRIPT

1996 VALUATION ACTUARY SYMPOSIUM PROCEEDINGS
SESSION 16
Liability Modeling II -- Life Insurance Products
Meredith A. Ratajczak, Moderator
Gregory M. Mateja
Michael J. Murphy


LIABILITY MODELING H -- LIFE INSURANCE PRODUCTS
MS. MEREDITH A. RATAJCZAK: This teaching session will look at life insurance model
building through the eyes of both consultants and company actuaries. Mike Murphy will discuss
the key aspects of identifying and gathering the data required to construct models. Mike is a
managing director in the SS&C Consulting Group. He is responsible for the direction and
management of complex financial consulting engagements. He helps clients understand the
conditional value of the firm. He's also responsible for recruiting, development of staff, and
support of the professional staff.
Greg Mateja will discuss the model building process and will talk about objectives and
considerations. Greg is assistant vice president and director of Individual Life and Annuity
Actuarial at ITT Hartford Life. His current responsibilities include cash-flow testing, review of
investment strategies, strategic planning acquisition analysis, expense management, product
review and evaluation. The title of illustration actuary has recently been added to that list.
I'm going to look at the modeling process from the standpoint of policyholder and company
behaviors. I'll spend the last part of my presentation walking you through a case study that
focuses on a participating whole life product and what happens to cash-flow testing results when
we make some modifications to the dividend mechanics. I'm a consulting actuary with Milliman
& Robertson. I will be moving to the Hartford office, and when I get there, I will continue to
help my clients with cash-flow testing, appraisals, product development, and illustration actuary
assignments.
While our session title is very generic, we will also touch upon assumption development
considerations for specific life insurance product categories, like term, nonparticipating whole life,
participating whole life, universal life, interest-sensitive business and variable life.
277

1996 VALUATION ACTUARY SYMPOSIUM
MR. MICHAEL J. MURPHY: As Meredith pointed out, there are many similarities in building
a life versus annuity model. The difference is primarily in the details. I will focus more on an
overview of model structure and model purpose; what it takes in the process of modeling as opposed
to digging into the details of plan definitions. To me that's more mechanics than it is building a good
model.
I want to focus on a couple of items: model purpose, model structure, data collection and behavioral
models. It's not too late to define a model purpose now. I would imagine most of you all have
models in place for the primary reason of cash-flow testing, and that's a good purpose. However, I
don't find that these models are being used for more strategic purposes. Certainly in some companies
they are, but in many, they're not. What I mean by more strategic purposes is they should be
integrated into the business planning process to optimize credit and investment strategies. Look at
duration and convexity analysis interest rate risk, and value-added analysis on your business. These
models should reflect your true business. Cash-flow testing is fine, but it's very specific and has a
narrow purpose. That's all I'll talk about on purpose because Greg will get into more detailed models
and model use and purpose.
What I want to focus on is really the model structure, and what it takes to get a good model in place
(Chart 1). In my experience, the first step should be assigning a model steward. A model steward
is someone who is accountable for the model; someone who ensures that things are going to get done
and communicates with the various department heads and the actuaries to make sure that they're
developing models that are consistent and can be pulled into the full corporate model. This includes
capturing information from your CFO and CIO -- asset information, liability information, information
from data processing people, and getting downloads of your extract files on a timely basis, at perhaps
the end of every quarter.
Again what we want to focus on is a process. We need to get this documented, and put a procedure
manual together, something that everybody understands so all expectations are known.
278
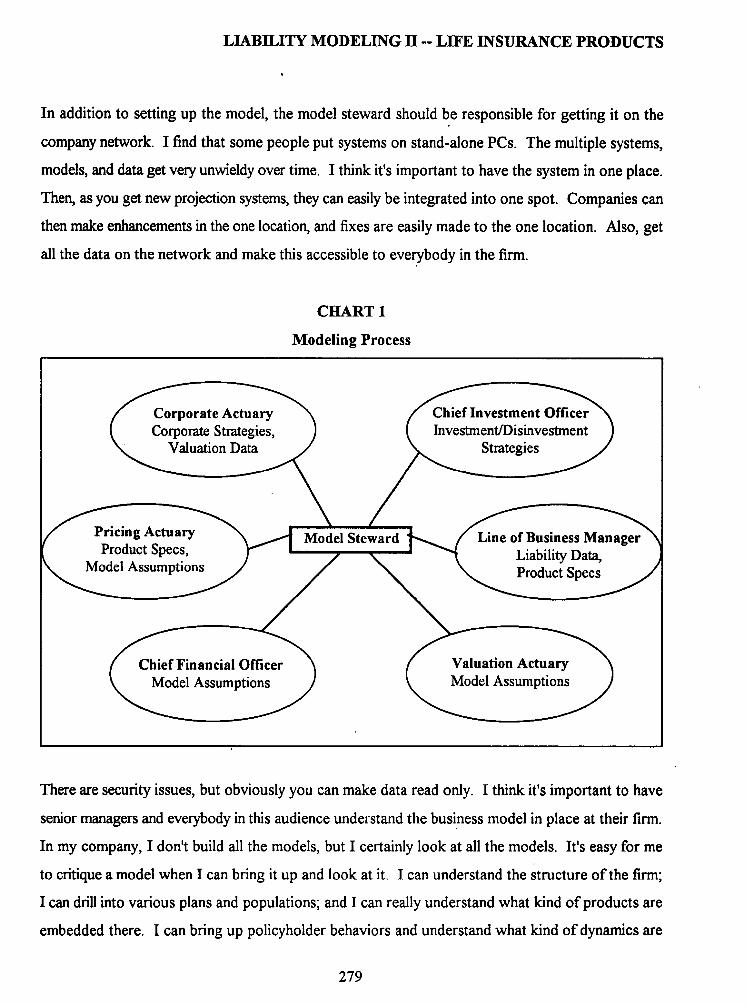
In addition to setting up the model, the model steward should be responsible for getting it on the
company network. I find that some people put systems on stand-alone PCs. The multiple systems,
models, and data get very unwieldy over time. I think it's important to have the system in one place.
Then, as you get new projection systems, they can easily be integrated into one spot. Companies can
then make enhancements in the one location, and fixes are easily made to the one location. Also, get
all the data on the network and make this accessible to everybody in the firm.
CHART 1
Modeling Process
el Ste
LIABILITY MODELING H -- LIFE INSURANCE PRODUCTS
There are security issues, but obviously you can make data read only. I think it's important to have
senior managers and everybody in this audience understand the business model in place at their firm.
In my company, I don't build all the models, but I certainly look at all the models. It's easy for me
to critique a model when I can bring it up and look at it. I can understand the structure of the firm;
I can drill into various plans and populations; and I can really understand what kind of products are
embedded there. I can bring up policyholder behaviors and understand what kind of dynamics are
279

1996 VALUATION ACTUARY SYMPOSIUM
there. I like having access to the models, and I think as we move more toward real time issues, as
PCs become faster, and as we move to databases and away from detailed files, senior managers are
going to be playing more with the model and doing "what-if' analyses. So I think it's important to
get the system in a specific spot and provide access to everybody. We're all becoming computer
literate and the systems are becoming much more user friendly.
I think another key to building models is in the model hierarchy (Table 1). Focus in on a top-down
structure, rather than the more conventional bottom-up structure, where different line departments
would start with the cells and they would start building away at a universal life (UL)1 product and
UL2 product, tediously coding mortality rates and lapse rates. After developing these detailed
building block levels, you start gluing them together. Lo and behold, after a year, you have a model.
I think it's much more important to focus on the top-down structure. You start getting results right
away, and it's certainly more intuitive for the senior managers that are looking at the results of the
model.
Corporate
UL
SPDA
TABLE 1
Model Hierarchy
Company Model
SPDA - Agency
SPDA -- Bank
SPDA-- 1
M45N
M65N
Corporate Segment
Segment
Segment
Population
Population
Plan
Cell
Cell
With a top-down form, one can look at a company structure and understand where the profit centers
are. The corporate segment acts as a banker, managing the capital transfers between the various
business segments, maintaining risk-based capital (RBC), looking at the interest maintenance reserve
280

LIABILITY MODELING H -- LIFE INSURANCE PRODUCTS
(IMR), and the asset valuation reserve (AVR) calculations, the risk-based capital and managing all
the tax impact. Again it's very intuitive and I can start layering on segments below that and start
getting immediate results. I don't have to wait a year to start getting results. I don't have to walt a
year to see if this is going to be a good fit or a bad fit.
Focus on fairly small models at first. Build your segments to reflect your current internal reporting.
This serves a couple of purposes. One, it serves as an independent audit source when you're getting
ledger accounts and some of the reports fi'om the current reporting system. This is also a way to fine
tune and validate the model that you~,e built for your valuation actuary analysis, or whatever it might
be. It's also a way that the senior managers are used to looking at the business if you have profit
centers broken down by product line, if they're broken down by asset segmentation, and if they're
broken down by distribution channel. We can later cut, slice and dice various reports out of these
segments, but first try to get the segment structure correct.
Below the business segments we start getting into the model granularity, and again, as opposed to
a bottom-up structure, we focus on top down. The question is not how many plans do we have to
model, or should we be modeling all the plans; rather it is get some representative plans. We start
with our liability extract file. We probably know what some of our major plans are -- whether it's a
single premium deferred annuity (SPDA) or a couple of UL plans, or a few immediate annuity plans.
We start small, map everything to these few plans, get a model in place, and then we'll start refining
it over time and continue to make it a little bit better. Modeling is a process, so manage your
expectations. The number of plans you're going to design are traditionally being driven by the
representative products, issue years and underwriting categories.
Another constraint in the model granularity is run time, and the time it takes to build a model. It
should be as big as it can be within certain constraints. A key to the top-down structure is the way
we can input data. We want to have data inheritance or a top-down data input; that is, put in data
once and then use that throughout the system. For example, tax rates don't vary by cell or product
line. They're a corporate item, so put tax at the high level and let it trickle down through the model.
This is true with many assumptions, for example, maintenance expenses.
281

1996 VALUATION ACTUARY SYMPOSIUM
We all do experience studies. Experience studies are sometimes fully allocated expenses to various
business units. There's no reason we need to put these expenses in at the cell level. They have
nothing to do with the male 45 nonsmoker. Put these expenses in at the segment level and again let
them trickle down through the model, through the plans, and through the cells. If they vary at the
detail level, then we put assumptions in at that detail level and they override the assumptions above
it. We call that data inheritance. Minimize the number of inputs and use them throughout the system.
This adds some value in a couple of areas. First, it removes some propensity to error. It allows you
to make adjustments easily to the system. If you're going to change an expense item, you don't have
to do it throughout the system; you do it once.
Also tie it in with the way data is input. I like to use tables whenever possible, so I've been getting
away from the thought of building from a cell level up. I think top down. I don't want to open up
a male 45 nonsmoker table and see the mortality rate is 0.001. I want a table called at the plan level
that says use the 1965-70 mortality table. Then, when that nonsmoker, 45-year-old male is run out,
the table is read in. It does a point and shoot and gets the correct rates. I'd say anytime you can put
information to tables, do it. It's easy to build tables, it's easy to understand them, and it helps in the
documentation process. It also helps the senior manager to look down through the model to
understand what's in the model.
Given we have the structure of the model, now we have to start adding some meat to the bones. So
how do we begin to collect data? Where do we go to get data? Listed below are five areas where
we can collect data:
• Liability extract files
• Rates and factors
• Product characteristics
• Experience assumptions
• Corporate level assumptions
The first place is often liability extract files. Going into our policy administrative systems, and pull
offexact record counts for in-force business. From these records, we have the in-force business, we
282

LIABILITY MODELING H -- LIFE INSURANCE PRODUCTS
have the current interest rate, the current account value, and the current loans outstanding. In the
handouts there is a ten-page checklist of the data that's often needed to construct the liability model.
Within there, there are templates of what an extract file should look like. I think we've all been
through this. The hard part of taking the detailed records is to consolidate through a mapping
process and map it down to some representative plans. This again is more of an art than a science,
but I'd recommend consolidating as much as possible, particularly when you're first building the
models. Build a few representative plans. It's easy to go back later and make more detailed mapping
and carve out more product types. As far as life insurance goes, other sources of information are
going to be rates and values. We go to our valuation system and get tables built for reserves, for cash
values, historical dividend tables, and things like that. Again, we want to be table driven, so as these
rates get modified through time, all we have to do is just plug new tables into the model.
As we drill down into the model, we get into various product characteristics. Where do we get
product characteristics? Well, we get them from product implementation memos, and from policy
forms. Once you collect this information, make sure you document it in a model procedures book
or a model documentation manual. Keep it in a three-ring binder and keep it in a central location.
It takes a lot of effort to collect this information the first time and we don't want to have to do it over
and over again. When we go to the model and we look up something and we ask where did this
expense assumption come from. We now have the ability to go to the book, open it up and say,
"Here's the original product implementation memo."
My point is, it's not so hard to collect data, but it's fairly tedious and it's time consuming to build out
the model the first time, but it's important to have the source information and a method if you need
to go back and check it out.
Other sources of data are experience studies, and mortality, lapse, and expense studies. I would
recommend putting this information in tables and as these experience studies get updated, the tables
get updated, and therefore, the model is easily updated. Then we are simply plugging in new tables
or revised tables with the same name. It makes it easy to create an accounting trail to drill into the
model and understand where all these assumptions are coming from. All the information I've talked
283

1996 V A L U A T I O N A C T U A R Y S Y M P O S I U M
to you about so far is really factual data. It's generally easy to find, and it's jut a matter of finding time
to collect all these data. It's important to document it.
The next major item is behavioral models, which require some fuzzy logic. I don't think we spend
enough time on behavioral models, probably because they are difficult. We don't have absolute
answers. We're used to dealing with things that are relatively factual and as we start getting into
behavior models, there's little empirical evidence we can go to. There are two primary behavioral
models, the first behavior model is policyholder behavior and that incorporates dynamic lapses,
dynamic premiums, loans, and policy withdrawals. So again, we don't have a lot of empirical
evidence. We~,e all done lapse studies, but over the past few years they only have a certain amount
of predictive value. We haven't seen interest rates spike up, and competitor rates have been fairly
constant. We're not seeing a lot of lapse behavior. So when we're running Regulation 126 analyses
and we see a 300-basis-point spike, we don't know how policyholders are going to behave. We need
to model dynamics because that's what we're required to model and we want to understand our
business.
I recommend building a template and getting information from senior people. I think behavioral
models are the key driver of the cash flows and most of the strategic analysis that's being done in
modeling right now. Money is being spent on the asset side to study prepayment behavior and
interest rate models and call behavior, because the asset characteristics are known.
The same thing exists on the liability side. We know our liability characteristics. We know if there
are bail-out provisions in the product. We can define what we're going to credit, but we don't know
how policyholders may behave. So to assist in this, I think behavioral models are a key item and
senior management needs to get involved in the decision-making process, but they're not going to be
designing the formulas; that's often left to the actuaries. Many companies assume the Regulation 126
formula, with parameters such as A equals two, B equals two, and C equals one. I don't really know
what that produces, and I don't often see any studies to tie it back to. I don't know the impact on my
business, and I don't know to what boundaries or what extremes those might be valid parameters.
284
LIABILITY MODELING H -- LIFE INSURANCE PRODUCTS
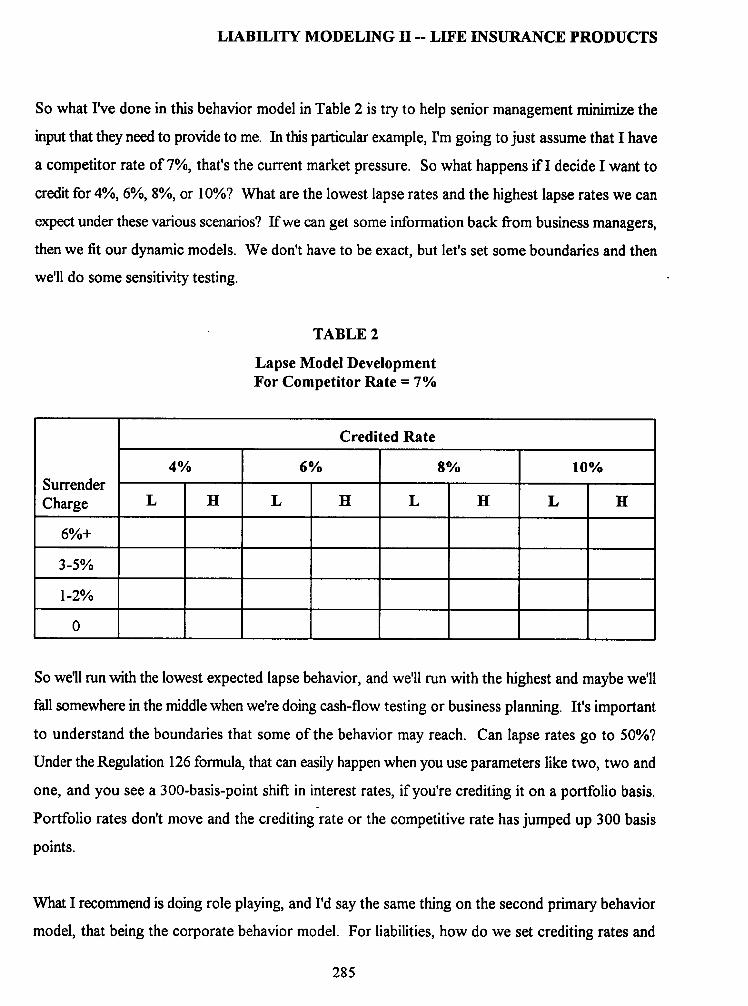
So what I've done in this behavior model in Table 2 is try to help senior management minimize the
input that they need to provide to me. In this particular example, I'm going to just assume that I have
a competitor rate of 7%, that's the current market pressure. So what happens i f I decide I want to
credit for 4%, 6%, 8%, or 10%? What are the lowest lapse rates and the highest lapse rates we can
expect under these various scenarios? If we can get some information back from business managers,
then we fit our dynamic models. We don't have to be exact, but let's set some boundaries and then
we'll do some sensitivity testing.
TABLE 2
Lapse Model Development For Competitor Rate = 7%
Credited Rate I
4% 6% 8% 10% Surrender . . . . Charge L H L H L H L H
I I I I I I I I
6%+ I I I I I I I I
3-5% I I I l I I I I
1-2% I I I I I I I I
0
So we'll run with the lowest expected lapse behavior, and we'll run with the highest and maybe we'll
fall somewhere in the middle when we're doing cash-flow testing or business planning. It's important
to understand the boundaries that some of the behavior may reach. Can lapse rates go to 50%?
Under the Regulation 126 formula, that can easily happen when you use parameters like two, two and
one, and you see a 300-basis-point shift in interest rates, if you're crediting it on a portfolio basis.
Portfolio rates don't move and the crediting rate or the competitive rate has jumped up 300 basis
points.
What I recommend is doing role playing, and I'd say the same thing on the second primary behavior
model, that being the corporate behavior model. For liabilities, how do we set crediting rates and
285

1996 VALUATION ACTUARY SYMPOSIUM
dividends? The same sort of senior management analysis is needed. We need to turn our crediting
strategy into an algorithm because we're doing five-year business plans, or 20- to 30-year projections
for cash-flow testing. We must have a model that projects out what behavioral models are expected
to be over a long period of time.
We need to work with senior management to formalize this and put it into a model algorithm. So for
example, does the crediting strategy vary by new and renewal rates, product lines, distribution
channels, or new money versus portfolio? Who's the competition? Do we have a peer group? Do
we look at the Fisher Report?
With the introduction of equity-indexed annuities (EIA), there's a whole new competitor. Again,
interest rates have been relatively constant and fixed annuities are still a great deal, but with the equity
market up 38% in 1995, these EIA products and variable annuities just took all the money away.
Indexed products were an unexpected economic impact that affected premium dump into universal
life and to annuities, and affected lapse rates. I also think that the Internet will cause much more
competitiveness in product features as well. So again, this unanticipated technology may have a big
effect on consumer behavior. I might start getting mail on my Internet saying, "We have this new
product that you should think about." It might be junk mail, but it pops up on my screen, so I look
at it. It says, "Give us your current policy number and we'll transfer your block of business into ours."
This could happen to insurance products; it certainly happened for mortgages. We started getting
all kinds of things from banks, and prepayment rates jumped up. This was unexpected back in 1980,
but it occurred. The reason I focus on the behavioral models is because, again it's a key driver of cash
flows and a key driver of the risk analysis and strategic analysis that we're going to do.
I just put together this one example in Table 3, and again this was for a block of in-force, relatively
mature, annuities. What I did was initially held both the crediting rate and the lapse rate constant at
the base assumption; the crediting rate was current market conditions and the lapse rate was a current
4% or 5% lapse rate. I projected out the cash flows and discounted back doing option-adjusted
duration analysis and found the duration of my liabilities to be fairly high at 13.
286

LIABILITY MODELING I1 -- LIFE INSURANCE PRODUCTS
TABLE 3
Behavioral Model Affect on Durat ion
Durat ion
Fixed Credited, Fixed Lapse
Fixed Credited, Dynamic Lapse
Portfolio Credited, Fixed Lapse
Portfolio Credited, Dynamic Lapse
13
6
3
0.3
(=Assets)
Then I turned on dynamic lapses using the pretty vanilla Regulation 126 lapse formula. I put in
general parameters, maybe a two, or a two and one, and reran the model. My liability duration fell
to six. That's a pretty dramatic fall, and it certainly would be significant i f rm trying to target my
assets to match my liability duration. Next I went the other way, and held the lapses fixed and
assumed a portfolio crediting rate strategy to see what would happen. My duration fell to three,
which was pretty much equivalent to the duration of my asset portfolio. I think this is what I
expected, given we're crediting the portfolio rate and the cash flows are relatively constant now since
there are no dynamic lapses going on.
Then I made both assumptions dynamic, using a portfolio crediting strategy and a dynamic lapse, the
duration fell to 0.3. Somewhere below one is a reasonable duration for a block of in-force SPDAs,
as you credit current market rates and as you run out of the surrender charge period. The SPDAs
behave like certificates of deposit (CDs), they're just money market accounts, and the duration gets
fairly small. It is important to note the volatility in these duration numbers, particularly when trying
to invest appropriately to match duration or at least know where mismatch risk is.
I think a lot of attention must be paid to the behavioral models. This attention is not currently being
given to behavioral models and I'm not sure why, other than I think it's relatively difficult. Again, I
know a lot of people spend time looking at and beating up interest rate models, saying "They're only
one-factor models or two-factor models," or "They don't have up and down paths," or "Interest rate
movements are relatively insignificant." However, if we don't know how our policyholders are going
287
1996 VALUATION ACTUARY SYMPOSIUM
to react to those movements in interest rates, what's the point? So I urge you to spend a lot of time
on the behavior models and get senior players involved in the process.
Let's summarize model mechanics and the process of going through modeling. My main point is that
modeling is a process. It's not a one-time deal. You need to manage your expectations a little bit.
When you're first building a model or even going through the model a second time, you're not going
to get results that are matching your actual income statement. There's volatility in the numbers. You
don't have all the plans mapped and modeled appropriately. There's a lot of movement gong on, but
don't let that worry you. What we need to do is start the process in the right way and make it a little
bit better over time. We use a lot of macro factors at first, like overhead expenses, and we can
calibrate the model to actual. For example, using actual balance sheet versus model numbers,
calibrate starting model values. If reserves are off 1% or 2%, that's fine; let's just put in the difference
and amortize that over the model projection period. We'll fine-tune this model error a little bit later.
I think we want a model that we begin to get some results from and get a feel for some of the trends
more than the relative numbers. For example, what is the duration? What's the trend of profits if
interest rates go up or down? What's the trend in the volume of business? Where are we at risk?
It's not so much whether we're going to lose $10 million or $11 million; it's a matter of, are we going
to lose money? Modeling is going to take a long period of time and it's going to be an ongoing
process throughout time. It's important to have a model steward, or someone that's accountable for
this period after period.
Then we get this process in place and the model is refreshed on a quarterly basis. Keep the model
up to date; keep fine tuning the model; and calibrate it to actual quarterly financials. Have the model
steward maintain documentation, and document both the model development process as well as the
underlying model characteristics and the detailed data that went into the plans. Get the system on a
network, get your hands on the computer and take a look at what's being done on the system. Get
a feel for how these systems work. I think they're much more intuitive than they used to be. They're
user friendly, and most of them are on Windows now. They've become faster and faster. There's a
lot of keen insight that can be derived. Focus on a top-down structure. We want to allocate assets
288

LIABILITY MODELING H -- L IFEINSURANCE PRODUCTS
appropriately to the various business segments. We want to have appropriate measures for
performance measurement. We want to minimize data input and the top-down structure allows us
to do that. We put information at the top, and let it trickle down through the model. Again this will
serve many purposes. One, it's a good documentation feed. Two, it reduces propagation for error.
You're not putting data in as often as you used to. It allows you to refine the data, so you can make
changes fairly easily. Spend time developing the behavioral models. I think in the coming years, this
is going to be a key driver of the life insurance and annuity industry. There's no reason that liabilities
can't be packaged and securitized and sold off. We've seen that on the asset side for all kinds of
assets. If this is going to happen on the liability side, then the investment bankers and the insurance
companies have to understand the behavioral models to be able to understand their business. I think
all these items will lead to a bigger payoff in the end. I think you'll get a faster run time, a faster
turnaround time, and clearly a much better understanding of your model throughout the company
from the top down.
The biggest frustration I see in companies is that after a couple years, the models are just unwieldy.
They're patchwork; you made modifications here and there, but you don't have a good database
structure. You have cash-flow testing information in the same directories as last year. It just gets
out of control and then it's hard to get it back in line. So I think you need to spend time upfront
designing a blueprint and then refining that over time. Give some thought to both the behavioral
models and the structure of your models to begin with.
MR. G R E G O R Y M. MATEJA: What I've done throughout my career is a lot of both model
building and model review. Right now I do a lot of that for acquisitions and for internal use. I'd like
to share some of the tips that rye learned through the years. When you start, think about a modeling
process as having a variety of steps. The first thing you need to do is set the goal of what it is you
want to do. You've got to set the goal with your constraints in mind and you must identify those
constraints. You must gather a certain amount of data when you build your model and you have to
review the data. Aider that, you select some model plans. You get the detailed data necessary to
build the model. You build the model and you validate it and then you can answer the question. You
can do this most efficiently in the top-down manner that Mike Murphy described.
289

1996 VALUATION ACTUARY SYMPOSIUM
The key to doing this successfully, I believe, is managing the interplay between the goal that you set,
the constraints that you find yourself under and the characteristics of the block.
The first thing you need to do is decide what it is you want. I find it easiest to think of this in terms
of a question: what's the value of the business? How does it impact the bottom line? How can
profitability be improved using "what-if" analysis? What do regulators require us to do? One of the
things you want to think about, as you do this, is the constraints. One of the constraints to consider
is the accuracy of our models. Oftentimes our models may only be accurate within $5 million or $10
million. You don't want to make a million dollar decision based on the results of a model that's
accurate to only $5 million or $10 million.
Other traditional constraints that you have are time. How much time do you have? If you're doing
any acquisition analysis, you may only have two weeks or three weeks tops. For other kinds of
analysis, you might have six months. What kind of resources do you have? People? Hardware?
Where is the data? For a lot of life insurance products, you need a lot of data. You may have to
enter it manually as opposed to electronically, and that can take a lot of time. Can you use outside
resources, like consultants? We model in about 50 segments for our life insurance blocks. I really
manage about 50 different submodels that all add up to one. That adds a lot of overhead. The results
need to be sliced and diced a lot of different ways. You need to think about that.
What kind of company practices are people used to seeing? How have things been done in the past?
You can change things, but I have found that you have to change slowly.
One of the questions people always ask is, how big does the model have to be? I think it needs to
be as large as the constraints allow and as small as the objectives permit. You have to balance these
with the characteristics of the block -- the structure, the number of products, the distribution
channels, and so on. You can think of this as branches on a tree. Each one of these characteristics
that you model splits a branch. You can cut down the size of your model by pruning off branches,
but you want to make sure that you retain important characteristics. Sometimes just using averages
will produce very different results. I've worked at both companies and as a consultant, and I'm a big
290

LIABILITY MODELING H -- LIFE INSURANCE PRODUCTS
fan of doing stuff internally, but I also never hesitate to go out and use consultants when the situ~ition
calls for it.
What do I see as Some of the trade-offs? When you do it yourself, you have a lot of control. Your
people get a !ot of satisfaction out of doing a project and showing it to senior management. Don't
underestimate the power of positively motivated people -- people that feel they've done a job that's
recognized by management. You also tend to have an emphasis on details. When you build a model
internally, you tend to get interrupted by other priorities, like monthly business meetings, or
something else comes up that's more important. So it tends to be difficult to keep a time line.
When you hire a consultant, the biggest advantage that I've usually seen is speed. They have the
resources to get it done or they stay up all night. You get a broader knowledge base. It's usually not
as in-depth knowledge about your company or your products, but if you're entering new markets,
something that you may not have experience with internally, consulting can be a very viable option.
You often end up with a coarser model with less cells. As Mike pointed out this isn't always a bad
thing.
One of the things I will caution you about, when you do use an external consultant, is be prepared
for a significant amount of support. Someone has to get all that data. Usually it's the people at the
company. Someone has to approve all of the assumptions, and again, it's usually someone at the
company. So there's a lot of work that still ends up being done at the company. You can find
yourself in a. situation where your people are doing a lot of work and getting relatively little
recognition for it. You want to be aware of that and manage it. It can be done and it can be done
effectively. You can use some hybrid approaches. I've seen it work where you share different parts
of the process; you have on-site support of either a consultant or of a company person at a consulting
office. That can bea very effective approach, but again, it needs to be managed very carefully.
When people build models they usually build them for two purposes. They build them for a single
use or they build them for many uses. Specific single purpose models have a lot of advantages. You
can control them very easily and tailor them exactly to your needs. Things like run time are
291
1996 VALUATION ACTUARY SYMPOSIUM
controllable. If you're doing intensive asset/liability analysis, you can tailor the model to that. This
tends to increase in maintenance costs; however, because you must maintain multiple models.
Consistency can be an issue because you have multiple models. One of my favorite sayings is the man
with two watches doesn't know what time it is and that's really true of modeling. If you have
inconsistent results, you can end up suffering from a lack of credibility, which we don't really need.
Multipurpose models tend to gravitate to details. They tend to go to the most detailed use, usually
some kind of financial planning. That leaves you with long run times for your cash-flow testing. You
have the advantages of less maintenance and you have consistency.
What do I like to do? I use a multipurpose model for all of our life insurance modeling. We use the
same model for our financial planning as we do for our cash-flow testing and vice versa, depending
on how you look at it. For illustration actuary work, we're using the new business portion of our
operating plan model. So we try and use it for as many purposes as possible. When we have a
specific strategic need that must be addressed, such as what should we do about crediting rates, we
take a subset of that model and build a simpler model, so that we get the speed efficiencies we need.
We don't suffer from a credibility problem because we're not generally comparing absolute results.
We're doing what-if analysis. It's worth $10 million and that's all we quote. We don't quote the base
line or we quote our plan, so we don't run into the consistency issue.
When I do due diligence on a life insurance company, I review a model. There are a few things that
I always look at. Marketing and distribution is always number one. What are the distribution
systems? Where is the company selling? What's going on? What kind of exchange programs or
special offers have been made? This has a lot of impact on the option exercises or policyholder
behavior, expenses, and your experience assumptions. What kind of liquidity is offered to the
policyholder? Withdrawals, loans, surrenders, face amount changes, and other things you might not
think &can have substantial impact on cash flows. Reinsurance is very important on a life insurance
side. Some companies are in situations where they feel they're making significant money off of their
reinsurers. That may be true for automatic reinsurance, but when you look at a lot of the facultative
business that most companies have and many of the other smaller reinsurance arrangements that may
be there, there's often a significant cost there. You want to make sure you capture that. Oftentimes
292

LIABILITY MODELING H -- LIFE INSURANCE PRODUCTS
you just pull your YRT rates from your most favorable treaty, and you'll underestimate your
reinsurance cost. You want to look at that, and you always want to look at the traditional insurance
experience assumptions, mortality, lapses, and things like that. One of the other things to think about,
especially with certain product segments, is integration with riders, dividend options, and things like
that. So modeling a base policy alone is often not sufficient anymore.
Looking at some specific product types, term insurance used to be the simplest life insurance product
that I ever ran across; it had simple structure and attained-age ratios. It's easy to model. I don't
know how many people remember those days, but it seems like they're long gone with term insurance
in the 1980s and into the 1990s. Premium pattems are key, such as the period of time that premiums
are level and how they are integrated with the ultimate sub. There's a lot of interesting riders that are
available for term insurance. What are people doing for reserving? What are the constraints that you
have as a company? What does your chief actuary say you must hold for term insurance reserves?
The most important things that I look at when I'm building a model of term insurance is mortality and
how that's impacted by the premium pattern and any reentry provision. What kind of mortality
deterioration do I expect? How many risk classes are there? What kind of underwriting is there?
These are all things you need to look at and think about and make sure they're reflected and captured
accurately in your model.
When you look at developing your model cells, you want to make sure you're capturing the cash
flows. Term insurance, over the long haul, is driven by the cash flow. If you're not careful in your
selection and validation of your model cells, you can seriously underestimate or overestimate the
premium flow that you're getting off your block over time. So you want to do as many checks as
possible. You want to make sure you understand the reserving. That can have significant capital
impact.
Traditional nonparticipating insurance, you don't run across too much new business anymore, but I
know many of us have big blocks of that on our books. Many of the old products issued in the 1940s
and 1950s have some very complex benefit patterns, where there may be different benefits for the
293

1996 VALUATION ACTUARY SYMPOSIUM
primary insured, the spouse, and the children. All of those can vary by age and duration. Just reading
some of these contracts can be quite confusing. Finding information about them is often a problem.
In addition, you want to be aware of any nonforfeiture blocks that you have, like reduced paid-up and
extended term insurance. There can be a lot of value there and a lot of people don't model that very
accurately. I have lots of plans and very little data in each plan. You have to be creative in how you
combine plans and usually it's a small block and it's not worth spending much time on. It's one of the
areas we have to make a call on balancing against the constraints and your goals.
Everything seems to have changed a lot in the participating market over the past decade. There's a
lot of integration with riders and dividend options. You have to understand what the dividend scale
and the philosophy is. How are rates being credited through the dividend scale? What other factors
are being considered in there? You have to understand how that compares to universal life. In
universal life, everything is explicit, and the dividend is all integrated. There's only one number to
change. Many times you can use just a factor with a dividend to get a flavor for what's going to
happen, or what the company might do under certain circumstances.
The most important thing is how you select model cells, especially given the proliferation of model
plans with riders and integrated dividend options. Sometimes you can get a good flavor for this by
just modeling it as universal life. Some of the product combinations that are out there aren't that
different. Understand the behavior with respect to the dividend. How are those likely to change and
how is the policyholder likely to respond? The elements that affect policyholder behavior tend to be
more hidden with the dividend scale. Projecting how policyholders will react to a change in interest
rates is a little more difficult to model than with universal life because the factors underlying the
divided are hidden.
In universal life, you want to be aware of the premium patterns, such as target, term, and single.
We're seeing growth in seven pay-type scenarios, at least on an illustration basis. What kind of
persistency do people have with respect to premiums? This is an area where I've observed that
modeling an average premium produces very different results than modeling three different premium
294

LIABILITY MODELING H -- LIFE INSURANCE PRODUCTS
patterns that produce the same aggregate premium. What kind ofnonguaranteed elements, cost-of-
insurance (COD, interest, and expenses are there? What kind of margins are there in the guarantees?
There are bonuses and secondary guarantees. There's a lot of things out there in the universal life
market today. Some of them are very expensive. You want to understand what they are. If you see
those, you want to make sure you capture them.
What are the most important characteristics that I look for? I try and answer the question, where is
the company making money? What are the margins? As a company, are we making money? Or is
the potential acquisition making money off of its interest margin, cost-of-insurance charges, and its
expense loads? Understanding that can be very important in terms of managing the business going
forward. What's the interest crediting strategy? How do people respond to changes? Understanding
that is important. Policyholder behavior is also important.
Interest-sensitive whole life, in some respects, is just a variation of universal life, but there are the
differences in premiums and the guarantee options. What are people going to do at the end of the
guarantee? What's going to happen with the premiums? How are the funds accounted for?
There are many different methods I've seen for accounting for funds. There's monthly or annual fund
processing. You want to make sure you capture all of that. Some of the products have annual fund
mechanics, but when the policyholder pays monthly, there can be some interesting accounting that
goes on inside your general ledger. You want to be aware of that and if that's germane to your
model, you want to capture that. You also want to be aware of bonuses, secondary guarantees and
other features that also exist in universal life.
When you construct the model, the most important thing is finding the margins. Interest crediting
strategy and policyholder behavior are important just as they are for universal life. You also want to
capture what's going to happen at the end of the guarantee period. If you illustrated a lot of products
on a limited-pay basis, what's going to happen if interest rates are down? Are people going to opt
to pay additional premiums or not? You want to think about these things as you construct the model.
295

1996 VALUATION ACTUARY SYMPOSIUM
With variable life, you don't have to worry as much about that. You have to understand the funds.
You'll want to understand how the fixed account works, if there is one. What kind of restrictions are
there on fund movements? You want to understand how your company and model accounts for
separate account surplus.
The most important thing is remembering to read the prospectus. Every time I read a prospectus,
even my own company's prospectus, on my own product, I learn more. There's a lot of disclosure
in there. You want to be aware of the experience assumptions, since you don't have control over the
policyholder. You're a little more subjected to variances in policyholder behavior. You want to
understand fund returns and volatility. The difference between a 9% level rate and a strange pattern
of 10% growth, -20% growth, 30% growth, and a few years of very small growth may produce the
same ending account value, but it'll produce very different profit for the company. What I usually do
with variable products is look at a series of deterministic scenarios. One real interesting one to look
at is taking the current market and running it backwards for ten years. That's always very interesting.
What do I think are the key tips to success here? Manage the modeling process successfully and
understand what's going on in the model. Identify unusual contract features and experience factors,
things that impact the product behavior as soon as possible in the process. You want to set the goal
for your model building, but keep the constraints in mind. You want to continually optimize the
process by playing offthe objective, your constraints, and the characteristics of the block. That way
you get the answer to your question on time and for the amount you wanted to spend. You want to
remember that this involves a lot of art as well as science.
MS. RATAJCZAK: During the nine or so years that I've been with Milliman & Robertson, I've had
an opportunity to work on a lot of appraisals, look at a lot of companies' actuarial memorandums and
look at what has evolved as far as sophistication on the life insurance modeling side. Some people,
until Section 8 asset adequacy opinions for cash-flow testing purposes, might not have considered
your life insurance business at all. Now it's possible you're doing these tests and perhaps certain
surpluses on your life insurance side are necessary to offset deficits that you have elsewhere. So from
a cash-flow testing standpoint, you see universal life business and interest-sensitive lie business going
296

LIABILITY MODELING H -- LIFE INSURANCE PRODUCTS,
through the hooPs of cash-flow testing. Because of the noninterest-sensitive nature of it, you might
be doing something more along the lines of gross premium type calculations for your term business.
Judging from the size of the group in this session, I think I can assume that there's just more and more
interest in projecting life insurance business.
So it gets back to that purpose that we were talking about. Models are still built for life insurance.
You still consider product characteristics and features in order to appropriately model the
policyholder and company behaviors and their impact on cash-flow testing.
Now for cash-flow testing on term business, you might not use very sophisticated models. But if
your Board of Directors comes to you and says, "I'd like you to tell me what the value of this business
is," you might have to be more sophisticated, taking into consideration such features as different
premium bands and nonguaranteed dements. It will make the modeling process a little bit more
complex than the cash-flow testing side.
If we take a few minutes and review individual products very generally, from a significant assumption
standpoint, model building, as Greg mentioned, premium persistency on UL, crediting strategy, the
interaction between crediting strategy and lapses and policy loan utilization are key to appropriately
reflecting the cash-flow impacts of universal life and interest-sensitive life product features.
Let's take premium persistency for example. What is going to impact premium persistency? If you
go through and do your pricing work, you know, from a profitability standpoint, how important the
premium persistency that you get on the business is. You must go back and consider items
constructing models. You may have a premium mode. Is this premium automatically billed? If it is,
then it may impact premium persistency. Also is it a salary deduction product or isn't it? That has
an impact on premium persistency. So you're looking at the characteristics of your products in order
to appropriately have a model that will reflect the policyholder and company behavior when it's used.
297

1996 VALUATION ACTUARY SYMPOSIUM
Now let's discuss the case study. I chose a participating whole life product and certainly the key
considerations are dividends scale mechanics, policy loan utilization and how policy loan utilization
is recognized in the divided scale.
For nonparticipating whole life and term business, the key characteristics are the premium bands, the
modes, mortality, and the underwriting category. Is it substandard business? Is it smoker or
nonsmoker? Having a model that reflects all those things is probably going to give you a more
accurate picture of the underlying cash flows or profitability of the business. Policy loan utilization
on the whole life business is also a key feature. This is something important to take into consideration
because you just don't have one policy loan type formula. You might have a variable loan rate or a
fixed loan rate on the product. So it's important in your model to take those differences into
consideration so your projections are accurate.
Now if you've been in sessions where you're dealing with life insurance and somebody looks at a case
study, more than likely they probably chose something like a universal life product or an interest-
sensitive life product. There's the crediting strategy mechanics and the interaction with the crediting
strategy and the lapse rates and premium persistency and how they all work together. I decide to be
different, and I chose a participating whole life product. This particular product is just a vanilla
product on its own, with a dividend scale and a dividend formula that is calculated based on one
factor -- an interest factor.
I used one plan to do my modeling and I used three ages: 25, 35, and 45. This is based on a real
product that was part of a larger model, but I wanted to isolate this particular product. As I
mentioned, I'm going to focus more on the policyholder and company behavior and what happens
when we make changes in those assumptions, as opposed to taking our model and making changes
to it. So our model is going to stay fixed, but our assumptions are going to change.
The projections are based on a set of general assumptions. For this product, the commissions were
a little odd; 80% in year one, 20% in years two to three, 10% in years four to five, 5% in years six
298
LIABILITY MODELING H -- LIFE INSURANCE PRODUCTS
through ten, and 2% thereafter. Maintenance expenses were $100 per policy. These were inflated
3% per year, and there was also a 2% of premium expense to cover premium tax.
Base lapses for this product are 20% in year one, 12% in year two, 10% in year three, 8% in year
four, and 6% thereafter. The underlying mortality reflected in the death benefits is based on 90% of
the 1975-80 Select and Ultimate Mortality Table. This particular model assumed all male nonsmoker
and reserves were calculated at the Commissioner's Reserve Valuation Method (CARVM) at 4.5%,
based on the 1980 commissioners standard ordinary (CSO).
I mentioned that the dividend formula has one factor. You've seen three factors, but this has just one
factor for simplicity. The actual dividend is calculated as:
(Credited Rate - Valuation Interest Rate) x Statutory Reserve
In this case, the credited rate is defined as the net earned rate on the underlying portfolio, less 150
basis points. For one of our sensitivities, the model was also enhanced to include an excess lapse
piece that reflected perceived expectations of when the company decides that they're going to
decrease the dividend scale. So excess lapses for one of our case studies are equal to 5%
additional lapses for each 10% reduction in the dividend scale when compared to the dividend
scale from the prior year. Excess lapses a year are limited to 50%.
The base case, Static Dividend Scale, assumes that the current dividend scale, based on that
formula as of the valuation date is going to remain the same forever. Now that's not very likely,
but it gives you kind of a frame of reference when you're looking at what happens when we make
modifications to assumed policyholder and company behavior.
The sensitivities that I looked at included, first taking the dividend scale and setting it up with a
dynamic formula that reflected the actual credited rate, based on the underlying portfolio, over the
projection period. For this first sensitivity, I didn't include any excess lapses to reflect
policyholder behavior in the event that the dividend scale was reduced.
299

1996 VALUATION ACTUARY SYMPOSIUM
The second sensitivity used a dynamic dividend scale, but we assumed, in this case, that the company
only wants to change dividends every two years. We also did not include excess lapses in this case.
The last case is the full dynamic dividend scale formula with no lag, but with the excess lapses thrown
in.
The assets that support this block had an average earned rate assumption to start with of about 8%
and the portfolio included just callable and noncallable bonds and mortgage-backed securities.
Default costs were assumed to be ten basis points and the investment expenses were 25 basis points.
If sales were indicated, the portfolio was liquidated on a pro rata basis and any excess cash was
assumed to be invested in seven year, noncallable bonds, earning 80 basis points over the treasury
rate.
The output for each scenario or sensitivity incudes a report labeled Summary of Profits that will show
the present value of projected profits based on three different interest rates and a net investment
earnings rate.
Table 4 is the scenario labeled Static Dividend Scale. The column labeled after-tax NIER shows how
a large amount of profits is produced on a present-value basis.
Now let's assume for the time being that your company has annuity business, universal life business,
and this block of traditional participating business. It just so happens that because of what's going
on in the interest rate environment, you need to use some of the excesses or surpluses on this side to
offset the universal life deficits. Then, when you do your Section 8 opinion, you can say that in the
aggregate, things look good from the asset and the liability side of things.
Let's take scenario seven, down five, up five. For the static dividend scale, we have abut $50 million
of surpluses that we can use to offset deficits elsewhere. So we'll use that as our point of reference
as we make changes to our dividend scale mechanics assumptions.
300

TABLE 4
Static Dividend Scale Summary of Profits
Scenario Sumary for ModuLe Projection Description: Scenario Report Projection Node: Annual Projection Dmte: 12/1995 Pro ject i~ CycLes= 20 (Annual) ScaLe: 1,000 (except itelm Barked with ~*e)
Present VsLue of Prof i ts st 8X
Scenario Level Scenario 55,094 Scenario Up 5X Over 10 Years 94,334 Scenario Doun 5X Over 10 Years 27,249 Scel~rio Pop Up 3X 92,113 Scenario Pop Doun 31~ 18,753 Scenario Up 5X Ooun 5Z 76,186 Scenario Doun 5X LIp 5K 36,361
Page 8 XYZ Life Insurance Co~--'~y
08/08/96 14 ! ALFA /,.43 / VALACT1.A12 / ,
IOZ 12~ Aft Tax NIER
47,950 42,172 72,782 78,898 66,835 120,447 25,538 23,939 29,942 78,465 67,618 113,810 17,807 16,880 19,935 66,045 57,789 94,590 31,807 28,171 50,861
Profi ts Prof i ts Profits Prof i ts Prof i ts Prof i ts Prof i ts p Scen 1 Scen 2 Scen 3 Scen 4 Scen 5 Scen 6 Scen 7 High Lou p
. . . . * * . . . . . . . . * * * . . * t * . * . ° . . * * * * . . . . . . . * . * * ~ . . . . . t . * * . . * * * . . . . . . * . t * . . . . . . . * * . . . - - - . . . . . . . . . . . . . . . . . . . . . . . . . . . . .
1 4,577.7 4,659.5 4,489.0 5,035.3 4,032.2 4,738.9 4,400.9 5,035.3 4,032.2 1 2 5,360.4 5,592.5 5,107.9 6,485.1 3,998.9 5,812.5 4,736.9 6,485.1 3,998.9 2 3 5,735.0 6,190.3 5,159.7 7,461.5 3,765.0 6,628.9 4,583.8 7,461.5 3,765.0 3 4 6,021.9 6,793.3 5,032.6 8,339.0 3,478.1 7,547.4 4,283.0 8,339.0 3,478.1 4 5 6,210.5 7,382.8 4,784.4 9,102.4 3,126.2 8,536.4 3,920.0 9,102.4 3,126.2 5 6 6,383.1 8,013.8 4,549.3 9,821.3 2,880.8 9,625.8 3,665.4 9,821.3 2,880.8 6 7 6,722.9 8,814.1 4,447.7 10,615.8 2,800.2 10,573.7 3,577.2 10,615.8 2,800.2 7 8 6,630.3 9,349.9 3,914.5 11,049.5 2,284.1 10,993.3 3,105.5 11,049.5 2,284.1 8 9 6,Z30.4 11,015.5 2,173.2 11,382.1 1,240.3 11,368.2 1,981.7 11,382.1 1,2/.0.3 9
10 6,005.6 11,993.3 1,273.6 11,451.0 769.1 11,070.4 1,944.5 11,993.3 769.1 10
p Nun Std Dev P . . . t . . . * * . * * * . . . . . . . . . . . . . - *
1 4,561.9 287.1 1 2 5,299.2 737.1 2 3 5,646.3 1,163.1 3 4 5,927.9 1,634.6 5 6,151.8 2,135.3 6 6,419.9 2,618.6 7 6,793.1 3,042.1 8 6,761.0 3,475.0 9 6,484.5 4,388.2
10 6,358.2 4,729.7
6 7 8 9
10

TABLE 5
Dynamic Dividend Scale - - No Excess Lapses Summary of Profits
Scenario Sumar~ for l~dute Projectio~ Deacription: Scenario Report Projection Node: Annuat Projection Date: 12/1995 Projection Cycles: 20 ( ~ l ) Scale: 1,000 (except itmm mmrked with ~*')
Present Vatue of Prof i ts i t
Scenario Lever Scenario Scenario Up 5X Over 10 Yemrs Scqmrio Ooun 5~. Over 10 Years Scenario Pop Up 3X Scenario Pop Do~ 2W, Scenario Up 5X Down 51[ Scenario Ooun 5Y, Up 51[
Page 8 XYZ Life ]nsurance Company
08/08196 14.~''~2 ALFA 4.43 / VALACT1.A12 / L
8Z 10~ 12~ Aft Tax NIER
70,835 60,624 52,682 96,854 78,505 67,189 58,134 98,096 68,515 42,8?9 38,221 65,059 76,275 65,698 57,219 93,047 42,199 37,150 33,000 59,237 72,533 62,667 54,728 91,029 58,545 50,009 43,256 86,404
Prof i ts Prof i ts Prof i ts Prof i t s Prof i ts Prof i ts Prof i ts p Scon 1 Scen 2 Scen 3 Scen 4 Scon 5 SCOn 6 Scen 7 High Low
1 4,577.7 4,659.5 4,689.0 5,035,3 4,032.2 4,738.9 4,400.9 5,035.3 4,032.2 2 5,360.3 5,592.4 5,107.8 6,685.0 3,998.8 5,812.4 4,736.8 6,685.0 3,998.8 3 5,738.5 6,191.1 5,166.1 7,648.7 3,788.1 6,627.0 4,594.2 7 , 6 4 8 . 7 ' 3,788.1 4 6,668.3 7,223.3 5,990.7 7,678.0 5,655.7 7,760.3 5,463.4 7,760.3 5,463.4 5 7,248.1 7,922.4 6,415.0 8,029.8 5,957.1 8,573.8 6,203.3 8,573.8 5,957.1 6 7,731.9 8,522.0 6,910.6 8,428.1 5,887.3 9,281.8 6,673.8 9,281.8 5,887.3 7 8,372.0 9,170.4 7,610.9 8,917.2 5,958.9 9,618.3 6,735.8 9,618.3 5,958.9 8 8,596.9 9,447.8 7,209.5 9,0~2.5 5,571.2 9,195.7 6,379.1 9,447.8 5,571.2 9 8,389.1 10,853.4 5,573.9 9,177.7 4,633.1 9,189.7 5,342.2 10,853.4 4,633.1
10 8,389.6 11,485.5 4,758.7 9,051.5 4,266.2 8,686.3 5,370.1 11,685.5 4,2/.6.2
p Keen Std Oev . . . . . . . . . . . . . . . . . . . . . . . . . .
1 4,561.9 287.1 Z 5,299.1 737.1 3 5,650.5 1,153.0 4 6,621.4 892.1 5 7,192.8 945.2 6 7,633.6 1,111.0 7 8,054.8 1,245.7 8 7,920.4 1,418.0 9 7,594.2 2,211.3
10 7,426.8 2,681.1
1 Z 3 4 5 6 7 8 9
10
P ° °
1 2 3 4 5 6 7 8 9
10

LIABILITY MODELING H -- LIFE INSURANCE PRODUCTS
The next sensitivity is labeled Dynamic Dividend Scale, No Excess Lapses (Table 5). If you once
again look at that last scenario, you see we~,e gone from about $50.8 million of surplus to about $86
million of surplus. So that's over $30 million of additional surplus that can be used to offset deficits
elsewhere.
Let's take it a step further. We're going to assume that company management doesn't want to change
dividend scales every year. They want to do it every couple of years. Not surprisingly, when you
look at the after-tax NIER column in Table 6, you would assume that you would see that the results
for the scenario labeled +2-year lag, no excess lapses would be somewhere between a static dividend
scale and a fully dynamic dividend scale, but closer to the fully dynamic dividend scale. There is a
difference in the results.
The last sensitivity (Table 7) includes 5% excess lapses for each 10% decrease in the dividend scale
and that decrease is measured based on the prior year dividend that it calculates. If you compare it
to the base case, you'll see that in some scenarios results look better and in other scenarios they look
worse, specifically they look better in down scenarios and they look worse in the up scenarios. That's
probably a function of interest rates. That means our market values are going down and possibly
we're taking a capital loss hit for paying out these excess lapses. But the results are interesting when
you take a look at them.
Now on the annuity side we asked, what's right? Well in that case, I said it depends. Let's say I am
doing some sort of projecting of my participating whole life business. In this particular case, I think
what's right is the dividend mechanics that accurately reflect not only what your policyholders do but
also what your company is doing. It is important to spend a lot of time looking at the behavioral
aspects of the business that we're modeling. Purpose still dictates your model. You need to do a
windshield appraisal, and you must do it quickly. There just might not be time to figure out what the
excess lapses have been. Also the data might not be available to do that. But in situations where you
have information available that will allow you to capture not only policyholder behavior, but also
company behavior and the assumptions that you're using for projecting cash flows, I think it's the right
303

TABLE 6
Dynamic Dividends -- 5% Excess Lapses/10% Decrease Summary of Profits
~rio ~ for Modute Projection D~ripti~: ~e~rio Report Projection Node: ~ t Projection Date: 12/1995 Projection Cycies: 20 (Annual) Scale: 1,000 (except i t m mrked with ~*')
Present ValUe of Prof i ts at
Scenario Level Scecmrio Scenario Up 5Z Over 10 Years Scenario Ootm 5~ Over 10 Years Scerwrio Pop Up 3X Scenlrio Pep Oom 32 ScennrioLIpSZ Dmm5~ S c ~ r i o Do~nS~Up 5X
8~ IOZ 12~.
Page 8 XYZ Life insurance Co~:~y
08/08/96 16:r"18 ALFA 4.43 / VALACT1.A12 /
1 2 3 4
6 7 8 9
10
1 4,561.9 287.1 2 5,299.1 737.1 3 14,595.3 6,986.7 4 13,856.4 7,036.3 5 7,551.8 1,521.7 6 7,099.1 2,066.2 7 7,789.1 2,395.6 8 7,715.1 2,360.7 9 8 , ~ 4 , 4 2,818.3
10 7,887.7 4, ~?..4
Proftts Profi t l Prof i t s Prof i t s Prof i t$ Profi ts Prof i ts p Scan 1 Scan Z Scan 3 Scan 4 ScGm 5 Scan 6 Scan 7 High Lo~ p
. . . . . . . . o . . . . . . . . . . . . . . . . . . . . . . - . . . . . . . . . . . . . . . . . . . . . . . . * . . . . . . . . . . . . . . . . . . . . . . . . . . . . . . . . . . . . . . . . . . . . . . . . . . . . . . .
1 4,577.7 4,659.5 i*,489.0 5,035.3 4,032.2 4,738.9 4,400.9 5,035.3 4,032.2 1 2 5,360.3 5,592.4 5,107.8 6,485.0 3,998.8 5,812.4 4,736.8 6,485.0 3,998.8 2 3 12,738.7 10,799.5 14,690.9 7,448.7 29,770.8 8,920.0 17,798.4 29,770.8 7,448.7 3 4 10,428.2 7,682.0 15,478.9 7,678.0 25,419.9 7,446.7 22,861.2 25,419.9 7,446.7 4 5 7,734.6 7,127.2 9,477.6 8,029.8 4,185.6 8,123.2 8,184.7 9 , 4 7 " 7 . 6 4,185.6 5 6 7,344.4 7,655.6 7,187.1 8,428.1 2,220.3 8,876.1 7,982.3 8,876.1 2,220.3 6 7 9,305.8 8,303.4 7,133.2 8,917.2 2,207.3 9,261.7 9,394.8 9,394.8 2,207.3 7 8 7,964.4 8,578.7 9,436.3 9,042.5 2,052.4 8,842.9 8,088.3 9,436.3 2,052.4 8 9 7,935.9 9,989.1 10,711.3 9,177.7 1,687.6 8,840.5 9,718.9 10,711.3 1,687.6 9
10 10,152.9 10,629.7 13,973.4 9,051.5 1,553.3 8,339.1 1,514.0 13,973.4 1,514.0 10
p Nean Std Dev P . ° . . . . . . . . . . . . . . o o . . . . . . . . - -
71,188 62,592 55,526 91,392 76,702 66,195 57,746 94,964 66,612 60,168 54,621 81,681 76, 27~ 65,698 57,219 93,047 60,532 56,157 52,283 71,583 78,303 67,404 58,647 98,558 68,383 62,312 57,043 82,625
Aft Tax fIXER

TABLE 7
Dynamic Dividends -- Two-Year Lag - No Excess Lapses Summary of Profits
Scemrio Smmry for ModuLe Projection Description: Scenario Report Projection Node: Annual Projection Date: 12/1995 Projection CycLes: 20 (A;vaumi) ScaLe: 1,000 (except i tem marked with ' * ' )
Present Value of Prof i ts st
Scenario Lever Scdmsrio Scenario Up 5X Over 10 years Scenario O~m 5X Ovtr 10 Years Scenario Pop Up 3Z Scenario Pop Ooun ~1; Scenario Up 5X Dora 5X Scontrio Doon 5X Up 51;
Prof i ts Profits p Scenl Scon2
1 4,577.7 4,659.5 2 5,360.4 5,592.5 3 5,735.0 6,190.3 4 6,029.5 6,798.3 5 6,903.0 7,846.2 6 7 , 1 7 . 2 . 3 8,50.3.4 7 8,139.2 9,351.3 8 8,105.6 9,903.9 9 8,258.0 11,115.6
10 8,083.7 12,093.7
p Neon Std Oev
1 4,561.9 287.1 2 5,299.2 737.1 3 5,646.3 1,163.1 4 5,936.1 1,625.3 5 6,895.5 1,365.5 6 7,211.8 1,820.1 7 8,069.8 1/~.3.9 8 8 , 0 8 & . & 1,835.9 9 7,678.8 2,311.1
10 7,577.7 2,677.9
Page 8 XYZ Life Insurance Company
08/08/96 14-'~'20 ALFA 4.43 / VALACT1.A12 , /L
8~ log 12~ Aft Tax NIER
68,665 58,732 50,823 94,039 82,842 ?0,582 60,801 104,042 45,736 40,381 35,969 61,641 78,473 67,616 58,903 95,678 39,937 35,065 31,074 56,552 72,000 62,492 54,786 89,612 56,049 47, 708 41,137 83,530
Profi ts Profits Profi ts Profits Prof i ts Scen 3 Scen 4 Seen 5 Scen 6 Scen 7 High Low p
. . . . . . . . ° . . . . . . . . . * . . . . . . * . . . . . . . . . . . . * . . . . . . . . . . . ° . . . . . . . . . . * . . . . . . . . . . . . . . . . . . . . . . . .
4,489.0 5,035.3 4,032.2 4,738.9 4,400.9 5,035.3 4,032.2 I 5,107.9 6,485.1 3,998.9 5,812.5 4,736.9 6,485.1 3,998.9 2 5,159.7 7,461.5 3,765.0 6,628.9 4,583.8 7,461.5 3,765.0 3 5,042.9 8,331.3 3,504.1 7,549.9 4,297.0 8,331.3 3,504.1 4 5,709.7 8,394.3 5,466.8 8,768.9 5,179.6 8,768.9 5,179.6 5 5,543.4 9,065.5 5,364.9 9,868.2 5,015.2 9,868.2 5,015.2 6 6,918.5 9,152.7 5,960.7 10 ,224 .8 6,741.7 10 ,224 .8 5,960.7 7 6,486.2 9,525.6 5,571.1 10 ,619 .4 6,379.1 1 0 , 6 1 9 . 4 5,571.1 8 5,5?0.7 9,308.2 4,633.1 9,524.1 5,342.1 11,115.6 4,633.1 9 4,752.8 9,325.5 4,246.2 9,171.7 5,370.0 12,093.7 4,246.2 10
P ° .
1 2 3 4 5 6 7 8 9
10

1996 VALUATION ACTUARY SYMPOSIUM
thing to do and to take it into consideration. In this particular instance, our company in question was
using this information together with similar information for other lines of business. So it's possible
that reflecting or not reflecting company or policyholder behavior might mean the difference between
passing or failing a scenario.
So my words of wisdom are, in this particular case, the policyholder and company behavior are very
important. You're also modeling those in relation to the product features and your modeling
considerations must take into account your purpose and your constraints for what you're using your
models for. That concludes our prepared remarks at this point. We'd be happy to take any questions.
MR. M I C H A E L A. STEINMAN: If you're doing your cash-flow testing for a stock insurance
company, what do you do with the shareholder dividends? Do you include those or exclude those
when you're projecting what your surplus might be after ten or twenty years?
MS. RATAJCZAK: I think people have very different feelings about whether stockholder dividends
should or should not be included. I've been involved in a number of situations. In one case we do
reflect them and in another case the company just decided that we're not doing testing on surplus, so
we're not going to take those into consideration. So I've seen it done both ways and I think there are
very different feelings out there about what's right and what's not right. Sometimes I think certain
regulators have their own ideas about whether they should be included or not included, so whether
you include them or not might be a function of the states for which you are doing your cash-flow
testing.
MR. STEINMAN: Is there no general rule or guidelines; can anybody decide?
MR. MATEJA: My personal feeling is that you do not need to include stockholder dividends in
your cash-flow testing; however if you take this testing a step further and you get into dynamic
solvency testing, then it is appropriate to reflect those, but it also leads to the question of what's the
corporate behavior with respect to stockholder dividends. If something happened, and you weren't
306
LIABILITY MODELING H -- LIFE INSURANCE PRODUCTS
making money, would you drop your dividend? It's a big question and it's not a behavior that's very
easy to get a handle on.
MR. PlqIILLIP A. EISENBERG: Mike, you said that the top-down approach was useful because
you can get information fight away. I had a little difficulty understanding that. If you don't have the
cells developed or other information, what's the information you're getting right away?
MR. MURPItY: Well I would develop a plan or cell right away. I might have just a generic SPDA
cell or generic UL cell and start getting results. That way I can add corporate level assumptions at
the same time and get some preliminary results, and see that everything is getting put in place, as
opposed to a more conventional method where rve seen cells being built and they don't move up into
the plan level, into the population level, or into the corporate level for a long period of time.
MR, EISENBERG: How is that top-down approach just taking one segment?
MR, MURPHY: For a corporate level assumption, I might just build a generic UL policy and reflect
all the in-force business in that one UL generic policy for the time being, just to get things built out.
This isnk necessarily reflective of the model. It depends on what the purpose is. Like Meredith, I do
a lot of merger and acquisition type work and I want to get some preliminary results because time is
of the essence.
MR. MATEJA: I can add to that a little bit. I'll try to identify a few key blocks of business. For
example there's a lot of UL. It may be very obvious what the biggest UL plans are. Half the business
may be in only one of two plans. To get that big one modeled and see if there's any unusual features
of that, in terms of cash flows, can often be helpful in terms of getting some preliminary estimates of
value or patterns to income.
MR. JOHN CARL SAF: My question is, if you were modeling a large block of industrial life
insurance, that had extremely high lapse rates, let's say 80%, would you include new business or just
307

1996 VALUATION ACTUARY SYMPOSIUM
existing business when you're modeling that for cash-flow testing. Second, would you try to provide
an estimate of the liability cash-flow needs to your investment department?
MR. MURPHY: I'll take a shot at that. First pa~t was, would you include the new business for
cash-flow testing? I think the cash-flow testing regulation is fairly clear that you don't include new
business. So I would say the answer is you don't include new business. In terms of modeling to
provide some cash flows to your investment department, I think that could be done on a fairly
straightforward basis. I'd be real interested to know if you're experiencing that level of lapse rates
in the first year. What's the runoff in the business over the first few years. Is all that going out the
first month or the 12th month. I think that would be the most important thing to think about.
MR. M A T E J A : I'd just add that when modeling that sort of business, it depends on what your
purpose is. If you're modeling for a business plan, include new business. I'd also do sensitivity testing
to find out why I have an 80% lapse rate and how significant that is to my bottom line. Is there
anyway I can get that lapse rate lowered and dramatically leverage my profitability?
MS. R A T A J C Z A K : I'll just add a little bit to that too. If you're doing these projections for your
investment people to determine what the cash needs are by just looking at your existing business,
without taking into consideration new business (if there is, in fact, substantial new business), you
might not give them an accurate picture of what those cash-flow needs will be. That's especially true
if the new business has high commissions or something that they're going to have to take into
consideration when they go out to invest funds to cover that business.
MR, MAR TIN IL CLAIRE: Greg, you talked a little bit about doing what-if scenarios and Mike
was talking about the top-down approach. If your CFO gave you a call and said he wants the "what
if" scenarios, do you feel you would give him a simple model or do you feel the answer is to tell him,
"Tell me what you want run, and I'll give you an answer in a few days?"
MR. M A T E J A : It depends on the question. I can imagine questions that would require either
approach. Our models are run in a commercial software package. It is reasonably user friendly, but
308

LIABILITY MODELING H -- LIFE INSURANCE PRODUCTS
from what I know of our CFO, I don't think he likes to sit down at computers. I think he wants the
.results graphically, preferably in one graph. I think that the way I can do my job the best and help
him do his job the best, is to figure out the graph that gets him the information he wants and find out
what level of detail he needs. What is the question he's trying to answer and why is he trying to
answer it? Present the information in a way that helps him make the decision.
FROM TIW~ FLOOR: I agreed with Greg as far as what he was saying about having a consultant
build your model for you. I have just one thing to add to that. If you have someone else build your
model, you may not know what you have when they're done with it. For purposes of your case study,
you mapped everything into all male nonsmoker. When you're actually building models, do you
commonly also map everything into male nonsmoker?
MS. RATAJCZAK: No, but in a situation where I'm doing an appraisal and looking at a large block
of business, I would reflect smoker and nonsmoker and male and female differences in the model.
It's a function of the data that you can get your hands on and certainly smoker and nonsmoker
differences are important from a mortality standpoint. I wanted to keep the case study a little bit
simplistic, so I assumed only male nonsmoker.
MR. DONALD M. WALKER: In your case study for the annuity, you used an excess lapse
formula that recognized the surrender charge and the differences between the market rate and the
credited rate. In your case study for the participating whole life, you based excess lapse on reductions
in the dividend scale with no recognition of whether market conditions went down in the same way.
My question is, do you consider that to be a realistic assumption or one you simply made for the
purposes of the demonstration?
MS. RATAJCZAK: I think, in general terms, the interest-sensitive nature of a participating whole
life product is not the same as a single premium deferred annuity product. You're talking about two ,
different things. People buy annuities primarily for investment vehicles. People buy life insurance for
life insurance coverage. So while some people may put in a dynamic interest-sensitive lapse
assumption on life insurance business, you're probably going to see it be a much less significant driver
309

1996 V A L U A T I O N A C T U A R Y S Y M P O S I U M
of values than on the annuity side. Given the relationship between reserves and cash values, those
excess lapses may also give you counterintuitive results. But I think, in general, you're going to find
that on the life insurance side, at least for a product like this, the lapse sensitivity is just not going to
be as great as on the annuity side.
MR. W A L K E R : I also noted that the assumption did not provide for any excess lapses if you didn't
increase the dividend scale.
MS. R A T A J C Z A K : Another sensitivity I could have done is taken my static dividend scale and
assumed that it didn't change and assumed there were excess lapses. Once again, all the answers are
going to be positive, but you might see similar differences. It would be as if you took your dynamic
with no excess lapses and made it dynamic with excess lapses. So that's another case where another
sensitivity could have been added to the case study.
310