liberation from location: brazil
TRANSCRIPT
CONSUMERLAB
An Ericsson Consumer Insight Summary Report March 2015
Country report Brazil
Liberation from location
2 ERICSSON CONSUMERLAB LIBERATION FROM LOCATION BRAZIL
Ericsson ConsumerLab has 20 years’ experience of studying people’s behaviors and values, including the way they act and think about ICT products and services. Ericsson ConsumerLab provides unique insights on market and consumer trends.
Ericsson ConsumerLab gains its knowledge through a global consumer research program based on interviews with 100,000 individuals each year, in more than 40 countries and 15 megacities – statistically representing the views of 1.1 billion people.
contents FROM DUSK ‘TIL DAWN 3
LOCATION EQUATION 4
DEvICE AND SERvICE PICKS 6
CONNECTIvITy CALCULATIONS 7
Both quantitative and qualitative methods are used, and hundreds of hours are spent with consumers from different cultures. To be close to the market and consumers, Ericsson ConsumerLab has analysts in all regions where Ericsson is present, developing a thorough global understanding of the ICT market and business models.
All reports can be found at: www.ericsson.com/consumerlab
the voice of the consumer
METHODOLOGYThe data presented in this report was gathered from a total of 1,976 face-to-face and 1,027 online interviews conducted across 8 Brazilian metropolitan areas between February 6 and April 13, 2014. The metropolitan cities considered were: Belo Horizonte, Brasilia, Curitiba, Porto Alegre, Rio de Janeiro, Salvador and São Paulo.
The interviews were conducted with respondents aged between 15–69 and belonging to the socioeconomic classes A to D. Overall, the data represents 100 million people living in Brazil.
Key findings
ERICSSON CONSUMERLAB LIBERATION FROM LOCATION BRAZIL 3
FROM DUSK ‘TIL DAWN
From the marketplace to the boardroom, from schools to households, the free flow of ideas and information shapes our lives and our everyday decisions. Therefore, having access to relevant information at any given point in time and place has become integral for consumers
across the globe. Brazil is no different, where the population shows a high need for connectedness and being updated, and indulges in different online activities on their mobile devices.
Irrespective of location, Brazilians show a high need for connectedness
> Around 53 percent of consumers in Brazil rated the need to remain updated highly
Need for connectedness and pertinent information is a strong motivator in opting for cloud services
> 47 percent of consumers use cloud services to store and access their files, 38 percent of consumers pause watching a movie or Tv show on one device and resume it on another device and 37 percent automatically synchronize content in apps installed on multiple devices for personal use
Brazilians use multiple devices to access online services, often switching between devices to do so
> 63 percent of consumers switch between devices at least once when performing an online activity
Desktops have the highest household penetration level while smartphones take the lead on an individual level
> A greater proportion of smartphones are connected to the internet than both desktops and laptops
Satisfaction among consumers varies by locations
> More users in metros are satisfied compared to users in non-metros on parameters related to customer on boarding processes (initial set-up process, devices offered) and range of price plans
Once consumers start to use any type of internet connection, they are more likely to want to upgrade or improve on it
> 20 percent of 2G consumers want to upgrade to 4G while around 37 percent of 3G consumers want to do the same
Brazil’s population shows a high need for
connectedness
Irrespective of where they are, people want to have access to information at their convenience. Figure 1 highlights the expectations of Brazilians to be clued-in about things that affect them or are connected to their lives in some manner. Around 53 percent of consumers in Brazil rated the need to remain updated highly, compared to the Latin American average of 44 percent. Similarly, 49 percent of Brazilian consumers also rated the need for accessibility highly, compared to the Latin American average of 40 percent. This indicates that being connected and updated at all times is vital to Brazilian consumers.
The keenness to track updates, be informed and remain accessible and connected manifests itself in the way consumers use their mobile devices when indoors or outdoors. This is reflected in the fact that browsing, social networking, calls and messaging are among the top activities performed on any device, irrespective of location.
When indoors, there are more consumers who feel the need to remain connected with the online community; while when outdoors, remaining accessible takes precedence. Figure 2 shows that when indoors, browsing is the most performed activity at 89 percent, followed by calls (85 percent) and social networking (83 percent). Watching videos is also a popular activity performed indoors, at 83 percent. On the other hand, messaging and making calls are the most important activities when outdoors, with 43 percent and 39 percent of consumers performing these activities, respectively.
4 ERICSSON CONSUMERLAB LIBERATION FROM LOCATION BRAZIL
LOCATION EQUATION
Figure 1: Here and now attitudes
Figure 2: Activities on any device – indoor vs. outdoor
Source: Ericsson ConsumerLab, Liberation From Location, Brazil 2015Base: All users
Source: Ericsson ConsumerLab, Liberation From Location, Brazil 2015Base: Internet users
BEING UPDATED
53%
Indoor Outdoor
80% MESSAGING 43%MESSAGING
83% SOCIAL NETWORKING
SOCIAL NETWORKING 23%
85% CALLS CALLS 39%
37%MUSIC77% MUSIC
89% BROWSING BROWSING 25%
WORK/STUDy 10%70% WORK/STUDy
GAMES 13%57%
56%
GAMES
83% vIDEO vIDEO 8%
SHOPPING 5%SHOPPING
49%HIGH
ACCESSIBILITy
ERICSSON CONSUMERLAB LIBERATION FROM LOCATION BRAZIL 5
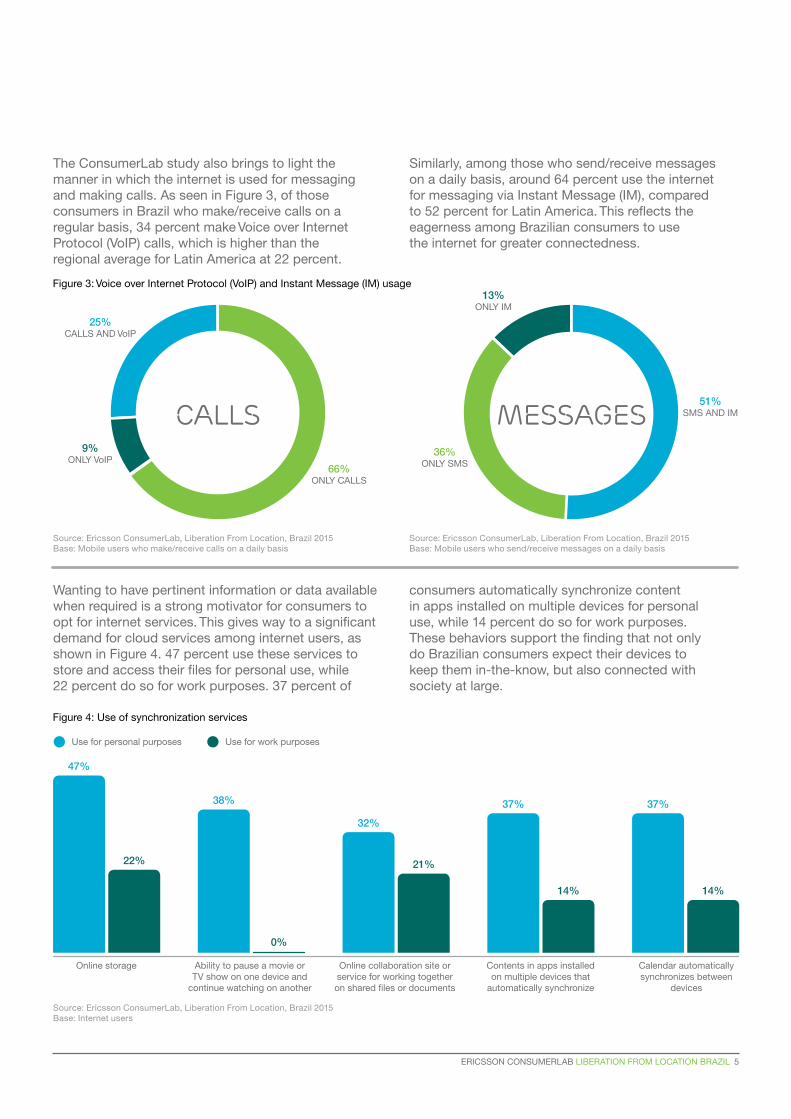
The ConsumerLab study also brings to light the manner in which the internet is used for messaging and making calls. As seen in Figure 3, of those consumers in Brazil who make/receive calls on a regular basis, 34 percent make voice over Internet Protocol (voIP) calls, which is higher than the regional average for Latin America at 22 percent.
Similarly, among those who send/receive messages on a daily basis, around 64 percent use the internet for messaging via Instant Message (IM), compared to 52 percent for Latin America. This reflects the eagerness among Brazilian consumers to use the internet for greater connectedness.
Wanting to have pertinent information or data available when required is a strong motivator for consumers to opt for internet services. This gives way to a significant demand for cloud services among internet users, as shown in Figure 4. 47 percent use these services to store and access their files for personal use, while 22 percent do so for work purposes. 37 percent of
consumers automatically synchronize content in apps installed on multiple devices for personal use, while 14 percent do so for work purposes. These behaviors support the finding that not only do Brazilian consumers expect their devices to keep them in-the-know, but also connected with society at large.
Figure 3: voice over Internet Protocol (voIP) and Instant Message (IM) usage
Figure 4: Use of synchronization services
Source: Ericsson ConsumerLab, Liberation From Location, Brazil 2015Base: Internet users
Source: Ericsson ConsumerLab, Liberation From Location, Brazil 2015Base: Mobile users who make/receive calls on a daily basis
Source: Ericsson ConsumerLab, Liberation From Location, Brazil 2015Base: Mobile users who send/receive messages on a daily basis
Use for personal purposes
CALLS MESSAGES
Use for work purposes
Online storage Ability to pause a movie or Tv show on one device and
continue watching on another
Online collaboration site or service for working together on shared files or documents
Contents in apps installed on multiple devices that
automatically synchronize
Calendar automatically synchronizes between
devices
47%
22% 21%
14% 14%
38%
0%
32%
37% 37%
13%ONLy IM
9%ONLy voIP
51%SMS AND IM
25%CALLS AND voIP
36%ONLy SMS66%
ONLy CALLS
6 ERICSSON CONSUMERLAB LIBERATION FROM LOCATION BRAZIL
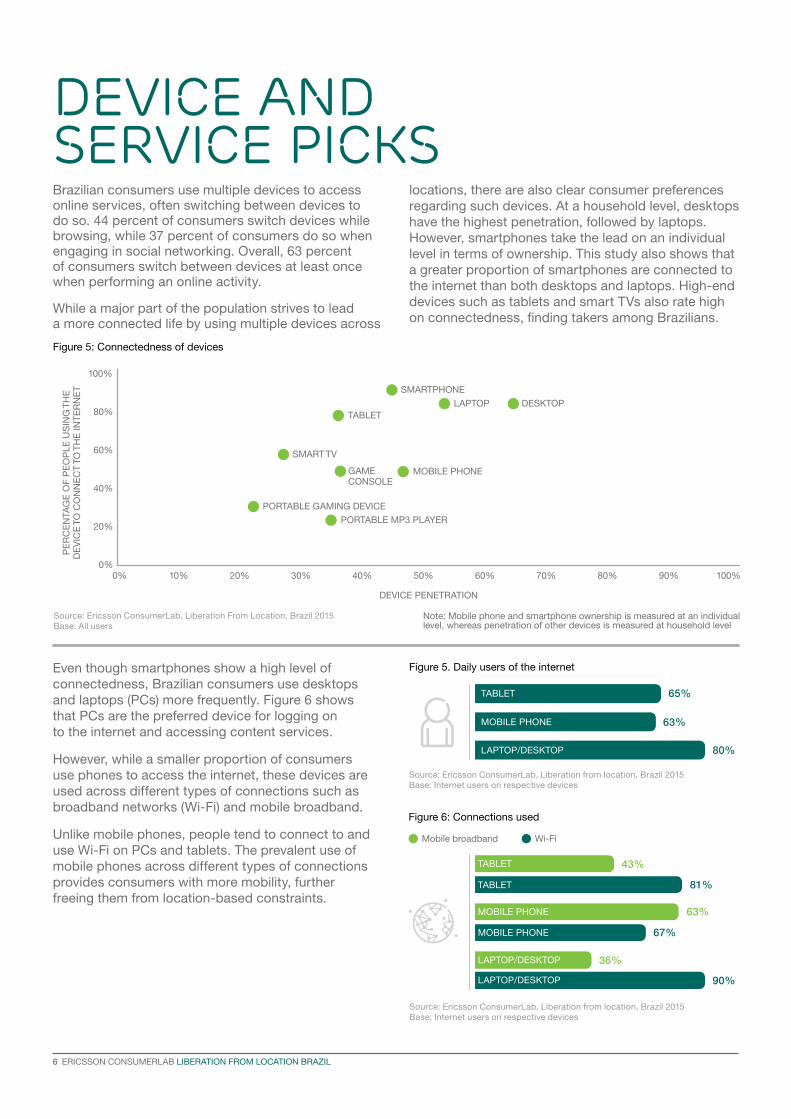
DEVICE AND SERVICE PICKSBrazilian consumers use multiple devices to access online services, often switching between devices to do so. 44 percent of consumers switch devices while browsing, while 37 percent of consumers do so when engaging in social networking. Overall, 63 percent of consumers switch between devices at least once when performing an online activity.
While a major part of the population strives to lead a more connected life by using multiple devices across
locations, there are also clear consumer preferences regarding such devices. At a household level, desktops have the highest penetration, followed by laptops. However, smartphones take the lead on an individual level in terms of ownership. This study also shows that a greater proportion of smartphones are connected to the internet than both desktops and laptops. High-end devices such as tablets and smart Tvs also rate high on connectedness, finding takers among Brazilians.
Even though smartphones show a high level of connectedness, Brazilian consumers use desktops and laptops (PCs) more frequently. Figure 6 shows that PCs are the preferred device for logging on to the internet and accessing content services.
However, while a smaller proportion of consumers use phones to access the internet, these devices are used across different types of connections such as broadband networks (Wi-Fi) and mobile broadband.
Unlike mobile phones, people tend to connect to and use Wi-Fi on PCs and tablets. The prevalent use of mobile phones across different types of connections provides consumers with more mobility, further freeing them from location-based constraints.
Figure 5: Connectedness of devices
Source: Ericsson ConsumerLab, Liberation From Location, Brazil 2015Base: All users
Note: Mobile phone and smartphone ownership is measured at an individual level, whereas penetration of other devices is measured at household level
0%0% 10% 20% 30% 40% 50% 60% 70% 80% 90% 100%
60%
20%
80%
40%
100%
LAPTOP
SMARTPHONE
GAME CONSOLE
PORTABLE GAMING DEvICE
PORTABLE MP3 PLAyER
MOBILE PHONE
TABLET
SMART Tv
DEvICE PENETRATION
PE
RC
EN
TAG
E O
F P
EO
PLE
US
ING
TH
E
DE
vIC
E T
O C
ON
NE
CT
TO
TH
E IN
TE
RN
ET
DESKTOP
Figure 6: Connections used
LAPTOP/DESKTOP
LAPTOP/DESKTOP
36%
90%
MOBILE PHONE
MOBILE PHONE
63%
67%
Source: Ericsson ConsumerLab, Liberation from location, Brazil 2015 Base: Internet users on respective devices
Mobile broadband Wi-Fi
Figure 5. Daily users of the internet
LAPTOP/DESKTOP
MOBILE PHONE
TABLET
63%
80%
Source: Ericsson ConsumerLab, Liberation from location, Brazil 2015 Base: Internet users on respective devices
65%
TABLET
TABLET
43%
81%
ERICSSON CONSUMERLAB LIBERATION FROM LOCATION BRAZIL 7
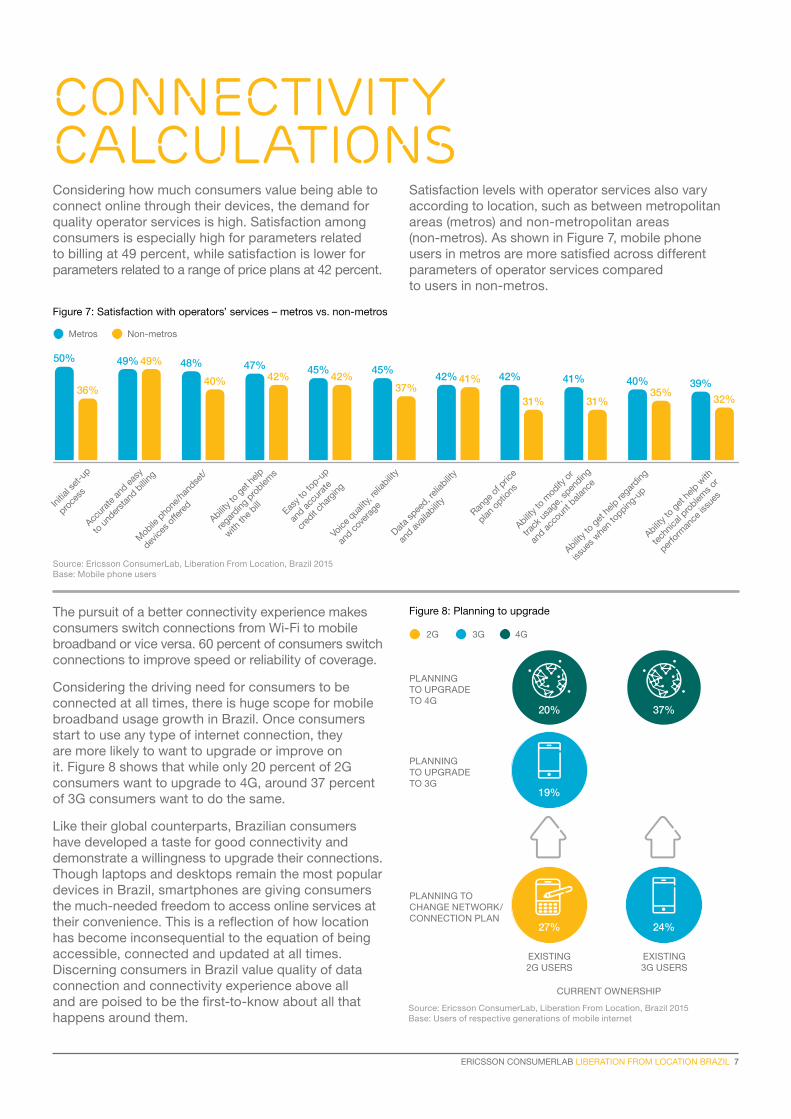
Considering how much consumers value being able to connect online through their devices, the demand for quality operator services is high. Satisfaction among consumers is especially high for parameters related to billing at 49 percent, while satisfaction is lower for parameters related to a range of price plans at 42 percent.
Satisfaction levels with operator services also vary according to location, such as between metropolitan areas (metros) and non-metropolitan areas (non-metros). As shown in Figure 7, mobile phone users in metros are more satisfied across different parameters of operator services compared to users in non-metros.
Figure 7: Satisfaction with operators’ services – metros vs. non-metros
Connectivity Calculations
Metros Non-metros
50% 49% 48% 47% 45% 45%42%
39%40%41%42%36%
49%
40% 42% 42%37%
41%
32%35%
31%31%
The pursuit of a better connectivity experience makes consumers switch connections from Wi-Fi to mobile broadband or vice versa. 60 percent of consumers switch connections to improve speed or reliability of coverage.
Considering the driving need for consumers to be connected at all times, there is huge scope for mobile broadband usage growth in Brazil. Once consumers start to use any type of internet connection, they are more likely to want to upgrade or improve on it. Figure 8 shows that while only 20 percent of 2G consumers want to upgrade to 4G, around 37 percent of 3G consumers want to do the same.
Like their global counterparts, Brazilian consumers have developed a taste for good connectivity and demonstrate a willingness to upgrade their connections. Though laptops and desktops remain the most popular devices in Brazil, smartphones are giving consumers the much-needed freedom to access online services at their convenience. This is a reflection of how location has become inconsequential to the equation of being accessible, connected and updated at all times. Discerning consumers in Brazil value quality of data connection and connectivity experience above all and are poised to be the first-to-know about all that happens around them.
Figure 8: Planning to upgrade
Source: Ericsson ConsumerLab, Liberation From Location, Brazil 2015Base: Users of respective generations of mobile internet
2G 3G 4G
CURRENT OWNERSHIP
PLANNING TO UPGRADE TO 4G
PLANNING TO UPGRADE TO 3G
PLANNING TO CHANGE NETWORK/ CONNECTION PLAN
ExISTING 3G USERS
ExISTING 2G USERS
24%
37%
27%
19%
20%
Initia
l set
-up
proc
ess
Accur
ate
and
easy
to u
nder
stan
d bi
lling
Data
spee
d, re
liabi
lity
and
avail
abilit
y
Ability
to g
et h
elp
rega
rding
pro
blem
s
with th
e bi
llEas
y to
top-
up
and
accu
rate
cred
it ch
argin
g
Range
of p
rice
plan
opt
ions
Ability
to m
odify
or
track
usa
ge, s
pend
ing
and
acco
unt b
alanc
e
Ability
to g
et h
elp re
gard
ing
issue
s whe
n to
pping
-up
Ability
to g
et h
elp w
ith
tech
nical
prob
lems o
r
perfo
rman
ce is
sues
voice
qua
lity, r
eliab
ility
and
cove
rage
Mob
ile p
hone
/han
dset
/
devic
es o
ffere
d
Source: Ericsson ConsumerLab, Liberation From Location, Brazil 2015Base: Mobile phone users
EDB-15:000811© Ericsson AB 2015
EricssonSE-126 25 Stockholm, Sweden Telephone +46 10 719 00 00 www.ericsson.com
The content of this document is subject to revision withoutnotice due to continued progress in methodology, design andmanufacturing. Ericsson shall have no liability for any error ordamage of any kind resulting from the use of this document.
Ericsson is the driving force behind the Networked Society – a world leader in communications technology and services. Our long-term relationships with every major telecom operator in the world allow people, business and society to fulfill their potential and create a more sustainable future.
Our services, software and infrastructure – especially in mobility, broadband and the cloud – are enabling the telecom industry and other sectors to do better business, increase efficiency, improve the user experience and capture new opportunities.
With approximately 115,000 professionals and customers in 180 countries, we combine global scale with technology and services leadership. We support networks that connect more than 2.5 billion subscribers. Forty percent of the world’s mobile traffic is carried over Ericsson networks. And our investments in research and development ensure that our solutions – and our customers – stay in front.
Founded in 1876, Ericsson has its headquarters in Stockholm, Sweden. Net sales in 2014 were SEK 228.0 billion (USD 33.1 billion). Ericsson is listed on NASDAQ OMx stock exchange in Stockholm and the NASDAQ in New york.