liberia teacher training program2ne1nx2xnm9m19ykgy20xpt8-wpengine.netdna-ssl.com/... · education...
TRANSCRIPT
1
Emmanuel Morris, Oscar Goyee, Rachel Hatch, Delwlebo Tuowal,
Noor Ansari & Mark Ginsburg
LTTP Monitoring, Evaluation and Research Team
February 26, 2015
This publication is produced for review by the United States Agency for International
Development. It was prepared by FHI 360.
This Report was made possible by the generous support of the American people through the
United States Agency for International Development (USAID). The contents are the responsibility of the
Liberia Teacher Training Program II and do not necessarily reflect the views of USAID or the United States
Government.
Liberia Teacher Training Program
Tracer Study of Female Scholarship Recipients
October 01– December 31 2011
(DRAFT)

2
Acronyms
DEO District Education Officer
Emp. Employment
Grad. Graduate
IRB Institutional Review Board
LTTP Liberia Teacher Training Program
MER Monitoring, Evaluation & Research
MCSS Monrovia Consolidated School System
MoE Ministry of Education
EMIS Education Management Information System
USAID United States Agency for International Development

3
Table of Contents Acronyms ...................................................................................................................................................... 2
Executive summary ....................................................................................................................................... 4
Background ................................................................................................................................................... 5
Objectives of the study ................................................................................................................................. 5
Methodology ................................................................................................................................................. 6
Findings ......................................................................................................................................................... 6
Employment status and types of employment of graduates interviewed ............................................... 7
Table 1: Employment status of graduates ............................................................................................ 7
Table 2: Graduates’ employment category .......................................................................................... 8
Table 3: 2012 Graduates Employment Status Before & After Graduation: .......................................... 9
Table 4: 2013 Graduates Employment Status Before & After Graduation ........................................... 9
Reasons for unemployment and challenges in the job-seeking process ................................................ 10
Table 5: Reported reasons why graduates have not found a job in the education sector ................. 10
Preparation for employment in education ............................................................................................. 11
Table 6: 2012 Graduates responses as per course contents outlined ................................................ 12
Table 7: 2013 Graduates responses as per course contents outlined ................................................ 12
Employed graduates areas of specialization:.......................................................................................... 13
Table 8: Program and major areas of focus of graduates currently employed .................................. 13
Conclusion ................................................................................................................................................... 13
References .................................................................................................................................................. 15
Annex .......................................................................................................................................................... 16
4
Executive summary
In this research study, the Monitoring, Evaluation, and Research (MER) department of the USAID/Liberia Teacher Training Program II (LTTP) looks at females who graduated in 2012 and 2013 from the Teachers College at the University of Liberia and had received LTTP scholarships to support their education. The research study followed up with these graduates to find out to what extent they have been employed as teachers in public or private primary or secondary schools and in the education sector more generally. The study also collected information on the challenges that graduates faced in seeking employment especially those that confirmed of been unemployed and on how well their university training prepared graduates for their professional roles.
A total of thirty-one (31) graduates were interviewed during this study. Of these thirty-one graduates, twenty-two confirmed being employed in the education sector, while nine reported being unemployed. Eight of the nine who reported not being employed were all 2013 graduates, while the remaining one person is from the 2012 graduates. Those graduates who are employed in the education sector reported that they work in a variety of roles, including as private school teachers and administrators (e.g., as principals, vice principals, and registrars), public school teachers, District Education Officers (DEOs), and trainers. Most of the employed graduates obtained their employment and high profile education sector jobs (DEOs, trainers, & school administrators) either in their final year or after graduation from the program.
The nine graduates who were unemployed at the time of the interviews reported various reasons for their unemployment. These reasons included:
Being on stand-by for employment and waiting for a position from the MoE
Applied for jobs but hadn’t received a response
Getting a job requires bribery, nepotism, or other corrupt measures
MoE promised to employ us, but also advised to seek other opportunities
No job openings in the education sector at all
MoE suspended the hiring of new teachers or staff
Positions being recruited for were in places they did not want to work
In addition to the employment status of graduates, the study also investigated how well certain university courses prepared them for their work roles. Overall, graduates felt that their coursework prepared them well or moderately well for their professional roles. Graduates felt particularly positive about the role that three aspects of their undergraduate degree program played in preparing them for their professional roles: a) Practice Teaching, b) Instructional Materials for Teaching course, and c) Guidance course. This study also revealed that of the graduates who confirmed having been employed in the education sector, more than half focused their degree at the University of Liberia on primary education while the rest focused on secondary education.
In sum, the study showed that the majority of scholarship recipients successfully joined the education sector after graduation, but that some graduates, particularly some 2013 graduates, were unable to find education jobs at all or under circumstances they deemed acceptable. Of those who did gain employment in education, the graduates felt that their training at the University of Liberia prepared them at least to some extent for the responsibilities they have as educators.

5
Background
In Liberia’s current teaching force, females are severely under-represented at all school levels, from primary school to university. For example, females constituted only 12.0% of public primary school teachers in 2013, with the percentage at the county level varying from a mere 3.9% in River Cess to 36.5% in the Monrovia Consolidated School System (MCSS) (MoE Statistics for the Republic of Liberia, 2013, p. 15). At the secondary level, only 4.5% of public secondary school teachers were women in 2013, with the percentage of female teachers ranging from 0.0% in River Cess to 10.9% in MCSS (MoE Statistics for the Republic of Liberia, 2013, p. 22).
Some of the factors contributing to this situation include low retention of females at primary and secondary school levels and limited funding support for attendance at universities, both which restrict the pool of females who can enter rural teacher training institutes (RTIs) or universities to train to become teachers. To some extent, female education was not be encouraged in some families in Liberia because they may perceived a girl’s education as contributing to another family wealth, since a girl joins another family when she gets married.
To address the shortage of female teachers and as part of capacity-building efforts within the education system, the USAID/Liberia Teacher Training Program II (LTTP) began to provide scholarships in 2011 to 140 female undergraduate students attending the Teachers College at the University of Liberia and Tubman University. The goal of providing scholarships was for female beneficiaries to join the public teaching force upon completion of their university studies.
This study examined the extent to which this goal was reached by investigating whether female scholarship recipients who graduated from the Teachers College at the University of Liberia in 2012 and 2013 ultimately found jobs in the education sector after graduation. The study also investigated the employment-seeking experiences of graduates who are unemployed. Finally, the study also collected graduates’ perceptions of how well their courses and other degree program experiences prepared them to be effective educators.
Objectives of the study
This study investigated the extent to which 2012 and 2013 graduates were employed as teachers in public primary or secondary schools or in other roles in the education system and also examines as to whether those graduates who gained employment did so before or after their completion of the program at the university. For unemployed graduates, the study then looked at the challenges they faced when seeking a job. For employed graduates, the study examined graduates’ perceptions of how well their training at the University of Liberia prepared them to be effective educators. More specifically, the study is designed to answer the following questions:
1. What are the percentages of 2012 and 2013 female education graduates who received LTTP/USAID-provided scholarships who are employed as:
a. Preschool, primary, or secondary school teachers in government schools? b. Preschool, primary, or secondary school teachers in non-government schools? c. School administrators (e.g., registrars, vice principals, or principals) in government
schools?
6
d. School administrators (e.g., registrars, vice principals, or principals) in non-government schools?
e. Other types of workers (either in or outside the education sector)? 2. What facilitated or inhibited these graduates in obtaining various types of employment? 3. In what respects do the graduates who obtained employment in the education sector
perceive that their undergraduate program did or did not prepare them well for their work roles?
This report presents and discusses the findings related to each of these research questions.
Methodology
To conduct this research study, LTTP’s Technical Officers Monitoring, Evaluation, and Research (MER) collected data from thirty-one (31) 2012 and 2013 female graduates who received USAID/LTTP-provided scholarships. Data was collected via telephone-based interviews. The MER Team used tablets to capture the responses of interviewees. Any beneficiary (scholarship recipient) who has completed his/her required courses as per the curriculum was qualified for to be sampled for this study. Scholarships were awarded to one hundred and forty (140) female students at the University of Liberia and the Tubman University. And of this number, a total of thirty-nine (39) persons from both 2012 and 2013 classes were confirmed of graduation, and of this number, thirty-one (31) were contacted and were interviewed during the study; eight (8) persons could not be reached due to unavailability of recent contact numbers for seven of them, who were believed to be still in Liberia, and one person had travelled out of the country, according to her colleague.
The full questionnaire developed for the interviews included a combination of close-ended and open-ended questions on employment status in the education sector, on the process of seeking employment in education, and on the quality of preparation for work in the education system that they received during their university training. The questionnaire (see the Annex) yielded both quantitative and qualitative information on participants. Prior to conducting the study, the questionnaire was piloted using some of the scholarship beneficiaries (50 persons, 25 graduates & 25 those still in school) to see its level of efficiency and accuracy. In addition, the study’s design and data collection tools were shared with FHI 360’s Protection of Human Subjects Committee and the Institutional Review Board of the University of Liberia for approval.
Following data collection, the quantitative data obtained from responses of graduates were analyzed using the Microsoft Office Excel to calculate percentages of those responding to specific issues and questions. The qualitative data from open-ended questions were also analyzed to identify key themes.
Findings
This section of the report summarizes the findings from interviews with scholarship beneficiaries. First, we look at the employment status of graduates who received scholarships, noting that, overall, the majority of graduates found employment in the education sector but that 2012 graduates had greater success finding employment than 2013 graduates. It is also revealed that most of the graduates (2012 & 2013) got employment either during their final year or after graduation from the
7
program. Then, we focus on those graduates who were not able to find employment in the education sector and discuss the obstacles they reported facing in their job search. Finally, we consider graduates who are employed, looking at what they specialized in at the University of Liberia and how well they felt that their coursework and other program experiences prepared them for their professional roles in education.
Employment status and types of employment of graduates interviewed
Table 1 identifies the employment status of 2012 and 2013 graduates who received scholarships from LTTP. As indicated in Table 1, 71% of the graduates are employed, while 29% are not employed or have not yet received any confirmed teaching or any other assignment in the education sector. However, the employment rates are very different for 2012 versus 2013 graduates. Indeed, significant number or twelve of thirteen (92.3%) 2012 graduates interviewed are employed, while ten out of the eighteen (55.6%) of 2013 graduates are employed, suggesting that 2013 graduates may have graduated during a period when it was more challenging to find employment in the education sector or that gaining employment can take an extended period of time.
Table 1: Employment status of graduates
2012
graduates 2013
graduates Total
graduates
# % # % # %
Number of graduates who reported being employed 12 92.3% 10 55.6% 22 71%
Number of graduates who reported being unemployed 1 7.7% 8 44.4% 9 29%
Total 13 100% 18 100 % 31 100%
As Table 2 shows, graduates work in a range of positions, including as teachers, school administrators (principals, vice principals, and registrars), District Education Officers (DEOs), and trainers.
Interestingly, graduates most commonly worked not as teachers but as school administrators. Of 22 employed graduates, 9 (just over 40%) held administrative positions in preschools, primary schools, or secondary schools, though graduates worked as administrators only in private schools. Both 2012 and 2013 graduates held positions as school administrators. Overall, 5 out of 9 (56%) graduates with administrative positions were performing this role in primary schools. Two graduates reported working as preschool administrators, while two graduates reported working as secondary school administrators.
The second most common type of position held among graduates was that of teacher: 7 of 22 or 31.8% of graduates who reported employment work as teachers. While both public and private teaching positions were reported, more graduates work as private sector teachers. Indeed 5 of the 7 graduates employed as teachers work in the private sector. Of the 7 graduates who reported employment as teachers, 3 work as primary school teachers (all in the private sector) and 4 work as secondary school teachers (2 in private schools and 2 in public schools).
Graduates also reported employment in a range of other positions in the education system, including 2 as DEOs, 1 as a teaching assistant at the university level, 2 as trainers, and another employed in an
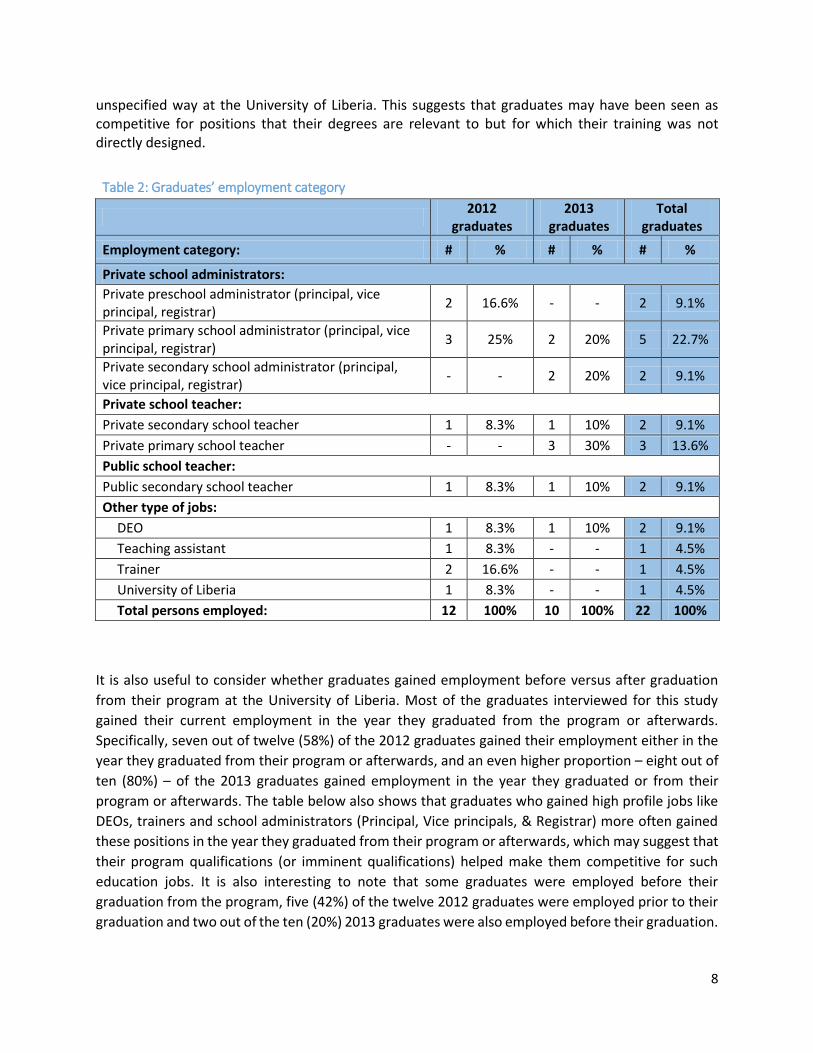
8
unspecified way at the University of Liberia. This suggests that graduates may have been seen as competitive for positions that their degrees are relevant to but for which their training was not directly designed.
Table 2: Graduates’ employment category
2012
graduates 2013
graduates Total
graduates
Employment category: # % # % # %
Private school administrators:
Private preschool administrator (principal, vice principal, registrar)
2 16.6% - - 2 9.1%
Private primary school administrator (principal, vice principal, registrar)
3 25% 2 20% 5 22.7%
Private secondary school administrator (principal, vice principal, registrar)
- - 2 20% 2 9.1%
Private school teacher:
Private secondary school teacher 1 8.3% 1 10% 2 9.1%
Private primary school teacher - - 3 30% 3 13.6%
Public school teacher:
Public secondary school teacher 1 8.3% 1 10% 2 9.1%
Other type of jobs:
DEO 1 8.3% 1 10% 2 9.1%
Teaching assistant 1 8.3% - - 1 4.5%
Trainer 2 16.6% - - 1 4.5%
University of Liberia 1 8.3% - - 1 4.5%
Total persons employed: 12 100% 10 100% 22 100%
It is also useful to consider whether graduates gained employment before versus after graduation
from their program at the University of Liberia. Most of the graduates interviewed for this study
gained their current employment in the year they graduated from the program or afterwards.
Specifically, seven out of twelve (58%) of the 2012 graduates gained their employment either in the
year they graduated from their program or afterwards, and an even higher proportion – eight out of
ten (80%) – of the 2013 graduates gained employment in the year they graduated or from their
program or afterwards. The table below also shows that graduates who gained high profile jobs like
DEOs, trainers and school administrators (Principal, Vice principals, & Registrar) more often gained
these positions in the year they graduated from their program or afterwards, which may suggest that
their program qualifications (or imminent qualifications) helped make them competitive for such
education jobs. It is also interesting to note that some graduates were employed before their
graduation from the program, five (42%) of the twelve 2012 graduates were employed prior to their
graduation and two out of the ten (20%) 2013 graduates were also employed before their graduation.
9
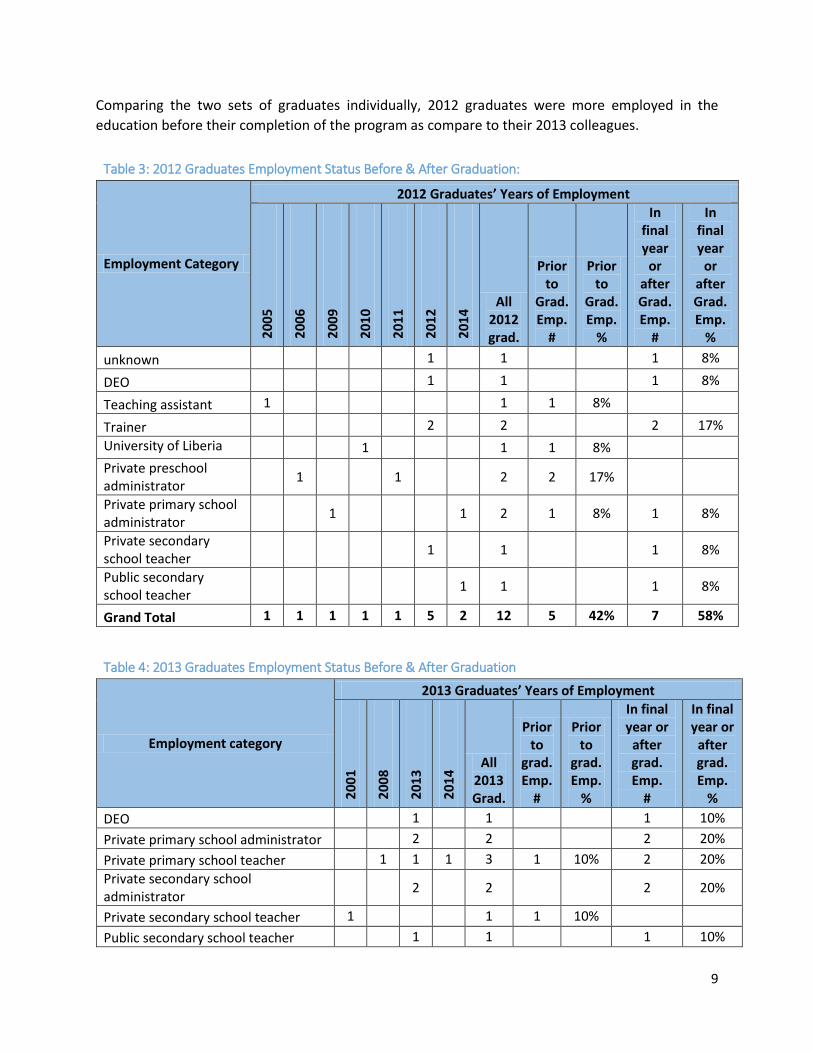
Comparing the two sets of graduates individually, 2012 graduates were more employed in the
education before their completion of the program as compare to their 2013 colleagues.
Table 3: 2012 Graduates Employment Status Before & After Graduation:
Employment Category
2012 Graduates’ Years of Employment
20
05
20
06
20
09
20
10
20
11
20
12
20
14
All 2012 grad.
Prior to
Grad. Emp.
#
Prior to
Grad. Emp.
%
In final year
or after Grad. Emp.
#
In final year
or after Grad. Emp.
%
unknown 1 1 1 8%
DEO 1 1 1 8%
Teaching assistant 1 1 1 8%
Trainer 2 2 2 17%
University of Liberia 1 1 1 8%
Private preschool administrator
1 1 2 2 17%
Private primary school administrator
1 1 2 1 8% 1 8%
Private secondary school teacher
1 1 1 8%
Public secondary school teacher
1 1 1 8%
Grand Total 1 1 1 1 1 5 2 12 5 42% 7 58%
Table 4: 2013 Graduates Employment Status Before & After Graduation
Employment category
2013 Graduates’ Years of Employment
200
1
200
8
201
3
201
4 All
2013 Grad.
Prior to
grad. Emp.
#
Prior to
grad. Emp.
%
In final year or
after grad. Emp.
#
In final year or
after grad. Emp.
%
DEO 1 1 1 10%
Private primary school administrator 2 2 2 20%
Private primary school teacher 1 1 1 3 1 10% 2 20%
Private secondary school administrator
2 2 2 20%
Private secondary school teacher 1 1 1 10%
Public secondary school teacher 1 1 1 10%
10
Grand Total 1 1 7 1 10 2 20% 8 80%
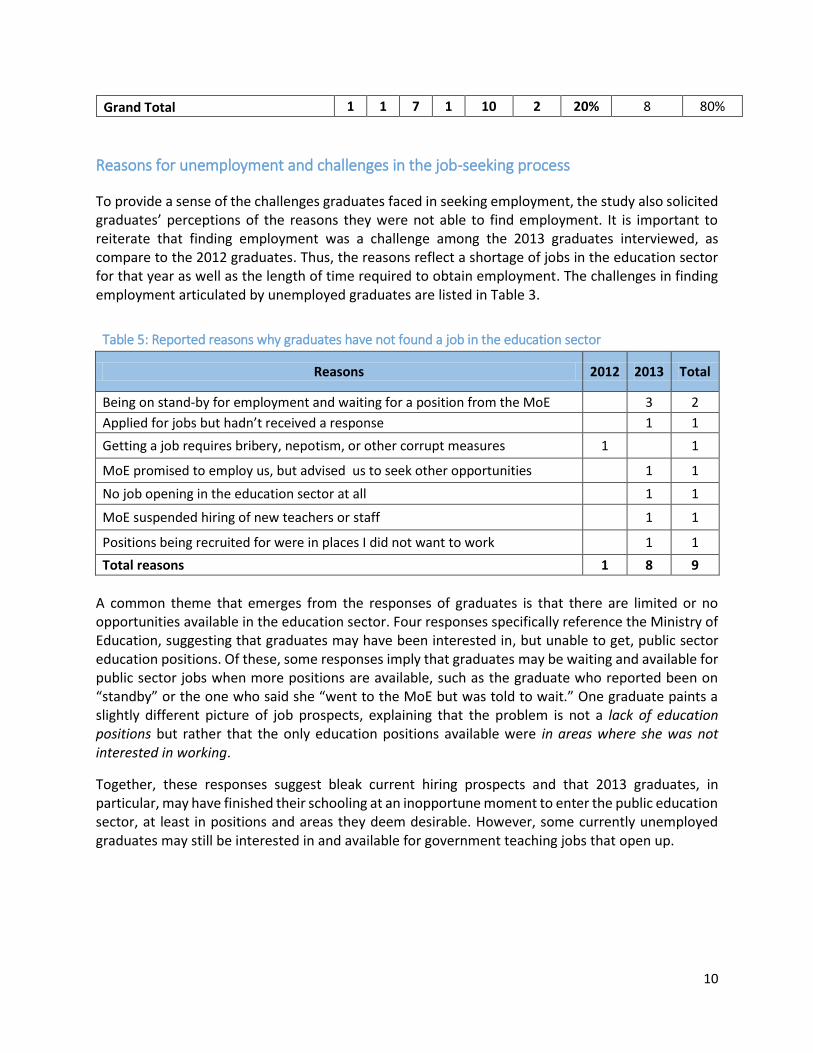
Reasons for unemployment and challenges in the job-seeking process
To provide a sense of the challenges graduates faced in seeking employment, the study also solicited graduates’ perceptions of the reasons they were not able to find employment. It is important to reiterate that finding employment was a challenge among the 2013 graduates interviewed, as compare to the 2012 graduates. Thus, the reasons reflect a shortage of jobs in the education sector for that year as well as the length of time required to obtain employment. The challenges in finding employment articulated by unemployed graduates are listed in Table 3.
Table 5: Reported reasons why graduates have not found a job in the education sector
Reasons 2012 2013 Total
Being on stand-by for employment and waiting for a position from the MoE 3 2
Applied for jobs but hadn’t received a response 1 1
Getting a job requires bribery, nepotism, or other corrupt measures 1 1
MoE promised to employ us, but advised us to seek other opportunities 1 1
No job opening in the education sector at all 1 1
MoE suspended hiring of new teachers or staff 1 1
Positions being recruited for were in places I did not want to work 1 1
Total reasons 1 8 9
A common theme that emerges from the responses of graduates is that there are limited or no opportunities available in the education sector. Four responses specifically reference the Ministry of Education, suggesting that graduates may have been interested in, but unable to get, public sector education positions. Of these, some responses imply that graduates may be waiting and available for public sector jobs when more positions are available, such as the graduate who reported been on “standby” or the one who said she “went to the MoE but was told to wait.” One graduate paints a slightly different picture of job prospects, explaining that the problem is not a lack of education positions but rather that the only education positions available were in areas where she was not interested in working.
Together, these responses suggest bleak current hiring prospects and that 2013 graduates, in particular, may have finished their schooling at an inopportune moment to enter the public education sector, at least in positions and areas they deem desirable. However, some currently unemployed graduates may still be interested in and available for government teaching jobs that open up.

11
Preparation for employment in education
In addition to following up on graduates’ employment status and on challenges that unemployed graduates faced in seeking a job, this study examined the extent to which the graduates who are employed in the education sector as teachers, school administrators, trainers, and district education officers were prepared for their work roles during their degree programs at university. First, this section looks at how well graduates felt certain course material that was part of the curriculum at the University of Liberia prepared them for their positions. Then, this section reports on the program specializations of graduates.
Tables 6 and 7 (below) report on graduates’ perceptions of how their coursework and other degree program experiences (i.e., practice teaching) prepared them for their jobs. Of the 22 graduates currently employed, each graduate was asked to consider eight education courses they took at the University of Liberia and to report how well these courses prepared them for their current education roles. The respondents rated the courses and practice teaching on a four-point scale that ranged from “not at all” to “to a great extent.” Table 6 reports the ratings from 2012 graduates, while Table 7 reports the ratings from 2013 graduates.
The responses from both the 2012 and 2013 graduates attest that currently-employed graduates had positive impressions of their training. Indeed, looking at average perceptions across all courses, 67% of currently-employed 2012 graduates felt their training had prepared them “to a greater extent” (the highest rating) and 25% felt it had prepared them “to a moderate extent” (the second highest rating). Of currently-employed 2013 graduates, 70% felt their training had prepared them “to a greater extent” and 19% felt it had prepared them “to a moderate extent.”
Looking at specific courses, among both 2012 and 2013 graduates the same three elements (practice teaching, instruction materials for testing, & guidance) of their degree program received the highest percentage of responses under the most positive rating category: 1) Practice Teaching, which 92% of 2012 and 100% of 2013 graduates felt had prepared them “to a greater extent” for their work; 2) Instructional Materials for Testing course, which 83% of 2012 graduates and 80% of 2013 graduates felt had prepared them “to a greater extent;” and 3) Guidance course, which 83% of 2012 graduates and 80% of 2013 graduates felt had prepared them “to a greater extent.”
While ratings were favorable overall—at least 70% of ratings were in the top two rating categories among both 2012 and 2013 graduates for any course, some courses received negative ratings from some graduates. Among currently employed 2012 graduates, the three courses that received the most negative ratings were Curriculum Innovation and Methodology I, Curriculum Innovation and Methodology II, and School Administration. For all three of these courses, 17% of responses fell under the two categories that indicated negative perceptions of a course (“not at all” and “to a limited extent”). The 2013 graduates gave their most negative ratings to two of these courses, Curriculum Innovation and Methodology I and Curriculum Innovation and Methodology II, where 20%-30% of responses fell under the two categories suggesting negative perceptions.

12
Table 6: 2012 Graduates responses as per course contents outlined
Courses
2012
Not at all To a
limited extent
To a moderate
extent
To a greater extent
Total
# % # % # % # % #
Educational Psychology 0 0% 0 0% 3 25% 9 75% 12
Testing and Evaluation 0 0% 0 0% 5 42% 7 58% 12
Curriculum Innovation and Methodology I
1 8.3% 1 8% 6 50% 4 33% 12
Curriculum Innovation and Methodology II
1 8.3% 1 8% 5 42% 5 42% 12
Guidance 0 0% 1 8% 1 8% 10 83% 12
School Administration 0 0% 2 17% 2 17% 8 67% 12
Instructional Materials for Testing
0 0% 1 8% 1 8% 10 83% 12
Practice Teaching 0 0% 0 0% 1 8% 11 92% 12
Total 2 2.1% 6 6% 24 25% 64 67% 96
Table 7: 2013 Graduates responses as per course contents outlined
Courses
2013
Not at all To a
limited extent
To a moderate
extent
To a greater extent
Total
# % # % # % # %
Educational Psychology 0 0% 2 20% 1 10% 7 70% 10
Testing and Evaluation 0 0% 0 0% 3 30% 7 70% 10
Curriculum Innovation and Methodology I
1 10% 1 10% 3 30% 5 50% 10
Curriculum Innovation and Methodology II
1 10% 2 20% 2 20% 5 50% 10
Guidance 0 0% 0 0% 2 20% 8 80% 10
School Administration 0 0% 1 10% 3 30% 6 60% 10
Instructional Materials for Testing
0 0% 1 10% 1 10% 8 80% 10
Practice Teaching 0 0% 0 0% 0 0% 10 100% 10
Total 2 3% 7 9% 15 19% 56 70% 80

13
Employed graduates areas of specialization:
Turning to the degree specializations of scholarship recipients, Table 8 presents the percentages of currently-employed graduates according to their specializations in primary or secondary education. The table shows that 6 of 22 graduates specialized in secondary education. As noted earlier in the report, those same numbers are now working in secondary education, either as teachers or administrators. The majority of currently-employed graduates specialized in primary education (16 of 22 or 73%). Yet, as shown earlier in the findings, only 36% of graduates currently working in education are employed in primary schools as teachers or administrators. This discrepancy between specializations and employment is expected given that several graduates are employed outside of schools as DEOs or at universities. Also, regardless of whether graduates ended up working in their specialization, the majority of graduates reported feeling well-prepared or at least moderately well-prepared for their roles.
Table 8: Program and major areas of focus of graduates currently employed
Program and Major Areas 2012 2013 Total
# % # % # %
Primary Education 8 66.6% 8 80% 16 72.7%
Language Arts and Social Studies 8 66.6% 6 60% 14 63.6%
Mathematics and Science 2 20% 2 9.1%
Secondary Education 4 33.3% 2 20% 6 27.3%
Business Education 1 8.3% 1 10% 2 9.1%
General Education 3 25% 1 10% 4 18.2%
Total 12 10 22
Conclusion
This study followed up on 2012 and 2013 graduates who received scholarships to attend the Teachers College at the University of Liberia. Of all graduates who received LTTP/USAID scholarships and confirmed of completion of the program at the University of Liberia, 31 scholarship recipients were interviewed during the study, which considered the employment status of these graduates, the challenges that unemployed graduates faced in seeking education sector employment, and how well their university training prepared currently employed graduates for their professional roles.
One of the key findings of the study is that the majority, 22 of 31 (71%), of graduates have found employment in the education sector. However, the employment rates are very different for 2012 versus 2013 graduates. 12 of the 13 or almost all (92.3%) of the 2012 graduates talked to are employed while only ten (52.6%) out of the eighteen 2013 graduates are employed.
Another finding is that graduates are working in a variety of different positions in the education sector, including as private primary and secondary school teachers; public secondary school teachers; school administrators at private preschools, primary schools, and secondary schools; DEOs; and trainers. The most common position for graduates was as an administrator in private schools (40.9%
14
or 9 or 22 employed graduates). This was followed by work as a teacher (31.8% or 9 of 22 employed graduates), with most teaching positions being in private schools (2 of 7 teachers work in private schools). That so many of the graduates who are employed directly in schools as administrators or teachers work in the private sector may suggest it is easier to find private sector employment or that private sector jobs are more appealing. Future research may want to follow up on this question. It is also interesting to note that most of the graduates obtained employment in the education sector either in their final year or after their graduation from the program. Specifically, seven (58% or 7 out of 12) of the twelve 2012 graduates gained their employment either in their final year or after graduation, while eight (80% 8 out of 10) out of the ten (10) 2013 graduates gained employment either in their final year or after their graduation from the program.
Of graduates who had been unable to find employment, a common theme that arose as they were reporting on the challenges they faced was a lack of education positions, particularly in the public sector. One unemployed graduate suggested that some teaching positions were available but only in places which she did not consider desirable to work and live.
Another important finding of this study is that, overall, most graduates who are currently employed in the education sector felt that their coursework prepared them well or at least moderately well for their professional roles. Graduates felt particularly positive about the role that three aspects of their degree programs in preparing them for their professional roles: Practice Teaching, Instructional Materials for Teaching course, and Guidance course.
In sum, the findings of this study suggest that the women who participated in and graduated from the University of Liberia with LTTP-funded scholarship support have, for the most part, entered the education sector. However, few of the scholarship recipients became employed as teachers in public schools, although there are some graduates who may still be interested in joining the public teaching force if they are offered positions. These unemployed graduates represent a pool of qualified teachers who could be productively employed in public schools in Liberia.

15
References
Education Statistics for the Republic of Liberia – National Statistic Booklet 2013. Government of the
Republic of Liberia, Ministry of Education.

16
Annex
Survey Questionnaire
Main Questionnaire: Study of Female Education Scholarship Graduates
Q1) In what year did you complete your undergraduate studies?
Q2) In what program did you study?
Q2.1) What was your major?
Q2.2) If 'Other program', (please specify)
Q3) Were you employed in the education sector before you graduated from this program at the University of Liberia?
Q4) Which county were you assigned in?
Q4.1) Which district were you assigned in?
Q5) Which of the following categories apply to your employment (prior to graduation)?
Q5.1) If 'Other employment category', (please specify)
Q6) What year were you first employed in the education sector (prior to graduation)?
Q6.1) If 'Other employment year, (please specify)
Q7) Are you currently employed in the education sector?
Q8) Which county are you currently assigned in?
Q8.1) Which district are you currently assigned in?
Q9) Is your current job in the education sector the same or different than the one you had before you graduated?
Q10) When did you get education sector job that you currently hold?
Q10.1) If 'Other education year', (please specify)
Q11) Which of the following categories apply to your employment (obtained after graduation)?

17
Q11.1) If 'Other employment category after graduation', (please specify)
Q12) If you have never been employed in the education sector, have you sought employment in the education sector?
Q13) Why do you think you were not able to get a job in the education sector?
Q13.1) If 'Other reason that you were not able to find job', (please specify)
Q14) Why have you not pursued employment in the education sector?
Q14.1) If 'Other reason that you did not pursue employment', (please specify)
Q15) Now, I’d like to ask you about your experience during the Education program at the University of Liberia. Please indicate to what extent the following courses or other required degree program activities helped prepare you to be an effective educator. Use the following scale for your responses:
Courses and other required activities
Educational Psychology
Testing and Evaluation
Curriculum Innovation and Methodology I
Curriculum Innovation and Methodology II
Guidance
School Administration
Instructional Materials for Testing
Practice Teaching
Main Questionnaire: Study of Female Education Scholarship Graduates cont…
Q16) Finally, is there anything else that you would like to add to help improve the finding of this study?
Main Questionnaire: Study of Female Education Scholarship Graduates cont…
Q16.1) If "Yes", please provide your input.