liberty two degrees - the vault
TRANSCRIPT

Liberty Two Degrees
Investor Presentation
February 2017
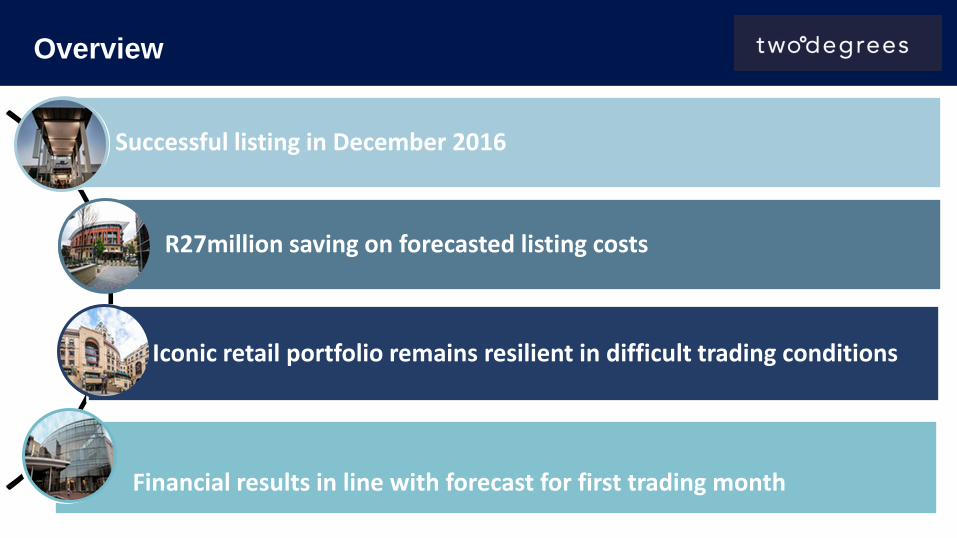
Overview
Successful listing in December 2016
R27million saving on forecasted listing costs
Iconic retail portfolio remains resilient in difficult trading conditions
Financial results in line with forecast for first trading month

Financial highlights – period ended 31 December 2016
Net asset value per unit growth of 12c per unit for one month’s operations to R9.64 per unit
Net asset value
Portfolio market value uplift of R52.5 million since listing (one month)
Market value
Distribution per unit declared at 4.85c per participatory unit for one month of trading
Distribution
Listed at 10.00 per unit, closed at 10.50 per unit at 31 Dec 2016. Year end unit price premium to NAV at 8.9%
Unit price

Financial performance
R'000 One month period ended December
2016
Profit for the year attributable to unit holders 96 566
Less: Adjustments for non-cash items (52 503)
Equals: Distributable income 44 063
Participatory units in issue '000 908 443
Distribution per unit – cents 4.85

Strategic priorities for the next 12 months
• Effectively deploy the capital raised in line with the investment strategy
• Extract value from existing assets to deliver distributions that meet investor expectations
• Continue to enhance trading environments to capture consumer spend
• Completion of developments in 2017 to ensure growth in income

Operational
Overview

Retail overview
Performance metrics
Average lease escalations achieved (full year) 6.9%
Cost to income ratio (full year) 25.8%
Expired leases retained (full year) 94.6%
Vacancy rate (Dec 2016) 2.5%
Average R/m² by gross lettable area (Dec 2016) R364.81
Note: Vacancy rate includes Melrose Arch retail. All other data excludes Melrose Arch.
20.4%
11.8%
19.3%
10.7% 10.1%
22.8%
0%
5%
10%
15%
20%
25%
2017 2018 2019 2020 2021 2020+
Expiry profile by gross lettable area - retail
Diamond Walk Diamond Walk
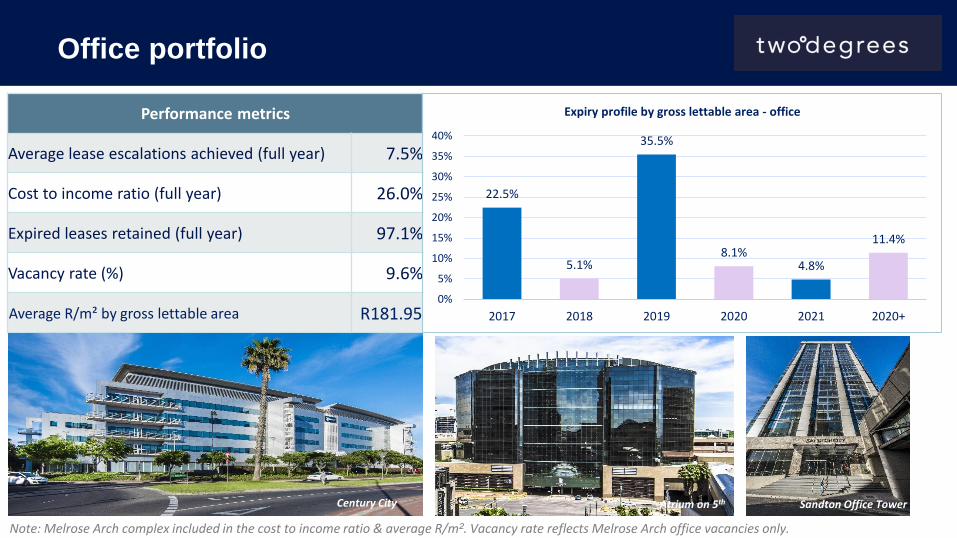
Office portfolio
Performance metrics
Average lease escalations achieved (full year) 7.5%
Cost to income ratio (full year) 26.0%
Expired leases retained (full year) 97.1%
Vacancy rate (%) 9.6%
Average R/m² by gross lettable area R181.95
Century City
22.5%
5.1%
35.5%
8.1% 4.8%
11.4%
0%
5%
10%
15%
20%
25%
30%
35%
40%
2017 2018 2019 2020 2021 2020+
Expiry profile by gross lettable area - office
Note: Melrose Arch complex included in the cost to income ratio & average R/m². Vacancy rate reflects Melrose Arch office vacancies only.
Atrium on 5th Sandton Office Tower

Developments update
Developments in progress
L2D Development Cost (R’m)
Approved Development Cost (R’m)
Commentary
Eastgate Office Tower Completion April 2017
R32,120,000
R146,000,000 Virgin Active took beneficial occupation end of January 2017 and will commence operation during March 2017. The Office Tower is scheduled for completion in April 2017.
Midlands Phase III Completion March 2018
R99,220,000
R451,000,000 Earthworks commenced towards the end of the fourth quarter 2016 and is currently on programme. The leasing is progressing well and it is anticipated that the space will be fully leased by completion.
Melomed Phase I & II Completion June 2017
R69,967,000
R318,033,000 The contractor is on programme to meet the beneficial occupation date of June 2017.
Midlands Phase III
Melomed
Eastgate Office Tower

Management team
Established management team in place with all key vacancies filled
Reward and recognition aligned to financial outcomes of unitholders borne by Manco
Well transformed team with 59% black representation, of which 32% are black female
Experienced board in place with new independents to join in due course

Conclusion
Premier real estate investment opportunity in resilient retail portfolio
Highly capable and experienced management team
Short term focus will be the growth strategy in South Africa
Completion of the developments in 2017 will contribute to continued sustainable growth
Our objective remains to achieve the pre-listing forecast of 65c per unit distribution for 2017

• This document contains forecasts and forward looking statements that reflect managements expectations as at
February 2017.
• The actual results may vary substantially from those forecasted if known and/or unknown variables do not transpire as
predicted or if estimates and assumptions prove inaccurate.
• Liberty Two Degrees and its management cannot guarantee that the forecasts or forward looking statements will
materialise and users are cautioned not to place undue reliance on the information provided.
• Liberty Two Degrees and its management disclaim any intention, and assumes no obligation, to update or revise any
forecast or forward looking statement other than as required by the JSE Listing Requirements.
Disclaimer