libqual+ 2002 tales from past participants vanderbilt university library flo wilson, deputy...
TRANSCRIPT

LibQUAL+ 2002
Tales from Past Participants Vanderbilt University Library
Flo Wilson, Deputy University Librarian

Vanderbilt’s Survey Experience
• Background and survey administration• Waiting for the data and the analysis• What do we think we know?• What do we want to do about it?• Which ways of presenting data are most
useful?

Survey and Survey Response
• Volunteer committee established• Survey announced on library’s webpage• Preliminary message sent a week ahead
– Sample size of 3400+– Approximately 40 messages bounced– Only 18 could not be corrected
• Request to participate sent from the University Librarian
• Two reminders sent• Starbuck’s gift certificates as incentives

Survey and Survey Response
WAITING . . .
Committee reviewed examples from last year’s session
Chair took SPSS class in anticipation of data fileComments reviewed, sorted (discipline and then
user group), posted on webResults arrive!

Survey and Survey Response
WAITING . . .
-- for the analysis
Experimenting
-- with ways of presenting data

Survey and Survey Response
Final SampleComplete Responses
Response Rate
Faculty 923 281 30.4%
Graduate Students 1,017 296 29.1%
Undergrads 1,499 357 23.8%
Other 2
Total 3,439 936 27.2%

Survey and Survey Response
RESPONSE AND COMMENTS BY DISCIPLINE
% withUndergrad Graduate Faculty Total Undergrad Grad Faculty Staff Total Comments
Agriculture/Environmental Studies 0 1 0 1 1 1 100%Architecture 1 0 0 1 0%Business 20 25 9 54 5 4 5 14 26%Communications/Journalism 22 0 3 25 8 1 9 36%Education 21 55 16 92 10 21 5 36 39%Engineering/Computer Science 60 33 37 130 16 10 12 38 29%Health Sciences 15 14 5 34 9 2 1 12 35%Humanities 29 33 65 127 15 20 34 69 54%Law 16 31 13 60 8 11 2 21 35%Performing & Fine Arts 18 1 19 38 7 1 9 17 45%Science/Math 41 35 52 128 16 16 23 1 56 44%Social Sciences/Psychology 64 38 51 153 30 21 25 76 50%General Studies 3 0 0 3 1 1 33%Undecided 24 0 0 24 6 6 25%Other 23 30 11 64 10 12 2 24 38%Total 357 296 281 934 141 119 119 1 380 41%
Respondents Comments

Survey and Survey Response
LibQUAL +Jean and Alexander Heard Library, Vanderbilt University
Unsatisfied (or want "more" or "faster) Satisfied (positive comments)
Access to Information 162 33
I.L.L. 10 11
E-journals, data bases 27 5
Hard copy collection 45 4
Library Hours 65 0
Affect of Service 45 97
Library as Place 129 16
Facilitates quiet study 24 3
Physical plant 42 0
Comfortable 13 2
Security 5 0
Personal Control 88 24
Convenient access to collection 15 0
Equipment (copiers, microfiche) 18 0
General 4 62
428 232

Survey and Survey Response
Comments per Section
0
20
40
60
80
100
120
140
160
180
Access to Information Affect of Service Library as Place Personal Control
nu
mb
er
of
co
mm
en
ts
Unsatisfied
Satisfied

Data Review and Analysis
• Library Management Council Retreat– Day long discussion
• What did we conclude– Higher than ARL mean, but very near the middle
• Substantial room for improvement
– Most desired services (highest) are in Personal Control, particularly related to electronic services/resources
– Faculty want more extensive digital AND print collections

Data Review and Analysis
• What else did we conclude
– Our highest perceived scores are in Affect of Service– Undergraduates highly dissatisfied with hours of operation– Main library building (we assume) meets only minimum
expectations for some and is below for many– Disciplinary breakdown did not really help with making
assumptions about which Library the respondent was evaluating

How will we move forward?
• Generated action items for further pursuit– Marketing and communication plan– Make information about remote access more available
and more visible on website– Extended hours proposal– Complete analysis of ILL performance– Develop a customer service training program for
staff– Review fines policy for substantial changes– Decide on strategy for improving main library facilities

How will we move forward?
• Follow-up study needed– What were you thinking the question meant when you
answered it?– What specific problems do you experience with
accessing electronic resources from home or office?– Convenient access to collections
• Time required to analyze the data limits ability to make measurable changes by next round
• Can we establish quantitative goals?• How close to desired do we want to be?

Data Sources and Analysis
• Published data—Overall, group, individual• Published data—Other libraries
– Re-keying to Excel
• Data file– Save as Excel file– Extract selected data and statistics to Excel
• Institutional means• Norms

Data Analysis and Presentation
• Bar charts and general satisfaction• Results by question (high/low/close)• Radar charts for role/discipline analysis• Gap tables for identifying significant areas
needing improvement• Rankings and scatter charts for library
comparisons• Norms

Bar Charts and General Satisfaction
7.056.71
6.96
7.51
7.16 7.267.53
6.71
7.247.34
6.857.147.21
6.777.03
1.00
2.00
3.00
4.00
5.00
6.00
7.00
8.00
9.00
In general, I am satisfi ed with the way in which I am
treated at the libraries.
In general, I am satisfi ed with library support for my
learning research and/ or teaching needs
How would you rate the overall quality of the service
provided by the library? (Extremely poor to
Extremely good)
Undergraduate
Graduate
Faculty
All VU respondents
All ARL Library Respondents

Results by Question—High/low/close
1.00
2.00
3.00
4.00
5.00
6.00
7.00
8.00
9.00
3 8 9 19 22 1 4 11 14 15 17 18 20 24 2 10 13 21 23 5 6 7 12 16 25
Access to Information Aff ect of Service Library as Place Personal Control
Question Number

Results by Question—High/low/close
Personal Control by User Group
4.50
5.00
5.50
6.00
6.50
7.00
7.50
8.00
8.50
9.00
Und
ergr
ad
Gra
d
Fac
ulty
Und
ergr
ad
Gra
d
Fac
ulty
Und
ergr
ad
Gra
d
Fac
ulty
Und
ergr
ad
Gra
d
Fac
ulty
Und
ergr
ad
Gra
d
Fac
ulty
Und
ergr
ad
Gra
d
Fac
ulty
Electronic resourcesaccessible from home
or office
Modern equipmentthat lets me easilyaccess information
Website enables me tolocate information on
my own
Easy to use accesstools to find things on
my own
Making informationaccessible for
independent use
Convenient access tolibrary collections
VU Desired
VU Minimum
VU Perceived

Radar Chart—Complete Runs of Journals
1.00
3.00
5.00
7.00
9.00Businesss
Comm/Journalism
Education
Engineering/CS
Health Sciences
Humanities
Law
Other
Perf & Fine Arts
Science/Math
Social Sciences
Undecided
Minimum
Desired
Perceived

Radar Chart—Individual Attention
1.00
2.00
3.00
4.00
5.00
6.00
7.00
8.00
9.00Freshman
Sophomore
Junior
Senior
Masters
DoctoralAsst. Prof.
Assoc. Prof.
Professor
Lecturer
Other academic
Minimum
Desired
Perceived
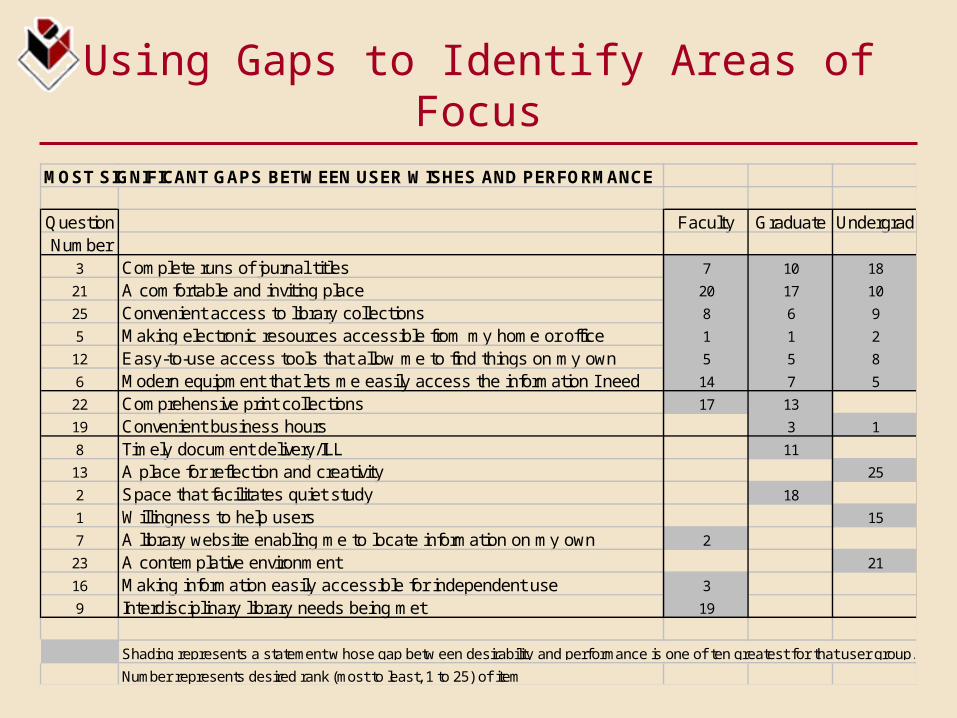
Using Gaps to Identify Areas of Focus
MOST SIGNIFICANT GAPS BETWEEN USER WISHES AND PERFORMANCE
Question Faculty Graduate UndergradNumber
3 Complete runs of journal titles 7 10 18
21 A comfortable and inviting place 20 17 10
25 Convenient access to library collections 8 6 9
5 Making electronic resources accessible from my home or office 1 1 2
12 Easy-to-use access tools that allow me to find things on my own 5 5 8
6 Modern equipment that lets me easily access the information I need 14 7 5
22 Comprehensive print collections 17 13
19 Convenient business hours 3 1
8 Timely document delivery/ILL 11
13 A place for reflection and creativity 25
2 Space that facilitates quiet study 18
1 Willingness to help users 15
7 A library website enabling me to locate information on my own 2
23 A contemplative environment 21
16 Making information easily accessible for independent use 3
9 Interdisciplinary library needs being met 19
Shading represents a statement w hose gap betw een desirability and performance is one of ten greatest for that user group.
Number represents desired rank (most to least, 1 to 25) of item

ARL Libraries (sorted by perceived)
1.00
2.00
3.00
4.00
5.00
6.00
7.00
8.00
9.00
0 5 10 15 20 25 30 35 40 45
Desired
Perceived
Minimum

Selected ARL Peers for Comparison
Libraries with one or more scores in the top ten--Perceived Service Level, Service Adequacy, or Service Superiority
Average Minimum
Average Desired
Average Perceived
Perceived Rank
Average Service
Adequacy Adequacy Gap Rank
Average Service
Superiority Superiority Gap Rank
Library A 6.58 7.92 7.18 1 0.61 12 (0.74) 2 Library B 6.43 7.92 7.12 2 0.69 4 (0.80) 6 Library C 6.22 7.82 7.11 3 0.89 1 (0.71) 1 Library D 6.38 7.91 7.06 4 0.68 6 (0.85) 8 Library E 6.50 7.87 7.05 5 0.55 15 (0.82) 7 Library F 6.46 7.90 7.05 6 0.59 14 (0.86) 9 Library G 6.38 7.83 7.04 7 0.66 7 (0.79) 5 Library H 6.40 7.87 7.00 8 0.60 13 (0.87) 10 Library I 6.18 7.74 6.99 9 0.81 2 (0.75) 4 Library J 6.61 7.98 6.99 10 0.39 24 (0.98) 16 Library K (Vanderbilt) 6.25 7.83 6.94 12 0.69 5 (0.89) 11 Library L 6.18 7.89 6.90 16 0.72 3 (0.98) 15 Library M 6.25 7.62 6.88 19 0.63 10 (0.75) 3 Library N 6.13 7.90 6.76 29 0.64 9 (1.14) 31 Library O 6.09 7.76 6.75 30 0.66 8 (1.02) 19

Norm Comparisons—Vanderbilt Percentiles
25 Question Affect of Library as Personal Access toIndividual Score Norms--Perceived Service Mean Service Place Control Information
All respondents 45th 46th 39th 46th 45th
ARL library respondents 47th 48th 45th 47th 44th
All faculty 39th 43rd 33rd 40th 43rd
Graduate students 53rd 51st 50th 52nd 56th
Undergraduate students 42nd 44th 38th 46th 40th
Institutional score norms--All Libraries
Perceived level of service 46th 51st 32nd 58th 45th
Service adequacy gap (perceived minus minimum) 80th 85th 60th 80th 70th
Service superiority gap (desired minus perceived) 55th 65th 40th 60th 50th
Institutional score norms--ARL Libraries
Perceived level of service 66th 70th 50th 70th 40th
Service adequacy gap (perceived minus minimum) 90th 90th 66th 90th 75th
Service superiority gap (desired minus perceived) 66th 80th 50th 70th 50th

LibQUAL Report and Presentations
http://staffweb.library.vanderbilt.edu/admin/lq/LQhome.htm