libs and xrf analysis for a stratigraphic study of...
TRANSCRIPT

An International Journal ofMINERALOGY, CRYSTALLOGRAPHY, GEOCHEMISTRY,ORE DEPOSITS, PETROLOGY, VOLCANOLOGYand applied topics on Environment, Archaeometry and Cultural Heritage
PERIODICO di MINERALOGIAestablished in 1930
Periodico di Mineralogia (2015), 84, 3A (Special Issue), 569-589 DOI: 10.2451/2015PM0024
LIBS and XRF analysis for a stratigraphic studyof pictorial multilayer surfaces
Maria Francesca Alberghina1,*, Rosita Barraco1, Maria Brai1,2, Dorotea Fontana1 and Luigi Tranchina2
1 Dipartimento di Fisica e Chimica, Università di Palermo, Viale delle Scienze, Ed. 18, 90128 Palermo, Italy2 Laboratorio di Fisica e Tecnologie Relative, UniNetLab - Sistema di Laboratori di Ateneo,
Università di Palermo, Viale delle Scienze, Ed. 18, 90128 Palermo, Italy*Corresponding author: [email protected]
Abstract
The study of painting materials is a primary goal for the historical and artistic characterization of works of art because it provides useful information about the original materials and their degradation products, the painting technique and any conservation treatments. However, the archaeometric investigations are very complex because the need to safeguard the Cultural Heritage makes necessary the use of non or micro invasive techniques. Among the possible analytical approaches, Laser-Induced Breakdown Spectroscopy, supported by X-ray Fluorescence spectroscopy for a faster elements identification, allows stratigraphic analysis with high spatial resolution enough to discriminate different pictorial layers. Moreover, an integrated approach based on the above techniques is particularly useful for the complementarities of the outcomes (in terms both) of investigated thicknesses and detectable elemental content. This paper aims to validate, in the archaeometry field, the use of Laser-Induced Breakdown Spectroscopy for stratigraphic investigation of painted surfaces/objects by means of analytical results obtained from original fragments of mural paintings originating from different sites and artistic eras. Indeed the focus of this work is to determine the optimum parameters for LIBS technique in order to acquire the maximum information with the least damage to the works of art. The results concern mainly the comparison between the identification of the chemical elements by using the more traditional X-Ray Fluorescence technique and the study of their distribution along the thicknesses of the paint layers from the Laser-Induced Breakdown Spectroscopy analyses. The collected data have demonstrated the usefulness of the Laser-Induced Breakdown Spectroscopy investigation, through which it has been possible to reveal chemical elements undetectable by X-ray Fluorescence spectroscopy and to analyse the stratigraphic sequence of paint layers from the surface up

Periodico di Mineralogia (2015), 84, 3A (Special Issue), 569-589 M.F. Alberghina et al.570
Introduction
Chemical characterisation of pictorial materials constitutes a fundamental aim for gathering historical, artistic and technical information on the works of art. The difficulty of these investigations is related to the complex structure of the pictorial materials to be analysed (i.e. to identify several different materials used in multi-component mixtures and/or in multilayer structures). A detailed characterisation of the materials and pigments in the deeper layers of polychrome works of art is, indeed, a necessary task, prior to any conservation work, as it allows thorough understanding of materials, the pictorial techniques and most importantly their degradation processes. The pictorial materials can be significantly heterogeneous due to the composition of their constituent materials, differences between the chemical components of the external layers and those of the inner ones, different painting techniques; and the natural ageing or degradation processes. For these reasons, the need to acquire information about the deeper layers, avoiding the sampling, becomes a goal to be achieved. Based on these assumptions, an integrated analytical approach consisting in micro-destructive investigations could provide useful information on the multilayered pictorial structures and their chemical composition. Moreover, the requirement of preserving the works of art integrity, is a mandatory aspect in Cultural Heritage (CH) investigations to be taken always into account. Then, depending on the information to be acquired, one might use a combination of non or micro invasive
techniques which maximize the information and minimize any sample damage (Anglos et al., 1997; Castillejo et al., 2001; Angeli et al., 2006; Osticioli et al., 2008; Brai et al., 2009; Alberghina et al., 2011; 2013; Colombo et al., 2011; Kriznar et al., 2011; Fontana et al., 2014).
For the non-destructive analysis of pigments and/or pictorial materials in works of art, a wide range of analytical techniques can be employed. Recent years have seen an increasing number of analytical approaches using atomic spectroscopy well suited for investigating the materials and techniques of works of art (Anglos et al., 1997; Angeli et al., 2006; Osticioli et al., 2008; Brai et al., 2009; Alberghina et al., 2011; 2013; Colombo et al., 2011; Kriznar et al., 2011; Fontana et al., 2014). Among them, two complementary spectroscopic techniques, namely X-Ray Fluorescence spectroscopy (XRF) and Laser-Induced Breakdown Spectroscopy (LIBS), have gained great attention in the CH field (Anglos et al., 1997; Kantarelou et al., 2007; Giakoumaki et al., 2007; Osticioli et al., 2008; Brai et al., 2009; Alberghina et al., 2011; Barbini et al., 2002; Arafat et al., 2013). Both can be used in situ and they allow to gather elemental and spatially-resolved information about major and minor constituents of a large variety of materials. In particular, XRF detects the chemical constituents through the non-invasive analysis of the fluorescence radiation emitted by the sample irradiated by the X-Rays beam. LIBS (micro-destructive) reveals the chemical elements through the characteristic atomic and ionic emission lines emitted by the micro-plasma induced by a high power laser pulse
to the preparation layer. Furthermore, they have provided good insight into the different painting layers by confirming the potential of the Laser-Induced Breakdown Spectroscopy to carry out stratigraphic analyses in a micro destructive way.
Key words: Pictorial layers; pigment analysis; mural paintings; X-Ray Fluorescence spectroscopy; Laser Induced Breakdown Spectroscopy.

Periodico di Mineralogia (2015), 84, 3A (Special Issue), 569-589 LIBS and XRF analysis for a stratigraphic… 571
focused on the surface to be investigated.XRF is among the most used analytical
techniques for investigating inorganic materials (pigments, glasses, ceramics, metals) because it is capable to recognize a large number of chemical elements in an efficient and non destructive way. Nevertheless, the light elements detection is difficult due to the instrumental limit capability and to the measurement conditions. Moreover, in case of a multilayered paint sample the element identification might be hampered, by the absorption of X-Rays through different layers that affects the intensity ratio between the different characteristic lines. On the other hand, LIBS, in many ways complementary to XRF, can achieve a high spatial and depth resolution, allowing both to analyse deeper layers but also to identify the light elements not detectable by XRF.
LIBS, based on the principles of laser ablation, allows a detailed stratigraphic analysis thanks to the spectra recorded from successive laser pulses delivered onto the same sample point. Then, both techniques have significant advantages, even if the assessment of their potentiality in the quantitative analyses is object of several works (Kantarelou et al., 2007; Brai et al., 2009; Burakov et al., 2009; West et al., 2010; Fontana et al., 2014). Although XRF is commonly used for qualitative analysis, recent efforts have been made to extend its use also for the quantitative analysis even with portable systems (Fontana et al., 2014; Bukarov et al., 2009). It is well-known that performance of LIBS in qualitative and quantitative analysis is affected by many factors related plasma formation and evolution still now under investigation (West et al., 2010).
Aim of this work is to evaluate the effectiveness of the combined use of XRF and LIBS for the chemical characterisation of pictorial materials in mural paintings. In these cases, the problem is to discriminate the belonging of the detected chemical elements to the different pictorial layers. Indeed, in a painting, it is generally
possible to identify three different layer: the support, the preparation and the pictorial layers. On the support the preparation, constituting of a non-transparent layer, typically white, is stretched out; it is intended to receive the pictorial film with variable thickness but of the order of a few millimetres.
Since recent studies have highlighted the difficulties even in a LIBS qualitative characterization (Colao et al., 2004; Herrera et al., 2009; Tognoni et al., 2010), XRF measurements were carried out to efficiently detect the elements in the sample surfaces (Alberghina et al., 2009; Brai et al., 2009). This methodological approach was used to individuate the chemical elements to be investigated in the LIBS stratigraphic profile.
These analyses, carried out on fragments of mural paintings, of two historic buildings in Niscemi (Sicily, Italy), have evidenced experimental difficulties related to the layer thickness to be investigated. In particular, in order to delineate the LIBS profiles of the chemical elements it is necessary to determine the suitable measurement parameters leading to the spatial resolution capable to discriminate the different layers constituting the stratigraphical sequence.
The experimental parameters for the measures on the real pictorial layer and on reference pigment samples have been evaluated in order to obtain the best quality in the spectral response for reliable identification of the sample elemental composition.
Experimental
Samples: Fragments of mural paintings and reference samples
The analysed fragments of mural paintings come from two buildings of Sicilian historic and artistic sites in Niscemi (Sicily, Italy): 1) Church of Santa Maria del Bosco and 2) Historic building - (private property).
The sanctuary of Santa Maria del Bosco, built

Periodico di Mineralogia (2015), 84, 3A (Special Issue), 569-589 M.F. Alberghina et al.572
between 1749 and 1758, has a single nave with an elongated elliptical plan, the facade is in Baroque style and presents a balanced composure and restraint in decoration. The church preserves in a small niche the rocks constituted from two candlesticks and from the base that supported the cross, found, according to tradition, in 1599 in the occasion of the discovery of the Madonna painting. The main altar depicts angels that, led by the hand of God, holding up the sacred painting of the Madonna in the act to bring it to the source of the discovery. Behind the shovel, a niche houses a copy of the painting, the work of a monk of Caltagirone, because the original work was lost during a fire that occurred in 1769 while he was at the church Santa Maria d’Itria. The lower Chapel preserves the well with the water vein in which, it is said, was found the sacred veil with the image of Our Lady: as indicated Chapel Holy water from 1998 is also the baptistery (Marsiano, 1995).
The fragments under investigation, accidentally detached from painted vault, are characterised by layers painted of white, red and black. Figure 1 displays the central vault of the Church of Santa Maria del Bosco (Figure 1a), a detail of the area (Figure 1b) from which are accidentally detached fragments shown in the panel 1c.
In the second case, the studied samples come from the central area of the painted vault of a private historic palace consisting of painting red and gilded layers (Figure 2).
This palace, sited in the historic city center and belonging to one of the historical noble families, was built in the second half of the XIX century and renovated during the first decades of the XX century by undergoing structural modifications and an aesthetic modernization in according to the Art Nouveau style. On this occasion, the original vault, (from which come the samples) was hidden by new painted vaults built to a minor height than the decorated room. The hidden mural painting was made on ancient gypsum vault, partially demolished.
Nowadays, the original painted layers are in a good conservation state, indeed have not colour detachment. Their status is also preserved from the optimal environmental condition in the space between the new vault and the roof, which have favored the ventilation avoiding the condensation phenomena on the surfaces and, consequently, the degradation process.
First, investigations were undertaken using these fragments of mural paintings; second, the optimized LIBS conditions were obtained by analysing reference pigment samples.
In order to achieve the best LIBS measurement parameters, the reference samples, consisting in pigment powders compressed by a 1.8 Tons pressure into tablets of 1.2 cm diameter and 0.2 cm thick, have been investigated.
Analytical technique and methodsIn order to have stratigraphic information
on the pictorial materials under study, LIBS measurement were carried out on samples and reference materials; a previous step for the elemental characterization of pictorial surfaces layers was obtained through X-ray Fluorescence spectroscopy. A portable XRF system, namely the ArtTAX 400 spectrometer from Bruker AXS, was used to acquire XRF spectra. It was equipped with a Mo (Kα = 17.5 keV) low-power excitation tube (with a 100 µm thick beryllium window), enclosed by a safety radiation shield. A filter disk system, put before the X-ray beam placed between the X-ray tube and the sample, can be used in order to attenuate the Bremsstrahlung radiation and to reduce the diffracted component of the X-ray beam. A pinhole system in the X-ray source provided a collimated beam on the sample making the instrument suitable to perform spatially resolved multi-elemental analysis on three-dimensional structures. The detector was an XFlash 1001 (a Peltier cooled silicon drift detector) with high speed, low noise electronics, and a FWHM energy

Periodico di Mineralogia (2015), 84, 3A (Special Issue), 569-589 LIBS and XRF analysis for a stratigraphic… 573
Figure 2. a) and b) Particulars of the painted vault, discovered during the restoration of a historic building privately owned (Niscemi, Sicily), and c) details of the investigated red- gilded samples.
Figure 1. a) Central vault of the Church of Santa Maria del Bosco (Niscemi, Sicily), and b) particular of the area from which are accidentally the detached fragments shown in (c).
a)
b)
a)
c)
c)
b)

Periodico di Mineralogia (2015), 84, 3A (Special Issue), 569-589 M.F. Alberghina et al.574
resolution < 145 eV at the Mn Ka energy (5.9 keV) with an active area of 5 mm2 and an 8 µm beryllium window. The detection head contains the detector and the X-ray tube, fixed on a movable tripod allowing independent vertical and horizontal movement, and its power supply. The mobile XRF moving head includes also a microcamera to visualise the positioning of the incident beam on the sample. Helium flux system, reducing the photoelectric absorption of the sample characteristic X-rays by the air molecules, allowed the detection of light elements. This XRF equipment allows the detection of chemical elements with atomic number Z > 11 (i.e. Na) (Bronk et al., 2001).
The geometry between primary beam, sample, and detector is fixed at 0°/40° relative to the perpendicular of the sample surface (Fontana et al., 2014). Measurement setup was as follows: tube voltage 30 kV; current 1300 µA; acquisition time 300 sec; no filter disk between the X-ray tube and the sample; He flow rate 1.6 L min-1, lateral resolution 0.65 mm, with a distance between sample and detector on the order of 1 cm. The setup parameters were selected such to have a good spectral signal and to optimise the signal to noise ratio (SNR). The last is indeed improved by the use of a 30 kV voltage that enhanced relatively the XRF intensities originating from the pictorial layers. The outcomes of five independent measurements were averaged, in order to improve the statistical significance.
The portable experimental apparatus for the LIBS measurements is the MObile Dual-pulse Instruments for LIBS material analysis (MODì) from Marwan Technolgy. It integrates a double pulsed Q-Switched Nd:YAG laser (Lotis, mod. LS-2131D) emitting two collinear laser pulses at 1064 nm, whose energy can be set by varying the lamp flash voltage. The pulsed energy, focused on the sample surface by a 100 mm focal length Plano-convex lens, is within 50-120 mJ with a maximum repetition rate of 10
Hz and a reciprocal delay adjustable from 0 to 60 μs. High lateral spatial resolution of the LIBS measurements corresponds to the dimensions of the microcrater left by the laser on the sample surface. The microcrater diameter, whose dimension are related to the laser energy, does not exceed 100 microns. The reduced size of the crater also allows for a high lateral spatial resolution of the LIBS analysis (Angeli et al., 2006).
LIBS instrumental equipment allows to carry out measurements on samples located inside an experimental chamber (as in our case) or outside through an external arm. The closed experimental chamber, is equipped with a XYZ motorized table for exact positioning of the sample at the focus of the laser beams. An optical microscope allows to monitor the region of the sample under analysis. LIBS signal, produced inside or outside of the sample chamber, is collected at an angle of about 30° respect to the laser beam axis by suitable optics. Then, it is transferred through an Y bundle optical-fibre (constituted from amorphous silicon dioxide SiO2), to a compact Echelle spectrometer (Andor, ME5000) coupled to an Intensified Charge Coupled Device (ICCD, Andor, mod. iStar) for the spectral acquisition. The spectral resolution of the spectrometer (λ/Dλ < 5000) allows the simultaneous spectral recording in the range 200 ÷ 900 nm. This characteristic of the spectrometer is very important in the LIBS measurements because it avoids the reproducibility problems from shot to shot occurring with conventional monochromators as well as significantly reduces the measurement time. In addition, as a result of the tight focusing, spatial resolution is achieved, both across the surface of the work and in depth, allowing for studies of surface inhomogeneities and depth profile analysis, respectively, and thus providing nearly microscopic information (Anglos et al., 1997).
LIBS instrument is controlled via an integrated personal computer which manages

Periodico di Mineralogia (2015), 84, 3A (Special Issue), 569-589 LIBS and XRF analysis for a stratigraphic… 575
the sample visualization and positioning, the experimental settings of the laser - energy of the beams, the pulses delay, repetition rate - and spectral acquisition parameters - number of averaged spectra, Gate Pulse Delay (GPD), Gate Pulse width (GPW) and Multi Channel Plate Gain (MCPG). LIBS spectra, after acquisition and storage, can be qualitatively and quantitatively analysed by using proprietary software (LIBS++).
With the aim to optimize the LIBS signal, the acquisition parameters (GPD, GPW, laser pulse energy, number of accumulated pulses and ICCD gain) have been varied in order to identify and select the more appropriate ones to perform a simultaneous measurement of the chemical elements in the analysed paint layers (Bruder et al., 2007).
Measurement setup for LIBS acquisitions were modulated depending on the two different case study and selected within the following ranges: GPD 0.4 ms - 1.5 ms, GPW 0.5 ms - 10 ms, Laser pulse energy 9.5 J - 12.5 J, shot number 1 - 15.
Moreover, the measurement set-up established for all lines of interest, was the best compromise between the LIBS signal optimization (high SNR, good reproducibility and minimum continuum background) and minimization of damage induced on the sample surface.
Our analytical approach is consisted firstly, in the chemical characterisation of the various paint and support layers by the XRF analysis. Five independent measurements were averaged for each sample. To better understand the outcomes from the paint samples, comparisons with the support layer and the reference materials were made. This methodological approach was useful to individuate the chemical elements to be investigated in the LIBS stratigraphic profile. LIBS measurement were carried out on samples and reference materials.
For LIBS semi-quantitative analysis the measurements have been time resolved in order to
minimise the high intensity continuum emission at the early time of the plasma formation. So, in order to obtain the best detection limit, the GPD is optimized using both ionic and neutral lines normalized to the background (Ismail et al., 2004).
According the above considerations, the experimental parameters set has been specifically selected for each typology of analysed samples. For each spectral line characterising the chemical elements in the LIBS spectra, measurements of the peak intensity were performed.
Table 1 reports the considered atomic emission lines, chosen among those not affected by self-absorption (Mateo et al., 2009; Handbook of basic Atomic Spectroscopic data, NIST - http://www.physics.nist.gov). The peak intensity variation of the main spectral lines, with increasing numbers of laser pulses delivered at the same point, has been evaluated along the different deeper paint layers within the sample in order to obtain the depth profiles. The latter information is deduced by considering the intensity variation of the main spectral lines as increasing the number of laser shots left on the same sample point.
The check of the measurement stability conditions has been carried out by comparing the experimental relative intensity ratio and the transition probability ratios of the more intense peak Hg emission lines. In particular the considered Hg lines are 404.66 nm and 435.83 nm.
Then, with the aim to identify the optimal GPW value of the Echelle spectrometer for detecting the mercury in the cinnabar, the relative transition probabilities of the doublet (7 s1 6 3p1 → 7 3s1 6 3p0) has been considered by using the relative line intensity ratios of two spectral lines arising from the same upper level.
As well known, the relative intensity ratio can be calculated by (Griem, 1964; Alberghina et al., 2011a).

Periodico di Mineralogia (2015), 84, 3A (Special Issue), 569-589 M.F. Alberghina et al.576
(1)
where A1,2 indicates the transition probability between the upper to the lower quantum state, g1,2 is the statistical weight factor and l1,2 is the corresponding wavelength (Sansonetti and Martin, 2005).
Theoretical relative intensity ratio Ith, 2.06 for Hg (Sansonetti and Martin, 2005; Reader and Corlis, 1980), has then been compared with the mean value of the experimental relative intensity ratios Imeas obtained from the cinnabar laboratory samples at different GPW values. The adherence of the experimental ratios to the theoretical ones is evaluated by the D parameter, defined by (Alberghina et al., 2011b):
(2)
Results and discussion
The analytical data collected for each sample allow the in-depth chemical characterisation
of the various pictorial layers. In particular, the gained information concerns mainly the identification of the chemical elements and their distribution along the investigated thicknesses of the pictorial layers through the LIBS depth profiles.
First, XRF and LIBS analyses of mural fragments from the central vault of the Church of Santa Maria del Bosco (Niscemi, Sicily) are reported. The XRF analysis, generally associated to a superficial thickness in the range of microns has allowed to gather data from the sample points on the painted layers (white, black and red) to be compared with those collected from the support layer. Indeed, the comparison of the intensity counts related to different chemical elements offers the possibility to obtain semi-quantitative results. Figure 3 shows the comparison among these XRF spectra. Table 2 reports the XRF results for each investigated pictorial layer: white, black, red and support layer.
The presence of light elements (such as Na) and the intensity variation along the analysed thickness of the chemical elements, identified as pigment markers, were monitored through the acquisition of a stratigraphic series of LIBS spectra. The LIBS measurement parameters, considered optimal for this set of samples,
€
I1I2
⎛
⎝ ⎜
⎞
⎠ ⎟ th
=A1g1λ2A2g2λ1
€
Δ = 1− ImeasIth
⎛
⎝ ⎜
⎞
⎠ ⎟
Table 1. Emission lines suitable for the detection of elements in pigments. The wavelengths refer to emission from neutral atoms.
Chemical Element Atomic Emission Lines (nm)Hg (I) 312.57, 365.02, 404.66*, 435.83*, 546.07Ca (I) 428.3, 428.9, 429.8, 430.2, 430.7, 435.5Fe (I) 438.3, 440.4Au(I) 460.7, 462.06Mn (I) 475.4, 476.2Na (I) 588.9, 589.5K (I) 766.4, 769.8
* = emission lines used for the evaluation of the transition probability ratios.

Periodico di Mineralogia (2015), 84, 3A (Special Issue), 569-589 LIBS and XRF analysis for a stratigraphic… 577
were: GPD, 1.5 ms; GPW, 2.5 ms; lamp laser energy, 11.5 J; MCPG, 230. Moreover, the LIBS spectra have been acquired by averaging (accumulations number for spectrum) 3 laser shots on the sample surface.
In particular, as example, in Figure 4 are shown the peak intensity variations, for LIBS spectra relative to the sixth and fifteenth shots, as increasing the laser shots number, of different chemical elements identified in the pictorial layer: 1) Ca, Fe, Na and K for the white painted layer; 2) Ca, Fe, Na and Mn for the black painted layer and 3) Ca, Fe, Na and K for the red painted layer. The wavelength interval considered in each spectrum corresponds to the region where the more intense lines of the characteristic elements should be visible (see Table 1 for their numerical values). The peak intensity variation is indicative of which elements are characteristic of the pictorial layer respect to the preparation layer.
This statement is more evident by analysing the depth profiles in the case of the black and the red layers; because it is possible to acquire useful information on the distribution of elements characterising the painted layer. Indeed, this possibility is verified for the Mn and the Fe characterising the black and red painted layers, respectively. Figure 5 reports the depth profiles (Mn, Fe and Ca) of intensity ratios between each line intensity signal and intensity signal relative at last sequence (15 laser shots for all the painted layers) versus LIBS measurement sequence. In particular (see Figure 5a), in the black layer as the number of the laser shots increases the Mn LIBS signal reduces with the increasing of the Ca (marker element of the preparation layer). Differently, the Fe intensity ratios linearly (R2 = 0.988) increase towards the inner layers, because this element belongs to preparation layer. On the other hand, in the red layer the Fe decreasing trend confirms that this element is instead characteristic of the pictorial layer (Figure 5b). Moreover, it is possible to observe for both pictorial layers (Figure 5) in
Figure 3. Central vault of the Church of Santa Maria del Bosco (Niscemi, Sicily): XRF spectra acquired on the painted layer - grey line for a) white, b) black and c) red painted layer - and on the sample background - black line for support - of the detached fragment. The considered intensity peaks are marked by the symbols of the chemical elements.
a)
b)
c)

Periodico di Mineralogia (2015), 84, 3A (Special Issue), 569-589 M.F. Alberghina et al.578
the measurement sequence 4 (i.e. 12 laser shots) comparable values of intensity ratios for the Fe and Ca indicating that the preparation layer has been reached. These findings are validated by the XRF spectra (see Figure 3b and 3c) where the compositional differences between the pictorial and preparation layers are noticeable, through the recorded high count values of Fe in the spectra of red and black layer.
By analysing LIBS spectra, indeed, it is possible to verify as the integrated investigation by XRF and LIBS is capable to provide complementary information about the chemical elements distribution and thickness layers by elucidating, for comparable matrix, a proportionality between laser shots numbers and ablated depth. In this case study, this possibility has been validated by linking the LIBS results with those from XRF investigations carried out on the back (i.e. the preparation layer) of the detached sample. Moreover, the LIBS has allowed also the detection of the chemical elements with low Z, not detectable with the XRF (also by purging helium) since they apparently were in low concentrations. This is the case of Na that is uniformly present along the investigated depth in all the painted layers, less than slight differences in the counts were detected due to fluctuations in the plasma.
The LIBS spectra of the characteristic
chemical elements as increasing the laser shots number are displayed; in particular, the results relative to VI and XV shots are reported. The assignment of main element lines is marked. In particular, they are related to: Ca, Fe, Na and K for the white layer (I column); Ca, Fe, Na and Mn for the black layer (II column); Ca, Fe, Na and K for the red layer (III column). In each spectrum a comparison respect to the preparation layer is reported.
The second typology of investigated samples consists in mural fragments from the central vault of the formerly City Library (private property Niscemi, Sicily). The analysed sample points by XRF and LIBS have involved the red and gold painted layers. Figure 6 shows the XRF spectra acquired on the red paint layer (P1), and on the gold layer above the red pigment (P2), and, finally, on a small gold leaf fragment (P3).
The particularly thin thickness of the pictorial layer has made difficult to individuate the more suitable LIBS instrumental parameters (laser energy, GPD and GPW) for the acquisition of stratigraphic sequence aimed to differentiate the paint layer from the preparation one.
To better understand the results obtained on that kind of samples, comparisons with reference materials were made.
For example, measurements on golden layer clearly show the influence of the LIBS parameters
Measurement sampleX-ray Intensity (counts)
Al Si S(+M) K Ca Ti Mn Fe Sr
White layer 707 1358 4131 3523 15734 325 282 11701 2886
Black layer 259 866 3016 1231 19846 346 7644 6511 14386
Red layer 282 608 6834 1288 35216 udl 282 15762 2603
Support layer udl 1754 1528 580 46836 udl 254 1642 1782
Table 2. XRF results for the chemical elements also analyzed by the LIBS data. The XRF intensity values fall within 5% -7% error range.
udl = under detection limit.
Periodico di Mineralogia (2015), 84, 3A (Special Issue), 569-589 LIBS and XRF analysis for a stratigraphic… 579
on the possibility to reveal the chemical elements present in the sample and consequently to discriminate the different layers, due to the complex mechanisms of the plasma formation and evolution. Indeed as it is possible to see in Figure 7, in the LIBS spectrum of golden layer (P2), acquired with the laser energy value 11.5 J, by using a GPD 0.4 ms and a GPW 0.5 ms, is detectable only the Au(I) emission line 460.7 nm. On the other hand, by increasing GPD and GPW up to 1.5 ms and 2.5 ms, respectively, it is possible to detect also the Au(I) line 462.06 nm (Figure 7), even if with an intensity reduction of the other emission line (460.7 nm). Similar considerations are valid for the iron, element characteristic of the red layer below the golden one. In this case, the Fe(I) emission lines at 438.3 nm and 440.4 nm, visible to GPD and GPW values of 0.4 ms and 0.5 ms, respectively, are no longer detectable at longer times (Figure 8a). Figure 8b shows the XRF spectrum acquired on the same area investigated by the LIBS.
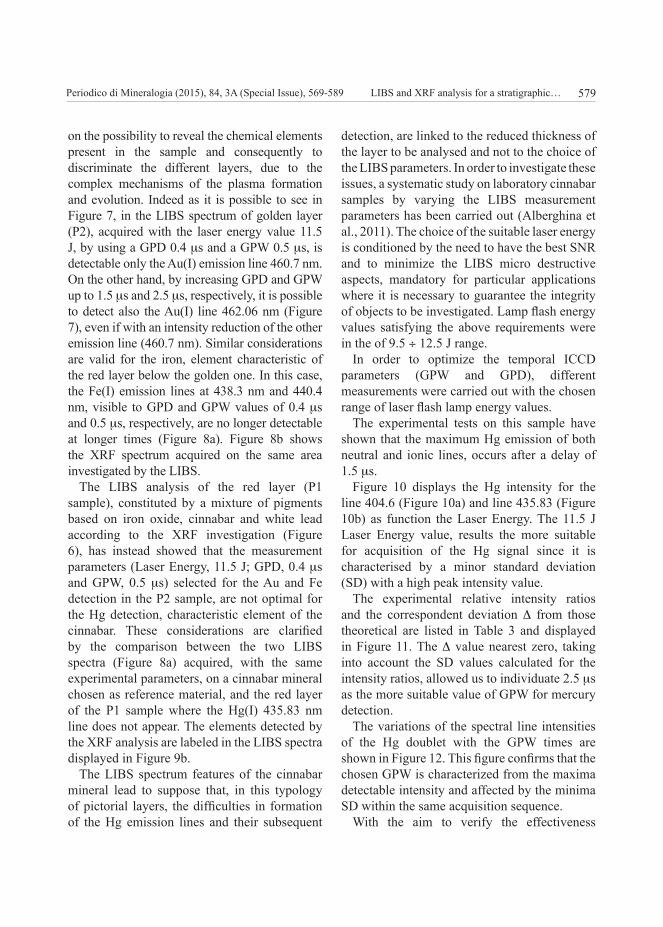
The LIBS analysis of the red layer (P1 sample), constituted by a mixture of pigments based on iron oxide, cinnabar and white lead according to the XRF investigation (Figure 6), has instead showed that the measurement parameters (Laser Energy, 11.5 J; GPD, 0.4 ms and GPW, 0.5 ms) selected for the Au and Fe detection in the P2 sample, are not optimal for the Hg detection, characteristic element of the cinnabar. These considerations are clarified by the comparison between the two LIBS spectra (Figure 8a) acquired, with the same experimental parameters, on a cinnabar mineral chosen as reference material, and the red layer of the P1 sample where the Hg(I) 435.83 nm line does not appear. The elements detected by the XRF analysis are labeled in the LIBS spectra displayed in Figure 9b.
The LIBS spectrum features of the cinnabar mineral lead to suppose that, in this typology of pictorial layers, the difficulties in formation of the Hg emission lines and their subsequent
detection, are linked to the reduced thickness of the layer to be analysed and not to the choice of the LIBS parameters. In order to investigate these issues, a systematic study on laboratory cinnabar samples by varying the LIBS measurement parameters has been carried out (Alberghina et al., 2011). The choice of the suitable laser energy is conditioned by the need to have the best SNR and to minimize the LIBS micro destructive aspects, mandatory for particular applications where it is necessary to guarantee the integrity of objects to be investigated. Lamp flash energy values satisfying the above requirements were in the of 9.5 ÷ 12.5 J range.
In order to optimize the temporal ICCD parameters (GPW and GPD), different measurements were carried out with the chosen range of laser flash lamp energy values.
The experimental tests on this sample have shown that the maximum Hg emission of both neutral and ionic lines, occurs after a delay of 1.5 ms.
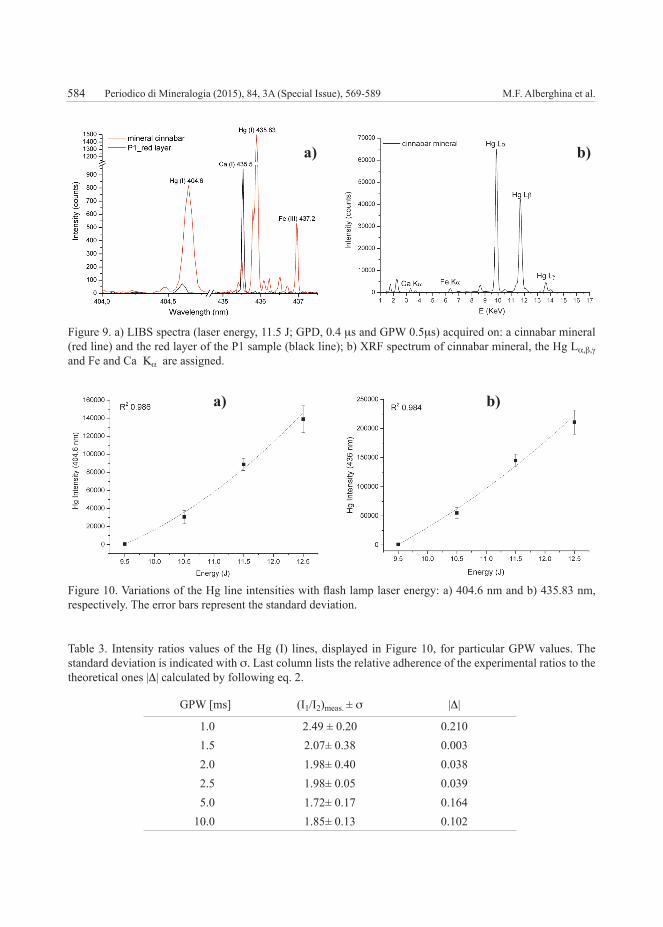
Figure 10 displays the Hg intensity for the line 404.6 (Figure 10a) and line 435.83 (Figure 10b) as function the Laser Energy. The 11.5 J Laser Energy value, results the more suitable for acquisition of the Hg signal since it is characterised by a minor standard deviation (SD) with a high peak intensity value.
The experimental relative intensity ratios and the correspondent deviation D from those theoretical are listed in Table 3 and displayed in Figure 11. The D value nearest zero, taking into account the SD values calculated for the intensity ratios, allowed us to individuate 2.5 ms as the more suitable value of GPW for mercury detection.
The variations of the spectral line intensities of the Hg doublet with the GPW times are shown in Figure 12. This figure confirms that the chosen GPW is characterized from the maxima detectable intensity and affected by the minima SD within the same acquisition sequence.
With the aim to verify the effectiveness

Periodico di Mineralogia (2015), 84, 3A (Special Issue), 569-589 M.F. Alberghina et al.580W
hite
laye
rB
lack
laye
rR
ed la
yer

Periodico di Mineralogia (2015), 84, 3A (Special Issue), 569-589 LIBS and XRF analysis for a stratigraphic… 581
Figu
re 4
. LIB
S st
ratig
raph
ic se
quen
ce p
erfo
rmed
on
the
thre
e pa
inte
d la
yers
(whi
te, b
lack
and
red)
of t
he fr
agm
ents
from
the
Chu
rch
of S
anta
Mar
ia d
el B
osco
(Nis
cem
i, Si
cily
). Th
e LI
BS
spec
tra o
f the
cha
ract
eris
tic c
hem
ical
ele
men
ts a
s in
crea
sing
the
lase
r sho
ts
num
ber
are
disp
laye
d; in
par
ticul
ar, t
he r
esul
ts r
elat
ive
to V
I an
d X
V s
hots
are
rep
orte
d. T
he a
ssig
nmen
t of
mai
n el
emen
t lin
es is
m
arke
d. In
par
ticul
ar, t
hey
are
rela
ted
to: C
a, F
e, N
a an
d K
for t
he w
hite
laye
r (I c
olum
n); C
a, F
e, N
a an
d M
n fo
r the
bla
ck la
yer (
II
colu
mn)
; Ca,
Fe,
Na
and
K fo
r the
red
laye
r (II
I col
umn)
. In
each
spec
trum
a c
ompa
rison
resp
ect t
o th
e pr
epar
atio
n la
yer i
s rep
orte
d.

Periodico di Mineralogia (2015), 84, 3A (Special Issue), 569-589 M.F. Alberghina et al.582
of the suggested GPD and GPW values, the instrumental parameters (Laser Energy, 11.5 J; GPD, 1.5 ms and GPW, 2.5 ms) above selected for detecting Hg in the cinnabar sample, have been used for the subsequent LIBS measurements on the red pictorial layer under investigation. The comparison (see Figure 13) between the LIBS spectrum, acquired with the previous parameters (Laser Energy, 11.5 J; GPD, 0.4 ms and GPW, 0.5 ms), confirms the Hg detection efficiency of the new experimental parameters that allow to
Figure 5. Depth profiles of Mn (triangles), Fe (squares) and Ca (empty circles) intensity ratios vs the LIBS measurement sequence (3 laser shots for each sequence) in: a) black and b) red layers, respectively.
Figure 6. XRF spectra of the P1, P2 and P3 samples: a) red layer (P1_red layer); b) golden layer (P2_gilding) and preparation layer (P2_preparation) and c) fragment of gold leaf (P3_gilding).
a)
a)
b)
b)
c)

Periodico di Mineralogia (2015), 84, 3A (Special Issue), 569-589 LIBS and XRF analysis for a stratigraphic… 583
Figure 7. LIBS spectra, acquired with 11.5 J laser energy value on the golden layer in P2 under the red one. Instrumental parameters: GPD 0.4 ms and GPW 0.5 ms (dotted dashed line); GPD 1.5 ms and GPW 2.5 ms (gray line).
Figure 8. a) LIBS spectra, in the 438 ÷ 441 nm spectral range, acquired with different temporal parameters: GPD 0.4 ms and GPW 0.5 ms (grey line); GPD 1.5 ms, and GPW 2.5 ms (black line) on red layer over the golden one in the P2 sample. b) XRF spectrum acquired on the same area investigated by the LIBS.
a) b)
Periodico di Mineralogia (2015), 84, 3A (Special Issue), 569-589 M.F. Alberghina et al.584
Figure 9. a) LIBS spectra (laser energy, 11.5 J; GPD, 0.4 ms and GPW 0.5ms) acquired on: a cinnabar mineral (red line) and the red layer of the P1 sample (black line); b) XRF spectrum of cinnabar mineral, the Hg La,b,g and Fe and Ca Ka are assigned.
Figure 10. Variations of the Hg line intensities with flash lamp laser energy: a) 404.6 nm and b) 435.83 nm, respectively. The error bars represent the standard deviation.
Table 3. Intensity ratios values of the Hg (I) lines, displayed in Figure 10, for particular GPW values. The standard deviation is indicated with s. Last column lists the relative adherence of the experimental ratios to the theoretical ones |D| calculated by following eq. 2.
GPW [ms] (I1/I2)meas. ± s |D|
1.0 2.49 ± 0.20 0.2101.5 2.07± 0.38 0.0032.0 1.98± 0.40 0.0382.5 1.98± 0.05 0.0395.0 1.72± 0.17 0.164
10.0 1.85± 0.13 0.102
a) b)
a) b)

Periodico di Mineralogia (2015), 84, 3A (Special Issue), 569-589 LIBS and XRF analysis for a stratigraphic… 585
Figure 11. Transition probabilities ratios both theoretical and experimental values for the Hg emission lines during the plasma decay with varying GPW values.
Figure 12. Variations of the Hg line intensities with Gate Pulse Window (GPW) value: a) for 404.6 nm and b) 435.83 nm, respectively. The error bars represent the standard deviation on 3 independent measurements.
a) b)

Periodico di Mineralogia (2015), 84, 3A (Special Issue), 569-589 M.F. Alberghina et al.586
reveal also the Hg (I) 435.83 nm line, despite the thin thickness of the layer.
These findings indicate the possibility to improve the LIBS measurement procedures by investigating only a single element as a marker for the studied pictorial layer. It is worth to note that the differences in the LIBS limit of detection (LOD) of the same element in different matrices can be correlated with the compatibility of the physical properties of the elements existing in the same matrix such as shown for the Hg in pictorial layer and mineral bulk (Ismail et al., 2004).
Conclusion
The practical usefulness of the joint use of XRF and LIBS is here illustrated by means of
some examples from mural paintings consisting in fragments of detached pictorial materials.
In particular, the results of this work concern, the X-Ray fluorescence identification of the chemical elements and the study of their distribution along the thicknesses of pictorial layers. In the case of mural paintings fragments detached from painted vault of Church of Santa Maria del Bosco, the acquired XRF spectra show the presence of following chemical elements: i) Ca and Fe in the red layer that can be identified probably as red ochre; ii) Mn and Fe in the black layer probably identifiable as manganese black; iii) K, Ca, Ti and Fe detected in the white layer that for this reason is probably constituted by calcium carbonate. All the painted layers are spread on a preparation one made up gypsum as well explained by the presence of Si, Ca and Fe.
Figure 13. LIBS spectra, acquired on the red pictorial layers with 11.5 J laser energy and: (upper panel) GPD, 1.5 ms and GPW, 2.5 ms; (bottom panel) GPD 0.4 ms and GPW, 0.5 ms.

Periodico di Mineralogia (2015), 84, 3A (Special Issue), 569-589 LIBS and XRF analysis for a stratigraphic… 587
The comparisons of the above results with LIBS spectra acquired on the same samples, have demonstrated that the presence of such elements identified as chromophores, Mn for example, belong to pictorial layer and not to preparation one.
The second typology of investigated samples consists in mural fragments from the central vault of the formerly City Library (private property Niscemi, Sicily). Also in this case, the XRF acquired on the red painted layer, gilding and preparation layer show the presence of different chemical elements: i) Ca, Fe, Hg and Pb in the red layer comparable with a mixture of cinnabar and red ochre; ii) Ca and Pb characterize the preparation layer, identifiable as a gypsum coat; and iii) Au and Pb characteristic of gilding layer. The high counts of Pb in each painting layer suggest the presence of mixtures with a lead-based pigment, such as lead white or read lead, that are not univocally identifiable with the XRF technique.
The usefulness of the gleaned information demonstrate the effectiveness of the LIBS in the stratigraphic analysis of pictorial multilayer structure and the needed of an integrated approach using a supplementary analytical technique such as XRF spectrometry, for overcoming the instrumental limits in the elemental detection and in the investigable thicknesses.
This methodological approach, although micro - destructive, avoids the sampling necessity allowing through the LIBS a stratigraphic analysis with high spatial resolution and accuracy of the sample point localization.
Our LIBS investigations have widely confirmed the well-known dependence of LIBS compositional analysis, on the drawbacks due to the plasma formation, such as the non-spatial homogeneity and the instability of the stoichiometric ratios between ablated surface and plasma. Only for one case study it has been possible, indeed, to analyze the thickness
stratigraphy from pictorial surface up to the preparation layer. The capability of the LIBS to carry out stratigraphic investigations has been so validated by the possibility to perform XRF analysis of detached samples also on the layer of preparation. Moreover, the XRF investigations have supported the LIBS analyses in the detection of chemical elements characteristic of the pictorial layer, by addressing the setting of the LIBS parameters ad hoc.
The matrix effect is evidenced by the strong dependence of the atomic emission spectra on the variation of the chemical composition of the sample in which the element (mercury in our case) is embedded.
The optimization of the LIBS and XRF measurement parameters in the pictorial materials investigation and in particular for the Hg detection, has shown the advantages attained by the integration of results from the two techniques of elemental analysis. Nevertheless, further efforts should be directed to the identification of LIBS optimal parameters (laser energy, GPD, GDW), taking into account the many variables (sample thickness, chemical matrix, plasma properties) affecting the LIBS signal. The authors are already working towards this goal.
Acknowledgements
The authors wish to thank Arch. Maria Grazia Spinello and Arch. Maurizio Vicari - ARCHING, Niscemi (CL) - for providing pictorial samples and for the technical collaboration.
References
Alberghina M.F., Barraco R., Brai M., Pellegrino L., Prestileo F., Schiavone S. and Tranchina L. (2013) - Gilding and pigments of Renaissance marble of Abatellis Palace: non-invasive investigation by XRF spectrometry. X-Ray Spectrometry, 42, 68-78.
Alberghina M.F., Barraco R., Brai M., Schillaci T.

Periodico di Mineralogia (2015), 84, 3A (Special Issue), 569-589 M.F. Alberghina et al.588
and Tranchina L. (2011a) - Integrated analytical methodologies for the study of corrosion processes in archaeological bronzes. Spectrochimica Acta Part B: Atomic Spectroscopy, 66, 129-137.
Alberghina M.F., Barraco R., Brai M., Schillaci T. and Tranchina L. (2011b) - Comparison of LIBS and m-XRF measurements on bronze alloy for monitoring plasma effects. Journal of Physics: Conference Series, 275, 1-11.
Alberghina M.F., Barraco R., Brai M., Schillaci T. and Tranchina L. Double laser LIBS and micro-XRF spectroscopy applied to characterize materials coming from the Greek-Roman theater of Taormina. Proceedings of SPIE - The International Society for Optical Engineering, 7391-7397.
Angeli L., Arias C., Cristoforetti G., Fabbri C., Legnaioli S., Palleschi V., Radi G., Salvetti A. and Tognoni E. (2006) - Spectroscopic Techniques Applied to the Study of Italian Painted Neolithic Potteries. Laser Chemistry, Article ID 61607, 7 pages, DOI:10.1155/2006/61607.
Anglos D., Couris S. and C. Fotakis (1997) - Laser Diagnostics of Painted Artworks: Laser-Induced Breakdown Spectroscopy in Pigment Identification. Applied Spectroscopy, 51, 1025-1030.
Arafat A., Na’es M., Kantarelou V., Haddad N., Giakoumaki A., Argyropoulos V., Anglos D. and Karydas A.G. (2013) - Combined in situ micro-XRF, LIBS and SEM-EDS analysis of base metal and corrosion products for Islamic copper alloyed artefacts from Umm Qais museum, Jordan. Journal of Cultural Heritage, 14, 261-269.
Barbini R., Colao F., Lazic V., Fantoni R., Palucci A. and Angelone M. (2002) - On board LIBS analysis of marine sediments collected during the XVI Italian campaign in Antarctica. Spectrochimica Acta Part B: Atomic Spectroscopy, 57, 1203-1218.
Brai M., Gennaro G., Schillaci T. and Tranchina L. (2009) - Double pulse laser induced breakdown spectroscopy applied to natural and artificial materials from cultural heritages: A comparison with micro-X-ray fluorescence analysis. Spectrochimica Acta Part B: Atomic Spectroscopy, 64, 1119-1127.
Bronk H., Röhrs S., Bjeoumikhov A., Langhoff N., Schmalz J., Wedell R., Gorny H.E., Herold A. and Waldschläger U. (2001) - ArtTAX - a new mobile spectrometer for energy-dispersive micro X-ray fluorescence spectrometry on art
and archaeological objects. Journal of Analytical Chemistry, 371, 307-316.
Bruder R., Menut D., Detalle V. (2007) - Effects of LIBS Measurement Parameters on Wall Paintings Pigments Alteration and Detection. In: Lasers in the Conservation of Artworks Springer proceedings in physics, 116, 367-375.
Burakov V.S., Tarasenko N.V., Nedelko M.I., Kononov V.A., Vasilev N.N. and Isakov S.N. (2009) - Analysis of lead and sulfur in environmental samples by double pulse laser induced breakdown spectroscopy. Spectrochimica Acta Part B: Atomic Spectroscopy, 64, 141-146.
Castillejo M., Martin M., Oujja M., Silva D., Torres R., Domingo C. and Sánchez-Cortés S. (2001) - Spectroscopic analysis of pigments and binding media of polychromes by the combination of optical laser-based and vibrational techniques. Applied Spectroscopy, 55(8), 992-998.
Colao F., Fantoni R., Lazic V., Paolini A., Fabbri F., Ori G.G., Marinangeli L. and Baliva A. (2004) - Investigation of LIBS feasibility for in situ planetary exploration: an analysis on Martian rock analogues. Planetary and Space Science, 52, 117-123.
Colombo C., Bracci S., Conti C., Greco M. and Realini M. (2011) - Non-invasive approach in the study of polychrome terracotta sculptures: employment of the portable XRF to investigate complex stratigraphy. X-Ray Spectrometry, 40, 273-279.
Fontana D., Alberghina M.F., Barraco R., Basile S., Tranchina L., Brai M., Gueli A. and Troja S.O. (2014) - Historical pigments characterisation by quantitative X-ray fluorescence. Journal of Cultural Heritage, 15, 266-274.
Griem H.R. (1964) - Plasma Spectroscopy. Mc Graw Hill Book Co., Inc., New York, USA.
Giakoumaki A., Melessanaki K. and Anglos, D. (2007) - Laser-induced breakdown spectroscopy (LIBS) in archaeological science-applications and prospects. Analytical and bioanalytical chemistry, 387(3), 749-760.
Handbook of basic Atomic Spectroscopic data, NIST - http://www.physics.nist.gov.
Herrera K., Tognoni E., Omenetto N., Gornushkin I.B., Smith B.W. and Winefordner J.D. (2009) - Comparative study of two standard-free approaches in laser-induced breakdown spectroscopy as

Periodico di Mineralogia (2015), 84, 3A (Special Issue), 569-589 LIBS and XRF analysis for a stratigraphic… 589
applied to the quantitative analysis of aluminum alloy standards under vacuum conditions. Journal of Analytical Atomic Spectroscopy, 24, 426-438.
Ismail M.A., Imam H., Elhassan A., Youniss W.T. and Harith M.A. (2004) - LIBS limit of detection and plasma parameters of some elements in two different metallic matrices. Journal of Analytical Atomic Spectrometry, 19, 489-494.
Kantarelou V., Zarkadas Ch., Giakoumaki A., Giannoulaki M., Karydas A.G., Anglos D. and Argyropoulos V. (2007) - METAL-07, 2, Innovative investigation of metal artifacts, 35-40.
Kriznar A., Munoz V., de la Paz F., Respaldiza M. A. and Vega M. (2011) - Portable XRF study of pigments applied in Juan Hispalense’s 15th century panel painting. X-Ray Spectrometry, 40, 96-100.
Osticioli A.I., Wolf M and Anglos D. (2008) - An optimization of parameters for application of a laser-induced breakdown spectroscopy microprobe for the analysis of works of art. Applied Spectroscopy, 62, 1242-1249.
Marsiano A. (1995) - Geografia antropica, Ed. Lussografica, Caltanissetta.
Mateo M.P., Ctvrtnickova T. and Nicolas G. (2009) - Characterization of pigments used in painting by means of laser-induced plasma and attenuated total reflectance FTIR spectroscopy. Applied Surface Science, 255(10), 5172-5176.
Reader J. and Corlis C.H. (1980) - Part. I Wavelenghts - W.L. Wiesse, G.A. Martin. Part. II Transition Probabilities. Wavelenghts and Transition Probabilities for atoms and atomic ions, National Standard Reference Data System-National Bureau of Standards, Washington, USA.
Sansonetti J.E. and Martin W.C. (2005) - Handbook of basic spectroscopic data. Journal of Physical and Chemical Reference Data, 34, 1559-2259.
Tognoni E., Cristoforetti G., Legnaioli S. and Palleschi V. (2010) - Calibration-Free Laser-Induced Breakdown Spectroscopy: State of the art. Spectrochimica Acta Part B: Atomic Spectroscopy, 65, 1-14.
West M., Ellis A.T., Potts P.J., Streli C., Vanhoof C., Wegrzynek D. and Wobrauschek P. (2010) - Atomic spectrometry update-X-ray fluorescence spectrometry. Journal of Analytical Atomic Spectrometry, 25, 1503-1545.
Submitted, January 2015 - Accepted, May 2015