licensed practical nurses - cihi · cihi 2007 workforce trends of licensed practical nurses in...
TRANSCRIPT

Workforce Trends ofLicensed PracticalNurses in Canada, 2006
H e a l t h H u m a n R e s o u r c e s D a t a b a s e
LICENSED PRACTICAL NURSES

All rights reserved.
No part of this publication may be reproduced or transmitted in any form or by any
means, electronic or mechanical, including photocopying and recording, or by any
information storage and retrieval system now known or to be invented, without the prior
permission in writing from the owner of the copyright, except by a reviewer who wishes
to quote brief passages in connection with a review written for inclusion in a magazine,
newspaper or broadcast.
Requests for permission should be addressed to:
Canadian Institute for Health Information
495 Richmond Road
Suite 600
Ottawa, Ontario
K2A 4H6
Phone: 613-241-7860
Fax: 613-241-8120
www.cihi.ca
ISBN 978-1-55465-130-6 (PDF)
© 2007 Canadian Institute for Health Information
How to cite this document:
Canadian Institute for Health Information, Workforce Trends of Licensed Practical Nurses
in Canada, 2006 (Ottawa: CIHI, 2007).
Cette publication est aussi disponible en français sous le titre Tendances de la
main-d��uvre des infirmières et infirmiers auxiliaires autorisés au Canada, 2006
ISBN 978-1-55465-131-3 (PDF)
Workforce Trends of Licensed Practical Nurses in Canada, 2006
Table of Contents
Preface .................................................................................................................. iii
Acknowledgements ................................................................................................. v
Introduction ............................................................................................................ 1
Highlights of the LPN Workforce................................................................................ 3
Data Analysis.......................................................................................................... 5
Methodological Overview..................................................................................... 5
Note to Readers ................................................................................................. 6
Supply of Licensed Practical Nurses ...................................................................... 8 Demographic Trends of Licensed Practical Nurses ................................................. 13 Education Trends of Licensed Practical Nurses...................................................... 19 Employment Trends of Licensed Practical Nurses .................................................. 23 Mobility Trends of Licensed Practical Nurses ........................................................ 31
Methodological Notes............................................................................................. 39
Background...................................................................................................... 39
Data Coverage ................................................................................................. 40
Data Collection Methods.................................................................................... 46
Data Quality Assessment................................................................................... 53
LPN Workforce Products and Services ................................................................. 64
Provincial/Territorial Profiles .................................................................................... 65
Appendix A—Identification of Secondary Registrations ............................................... 81
Appendix B—Comparison of CIHI Statistics to Regulatory Statistics ............................. 85
Appendix C—Licensed Practical Nursing Contact Information ...................................... 99
Appendix D—List of Data Tables Available on the CIHI Website................................. 103
References ......................................................................................................... 113

Workforce Trends of Licensed Practical Nurses in Canada, 2006
List of Data Tables Available on the CIHI Website (www.cihi.ca/nurses)
Series A—Total Registrations
Series B—Employment Status
Series C—Place of Work
Series D—Area of Responsibility
Series E—Position
Series F—Multiple Employment Status
Series G—Sex
Series H—Location of Graduation
Series I—Years Since Graduation
Please refer to Appendix D for a complete list of data tables available on the CIHI website.
CIHI 2007 Workforce Trends of Licensed Practical Nurses in Canada, 2006
Licensed Practical Nurses Database iii
Preface The Canadian Institute for Health Information (CIHI) collects and analyzes information on health and health care in Canada and makes it publicly available. Canada’s federal, provincial and territorial governments created CIHI as a not-for-profit, independent organization dedicated to forging a common approach to Canadian health information. CIHI’s goal: to provide timely, accurate and comparable information. CIHI’s data and reports inform health policies, support the effective delivery of health services and raise awareness among Canadians of the factors that contribute to good health.
To meet this mandate, CIHI’s core functions include the coordination and promotion of national health information standards and health indicators, the development and management of health databases and registries, the funding and facilitation of population health research and analysis, the coordination and development of education sessions and conferences, and the production and dissemination of health information research and analysis.
The Licensed Practical Nurses Database (LPNDB) is one example of a health database maintained by CIHI. Any questions or requests regarding this publication or the Licensed Practical Nurses Database should be directed to:
Program Lead, Nursing Databases Canadian Institute for Health Information 495 Richmond Road, Suite 600 Ottawa, Ontario K2A 4H6
Phone: 613-241-7860 Fax: 613-241-8120 Email: [email protected] Website: www.cihi.ca/nurses


CIHI 2007 Workforce Trends of Licensed Practical Nurses in Canada, 2006
Licensed Practical Nurses Database v
Acknowledgements The Canadian Institute for Health Information (CIHI) wishes to acknowledge and thank the following individuals for their contribution to Workforce Trends of Licensed Practical Nurses in Canada, 2006:
• Andrea Porter-Chapman, Program Lead, CIHI
• Lori Kirby, Senior Analyst, CIHI
• Robert Pelletier, Senior Analyst, CIHI
• Ryanna Brown, Analyst, CIHI
• Tiffany Semple, Analyst, CIHI
• Luc Turcotte, Analyst, CIHI
• Wendy Lin, Coop Student, CIHI
CIHI would also like to thank the following associations/colleges/councils, without their effort, commitment and collaboration, a national licensed practical nurse database could not exist:
• Council for Licensed Practical Nurses of Newfoundland and Labrador;
• Prince Edward Island Licensed Practical Nurses Registration Board;
• College of Licensed Practical Nurses of Nova Scotia;
• Association of New Brunswick Licensed Practical Nurses / Association des infirmières et infirmiers auxiliaires du Nouveau-Brunswick;
• Ordre des infirmières et infirmiers auxiliaires du Québec;
• College of Nurses of Ontario / Ordre des infirmières et infirmiers de l’Ontario;
• College of Licensed Practical Nurses of Manitoba;
• Saskatchewan Association of Licensed Practical Nurses;
• College of Licensed Practical Nurses of Alberta;
• College of Licensed Practical Nurses of British Columbia;
• Yukon Licensed Practical Nurses, Yukon Government; and
• Northwest Territories Licensed Practical Nurses, Department of Health and Social Services, Government of Northwest Territories.
We wish to extend our thanks and gratitude to all licensed practical nurses caring for and improving the lives of Canadians.
Please note that the analyses and conclusions in the present document do not necessarily reflect those of the individuals or organizations mentioned above.

CIHI 2007 Workforce Trends of Licensed Practical Nurses in Canada, 2006
Licensed Practical Nurses Database 1
Introduction The Health Human Resources team of the Canadian Institute for Health Information (CIHI) is pleased to present Workforce Trends of Licensed Practical Nurses in Canada, 2006. This is the fifth annual publication produced by CIHI on the supply of the Licensed Practical Nurse (LPN) workforce.
The supply information contained in the Licensed Practical Nurses Database (LPNDB) is one key component to health human resource planning. An investigation into the number of health professionals required for a jurisdiction must begin with an understanding of the current supply, and how that supply is changing.
The LPNDB was developed by CIHI and the regulatory authorities for licensed practical nursing for the 2002 data year to complement similar databases on the registered nurse and registered psychiatric nurse workforces. Previously, only minimal information was available on the LPN workforce in Canada. With these three nursing databases, CIHI is able to report workforce statistics for all regulated nurse professionals in Canada. The presentation of clear, objective data and data analysis enables informed decision-making and supports policy formulation.
CIHI has again released the latest licensed practical nurse, registered nurse and registered psychiatric nurse statistics simultaneously. The annual publications for each profession have been standardized as much as possible to allow for cross-profession analyses. With this publication format, CIHI continues to view regulated nursing professionals as both a single group with common challenges and as three distinct professions with separate histories and unique challenges.
This year’s printed publication includes:
• Highlights for the LPN workforce;
• A data analysis section with a comparison of 2003 and 2006 LPN data;
• A comprehensive methodological notes section; and
• A detailed examination of the discrepancy between CIHI statistics and year-end statistics published by each LPN regulatory authority.
For the second time, CIHI will be presenting information on the entire regulated nursing workforce in Canada in the accompanying summary report, Highlights From the Regulated Nursing Workforce in Canada, 2006.

Workforce Trends of Licensed Practical Nurses in Canada, 2006 CIHI 2007
2 Licensed Practical Nurses Database
This companion report includes:
• National, provincial and territorial highlights for the entire regulated nursing workforce;
• An analysis section with statistics presented on the nursing workforce in each of Canada’s health regions; and
• Summary data tables with 2006 licensed practical nurse (LPN), registered nurse (RN), and registered psychiatric nurse (RPN) data (also available on the CIHI website at www.cihi.ca/nurses).
It is our hope that these reports provide a solid foundation for the work of those with an interest in nursing resources in Canada.
CIHI 2007 Workforce Trends of Licensed Practical Nurses in Canada, 2006
Licensed Practical Nurses Database 3
Highlights of the LPN Workforce This is the fifth year of data collection and the fifth Workforce Trends of Licensed Practical Nurses publication. This report highlights licensed practical nurse (LPN) workforce issues and helps to underline the need for further data development relevant to the management of nursing resources. These data are used to support current and future work in health human resources planning, policy development and research.
Licensed practical nursing is a distinct regulated nursing profession; LPNs are educated and regulated separately from other nursing professionals in all thirteen provinces/territories of Canada.
Supply of the LPN Workforce
• Between 2005 and 2006, the number of LPNs employed in practical nursing increased by 3.6%, from 64,951 to 67,300.
• In 2006, 73.5% of the LPN workforce lived in urban areas of Canada, ranging from a high of 100.0% in Yukon to a low of 41.3% in Northwest Territories.
• Of the 115 LPNs currently working outside of Canada (and maintaining a Canadian licence), 81.7% (94) are employed in the United States, with an additional 18.3% (21) employed in other countries such as the United Kingdom, Hong Kong and Australia.
Demographic Trends of the LPN Workforce
• Females comprise 93.0% of the workforce. The proportion of male LPNs employed in practical nursing was 7.0% in 2006.
• Among the provinces, the highest proportion of male LPNs is in Newfoundland and Labrador, where male LPNs comprised 12.6% of the workforce, 5.6 percentage points higher than the Canadian average.
• Each jurisdiction had a greater percentage of LPNs over the age of 50 than under the age of 35. For example, the percentage of LPNs over the age of 50 in Ontario and Manitoba was 39.3% and 40.2%, respectively.
• The average age of LPNs employed in practical nursing in Canada was 44.1 years in 2006.
• Taking into consideration typical retirement age, in 2006, 19.0% of Canada’s LPN workforce was aged 55 years old or greater, with 6.3% aged 60 or greater. Northwest Territories had the smallest percentage of nurses over the age of 55, at 15.2%. Manitoba had the most with 22.9% of its LPN workforce aged 55 or older.
Education Trends of the LPN Workforce
• Among the 2006 workforce, the average age of LPNs at the time of their initial nursing graduation ranged from 23.3 years for those graduating between 1980 and 1984 to 30.9 years for those graduating since the year 2000.
Workforce Trends of Licensed Practical Nurses in Canada, 2006 CIHI 2007
4 Licensed Practical Nurses Database
Employment Trends of the LPN Workforce
• Just under half (46.5%) of the LPN workforce worked in full-time positions, with 17.1% on a casual basis. The percentage of LPNs with part-time has increased since 2003 from 34.9% to 35.6%.
• Casual rates varied widely among the provinces/territories in 2006, from a low of 9.1% in Ontario to a high of 39.1% in Newfoundland and Labrador.
• In 2006, 16.5% of LPNs reported having more than one employer in practical nursing.
• The area of responsibility with the most LPNs, geriatrics/long-term care (30,484), also attracted the most recent graduates. In 2006, 47.1% of LPNs in their first five years of practical nursing worked in geriatrics/long-term care, the highest rate.
• The average age of LPN managers was 46.6 years in 2006, compared to an average age of 43.9 years for LPN staff nurses.
Mobility Trends of the LPN Workforce
• Of the 50,168 LPNs employed in practical nursing in Canada who reported their Location of Graduation in 2006, 97.5% (48,936) graduated from a practical nursing program in Canada and 2.5% (1,232) graduated from an international nursing program.
• In 2006, the LPN workforces of British Columbia (3.4%) and Ontario (3.3%) had the highest concentration of internationally educated graduates.
• More than 10 percent of the LPN workforces of Saskatchewan (18.6%), British Columbia (17.2%), and Alberta (13.4%) graduated from other provinces/territories in Canada.
• Among Canadian graduates in the 2006 LPN workforce (excluding Quebec where data are not available), those graduating from practical nursing programs in Ontario (97.0%) British Columbia (95.5%), and New Brunswick (93.6%) were the most likely to be employed in their province of graduation.

CIHI 2007 Workforce Trends of Licensed Practical Nurses in Canada, 2006
Licensed Practical Nurses Database 5
Data Analysis Methodological Overview The data and information presented in this publication are from the Licensed Practical Nurses Database. This database is maintained by the Canadian Institute for Health Information (CIHI).
To practise as a licensed practical nurse in Canada, annual registration with the respective provincial/territorial regulatory authority is mandatory. This requires the completion of a registration form.
The annual registration form is the property of the provincial/territorial regulatory authorities. They are the owners of the registration form and its content. However, through an agreement with CIHI, there exists a standardized set of questions that each regulatory authority includes on their provincial/territorial registration form. These questions pertain to the demographic, education/training and employment characteristics of the licensed practical nurse.
The regulatory authorities are responsible for administering the registration form annually. When the completed forms are returned from the licensed practical nurses, the data are entered into databases by the regulatory authority.
Under the agreement with CIHI, a portion of this information is submitted to CIHI once per year. CIHI and the regulatory authorities jointly review and scrutinize the new data, applying the principles of data quality. Once the data are complete, CIHI adds the new data to the multi-year LPN database for analysis and reporting.
The Methodological Notes in this publication provide more detail into CIHI’s review process, and highlight any observed changes in data trends. While this information may be exhaustive, it is important for readers to understand how the data are collected, reviewed and reported by CIHI. This is particularly true for two reasons: first, the statistics reported by CIHI will differ from the statistics reported by the regulatory authorities, even though the source of the data (the annual registration forms) is the same. Second, changes in the registration forms can impact trends in the data; CIHI aims to highlight and explain these unexpected “jumps” in the data.
Any questions regarding the methodology may be sent to [email protected].
Workforce Trends of Licensed Practical Nurses in Canada, 2006 CIHI 2007
6 Licensed Practical Nurses Database
Note to Readers 1. The terms regulated nursing workforce and nursing workforce are used in this
publication and accompanying documents to include members of the licensed practical nurse, registered nurse and registered psychiatric nurse workforces. The term LPN workforce includes only licensed practical nurses who were employed in practical nursing at the time of annual registration.
2. The statistics presented in this publication, and on the CIHI website, have been reviewed and authorized for release by representatives of the provincial/territorial licensed practical nursing associations/colleges/councils responsible for the regulation and licensure of licensed practical nurses in Canada.
3. CIHI statistics will not be the same as statistics published by provincial/territorial licensed practical nursing regulatory authorities for the following reasons:
i. Collection Period—The statistics released by provincial/territorial authorities are year-end statistics that include all registrations received during the 12-month registration period. In contrast, CIHI collects data after the first six months of the 12-month registration period, in an effort to ensure timely information. Although the resulting under-coverage is typically only 1–5%, the statistics released by CIHI are less than provincial/territorial statistics.
ii. Differences in Definition—Regulatory authorities typically report the total number of “Active” registrations received during the registration year. An Active registration enables the LPN to work in that jurisdiction, but does not distinguish between those employed in practical nursing and those not employed in practical nursing: the Active total represents the maximum number of LPNs eligible to work in a particular jurisdiction in that year. In contrast, CIHI divides the Active total into four categories: “Employed in Practical Nursing,” “Employed in Other Than Practical Nursing,” “Not Employed” and “Not Stated.” LPNs employed in other than practical nursing, LPNs not employed, and LPNs failing to state their employment status are removed from most CIHI analyses.
iii. Exclusions From CIHI Data—CIHI statistics do not necessarily include (a) practical nurses who are on maternity/paternity leave (or other types of leave) at the time of annual registration; and (b) first-time registrants (whether new graduates or those entering from other provinces/territories or countries). In each case, these LPNs may be included in statistics published by provincial/territorial regulatory authorities.
iv. CIHI Editing and Processing—The CIHI database is not an amalgamation of provincial/territorial data. When data files are submitted, CIHI removes from analysis records that do not reflect the primary jurisdiction of employment. This is done so that CIHI can accurately determine the size of the LPN workforce in Canada. Provincial/territorial associations typically do not identify or remove these secondary registrations (also termed “interprovincial duplicates”).
CIHI 2007 Workforce Trends of Licensed Practical Nurses in Canada, 2006
Licensed Practical Nurses Database 7
v. Provincial/Territorial Data Cleaning—Some jurisdictions review the registration data at year-end and “clean” potential data quality issues. As CIHI receives the data at the six-month mark, this cleaning has not yet occurred. Therefore, if a jurisdiction reduces the number of “Not Stated” records in a particular field, that correction will not be reflected in the CIHI database.
4. CIHI and the provincial/territorial regulatory authorities are continually working to improve data quality, which may impair comparability with historical data.
5. In this publication and accompanying data tables, the “Canada” total excludes Nunavut data. CIHI does not currently collect LPN data from Nunavut.
6. The data presented in this publication are self-reported, which may result in higher than expected “Other” or “Not Stated” values for some data elements if a substantial proportion of LPNs chose not to complete all fields on the annual registration form.

Workforce Trends of Licensed Practical Nurses in Canada, 2006 CIHI 2007
8 Licensed Practical Nurses Database
Table 1. Number of Licensed Practical Nurses by Employment Status, Canada, 2003 to 2006
2003 2004 2005 2006Employed in Practical Nursing 63,138 63,443 64,951 67,300
Employed in Other Than Practical Nursing 2,491 2,527 2,663 2,430Not Employed 3,207 2,917 2,746 3,075Not Stated 1,568 2,394 2,059 2,163
Total 70,404 71,281 72,419 74,968
Percent Employed in Nursing 89.7 89.0 89.7 89.8 Notes:
Data for Nunavut is not collected.
CIHI data will differ from provincial/territorial statistics due to the CIHI collection, processing and reporting methodology.
The Methodological Notes provide more comprehensive information regarding the collection and comparability of LPNDB data.
Source: LPNDB, CIHI.
Supply of Licensed Practical Nurses Number of Licensed Practical Nurses This publication highlights the LPN workforce in the four-year period between 2003 and 2006, as indicated in Table 1.
The percentage of LPNs who report their employment status as ”Not Stated” has remained relatively consistent during this four-year period with 2.2% in 2003, 3.4% in 2004, 2.8% in 2005 and 2.9% in 2006. In the absence of additional information, CIHI has made the assumption in this publication that those reporting themselves as “Not Stated” are not employed in Nursing. Acknowledging that this assumption may not be entirely accurate, due to the relative consistency of the low percentage of “Not Stated” in the employment status over time, employment trends are not significantly affected. Please contact the Program Lead, Nursing Databases for more information.
Please refer to Data Tables A.LPN.1–A.LPN.2 and A. Summary, available on the CIHI website, for more LPN Registration data.

CIHI 2007 Workforce Trends of Licensed Practical Nurses in Canada, 2006
Licensed Practical Nurses Database 9
Table 2. LPN Workforce by Employment Status, Canada, 2003 to 2006
Employment Status Counts % Counts % Counts % Counts %
Employed in Practical Nursing 63,138 89.7 63,443 89.0 64,951 89.7 67,300 89.8
Not Employed in Practical NursingSeeking 1,743 2.5 1,398 2.0 1,369 1.9 1,736 2.3Not Seeking 3,955 5.6 4,046 5.7 4,040 5.6 3,769 5.0
Not Stated 1,568 2.2 2,394 3.4 2,059 2.8 2,163 2.9Total 70,404 100.0 71,281 100.0 72,419 100.0 74,968 100.0
2003 2004 20062005
Notes: Data for Nunavut is not collected.
CIHI data will differ from provincial/territorial statistics due to the CIHI collection, processing and reporting methodology.
The Methodological Notes provide more comprehensive information regarding the collection and comparability of LPNDB data.
Source: LPNDB, CIHI.
Table 3. Age Breakdown of LPNs Not Employed and Seeking Employment in Practical Nursing, Canada, 2003 to 2006
Counts % Counts % Counts % Counts %
<30 390 22.4 312 22.3 368 26.9 477 27.530–39 432 24.8 329 23.5 297 21.7 398 22.940–49 463 26.6 380 27.2 326 23.8 410 23.650–59 370 21.2 312 22.3 304 22.2 341 19.660 + 87 5.0 65 4.6 74 5.4 110 6.3
Sub-total 1,742 100.0 1,398 100.0 1,369 100.0 1,736 100.0
Not Employed in Practical NursingSeeking
2006200520042003
Notes: LPNs not stating their Year of Birth (2003, n = 1; 2004, n = 1; 2005, n = 3; 2006, n = 2) are excluded from this table.
Data for Nunavut is not collected.
CIHI data will differ from provincial/territorial statistics due to the CIHI collection, processing and reporting methodology.
The Methodological Notes provide more comprehensive information regarding the collection and comparability of LPNDB data.
Source: LPNDB, CIHI.
Number of LPNs Not Employed Between 2003 and 2006, the proportion of LPNs employed in practical nursing remained stable. In 2006, 2.3% of LPNs licensed in Canada were not employed in practical nursing but were seeking employment in practical nursing.
Of the 1,736 licensed LPNs who were seeking employment as an LPN in 2006 (Table 3), 27.5% were under 30 years of age.

Workforce Trends of Licensed Practical Nurses in Canada, 2006 CIHI 2007
10 Licensed Practical Nurses Database
Table 4. LPN Workforce by Province/Territory of Registration, Canada, 2003 to 2006
2003 2004 2005 2006 Change 2003 to 2006
N.L. 2,719 2,710 2,696 2,639 -2.9%P.E.I. 619 628 606 599 -3.2%N.S. 3,022 3,058 3,127 3,174 5.0%N.B. 2,429 2,556 2,633 2,646 8.9%Que. 14,831 15,472 16,293 17,104 15.3%Ont. 25,730 24,467 24,458 25,084 -2.5%Man. 2,417 2,415 2,590 2,652 9.7%Sask. 2,056 2,131 2,194 2,224 8.2%Alta. 4,766 5,051 5,313 5,614 17.8%B.C. 4,391 4,811 4,884 5,412 23.3%Y.T. 60 53 56 60 0.0%N.W.T. 98 91 101 92 -6.1%
Canada 63,138 63,443 64,951 67,300 6.6% Notes: CIHI data will differ from provincial/territorial statistics due to the CIHI collection, processing and reporting methodology.
Data for Nunavut is not collected.
The Methodological Notes provide more comprehensive information regarding the collection and comparability of LPNDB data.
Source: LPNDB, CIHI.
Number of LPNs Employed
Between 2003 and 2006, the number of LPNs employed in practical nursing increased by 6.6% in Canada, from 63,138 to 67,300.
The increase in the number of LPNs employed in practical nursing was not uniform across the country. British Columbia experienced the most substancial growth between 2003 and 2006, with an increase of 23.3%.Alberta (17.8%), Quebec (15.3%), Manitoba (9.7%), New Brunswick (8.9%), Saskatchewan (8.2%) and Nova Scotia (5.0%) also experienced increases. Provincial/territorial figures are presented in Table 4.
In this publication, comparisons focus more on the proportion and/or percentage distribution of the LPN workforce than the actual numbers. In some cases, comparisons are made between 2005 and 2006 data.
Please refer to Data Tables A.LPN.1–A.LPN.2 and A. Summary, available on the CIHI website, for more LPN Registration data.
CIHI 2007 Workforce Trends of Licensed Practical Nurses in Canada, 2006
Licensed Practical Nurses Database 11
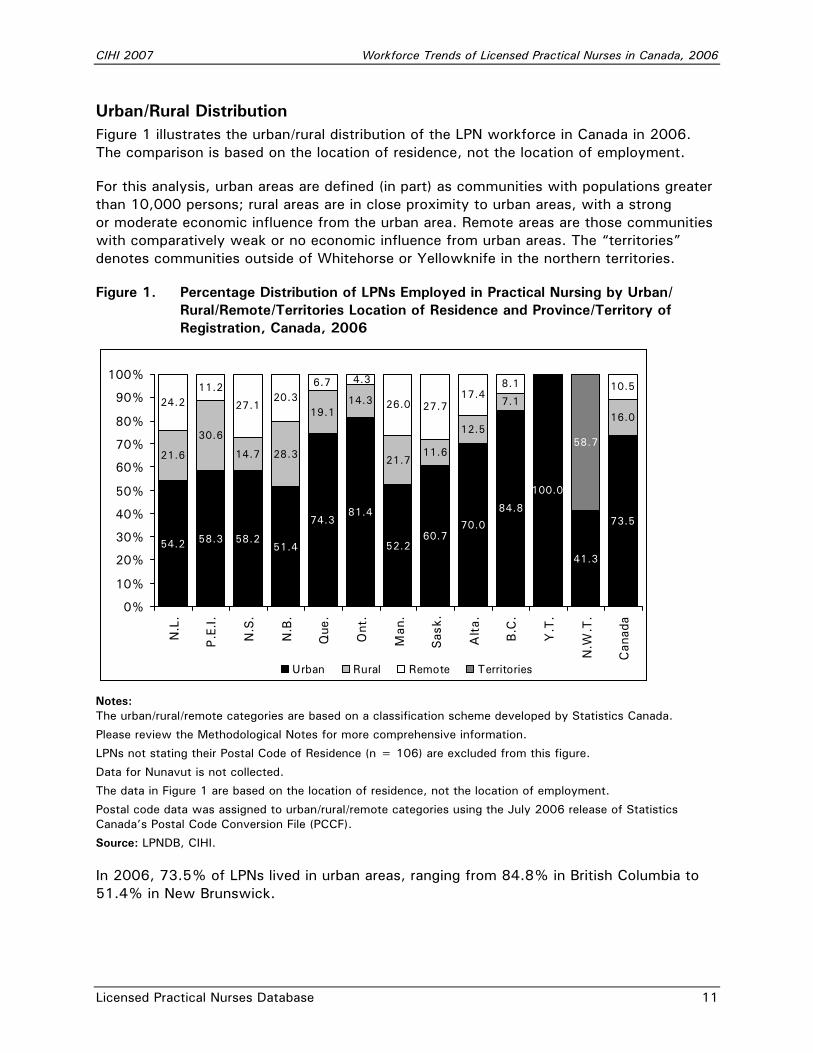
Urban/Rural Distribution Figure 1 illustrates the urban/rural distribution of the LPN workforce in Canada in 2006. The comparison is based on the location of residence, not the location of employment.
For this analysis, urban areas are defined (in part) as communities with populations greater than 10,000 persons; rural areas are in close proximity to urban areas, with a strong or moderate economic influence from the urban area. Remote areas are those communities with comparatively weak or no economic influence from urban areas. The “territories” denotes communities outside of Whitehorse or Yellowknife in the northern territories.
Figure 1. Percentage Distribution of LPNs Employed in Practical Nursing by Urban/ Rural/Remote/Territories Location of Residence and Province/Territory of Registration, Canada, 2006
73.5
41.3
100.0
84.8
70.060.7
52.2
81.474.3
51.458.258.354.2
16.07.1
21.6
30.6
14.7 28.3
19.114.3
21.711.6
12.5
10.58.1
24.211.2
27.120.3
6.7 4.3
26.0 27.717.4
58.7
0%
10%
20%
30%
40%
50%
60%
70%
80%
90%
100%
N.L
.
P.E
.I.
N.S
.
N.B
.
Que
.
Ont
.
Man
.
Sas
k.
Alta.
B.C
.
Y.T
.
N.W
.T.
Can
ada
Urban Rural Remote Territories
Notes: The urban/rural/remote categories are based on a classification scheme developed by Statistics Canada.
Please review the Methodological Notes for more comprehensive information.
LPNs not stating their Postal Code of Residence (n = 106) are excluded from this figure.
Data for Nunavut is not collected.
The data in Figure 1 are based on the location of residence, not the location of employment.
Postal code data was assigned to urban/rural/remote categories using the July 2006 release of Statistics Canada’s Postal Code Conversion File (PCCF).
Source: LPNDB, CIHI.
In 2006, 73.5% of LPNs lived in urban areas, ranging from 84.8% in British Columbia to 51.4% in New Brunswick.
Workforce Trends of Licensed Practical Nurses in Canada, 2006 CIHI 2007
12 Licensed Practical Nurses Database
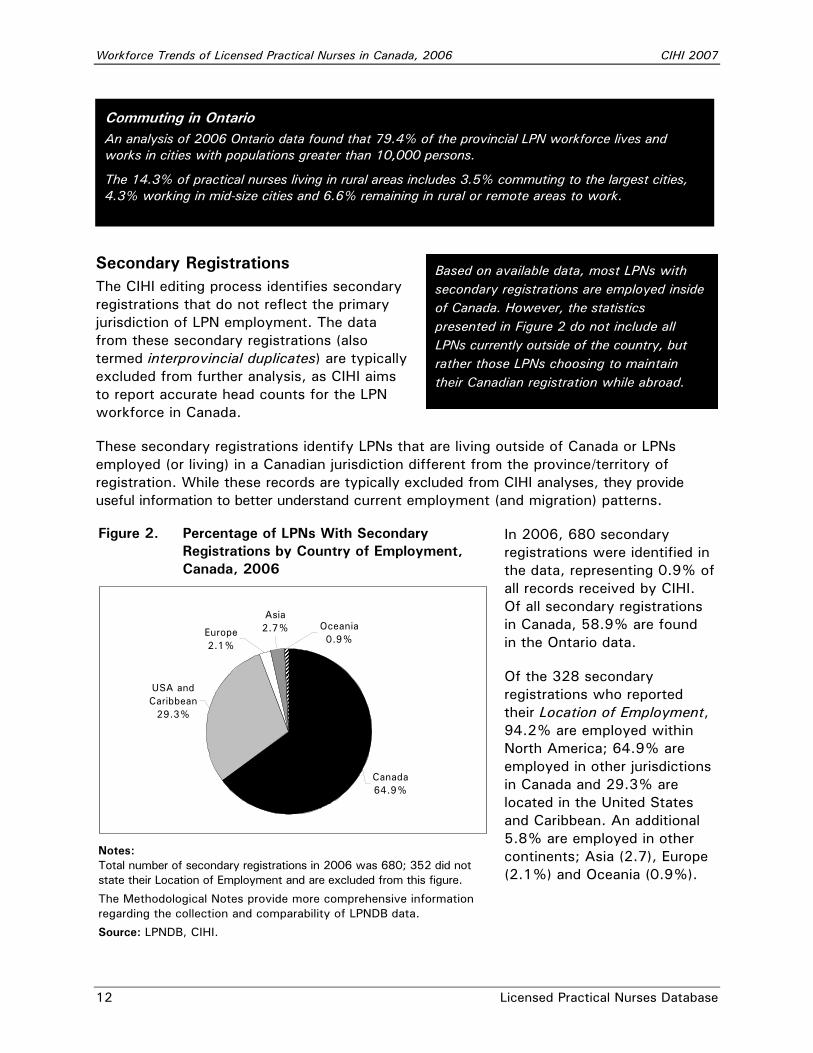
Figure 2. Percentage of LPNs With Secondary Registrations by Country of Employment, Canada, 2006
USA and Caribbean
29.3%
Asia2.7% Oceania
0.9%Europe2.1%
Canada64.9%
Notes: Total number of secondary registrations in 2006 was 680; 352 did not state their Location of Employment and are excluded from this figure.
The Methodological Notes provide more comprehensive information regarding the collection and comparability of LPNDB data.
Source: LPNDB, CIHI.
Based on available data, most LPNs with secondary registrations are employed inside of Canada. However, the statistics presented in Figure 2 do not include all LPNs currently outside of the country, but rather those LPNs choosing to maintain their Canadian registration while abroad.
Secondary Registrations The CIHI editing process identifies secondary registrations that do not reflect the primary jurisdiction of LPN employment. The data from these secondary registrations (also termed interprovincial duplicates) are typically excluded from further analysis, as CIHI aims to report accurate head counts for the LPN workforce in Canada.
These secondary registrations identify LPNs that are living outside of Canada or LPNs employed (or living) in a Canadian jurisdiction different from the province/territory of registration. While these records are typically excluded from CIHI analyses, they provide useful information to better understand current employment (and migration) patterns.
In 2006, 680 secondary registrations were identified in the data, representing 0.9% of all records received by CIHI. Of all secondary registrations in Canada, 58.9% are found in the Ontario data.
Of the 328 secondary registrations who reported their Location of Employment, 94.2% are employed within North America; 64.9% are employed in other jurisdictions in Canada and 29.3% are located in the United States and Caribbean. An additional 5.8% are employed in other continents; Asia (2.7), Europe (2.1%) and Oceania (0.9%).
Commuting in Ontario An analysis of 2006 Ontario data found that 79.4% of the provincial LPN workforce lives and works in cities with populations greater than 10,000 persons.
The 14.3% of practical nurses living in rural areas includes 3.5% commuting to the largest cities, 4.3% working in mid-size cities and 6.6% remaining in rural or remote areas to work.
CIHI 2007 Workforce Trends of Licensed Practical Nurses in Canada, 2006
Licensed Practical Nurses Database 13
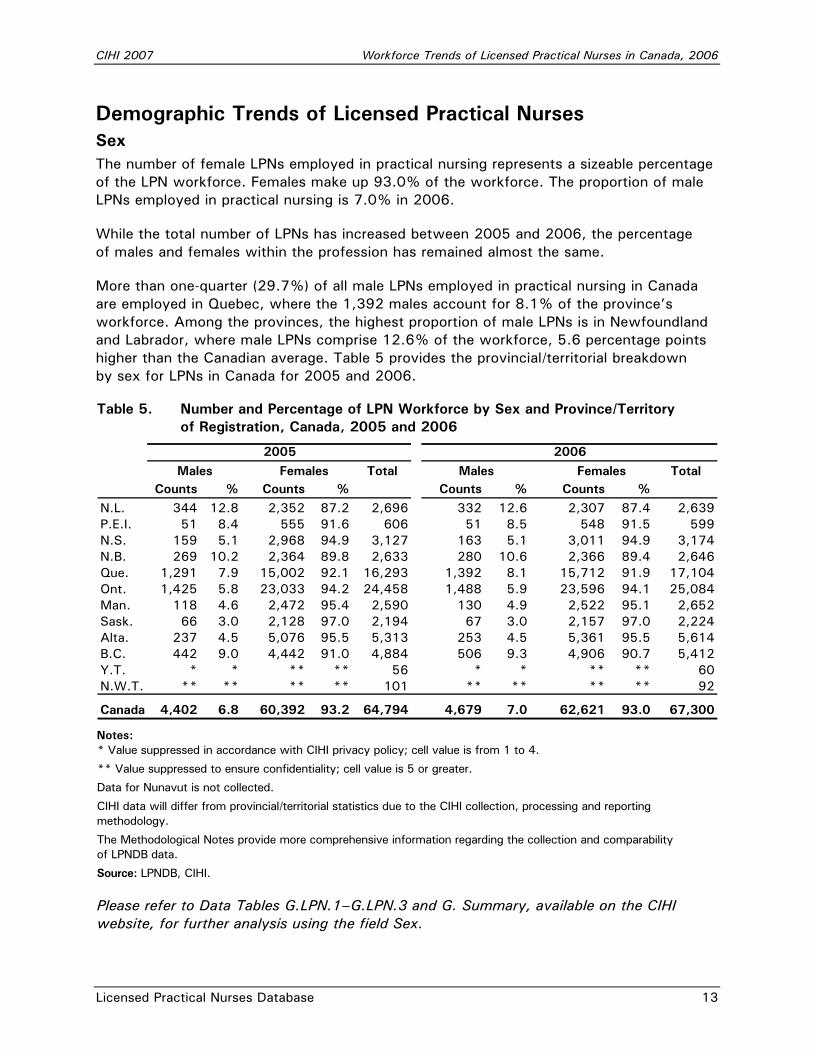
Table 5. Number and Percentage of LPN Workforce by Sex and Province/Territory of Registration, Canada, 2005 and 2006
Total TotalCounts % Counts % Counts % Counts %
N.L. 344 12.8 2,352 87.2 2,696 332 12.6 2,307 87.4 2,639P.E.I. 51 8.4 555 91.6 606 51 8.5 548 91.5 599N.S. 159 5.1 2,968 94.9 3,127 163 5.1 3,011 94.9 3,174N.B. 269 10.2 2,364 89.8 2,633 280 10.6 2,366 89.4 2,646Que. 1,291 7.9 15,002 92.1 16,293 1,392 8.1 15,712 91.9 17,104Ont. 1,425 5.8 23,033 94.2 24,458 1,488 5.9 23,596 94.1 25,084Man. 118 4.6 2,472 95.4 2,590 130 4.9 2,522 95.1 2,652Sask. 66 3.0 2,128 97.0 2,194 67 3.0 2,157 97.0 2,224Alta. 237 4.5 5,076 95.5 5,313 253 4.5 5,361 95.5 5,614B.C. 442 9.0 4,442 91.0 4,884 506 9.3 4,906 90.7 5,412Y.T. * * ** ** 56 * * ** ** 60N.W.T. ** ** ** ** 101 ** ** ** ** 92
Canada 4,402 6.8 60,392 93.2 64,794 4,679 7.0 62,621 93.0 67,300
2005 2006Males Females Males Females
Notes: * Value suppressed in accordance with CIHI privacy policy; cell value is from 1 to 4.
** Value suppressed to ensure confidentiality; cell value is 5 or greater.
Data for Nunavut is not collected.
CIHI data will differ from provincial/territorial statistics due to the CIHI collection, processing and reporting methodology.
The Methodological Notes provide more comprehensive information regarding the collection and comparability of LPNDB data.
Source: LPNDB, CIHI.
Please refer to Data Tables G.LPN.1–G.LPN.3 and G. Summary, available on the CIHI website, for further analysis using the field Sex.
Demographic Trends of Licensed Practical Nurses Sex The number of female LPNs employed in practical nursing represents a sizeable percentage of the LPN workforce. Females make up 93.0% of the workforce. The proportion of male LPNs employed in practical nursing is 7.0% in 2006.
While the total number of LPNs has increased between 2005 and 2006, the percentage of males and females within the profession has remained almost the same.
More than one-quarter (29.7%) of all male LPNs employed in practical nursing in Canada are employed in Quebec, where the 1,392 males account for 8.1% of the province’s workforce. Among the provinces, the highest proportion of male LPNs is in Newfoundland and Labrador, where male LPNs comprise 12.6% of the workforce, 5.6 percentage points higher than the Canadian average. Table 5 provides the provincial/territorial breakdown by sex for LPNs in Canada for 2005 and 2006.
Workforce Trends of Licensed Practical Nurses in Canada, 2006 CIHI 2007
14 Licensed Practical Nurses Database
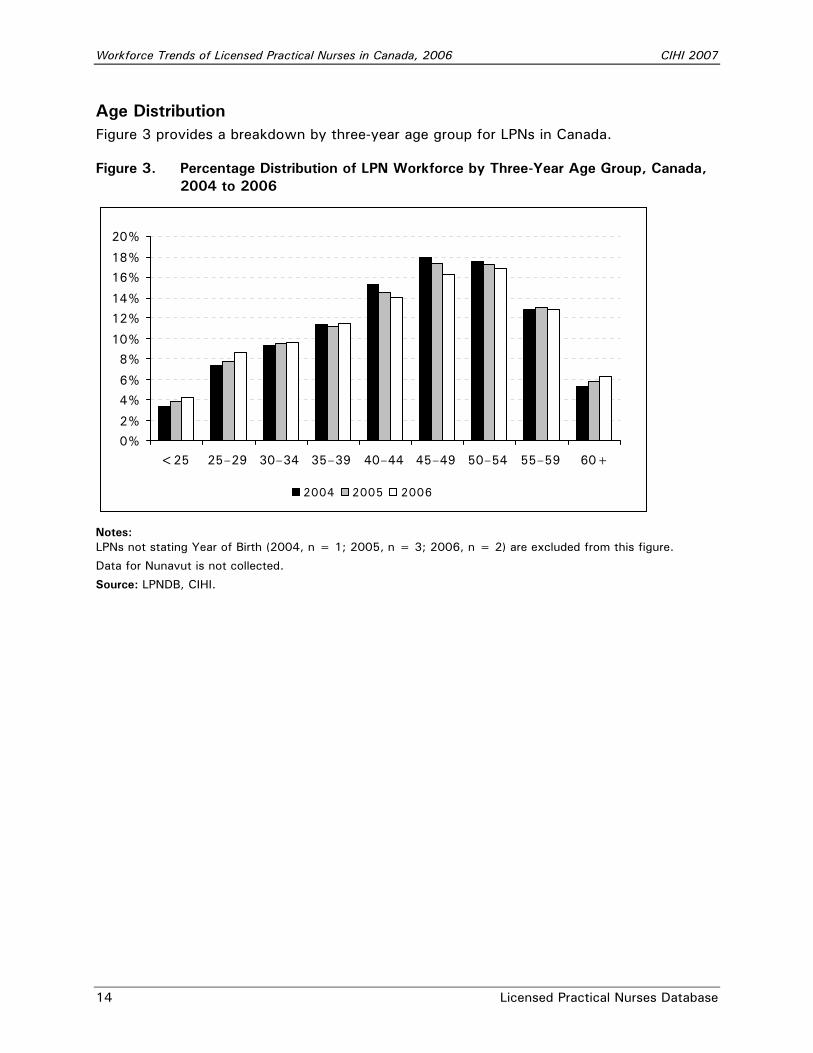
Age Distribution Figure 3 provides a breakdown by three-year age group for LPNs in Canada.
Figure 3. Percentage Distribution of LPN Workforce by Three-Year Age Group, Canada, 2004 to 2006
0%
2%
4%
6%
8%
10%
12%
14%
16%
18%
20%
<25 25–29 30–34 35–39 40–44 45–49 50–54 55–59 60+
2004 2005 2006
Notes: LPNs not stating Year of Birth (2004, n = 1; 2005, n = 3; 2006, n = 2) are excluded from this figure.
Data for Nunavut is not collected.
Source: LPNDB, CIHI.
CIHI 2007 Workforce Trends of Licensed Practical Nurses in Canada, 2006
Licensed Practical Nurses Database 15
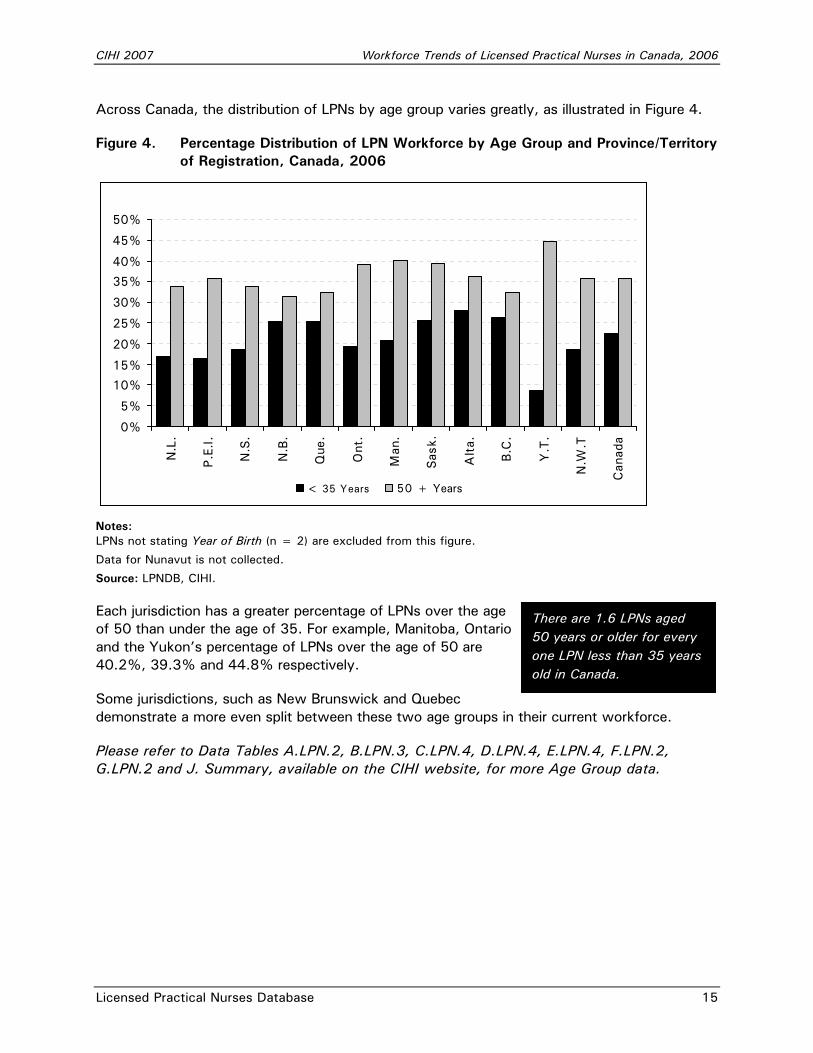
Across Canada, the distribution of LPNs by age group varies greatly, as illustrated in Figure 4.
Figure 4. Percentage Distribution of LPN Workforce by Age Group and Province/Territory of Registration, Canada, 2006
0%
5%
10%
15%
20%
25%
30%
35%
40%
45%
50%
N.L
.
P.E
.I.
N.S
.
N.B
.
Que
.
Ont
.
Man
.
Sas
k.
Alta.
B.C
.
Y.T
.
N.W
.T
Can
ada
< 35 Years 50 + Years
Notes: LPNs not stating Year of Birth (n = 2) are excluded from this figure.
Data for Nunavut is not collected.
Source: LPNDB, CIHI.
Each jurisdiction has a greater percentage of LPNs over the age of 50 than under the age of 35. For example, Manitoba, Ontario and the Yukon’s percentage of LPNs over the age of 50 are 40.2%, 39.3% and 44.8% respectively.
Some jurisdictions, such as New Brunswick and Quebec demonstrate a more even split between these two age groups in their current workforce.
Please refer to Data Tables A.LPN.2, B.LPN.3, C.LPN.4, D.LPN.4, E.LPN.4, F.LPN.2, G.LPN.2 and J. Summary, available on the CIHI website, for more Age Group data.
There are 1.6 LPNs aged 50 years or older for every one LPN less than 35 years old in Canada.
Workforce Trends of Licensed Practical Nurses in Canada, 2006 CIHI 2007
16 Licensed Practical Nurses Database
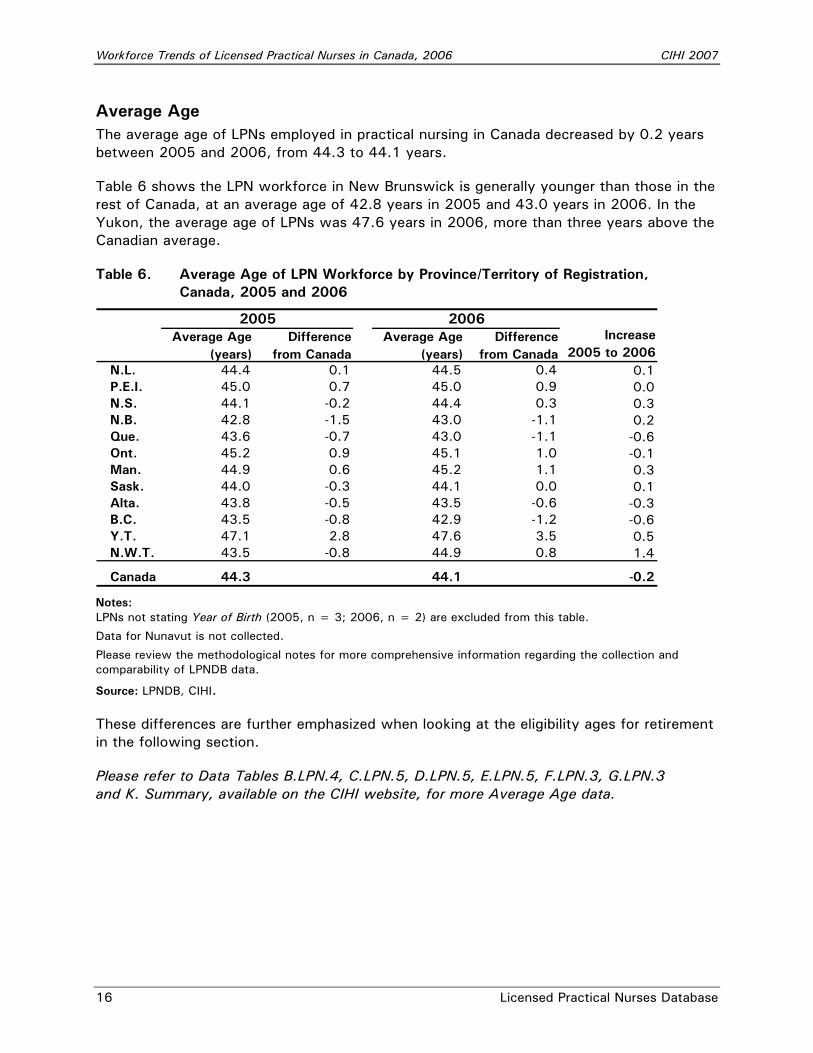
Average Age The average age of LPNs employed in practical nursing in Canada decreased by 0.2 years between 2005 and 2006, from 44.3 to 44.1 years.
Table 6 shows the LPN workforce in New Brunswick is generally younger than those in the rest of Canada, at an average age of 42.8 years in 2005 and 43.0 years in 2006. In the Yukon, the average age of LPNs was 47.6 years in 2006, more than three years above the Canadian average.
Table 6. Average Age of LPN Workforce by Province/Territory of Registration, Canada, 2005 and 2006
Average Age (years)
Difference from Canada
Average Age (years)
Difference from Canada
N.L. 44.4 0.1 44.5 0.4 0.1P.E.I. 45.0 0.7 45.0 0.9 0.0N.S. 44.1 -0.2 44.4 0.3 0.3N.B. 42.8 -1.5 43.0 -1.1 0.2Que. 43.6 -0.7 43.0 -1.1 -0.6Ont. 45.2 0.9 45.1 1.0 -0.1Man. 44.9 0.6 45.2 1.1 0.3Sask. 44.0 -0.3 44.1 0.0 0.1Alta. 43.8 -0.5 43.5 -0.6 -0.3B.C. 43.5 -0.8 42.9 -1.2 -0.6Y.T. 47.1 2.8 47.6 3.5 0.5N.W.T. 43.5 -0.8 44.9 0.8 1.4
Canada 44.3 44.1 -0.2
2005 2006Increase
2005 to 2006
Notes: LPNs not stating Year of Birth (2005, n = 3; 2006, n = 2) are excluded from this table.
Data for Nunavut is not collected.
Please review the methodological notes for more comprehensive information regarding the collection and comparability of LPNDB data.
Source: LPNDB, CIHI.
These differences are further emphasized when looking at the eligibility ages for retirement in the following section.
Please refer to Data Tables B.LPN.4, C.LPN.5, D.LPN.5, E.LPN.5, F.LPN.3, G.LPN.3 and K. Summary, available on the CIHI website, for more Average Age data.

CIHI 2007 Workforce Trends of Licensed Practical Nurses in Canada, 2006
Licensed Practical Nurses Database 17
Eligibility Age for Retirement Capturing retirement data on the annual registration form would be difficult because, presumably, many LPNs no longer interested in practising will stop submitting their annual form for renewal of their registration.
Calculating a national retirement age would be difficult, in part because the definition of “retirement” varies among jurisdictions and among individuals. For example, some LPNs who are officially “retired” still pay the full registration fee, maintaining an active registration and the right to practice. Some even continue to work afterwards.
In the absence of accurate “retirement” data from the LPNDB, different retirement scenarios were estimated based on the age of the current workforce. The calculations presented in Figure 5 are based solely on age, and do not factor in pension eligibility or years of experience. Also, the calculations do not consider other factors such as early retirement, death, migration, or other provincial/territorial policies that affect the Human Resources system. The results are only an estimate, but contribute a contextual perspective to the aging of the LPN workforce.
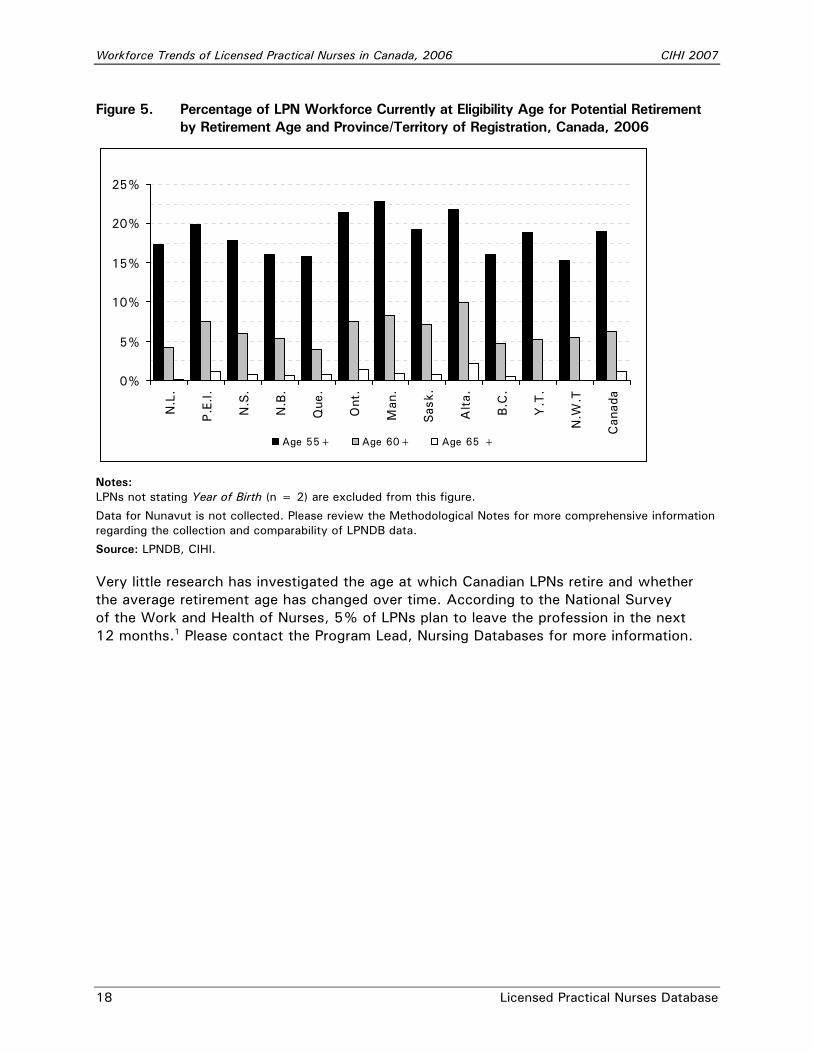
Figure 5 illustrates the current percentage of LPNs employed in practical nursing that have already reached the typical age for retirement.
Currently, 19.0% of Canada’s LPN workforce is aged 55 years old or greater, with 6.3% aged 60 or greater. Northwest Territories currently has the smallest proportion of nurses over the age of 55, at 15.2%. Manitoba has the largest proportion with 22.9% of its LPN workforce aged 55 or older.
Workforce Trends of Licensed Practical Nurses in Canada, 2006 CIHI 2007
18 Licensed Practical Nurses Database
Figure 5. Percentage of LPN Workforce Currently at Eligibility Age for Potential Retirement by Retirement Age and Province/Territory of Registration, Canada, 2006
0%
5%
10%
15%
20%
25%N
.L.
P.E
.I.
N.S
.
N.B
.
Que
.
Ont
.
Man
.
Sas
k.
Alta.
B.C
.
Y.T
.
N.W
.T
Can
ada
Age 55+ Age 60+ Age 65 +
Notes: LPNs not stating Year of Birth (n = 2) are excluded from this figure.
Data for Nunavut is not collected. Please review the Methodological Notes for more comprehensive information regarding the collection and comparability of LPNDB data.
Source: LPNDB, CIHI.
Very little research has investigated the age at which Canadian LPNs retire and whether the average retirement age has changed over time. According to the National Survey of the Work and Health of Nurses, 5% of LPNs plan to leave the profession in the next 12 months.1 Please contact the Program Lead, Nursing Databases for more information.

CIHI 2007 Workforce Trends of Licensed Practical Nurses in Canada, 2006
Licensed Practical Nurses Database 19
Education Trends of Licensed Practical Nurses The first formal LPN training program was delivered in 1945 in Manitoba and was followed promptly by the delivery of similar programs in other jurisdictions. These programs were tailored to meet jurisdictional needs and, subsequently, offered much variation in content and expectations.
Over the years, the roles of the LPN have changed. These changes have demanded revision to the LPN educational program, scope of practice and role. Educational programs for LPNs are offered in most Canadian jurisdictions. Once delivered primarily in hospitals, practical nursing education is now offered in post-secondary institutions. More importantly, the education of the LPN has moved from a skills base to a knowledge base.
Graduates of an approved program are eligible to write national examinations and, if they achieve a passing grade, are eligible for licensure. The national exam is based on competencies related to client care, communication and professional responsibility. The national exam is written in all jurisdictions except Quebec, where they are required to write a provincial examination.
While LPN educational programs are far more consistent across jurisdictions today than they ever have been, they are not consistent in their content and delivery to the degree that the full range of LPN competencies are taught in all jurisdictions. For example, in some provinces, educational components to permit LPNs to perform additional services have not been introduced into the basic education program (such as a Initiating of IVs program). In others, the educational program has been revised to include them.
Initial Education in Practical Nursing LPNs in Canada graduate from an approved LPN program and receive a diploma or equivalency. Equivalency status is granted to an individual coming from another jurisdictional LPN program or educated in another country. An assessment of equivalency by LPN regulatory authorities can permit initial registration as an LPN.
All provinces/territories reported that 90.0% or more of their LPNs stated an initial education of diploma, as opposed to equivalency status, in 2006.
Please refer to Data Table L. Summary, available on the CIHI website, for more Initial Education in Practical Nursing data.

Workforce Trends of Licensed Practical Nurses in Canada, 2006 CIHI 2007
20 Licensed Practical Nurses Database
Age at Graduation Data from the LPNDB indicate that the average age of practical nursing graduates has increased in recent years, resulting in a greater percentage of graduates aged 30 years or older.
Part of this increase can be attributed to the method used in the calculations. In the absence of demographic data for each graduating class, demographic data from LPNs currently in the workforce must be used as an indicator. Some LPNs who graduated before 1980 will have since left the profession and/or the country, while others will have retired. Those that remain in the workforce in 2006 and graduated before the 1980s were generally the youngest graduates. For this reason, five-year breakdowns are not provided for those graduating prior to 1980.
Among the current workforce, the average age of LPNs at the time of their initial nursing graduation increased from 23.3 years for those graduating between 1980 and 1984 to 30.9 years for those graduating since the year 2000, as shown in Figure 6.
Figure 6. Percentage Distribution of LPN Workforce by Year of Graduation and Average Age at Graduation, Canada, 2006
Notes: LPNs not stating Year of Birth (2006, n = 2) are excluded from average age calculations.
LPNs not stating Year of Graduation (2006, n = 80) are excluded from this figure.
Source: LPNDB, CIHI.
The percentage of graduates aged 30 years or older at the time of graduation has increased. Among the current LPN workforce, 23.7% of those graduating in the 1980s were aged 30 years or older at the time of graduation. This compares to 44.3% of graduates from the 1990s and 48.5% since the year 2000.
It is unknown whether LPNs who start their career later (e.g. at age 30), still retire at the same age as other LPNs. If so, then LPNs beginning their career later in life will spend fewer years in the workforce than younger LPN graduates.
0%
20%
40%
60%
80%
100%
<1980 1980–1984 1985–1989 1990–1994 1995–1999 2000+0
5
10
15
20
25
30
35
Years
Percentage Average Age at Graduation
CIHI 2007 Workforce Trends of Licensed Practical Nurses in Canada, 2006
Licensed Practical Nurses Database 21
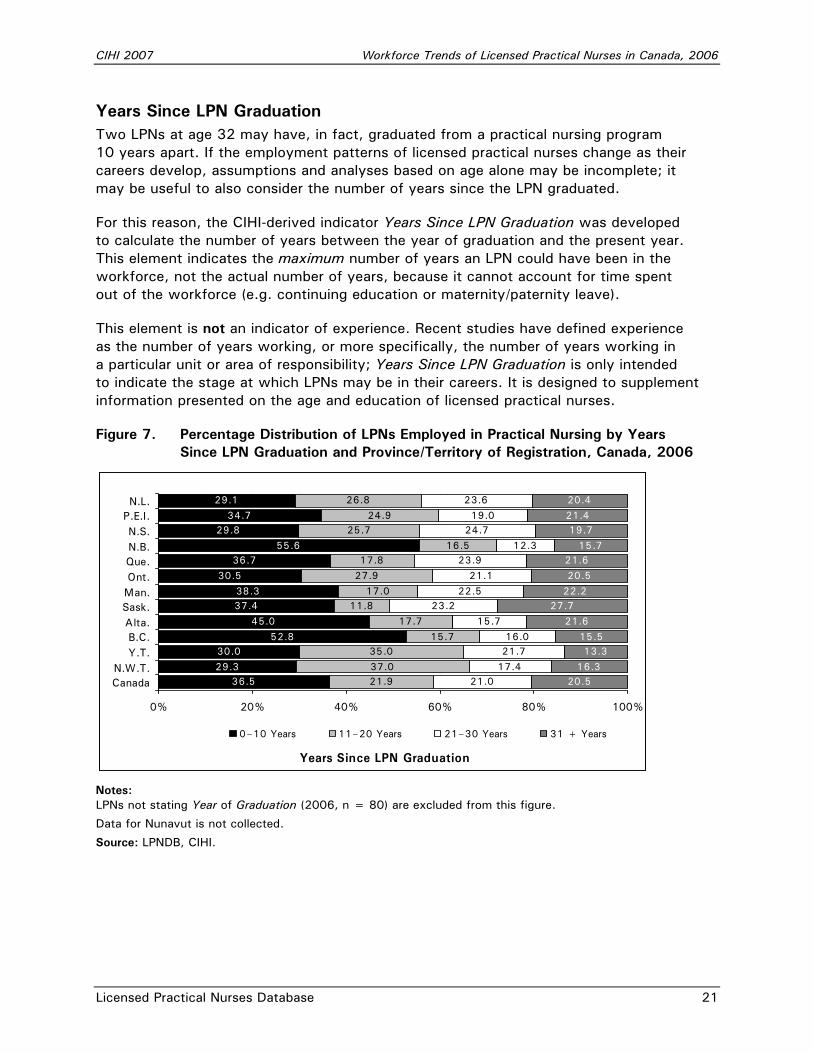
Years Since LPN Graduation Two LPNs at age 32 may have, in fact, graduated from a practical nursing program 10 years apart. If the employment patterns of licensed practical nurses change as their careers develop, assumptions and analyses based on age alone may be incomplete; it may be useful to also consider the number of years since the LPN graduated.
For this reason, the CIHI-derived indicator Years Since LPN Graduation was developed to calculate the number of years between the year of graduation and the present year. This element indicates the maximum number of years an LPN could have been in the workforce, not the actual number of years, because it cannot account for time spent out of the workforce (e.g. continuing education or maternity/paternity leave).
This element is not an indicator of experience. Recent studies have defined experience as the number of years working, or more specifically, the number of years working in a particular unit or area of responsibility; Years Since LPN Graduation is only intended to indicate the stage at which LPNs may be in their careers. It is designed to supplement information presented on the age and education of licensed practical nurses.
Figure 7. Percentage Distribution of LPNs Employed in Practical Nursing by Years Since LPN Graduation and Province/Territory of Registration, Canada, 2006
36.529.3
30.052.8
45.0
37.438.3
30.5
36.755.6
29.834.7
29.1
21.937.0
35.015.7
17.7
11.817.0
27.9
17.816.5
25.724.9
26.8 23.6
19.024.7
12.323.9
21.1
22.523.2
15.7
16.021.7
17.421.0 20.5
16.3
13.315.5
21.6
27.7
21.615.7
19.721.4
20.4
20.5
22.2
0% 20% 40% 60% 80% 100%
N.L.P.E.I.N.S.N.B.Que.Ont.Man.Sask.Alta.B.C.Y.T.
N.W.T.Canada
Years Since LPN Graduation
0–10 Years 11–20 Years 21–30 Years 31 + Years
Notes: LPNs not stating Year of Graduation (2006, n = 80) are excluded from this figure.
Data for Nunavut is not collected.
Source: LPNDB, CIHI.

Workforce Trends of Licensed Practical Nurses in Canada, 2006 CIHI 2007
22 Licensed Practical Nurses Database
Surprisingly, some of the provincial/territorial workforces with the highest proportion of LPNs who graduated more than 20 years ago also have some of the youngest average ages. For example, Quebec’s LPN workforce was second youngest, on average, in 2006. Yet, just under half (47.2%) of the Quebec LPN workforce graduated more than 20 years ago, the second highest rate in the country, after Saskatchewan (52.4%).
In contrast, the Yukon LPN workforce had the highest average age in 2006, yet 63.0% of its workforce graduated less than 20 years ago. These differences are partially explained by the increasing age of new graduates.
Please refer to Data Tables B.LPN.5, C.LPN.6, D.LPN.6, E.LPN.6, F.LPN.4 and I. Summary, available on the CIHI website, for more Years Since LPN Graduation data.
CIHI 2007 Workforce Trends of Licensed Practical Nurses in Canada, 2006
Licensed Practical Nurses Database 23
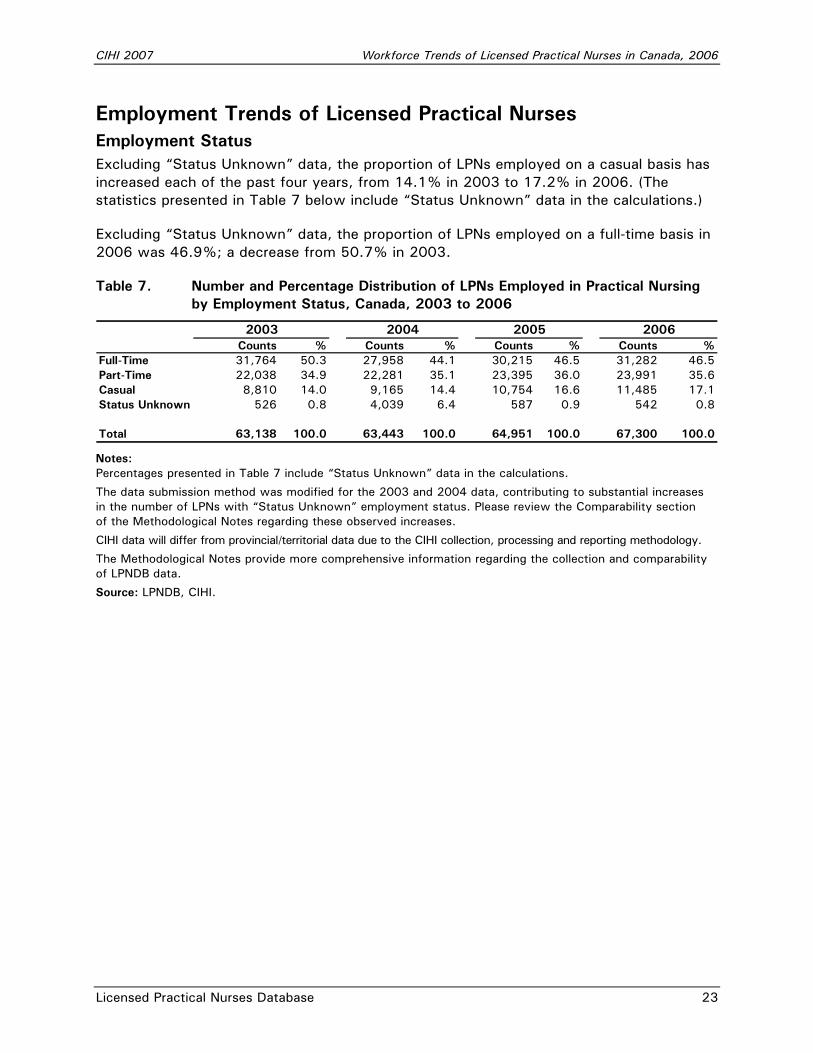
Employment Trends of Licensed Practical Nurses Employment Status Excluding “Status Unknown” data, the proportion of LPNs employed on a casual basis has increased each of the past four years, from 14.1% in 2003 to 17.2% in 2006. (The statistics presented in Table 7 below include “Status Unknown” data in the calculations.)
Excluding “Status Unknown” data, the proportion of LPNs employed on a full-time basis in 2006 was 46.9%; a decrease from 50.7% in 2003.
Table 7. Number and Percentage Distribution of LPNs Employed in Practical Nursing by Employment Status, Canada, 2003 to 2006
Counts % Counts % Counts % Counts %Full-Time 31,764 50.3 27,958 44.1 30,215 46.5 31,282 46.5Part-Time 22,038 34.9 22,281 35.1 23,395 36.0 23,991 35.6Casual 8,810 14.0 9,165 14.4 10,754 16.6 11,485 17.1Status Unknown 526 0.8 4,039 6.4 587 0.9 542 0.8
Total 63,138 100.0 63,443 100.0 64,951 100.0 67,300 100.0
20062003 2004 2005
Notes: Percentages presented in Table 7 include “Status Unknown” data in the calculations.
The data submission method was modified for the 2003 and 2004 data, contributing to substantial increases in the number of LPNs with “Status Unknown” employment status. Please review the Comparability section of the Methodological Notes regarding these observed increases.
CIHI data will differ from provincial/territorial data due to the CIHI collection, processing and reporting methodology.
The Methodological Notes provide more comprehensive information regarding the collection and comparability of LPNDB data.
Source: LPNDB, CIHI.
Workforce Trends of Licensed Practical Nurses in Canada, 2006 CIHI 2007
24 Licensed Practical Nurses Database
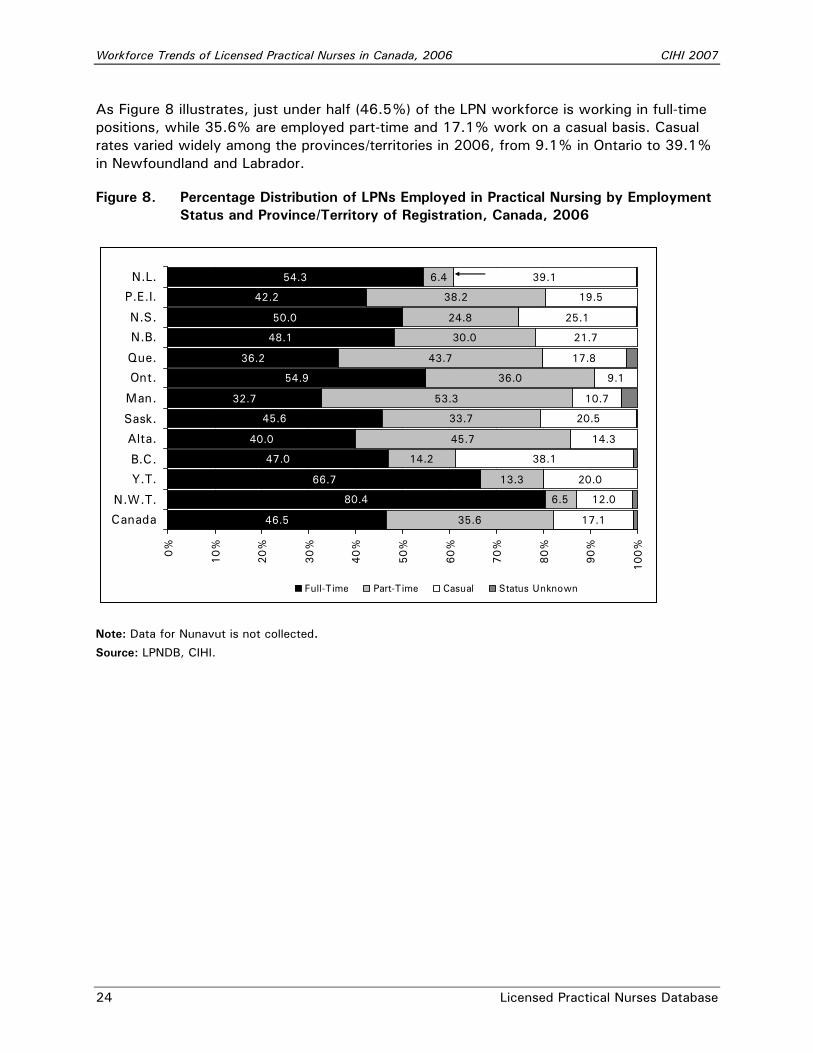
As Figure 8 illustrates, just under half (46.5%) of the LPN workforce is working in full-time positions, while 35.6% are employed part-time and 17.1% work on a casual basis. Casual rates varied widely among the provinces/territories in 2006, from 9.1% in Ontario to 39.1% in Newfoundland and Labrador.
Figure 8. Percentage Distribution of LPNs Employed in Practical Nursing by Employment Status and Province/Territory of Registration, Canada, 2006
54.3
42.2
50.0
48.1
36.2
54.9
32.7
45.6
40.0
47.0
66.7
80.4
46.5
6.5
6.4
35.6
13.3
14.2
45.7
33.7
53.3
36.0
43.7
30.0
24.8
38.2
39.1
19.5
25.1
21.7
17.8
9.1
10.7
20.5
14.3
38.1
20.0
12.0
17.1
0%
10%
20%
30%
40%
50%
60%
70%
80%
90%
100%
N.L.
P.E.I.
N.S.
N.B.
Que.
Ont.
Man.
Sask.
Alta.
B.C.
Y.T.
N.W.T.
Canada
Full-Time Part-Time Casual Status Unknown
Note: Data for Nunavut is not collected.
Source: LPNDB, CIHI.
CIHI 2007 Workforce Trends of Licensed Practical Nurses in Canada, 2006
Licensed Practical Nurses Database 25
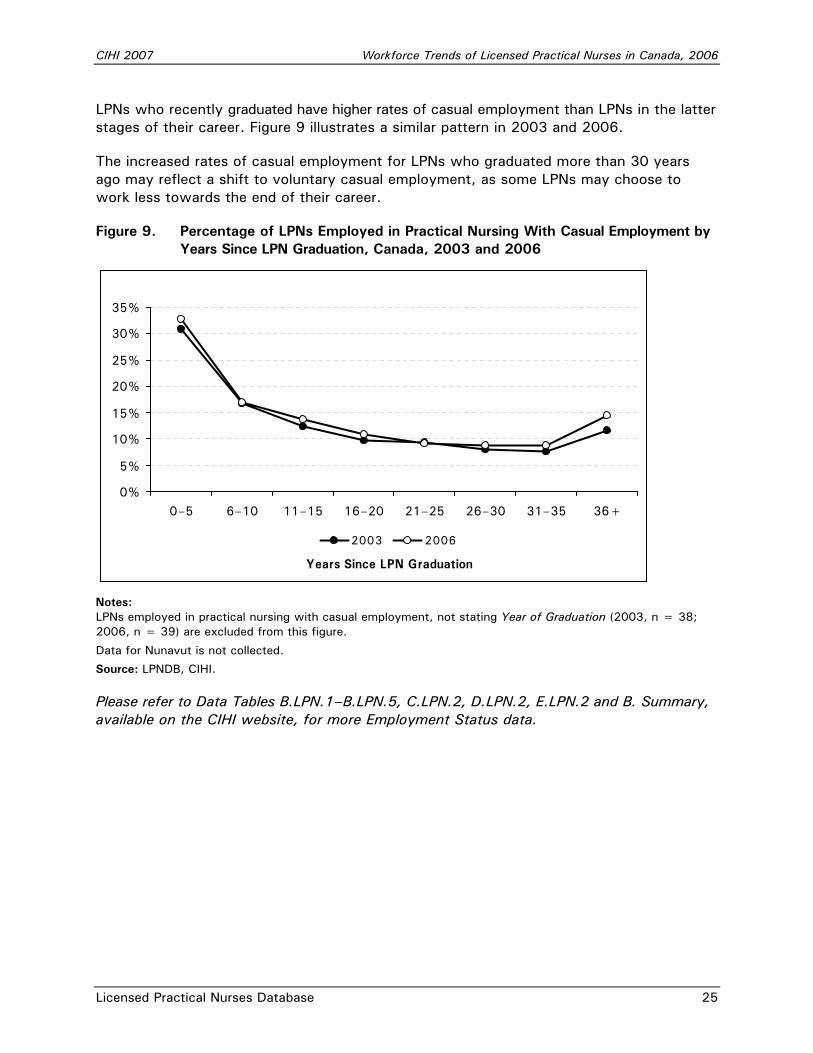
LPNs who recently graduated have higher rates of casual employment than LPNs in the latter stages of their career. Figure 9 illustrates a similar pattern in 2003 and 2006.
The increased rates of casual employment for LPNs who graduated more than 30 years ago may reflect a shift to voluntary casual employment, as some LPNs may choose to work less towards the end of their career.
Figure 9. Percentage of LPNs Employed in Practical Nursing With Casual Employment by Years Since LPN Graduation, Canada, 2003 and 2006
0%
5%
10%
15%
20%
25%
30%
35%
0–5 6–10 11–15 16–20 21–25 26–30 31–35 36+
2003 2006
Years Since LPN Graduation
Notes: LPNs employed in practical nursing with casual employment, not stating Year of Graduation (2003, n = 38; 2006, n = 39) are excluded from this figure.
Data for Nunavut is not collected.
Source: LPNDB, CIHI.
Please refer to Data Tables B.LPN.1–B.LPN.5, C.LPN.2, D.LPN.2, E.LPN.2 and B. Summary, available on the CIHI website, for more Employment Status data.
Workforce Trends of Licensed Practical Nurses in Canada, 2006 CIHI 2007
26 Licensed Practical Nurses Database
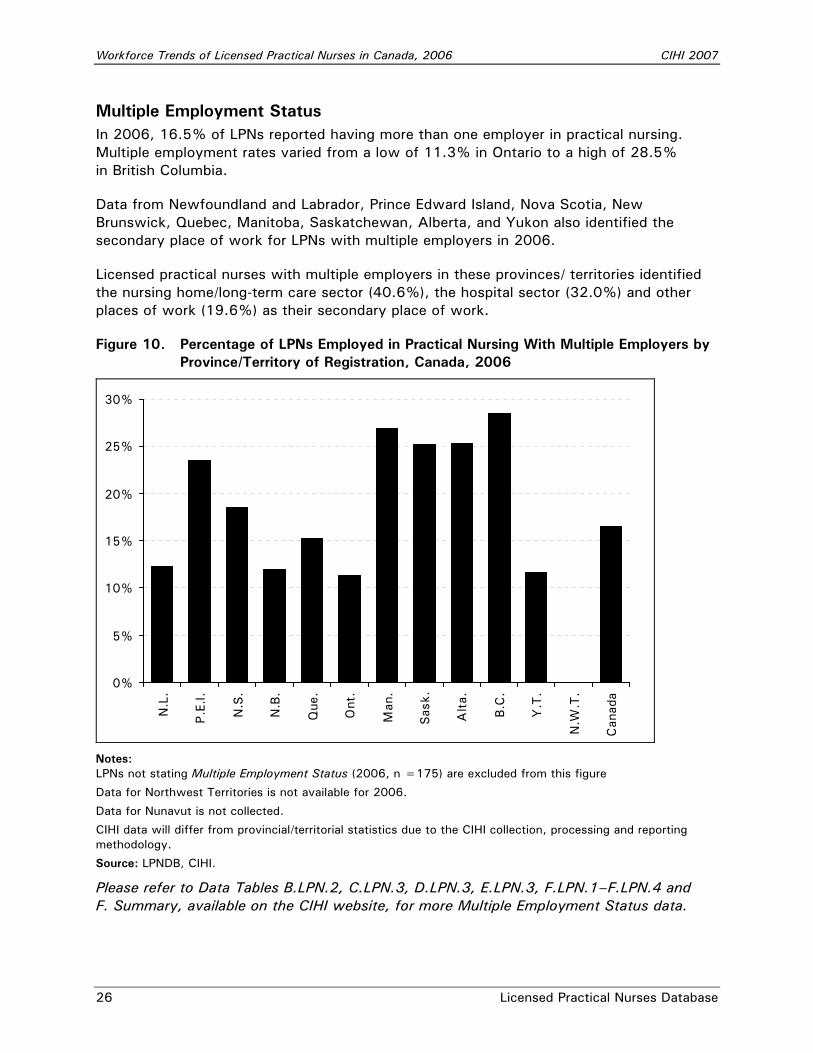
Multiple Employment Status In 2006, 16.5% of LPNs reported having more than one employer in practical nursing. Multiple employment rates varied from a low of 11.3% in Ontario to a high of 28.5% in British Columbia.
Data from Newfoundland and Labrador, Prince Edward Island, Nova Scotia, New Brunswick, Quebec, Manitoba, Saskatchewan, Alberta, and Yukon also identified the secondary place of work for LPNs with multiple employers in 2006.
Licensed practical nurses with multiple employers in these provinces/ territories identified the nursing home/long-term care sector (40.6%), the hospital sector (32.0%) and other places of work (19.6%) as their secondary place of work.
Figure 10. Percentage of LPNs Employed in Practical Nursing With Multiple Employers by Province/Territory of Registration, Canada, 2006
0%
5%
10%
15%
20%
25%
30%
N.L
.
P.E
.I.
N.S
.
N.B
.
Que
.
Ont
.
Man
.
Sas
k.
Alta.
B.C
.
Y.T
.
N.W
.T.
Can
ada
Notes: LPNs not stating Multiple Employment Status (2006, n =175) are excluded from this figure
Data for Northwest Territories is not available for 2006.
Data for Nunavut is not collected.
CIHI data will differ from provincial/territorial statistics due to the CIHI collection, processing and reporting methodology.
Source: LPNDB, CIHI.
Please refer to Data Tables B.LPN.2, C.LPN.3, D.LPN.3, E.LPN.3, F.LPN.1–F.LPN.4 and F. Summary, available on the CIHI website, for more Multiple Employment Status data.
CIHI 2007 Workforce Trends of Licensed Practical Nurses in Canada, 2006
Licensed Practical Nurses Database 27
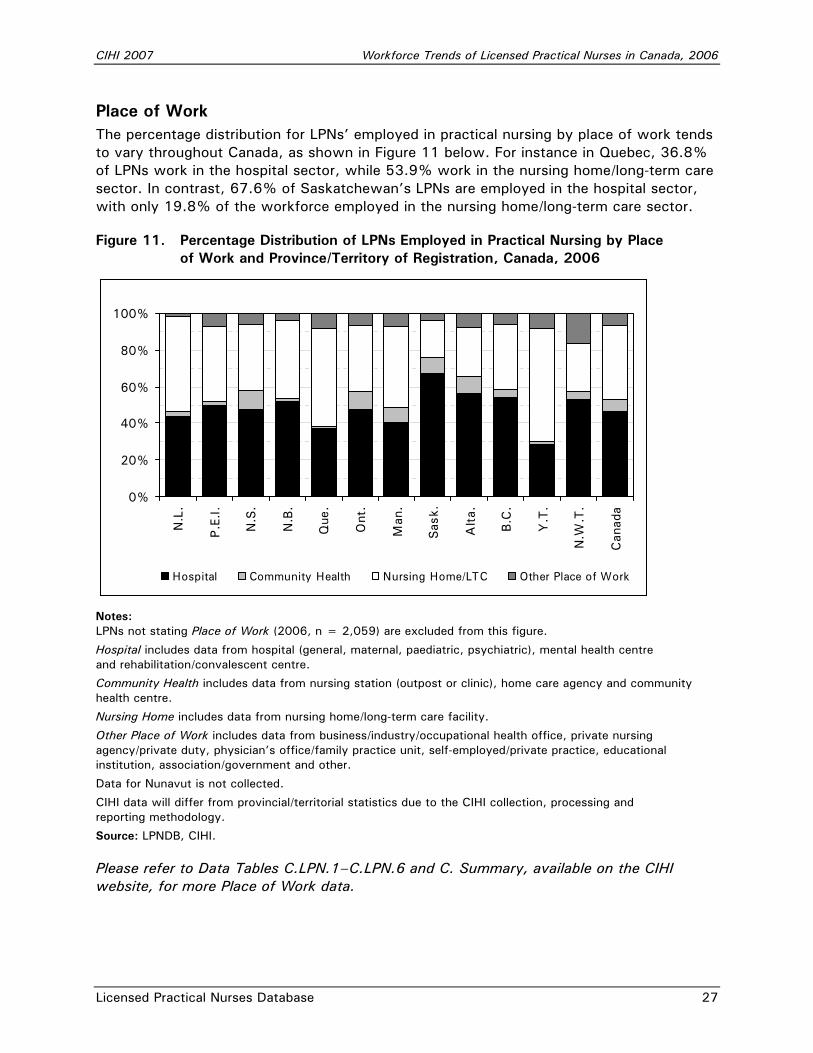
Place of Work The percentage distribution for LPNs’ employed in practical nursing by place of work tends to vary throughout Canada, as shown in Figure 11 below. For instance in Quebec, 36.8% of LPNs work in the hospital sector, while 53.9% work in the nursing home/long-term care sector. In contrast, 67.6% of Saskatchewan’s LPNs are employed in the hospital sector, with only 19.8% of the workforce employed in the nursing home/long-term care sector.
Figure 11. Percentage Distribution of LPNs Employed in Practical Nursing by Place of Work and Province/Territory of Registration, Canada, 2006
0%
20%
40%
60%
80%
100%
N.L
.
P.E
.I.
N.S
.
N.B
.
Que
.
Ont
.
Man
.
Sas
k.
Alta.
B.C
.
Y.T
.
N.W
.T.
Can
ada
Hospital Community Health Nursing Home/LTC Other Place of Work
Notes: LPNs not stating Place of Work (2006, n = 2,059) are excluded from this figure.
Hospital includes data from hospital (general, maternal, paediatric, psychiatric), mental health centre and rehabilitation/convalescent centre.
Community Health includes data from nursing station (outpost or clinic), home care agency and community health centre.
Nursing Home includes data from nursing home/long-term care facility.
Other Place of Work includes data from business/industry/occupational health office, private nursing agency/private duty, physician’s office/family practice unit, self-employed/private practice, educational institution, association/government and other.
Data for Nunavut is not collected.
CIHI data will differ from provincial/territorial statistics due to the CIHI collection, processing and reporting methodology.
Source: LPNDB, CIHI.
Please refer to Data Tables C.LPN.1–C.LPN.6 and C. Summary, available on the CIHI website, for more Place of Work data.
Workforce Trends of Licensed Practical Nurses in Canada, 2006 CIHI 2007
28 Licensed Practical Nurses Database
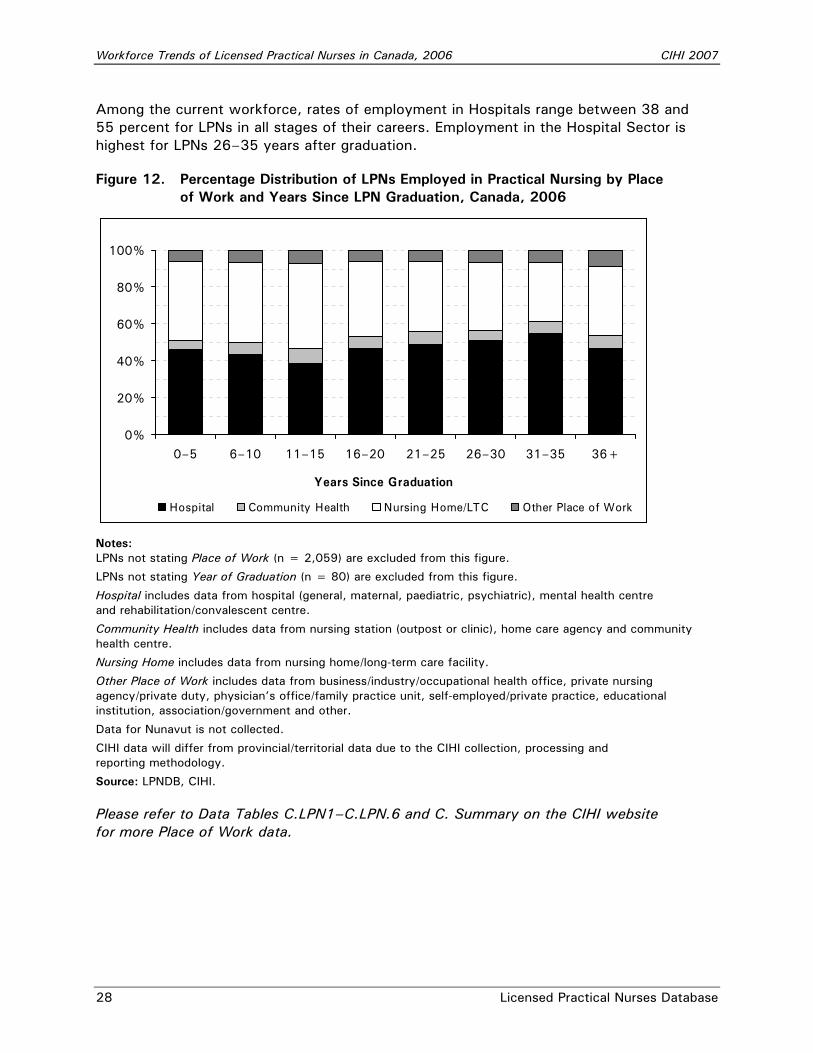
Among the current workforce, rates of employment in Hospitals range between 38 and 55 percent for LPNs in all stages of their careers. Employment in the Hospital Sector is highest for LPNs 26–35 years after graduation.
Figure 12. Percentage Distribution of LPNs Employed in Practical Nursing by Place of Work and Years Since LPN Graduation, Canada, 2006
0%
20%
40%
60%
80%
100%
0–5 6–10 11–15 16–20 21–25 26–30 31–35 36+
Hospital Community Health Nursing Home/LTC Other Place of Work
Years Since Graduation
Notes: LPNs not stating Place of Work (n = 2,059) are excluded from this figure.
LPNs not stating Year of Graduation (n = 80) are excluded from this figure.
Hospital includes data from hospital (general, maternal, paediatric, psychiatric), mental health centre and rehabilitation/convalescent centre.
Community Health includes data from nursing station (outpost or clinic), home care agency and community health centre.
Nursing Home includes data from nursing home/long-term care facility.
Other Place of Work includes data from business/industry/occupational health office, private nursing agency/private duty, physician’s office/family practice unit, self-employed/private practice, educational institution, association/government and other.
Data for Nunavut is not collected.
CIHI data will differ from provincial/territorial data due to the CIHI collection, processing and reporting methodology.
Source: LPNDB, CIHI.
Please refer to Data Tables C.LPN1–C.LPN.6 and C. Summary on the CIHI website for more Place of Work data.
CIHI 2007 Workforce Trends of Licensed Practical Nurses in Canada, 2006
Licensed Practical Nurses Database 29
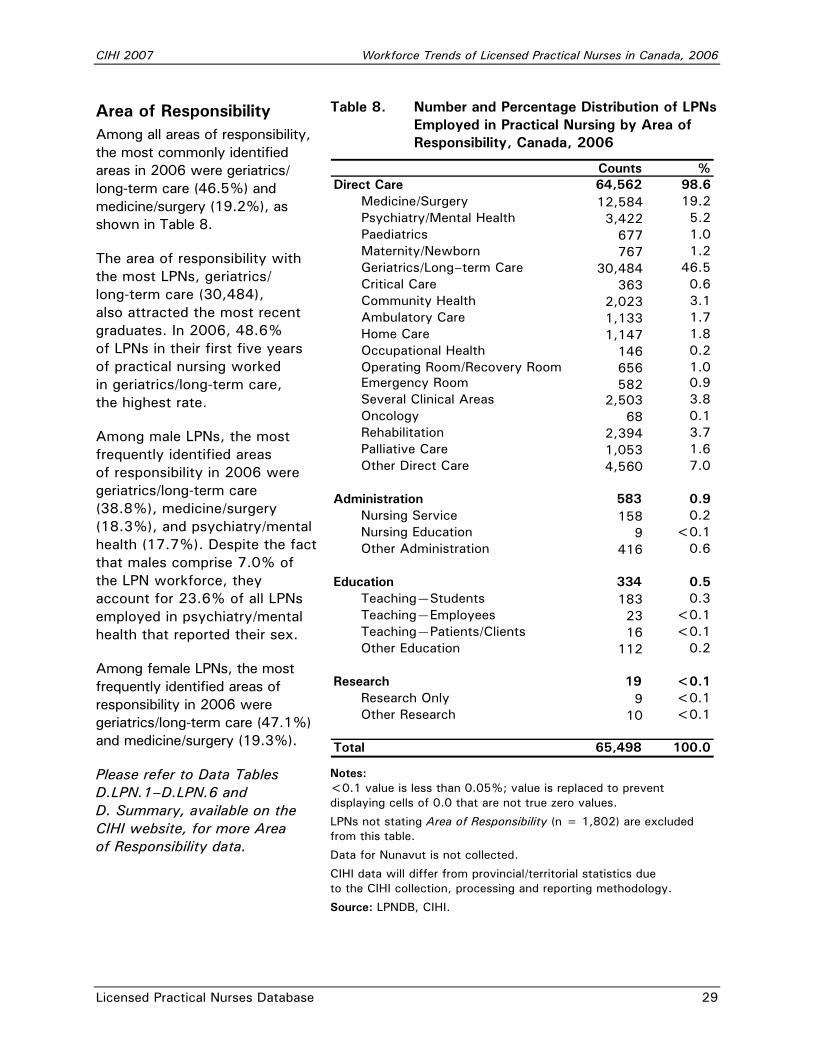
Area of Responsibility Among all areas of responsibility, the most commonly identified areas in 2006 were geriatrics/ long-term care (46.5%) and medicine/surgery (19.2%), as shown in Table 8.
The area of responsibility with the most LPNs, geriatrics/ long-term care (30,484), also attracted the most recent graduates. In 2006, 48.6% of LPNs in their first five years of practical nursing worked in geriatrics/long-term care, the highest rate.
Among male LPNs, the most frequently identified areas of responsibility in 2006 were geriatrics/long-term care (38.8%), medicine/surgery (18.3%), and psychiatry/mental health (17.7%). Despite the fact that males comprise 7.0% of the LPN workforce, they account for 23.6% of all LPNs employed in psychiatry/mental health that reported their sex.
Among female LPNs, the most frequently identified areas of responsibility in 2006 were geriatrics/long-term care (47.1%) and medicine/surgery (19.3%).
Please refer to Data Tables D.LPN.1–D.LPN.6 and D. Summary, available on the CIHI website, for more Area of Responsibility data.
Table 8. Number and Percentage Distribution of LPNs Employed in Practical Nursing by Area of Responsibility, Canada, 2006
Counts %Direct Care 64,562 98.6
Medicine/Surgery 12,584 19.2Psychiatry/Mental Health 3,422 5.2Paediatrics 677 1.0Maternity/Newborn 767 1.2Geriatrics/Long–term Care 30,484 46.5Critical Care 363 0.6Community Health 2,023 3.1Ambulatory Care 1,133 1.7Home Care 1,147 1.8Occupational Health 146 0.2Operating Room/Recovery Room 656 1.0Emergency Room 582 0.9Several Clinical Areas 2,503 3.8Oncology 68 0.1Rehabilitation 2,394 3.7Palliative Care 1,053 1.6Other Direct Care 4,560 7.0
Administration 583 0.9Nursing Service 158 0.2Nursing Education 9 <0.1Other Administration 416 0.6
Education 334 0.5Teaching—Students 183 0.3Teaching—Employees 23 <0.1Teaching—Patients/Clients 16 <0.1Other Education 112 0.2
Research 19 <0.1Research Only 9 <0.1Other Research 10 <0.1
Total 65,498 100.0
Notes: <0.1 value is less than 0.05%; value is replaced to prevent displaying cells of 0.0 that are not true zero values.
LPNs not stating Area of Responsibility (n = 1,802) are excluded from this table.
Data for Nunavut is not collected.
CIHI data will differ from provincial/territorial statistics due to the CIHI collection, processing and reporting methodology.
Source: LPNDB, CIHI.
Workforce Trends of Licensed Practical Nurses in Canada, 2006 CIHI 2007
30 Licensed Practical Nurses Database
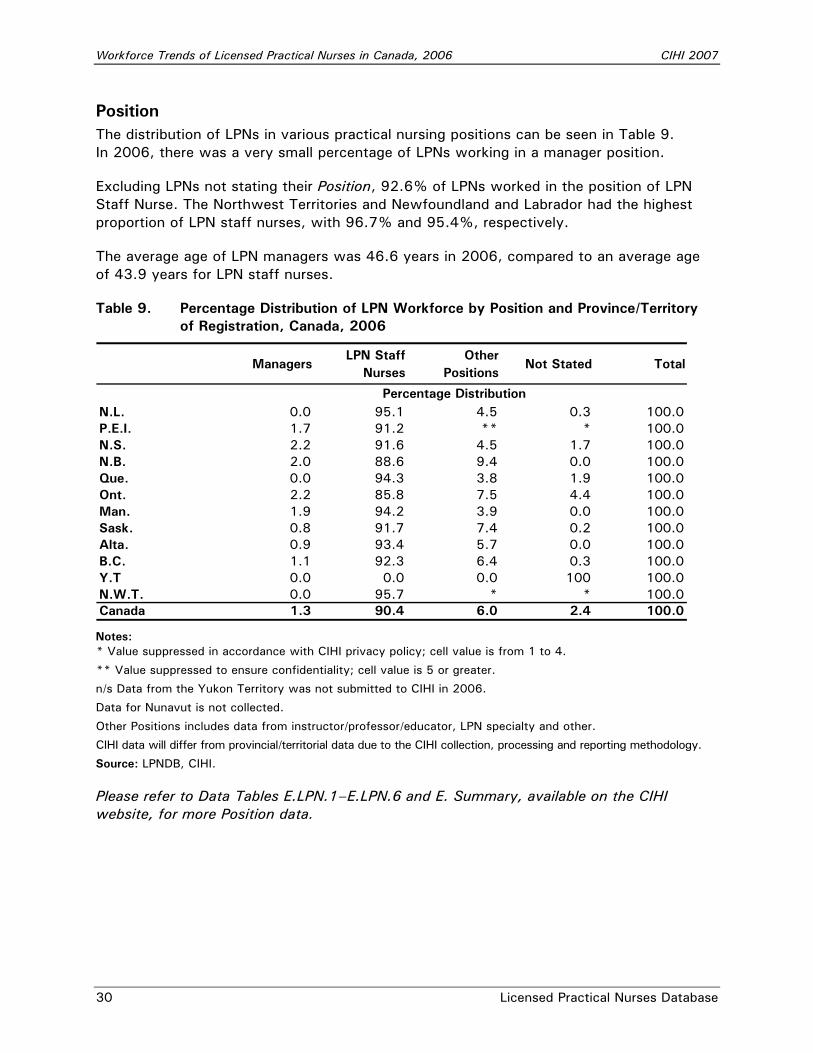
Position The distribution of LPNs in various practical nursing positions can be seen in Table 9. In 2006, there was a very small percentage of LPNs working in a manager position.
Excluding LPNs not stating their Position, 92.6% of LPNs worked in the position of LPN Staff Nurse. The Northwest Territories and Newfoundland and Labrador had the highest proportion of LPN staff nurses, with 96.7% and 95.4%, respectively.
The average age of LPN managers was 46.6 years in 2006, compared to an average age of 43.9 years for LPN staff nurses.
Table 9. Percentage Distribution of LPN Workforce by Position and Province/Territory of Registration, Canada, 2006
ManagersLPN Staff
NursesOther
PositionsNot Stated Total
N.L. 0.0 95.1 4.5 0.3 100.0P.E.I. 1.7 91.2 ** * 100.0N.S. 2.2 91.6 4.5 1.7 100.0N.B. 2.0 88.6 9.4 0.0 100.0Que. 0.0 94.3 3.8 1.9 100.0Ont. 2.2 85.8 7.5 4.4 100.0Man. 1.9 94.2 3.9 0.0 100.0Sask. 0.8 91.7 7.4 0.2 100.0Alta. 0.9 93.4 5.7 0.0 100.0B.C. 1.1 92.3 6.4 0.3 100.0Y.T 0.0 0.0 0.0 100 100.0N.W.T. 0.0 95.7 * * 100.0Canada 1.3 90.4 6.0 2.4 100.0
Percentage Distribution
Notes: * Value suppressed in accordance with CIHI privacy policy; cell value is from 1 to 4.
** Value suppressed to ensure confidentiality; cell value is 5 or greater.
n/s Data from the Yukon Territory was not submitted to CIHI in 2006.
Data for Nunavut is not collected.
Other Positions includes data from instructor/professor/educator, LPN specialty and other.
CIHI data will differ from provincial/territorial data due to the CIHI collection, processing and reporting methodology.
Source: LPNDB, CIHI.
Please refer to Data Tables E.LPN.1–E.LPN.6 and E. Summary, available on the CIHI website, for more Position data.
CIHI 2007 Workforce Trends of Licensed Practical Nurses in Canada, 2006
Licensed Practical Nurses Database 31
Canadian Graduates vs. Canadians In this analysis, students from foreign countries who graduate from a practical nursing school in Canada are considered “Canadian graduates” . . . Similarly, Canadians who attend practical nursing school outside of Canada but return to work are termed “Internationally educated.” Citizenship and Place of Graduation are not the same.
Mobility Trends of Licensed Practical Nurses Background At present, licensed practical nurses in Canada do not have registration numbers that are unique at the national level. Existing provincial/territorial registration numbers are only unique within a particular jurisdiction; when an LPN moves to another jurisdiction a new registration number is issued and the “old” registration number discontinued. Without the ability to follow a single registration number over time, it is not possible to accurately track the migration and movement of LPNs within Canada.
Therefore, in the absence of national registration numbers, the place of graduation is the foremost indicator of LPN mobility. A comparison of the Province/Territory of Graduation to the current Province/Territory of Registration indicates whether LPNs are still in the same jurisdiction from which they graduated. If the two jurisdictions are different, then the LPN has moved within the country.
The place of graduation is only an indicator of mobility, and not an accurate measure. This method does not account for those attending practical nursing school out-of-province/territory with the intention of returning “home” to work, nor will it account for time spent in another jurisdiction. For example, if an LPN who initially graduated in Nova Scotia were to return to that province after 10 years in another province/territory, there would be no indication of migration, as the Province of Graduation (Nova Scotia) would match the current Province of Registration (Nova Scotia).
In addition, this indicator is unable to track mobility within a jurisdiction. Intraprovincial migration is particularly relevant for rural and/or remote populations.
Workforce Trends of Licensed Practical Nurses in Canada, 2006 CIHI 2007
32 Licensed Practical Nurses Database
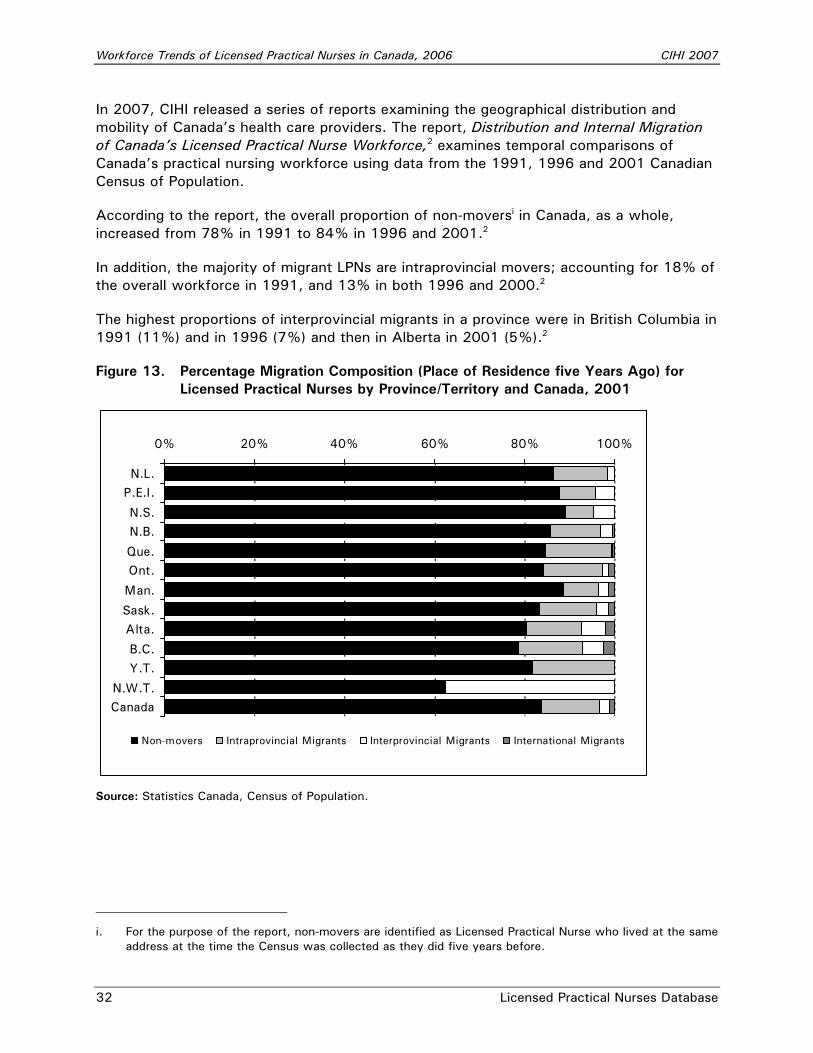
In 2007, CIHI released a series of reports examining the geographical distribution and mobility of Canada’s health care providers. The report, Distribution and Internal Migration of Canada’s Licensed Practical Nurse Workforce,2 examines temporal comparisons of Canada’s practical nursing workforce using data from the 1991, 1996 and 2001 Canadian Census of Population.
According to the report, the overall proportion of non-moversi in Canada, as a whole, increased from 78% in 1991 to 84% in 1996 and 2001.2
In addition, the majority of migrant LPNs are intraprovincial movers; accounting for 18% of the overall workforce in 1991, and 13% in both 1996 and 2000.2
The highest proportions of interprovincial migrants in a province were in British Columbia in 1991 (11%) and in 1996 (7%) and then in Alberta in 2001 (5%).2
Figure 13. Percentage Migration Composition (Place of Residence five Years Ago) for Licensed Practical Nurses by Province/Territory and Canada, 2001
0% 20% 40% 60% 80% 100%
N.L.P.E.I.
N.S.N.B.
Que.Ont.
Man.
Sask.Alta.
B.C.Y.T.
N.W.T.Canada
Non-movers Intraprovincial Migrants Interprovincial Migrants International Migrants
Source: Statistics Canada, Census of Population.
i. For the purpose of the report, non-movers are identified as Licensed Practical Nurse who lived at the same
address at the time the Census was collected as they did five years before.
CIHI 2007 Workforce Trends of Licensed Practical Nurses in Canada, 2006
Licensed Practical Nurses Database 33
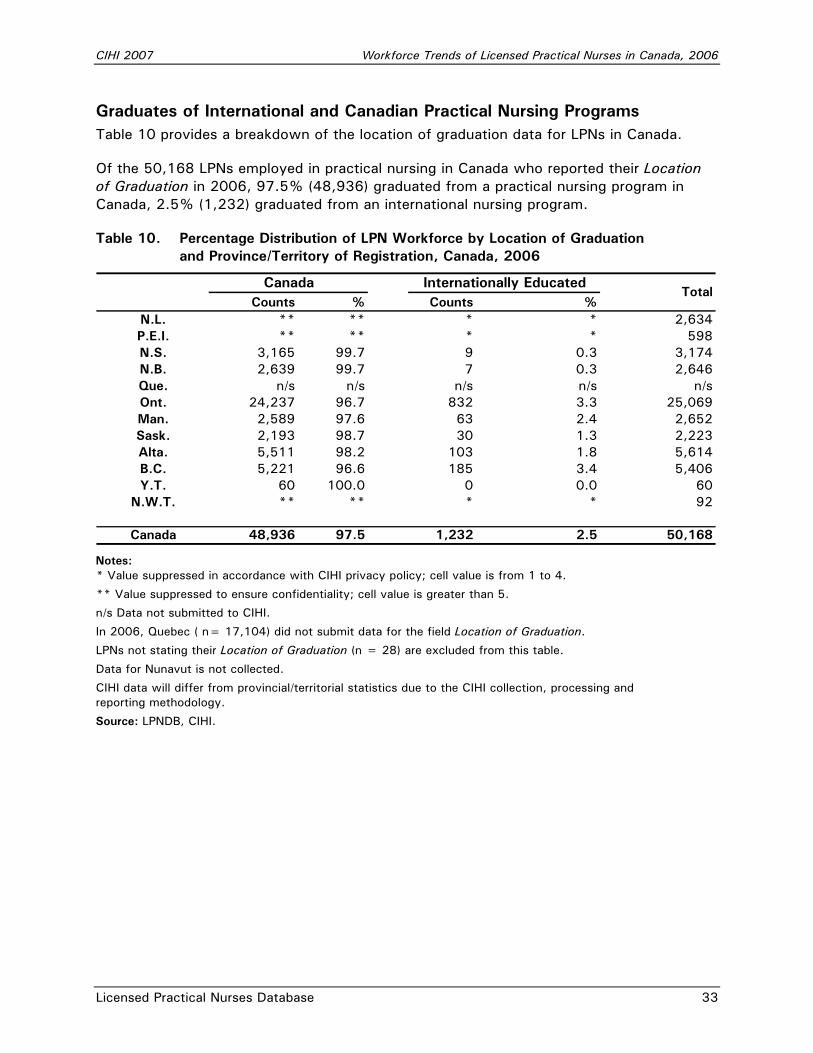
Graduates of International and Canadian Practical Nursing Programs Table 10 provides a breakdown of the location of graduation data for LPNs in Canada.
Of the 50,168 LPNs employed in practical nursing in Canada who reported their Location of Graduation in 2006, 97.5% (48,936) graduated from a practical nursing program in Canada, 2.5% (1,232) graduated from an international nursing program.
Table 10. Percentage Distribution of LPN Workforce by Location of Graduation and Province/Territory of Registration, Canada, 2006
Counts % Counts %N.L. ** ** * * 2,634P.E.I. ** ** * * 598N.S. 3,165 99.7 9 0.3 3,174N.B. 2,639 99.7 7 0.3 2,646Que. n/s n/s n/s n/s n/sOnt. 24,237 96.7 832 3.3 25,069Man. 2,589 97.6 63 2.4 2,652Sask. 2,193 98.7 30 1.3 2,223Alta. 5,511 98.2 103 1.8 5,614B.C. 5,221 96.6 185 3.4 5,406Y.T. 60 100.0 0 0.0 60
N.W.T. ** ** * * 92
Canada 48,936 97.5 1,232 2.5 50,168
Canada Internationally EducatedTotal
Notes: * Value suppressed in accordance with CIHI privacy policy; cell value is from 1 to 4.
** Value suppressed to ensure confidentiality; cell value is greater than 5.
n/s Data not submitted to CIHI.
In 2006, Quebec ( n= 17,104) did not submit data for the field Location of Graduation.
LPNs not stating their Location of Graduation (n = 28) are excluded from this table.
Data for Nunavut is not collected.
CIHI data will differ from provincial/territorial statistics due to the CIHI collection, processing and reporting methodology.
Source: LPNDB, CIHI.
Workforce Trends of Licensed Practical Nurses in Canada, 2006 CIHI 2007
34 Licensed Practical Nurses Database
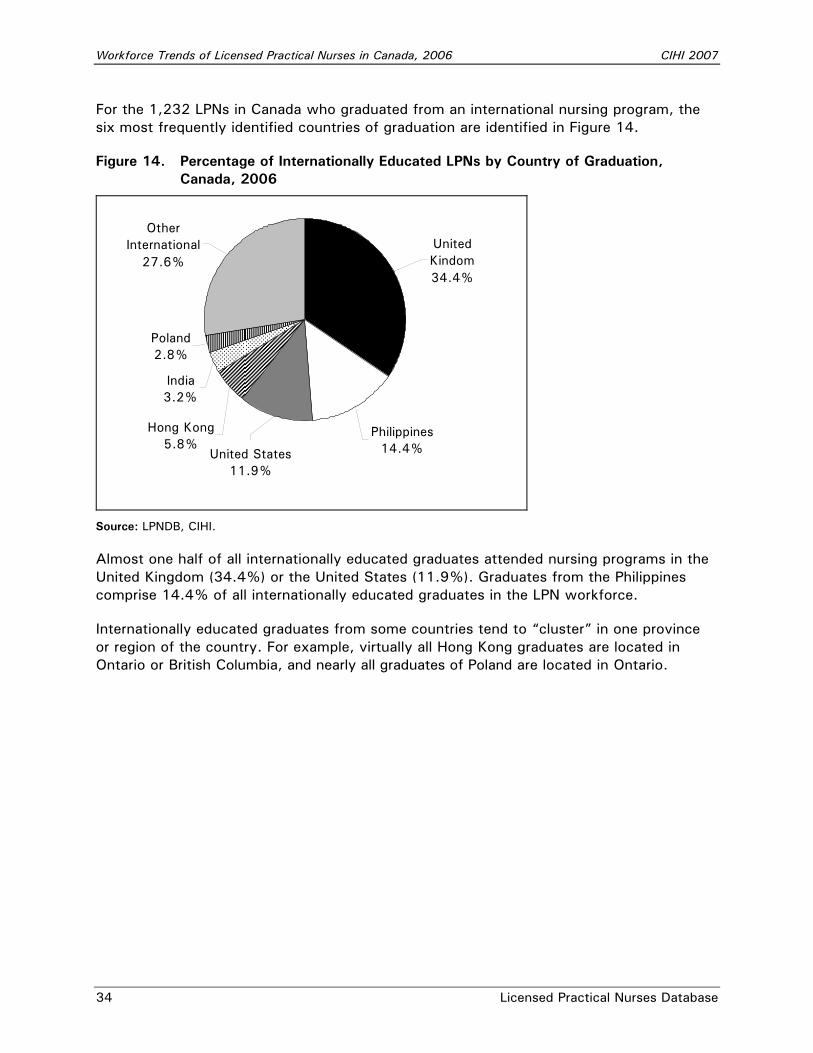
For the 1,232 LPNs in Canada who graduated from an international nursing program, the six most frequently identified countries of graduation are identified in Figure 14.
Figure 14. Percentage of Internationally Educated LPNs by Country of Graduation, Canada, 2006
India3.2%
Poland2.8%
United Kindom34.4%
Other International
27.6%
Hong Kong5.8%
Philippines14.4%United States
11.9%
Source: LPNDB, CIHI.
Almost one half of all internationally educated graduates attended nursing programs in the United Kingdom (34.4%) or the United States (11.9%). Graduates from the Philippines comprise 14.4% of all internationally educated graduates in the LPN workforce.
Internationally educated graduates from some countries tend to “cluster” in one province or region of the country. For example, virtually all Hong Kong graduates are located in Ontario or British Columbia, and nearly all graduates of Poland are located in Ontario.
CIHI 2007 Workforce Trends of Licensed Practical Nurses in Canada, 2006
Licensed Practical Nurses Database 35
Distribution Analysis This analysis of the distribution patterns of LPNs in Canada includes two components: (1) an examination of the location of graduation for members of each provincial/territorial workforce; and (2) an analysis of the mobility of Canadian graduates across the country. These components should be used together to better understand the mobility of the LPN workforce in Canada.
Workforce Composition Each provincial/territorial workforce is a combination of graduates from within the province/ territory, graduates from other Canadian jurisdictions, and graduates from outside the country. This analysis highlights the interprovincial mobility of LPNs into each jurisdiction, which can assist and inform recruitment methods.
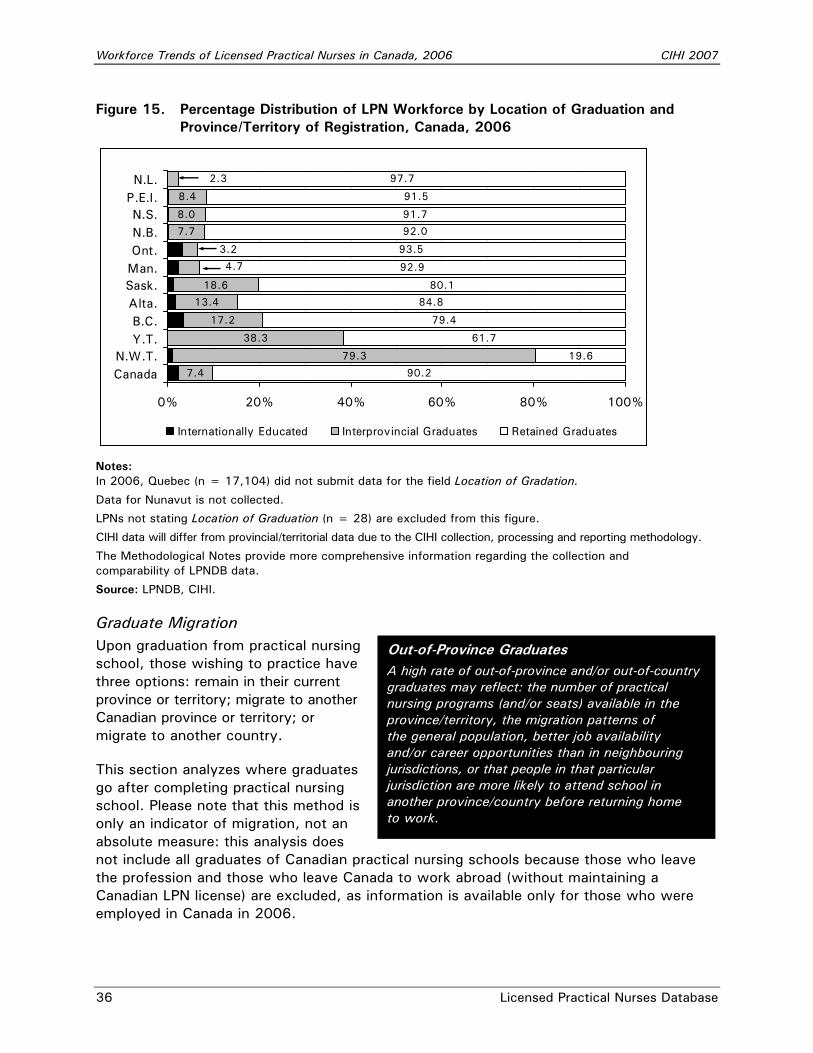
In Figure 15, those graduating outside of the country are termed “Internationally Educated,” graduates of practical nursing schools in other Canadian provinces or territories are termed “Interprovincial Graduates,” and graduates of practical nursing schools from within the province are termed “Retained Graduates,” and those who failed to state their place of graduation are termed “Unknown.”
In 2006, the LPN workforces of British Columbia (3.4%) and Ontario (3.3%) had the highest concentration of internationally educated graduates. In contrast, both Nova Scotia and New Brunswick LPN workforce (0.3%) graduated from an international nursing school.
More than 10 percent of the LPN workforces of Saskatchewan (18.6 %), British Columbia (17.2%), Alberta (13.4%), Yukon (38.3%) and the Northwest Territories (79.3%) graduates from other provinces/territories in Canada.
Workforce Trends of Licensed Practical Nurses in Canada, 2006 CIHI 2007
36 Licensed Practical Nurses Database
Figure 15. Percentage Distribution of LPN Workforce by Location of Graduation and Province/Territory of Registration, Canada, 2006
7.4
79.3
38.3
17.2
13.4
18.6
7.7
8.0
8.4
4.7
3.2
2.3 97.7
91.5
91.7
92.0
93.5
92.9
80.1
84.8
79.4
61.7
19.6
90.2
0% 20% 40% 60% 80% 100%
N.L.P.E.I.N.S.N.B.Ont.Man.Sask.Alta.B.C.Y.T.
N.W.T.Canada
Internationally Educated Interprovincial Graduates Retained Graduates
Notes: In 2006, Quebec (n = 17,104) did not submit data for the field Location of Gradation.
Data for Nunavut is not collected.
LPNs not stating Location of Graduation (n = 28) are excluded from this figure.
CIHI data will differ from provincial/territorial data due to the CIHI collection, processing and reporting methodology.
The Methodological Notes provide more comprehensive information regarding the collection and comparability of LPNDB data.
Source: LPNDB, CIHI.
Graduate Migration Upon graduation from practical nursing school, those wishing to practice have three options: remain in their current province or territory; migrate to another Canadian province or territory; or migrate to another country.
This section analyzes where graduates go after completing practical nursing school. Please note that this method is only an indicator of migration, not an absolute measure: this analysis does not include all graduates of Canadian practical nursing schools because those who leave the profession and those who leave Canada to work abroad (without maintaining a Canadian LPN license) are excluded, as information is available only for those who were employed in Canada in 2006.
Out-of-Province Graduates A high rate of out-of-province and/or out-of-country graduates may reflect: the number of practical nursing programs (and/or seats) available in the province/territory, the migration patterns of the general population, better job availability and/or career opportunities than in neighbouring jurisdictions, or that people in that particular jurisdiction are more likely to attend school in another province/country before returning home to work.

CIHI 2007 Workforce Trends of Licensed Practical Nurses in Canada, 2006
Licensed Practical Nurses Database 37
Further, this method compares only two points in time: the year of graduation to the 2006 registration year. Multiple moves during the period in-between cannot be identified.
Regardless, this analysis provides valuable information to better understand the mobility of graduates. Much of the mobility mirrors the east-to-west pattern of migration found in the general Canadian population.
Among Canadian graduates in the 2006 LPN workforce (excluding Quebec for which data are not available), those graduating from practical nursing programs in Ontario (97.0%), British Columbia (95.5%) and New Brunswick (93.6%) were the most likely to be employed in their province of graduation.
In contrast, 83.8% of graduates from Newfoundland and Labrador practical nursing programs (who were employed in Canada in 2006), 85.6% of graduates from Alberta and 86.2 % of graduates from Saskatchewan practical nursing programs remained in those provinces.
Overall, more than nine out of ten (93.2%) graduates of Canadian practical nursing programs, who were working in Canada in 2006, either did not move after graduation or eventually returned to that jurisdiction. Figure 16 excludes Quebec, for which data were not available.
Figure 16. LPN Graduates by Province/Territory of Registration, Canada, 2006
83.8
92.1
93.4
93.6
97.0
87.3
86.2
85.6
95.5
56.9
56.3
13.8
43.8
43.1
4.3
2.9%
6.6
16.0
7.7
14.4
6.4
12.7
0% 10% 20% 30% 40% 50% 60% 70% 80% 90% 100%
N.W.T. Grads
Y.T. Grads
B.C. Grads
Alta. Grads
Sask. Grads
Man. Grads
Ont. Grads
N.B. Grads
N.S. Grads
P.E.I. Grads
N.L. Grads
Graduates Remaining in the Jurisdiction Graduates Moving Interprovincially
Notes: In 2006, Quebec did not submit data for the field Location of Graduation and is therefore excluded from this figure.
Figure 16 includes only graduates of a Canadian practical nursing program (n = 48,559).
Data for Nunavut is not collected.
Source: LPNDB, CIHI.

Workforce Trends of Licensed Practical Nurses in Canada, 2006 CIHI 2007
38 Licensed Practical Nurses Database
Figure 17 expands this analysis for each jurisdiction, showing the most frequent destinations for those who moved after graduation. Once again, only Canadian graduates employed in Canada in 2006 can be included in this analysis.
Figure 17 is a comparison at two points in time: a comparison of the province of graduation to the current province of registration. The data in Figure 17 do not account for mobility and migration in the intervening years.
Figure 17. Three Most Frequent Destinations for LPN Graduates Leaving the Jurisdiction by Province/Territory of Graduation, Canada, 2006
Ont.
N.S.
Ont.
Ont.
B.C.
B.C.
Alta
B.C.
Alta.
Alta.
Ont.
N.B.
N.S.
Alta.
Alta.
B.C.
Sask.
Ont.
N.S.
N.B.
B.C.
Alta.
N.S.
Sask.
Ont.
Ont.
Sask.
0.0% 2.0% 4.0% 6.0% 8.0% 10.0% 12.0% 14.0% 16.0%
B.C.
Alta.
Sask.
Man.
Ont.
N.B.
N.S.
P.E.I
N.L.
Notes: Figure 17 includes only the three most frequently identified destinations for LPN graduates; not all destinations are presented.
Figure 17 includes only graduates of a Canadian practical nursing program (n = 48,559).
Yukon and Northwest Territories data are not presented due to concerns for small cell values. In 2006, 24.6% (16) of all Yukon graduates were employed in British Columbia, and 18.8% (6) of all Northwest Territories graduates were employed in Alberta.
Data for Nunavut is not collected.
Source: LPNDB, CIHI.
Please refer to Data Tables H.LPN.1 and H. Summary on the CIHI website for more Location of Graduation data.
The Internal Migration of LPNs Some reasons why Canadian-trained LPNs may choose to re-locate to another province/territory after LPN graduation include: availability of jobs, greater income/benefits, availability of full-time employment, family reasons, and personal growth or development.
CIHI 2007 Workforce Trends of Licensed Practical Nurses in Canada, 2006
Licensed Practical Nurses Database 39
Methodological Notes The following information should be used to ensure a clear understanding of the basic concepts that define the data provided in this publication, of the underlying methodology of the data collection, and of key aspects of the data quality.
This information will provide a better understanding of the strengths and limitations of the data, and of how they can be effectively used and analyzed. The information is of particular importance when making comparisons with other data sources, and especially when drawing conclusions regarding changes over time.
The Canadian Institute for Health Information is founded upon the principles of data quality and privacy and confidentiality. Data collection, processing, analysis and dissemination are each guided by CIHI’s commitment to ensuring good quality data in a privacy-sensitive manner. Further details regarding CIHI’s privacy principles are available in the document Privacy and Confidentiality of Health Information at CIHI: Principles and Policies for the Protection of Health Information, which may be obtained from the CIHI website.
Background Purpose The Canadian Institute for Health Information produces this publication annually to provide readers with the most recent statistics on the licensed practical nursing workforce. The supply and distribution information included in this publication are used by a wide variety of governmental and non-governmental organizations to better understand the changing supply and distribution of the LPN workforce. This information contributes to policy formulation and decision-making, particularly at the national and provincial/territorial levels.
This publication includes current and historical information on the demographic, education, employment and mobility trends of the LPN workforce. These statistics from CIHI’s Licensed Practical Nurses Database are supplemented with detailed information about the data collection process, pertinent limitations of the current data and an explanation of the analytical methods used in creating these statistics.
Value The supply and distribution information presented here is one key component to health human resource planning at the national and provincial/territorial levels. Any planning or projection of the number of health professionals required for a particular jurisdiction must begin with an understanding of the current supply, and how that supply is changing.
History The Licensed Practical Nurses Database (LPNDB) contains supply and distribution information for the licensed practical nursing workforce in Canada from 2002 to the present and is managed by the Canadian Institute for Health Information (CIHI).
Workforce Trends of Licensed Practical Nurses in Canada, 2006 CIHI 2007
40 Licensed Practical Nurses Database
Data Coverage Definition of Licensed Practical Nurse Licensed practical nurses (LPNs) are regulated health professionals who work independently or in collaboration with other members of the health care team to provide nursing services to individuals, families and groups of all ages.
LPNs combine nursing knowledge, skills and judgment when assessing clients, promoting health, preventing illness, providing palliative and/or rehabilitative care, and assisting clients to achieve an optimal state of health. They assess, plan, implement and evaluate care for clients throughout the life.
LPNs practise in a variety of settings and contexts including, but not limited to, hospitals, homes for the aged, public-health units, community-nursing agencies, private practices, clinics, doctors’ offices, industry, schools, adult day-care centres, private homes, community health centres, child-care centres and children’s camps.3
Population of Interest For the LPNDB, the population of interest is all licensed practical nurses submitting active-practising registration in a Canadian province or territory.
Population of Reference Because CIHI cannot wait for the 12-month registration period to end in each jurisdiction before collecting data, the population of reference for the LPNDB is all licensed practical nurses submitting active-practising registration in a Canadian province or territory in the first six months of the registration year.
The subtle difference between the population of interest and the population of reference—seeking information only from those registering in the first six months—better enables CIHI to produce timely data. Analyses completed annually by CIHI indicate that fewer than 4% of LPNs register after the six-month mark, thus ensuring that CIHI’s trends are consistent with provincial/territorial trends that include those registering after the six-month mark.
Data Inclusions Data collected for the LPNDB include:
• Registration information from twelve of Canada’s provinces and territories;
• All active-practising registrations received by the provincial/territorial regulatory authority within the first six months of registration;ii
• LPNs working in direct care, administration, education and/or research;
ii. CIHI only reports data from registrations that are determined to be primary registrations. The definition
and method used to identify primary registrations are included in the Data Processing Methods section of the Methodological Notes.
CIHI 2007 Workforce Trends of Licensed Practical Nurses in Canada, 2006
Licensed Practical Nurses Database 41
• LPNs employed in practical nursing, LPNs employed in other than licensed practical nursing, LPNs not employed and LPNs failing to state their employment status at the time of annual registration;
• LPNs employed in the public and/or private sectors;
• LPNs employed in hospitals, clinics, nursing homes and/or other facilities (including self-employed); and
• LPNs on temporary leave (such as maternity/paternity leave or short-term illness/injury leave), who expect to practice during the registration year.
Data Exclusions Data collected for the LPNDB exclude:
• Registered nurse and nurse practitioner data;iii
• Registered psychiatric nurseiv data;
• Unregulated aides and orderlies data;
• Information is not collected for LPNs working in Nunavut Territory;
• LPNs submitting active-practising registrations in the last six months of the registration year;
• LPNs submitting non-practising registrations (where available from the provincial/ territorial regulatory authority);
• LPNs living and/or working outside of Canada, except for those choosing to simultaneously maintain their Canadian LPN license; and
• LPNs who have left the workforce (e.g. retirement, change of profession).
Applying the Definition The methods by which data are defined and collected greatly affect the types of analyses and the final statistics produced. In fact, discrepancies between two different data holdings are often the result of differing definitions. That something as seemingly black-and-white as the number of licensed practical nurses can vary by definition can be difficult for those not used to working with data and statistics.
CIHI, in consultation with practical nursing stakeholders, developed a definition of licensed practical nurse (LPN) that best serves health human resource (HHR) planning and research needs. The definition does not focus on the duties and responsibilities of a practising LPN, but instead narrowly defines the limits of who are included in the final statistics.
iii. In Canada, registered nurses and nurse practitioners are educated and regulated as separate professions
from practical nursing.
iv. In Canada, registered psychiatric nurses are educated and regulated as a separate profession only in British Columbia, Alberta, Saskatchewan and Manitoba.

Workforce Trends of Licensed Practical Nurses in Canada, 2006 CIHI 2007
42 Licensed Practical Nurses Database
The CIHI definition is consistent with existing CIHI definitions of registered nurse and registered psychiatric nurse, and satisfies the analytical needs of the organization and its clients. The CIHI definition is narrower than the definition used by provincial/territorial regulatory authorities, and this is acceptable because the primary function of regulatory authorities (LPN registration) differs from the primary function of CIHI’s Licensed Practical Nurses Database (health human resources planning and research). For registration, it is critical to know how many registrants are currently eligible to practice; for research, it is critical to understand how many eligible registrants are currently practising, and how many are currently without employment in practical nursing.
These differences in definition can unfortunately lead to confusion, particularly when one set of statistics is consistently less than another set. This can result in different (and in rare cases, conflicting) trends in the data, leading to questions of accuracy (i.e. which data are more accurate?), as different trends can greatly impact planning and projections.
To minimize this confusion, CIHI has developed a chart to illustrate the differences in definitions between the provincial/territorial regulatory authorities and CIHI. The chart traces the effects of CIHI’s collection and processing on regulatory statistics, illustrating how regulatory statistics “become” CIHI statistics. In Appendix B, these charts are completed for each province/territory using 2006 data.
How the Definition Narrows Provincial/territorial regulatory authorities typically report the number of active-practising registrations/licenses as their “total,” as this number represents the number of registrants eligible to practice in practical nursing during the given year.
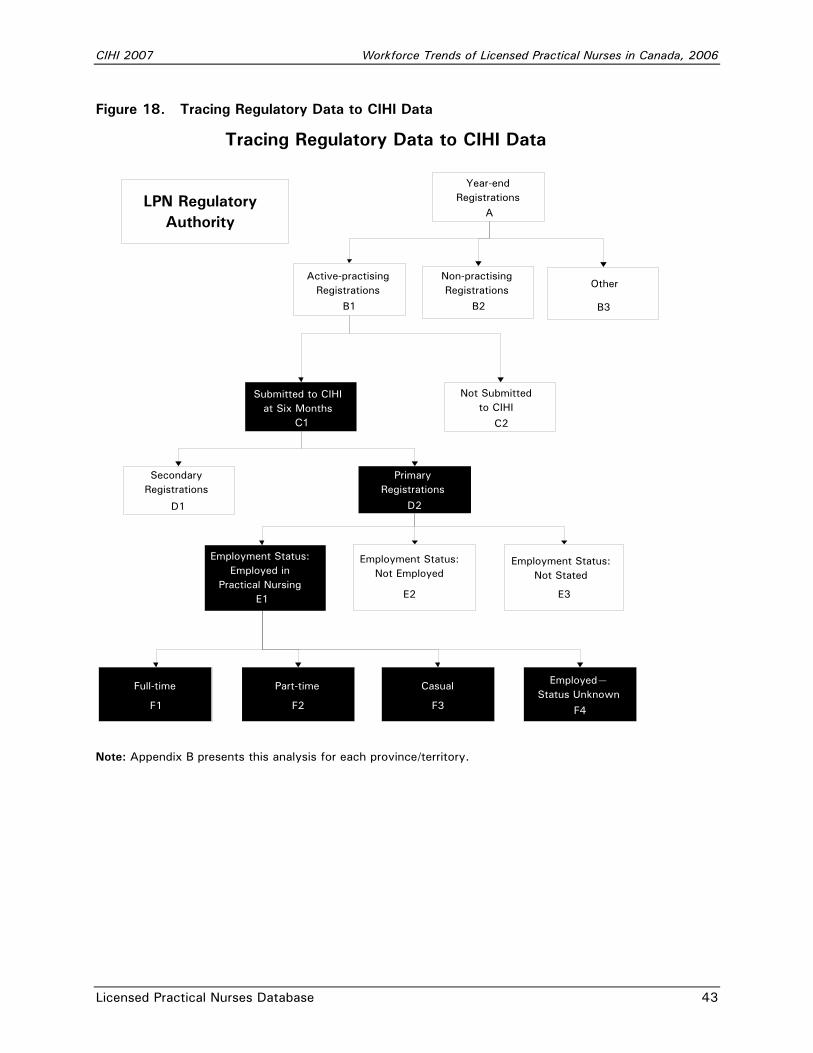
CIHI 2007 Workforce Trends of Licensed Practical Nurses in Canada, 2006
Licensed Practical Nurses Database 43
Figure 18. Tracing Regulatory Data to CIHI Data
Year-end Registrations
A
Active-practisingRegistrations
B1
Non-practisingRegistrations
B2
Submitted to CIHIat Six Months
C1
Not Submitted to CIHI
C2
SecondaryRegistrations
D1
PrimaryRegistrations
D2
Employment Status:Not Employed
E2
Employment Status:Employed in
Practical NursingE1
Employment Status:Not Stated
E3
Full-time
F1
Part-time
F2
Casual
F3
Employed—Status Unknown
F4
Tracing Regulatory Data to CIHI Data
LPN RegulatoryAuthority
Other
B3
Note: Appendix B presents this analysis for each province/territory.

Workforce Trends of Licensed Practical Nurses in Canada, 2006 CIHI 2007
44 Licensed Practical Nurses Database
A: All Registrations
Box A is the total number of registrations submitted to a provincial/territorial regulatory authority for practical nursing. The total is comprised of active-practising (B1), non-practising (B2) and other (B3) registrations.
B: Types of Registrations
Box B1 is the number of active-practising registrations received by the provincial/territorial regulatory authority. With an active-practising registration, registrants are eligible to practise as a practical nurse in that jurisdiction.
Box B2 is the number of non-practising registrations received by the provincial/territorial regulatory authority. Those registering with a non-practising registration are not eligible to practise as a practical nurse in that jurisdiction. Some types of non-practising registrations are long-term disability, associate status and retired status. Non-practising registrations are not submitted to CIHI. Box B3 includes other types of registration, such as student registrations.
C: Records Submitted to CIHI
To analyze and release timely data, CIHI receives only those active-practising registrations submitted during the first six months of the registration year (Box C1). Data for those registering in months 7 to 12 (Box C2) are not submitted to CIHI.
D: Excluding Secondary Registrations
As there are financial and administrative incentives for practical nurses to maintain registration in one jurisdiction when beginning registration in another, CIHI evaluates each record to determine whether the registration reflects the primary province/territory of employment (Box D2). It is necessary to identify and exclude from further analysis secondary records, as CIHI aims to report accurate head count (rather than full-time equivalent) data. A flow chart illustrating this process is available in Appendix A.
E: Employment Status
Whereas the statistics produced by provincial/territorial regulatory authorities include all active-practising registrations, regardless of employment status, CIHI statistics typically include only those registrants explicitly stating their employment in practical nursing (Box E1). Those employed in other than practical nursing (Box E2), those not employed (also Box E2), and those failing to state their employment status (Box E3) are excluded from the final statistics. CIHI defines the LPN workforce as those currently employed in practical nursing at the time of registration (Box E1).
F: Full-Time/Part-Time Status
Most analyses produced by CIHI, such as the full-time/part-time status of the LPN workforce, include only those LPNs employed in practical nursing.

CIHI 2007 Workforce Trends of Licensed Practical Nurses in Canada, 2006
Licensed Practical Nurses Database 45
To illustrate how this narrowing definition impacts the data, year 2006 data are compared in Table 11.
Table 11. Comparison of LPN Regulatory Authority 12-Month Counts to CIHI 6-Month Counts, Canada, 2006
N.L. P.E.I. N.S. N.B. Que. Ont. Man. Sask. Alta. B.C. Y.T. N.W.T. Nun. TotalTotal Active Practising Registrations 2,762 649 3,515 2,907 19,696 29,975 2,860 2,345 6,715 5,940 62 103 .. 77,529Submitted to CIHI 2,691 649 3,379 2,809 18,757 29,975 2,740 2,258 6,353 5,865 62 103 .. 75,641Primary Registrations 2,686 656 3,361 2,796 18,727 29,575 2,729 2,251 6,247 5,782 61 97 .. 74,968Employed in Practical Nursing 2,639 599 3,174 2,646 17,104 25,084 2,652 2,224 5,614 5,412 60 92 .. 67,300 Note: Data not currently collected by CIHI.
Sources: LPNDB, CIHI and provincial/territorial LPN regulatory authorities.
Registration Periods The 12-month registration period varies among provinces/territories, as each jurisdiction is responsible for setting the start and end dates of the registration period. Although most jurisdictions follow either a January–December or April–March registration year, it is not possible for CIHI to collect comparable data at one date in the calendar year. For example, collecting data on June 30 each year would represent eight months of registration in Nova Scotia, but only three months of registration in Quebec. Although most registration renewals occur one or two months before the start of the registration year, it is still not possible to select one calendar date.
The registration periods for each provincial/territorial jurisdiction are presented in Figure 19. This illustration represents the 2006 registration year.
Figure 19. LPN 12-Month Registration Periods by Province/Territory of Registration, 2006
Aug Sep Oct Nov Dec Jan Feb Mar Apr May Jun Jul Aug Sep Oct Nov Dec Jan Feb Mar AprN.L. xxxxx xxxxx xxxxx xxxxx xxxxx xxxxx xxxxx xxxxx xxxxx xxxxx xxxxx xxxxxP.E.I. xxxxx xxxxx xxxxx xxxxx xxxxx xxxxx xxxxx xxxxx xxxxx xxxxx xxxxx xxxxxN.S. xxxxx xxxxx xxxxx xxxxx xxxxx xxxxx xxxxx xxxxx xxxxx xxxxx xxxxx xxxxxN.B. xxxxx xxxxx xxxxx xxxxx xxxxx xxxxx xxxxx xxxxx xxxxx xxxxx xxxxx xxxxxQue. xxxxx xxxxx xxxxx xxxxx xxxxx xxxxx xxxxx xxxxx xxxxx xxxxx xxxxx xxxxxOnt. xxxxx xxxxx xxxxx xxxxx xxxxx xxxxx xxxxx xxxxx xxxxx xxxxx xxxxx xxxxxMan. xxxxx xxxxx xxxxx xxxxx xxxxx xxxxx xxxxx xxxxx xxxxx xxxxx xxxxx xxxxxSask. xxxxx xxxxx xxxxx xxxxx xxxxx xxxxx xxxxx xxxxx xxxxx xxxxx xxxxx xxxxxAlta. xxxxx xxxxx xxxxx xxxxx xxxxx xxxxx xxxxx xxxxx xxxxx xxxxx xxxxx xxxxxB.C. xxxxx xxxxx xxxxx xxxxx xxxxx xxxxx xxxxx xxxxx xxxxx xxxxx xxxxx xxxxxY.T. xxxxx xxxxx xxxxx xxxxx xxxxx xxxxx xxxxx xxxxx xxxxx xxxxx xxxxx xxxxxN.W.T. xxxxx xxxxx xxxxx xxxxx xxxxx xxxxx xxxxx xxxxx xxxxx xxxxx xxxxx xxxxx
2005 2006 2007
Notes: CIHI collects active-practising registrations submitted in the first six months of the registration period.
Data for Nunavut is not collected.
Workforce Trends of Licensed Practical Nurses in Canada, 2006 CIHI 2007
46 Licensed Practical Nurses Database
To produce timely information, CIHI cannot wait until the 12-month registration period has finished in each jurisdiction. Consequently, data are collected for the LPNDB at the six-month mark of each jurisdiction’s registration year. This staggered submission period ensures comparable data among the provinces, but at the expense of point-in-time comparisons. In the absence of point-in-time comparisons, it is difficult to determine the impact of national or world events, such as federal/provincial/territorial health accords, on the practical nursing workforce.
Please review the methodological differences in the Comparability section of the Methodological Notes when comparing CIHI data to provincial/territorial year-end figures.
Data Collection Methods Data Sources The provincial and territorial authorities responsible for LPN licensure collect data for the Licensed Practical Nurses Database. Annual registration is mandatory for LPNs wishing to practice.
A Data Agreement governs CIHI’s collection of LPN data. Each year, provincial/territorial regulatory authorities and CIHI review the core set of elements each province/ territory includes on the registration forms. Under the current agreement, each regulatory authority submits 20 data elements collected from each licensed practical nurse.
Data Collection Collecting data from individual LPNs is the responsibility of the regulatory authority. The data are manually entered, and a provincial/territorial file is submitted to CIHI in a standardized format. Not all data elements collected from the registration forms are sent to CIHI; each regulatory authority collects additional information for its own administrative and/or research purposes, apart from the elements outlined in the Data Agreement.
Contact information for each jurisdiction is provided in Appendix C.
Key Concepts and Definitions Each of the data elements listed corresponds to a field on the licensed practical nurse record. Only data elements used in tabulations for Workforce Trends of Licensed Practical Nurses in Canada, 2006 are described below. A complete list of data elements present in the LPNDB as well as the Licensed Practical Nurses System Data Dictionary and Processing Manual are available upon request to [email protected] or on the CIHI website at www.cihi.ca/nurses.

CIHI 2007 Workforce Trends of Licensed Practical Nurses in Canada, 2006
Licensed Practical Nurses Database 47
Province/Territory of Registration The province/territory in which an LPN is licensed to practice practical nursing.
Sex The self-reported gender of the licensed practical nurse.
Year of Birth The four-digit birth year of the practical nurse. Age is calculated as of December 31st in the registration year.
Initial Education in Practical Nursing Basic education program, or assessment of equivalency, used to prepare an LPN for entry into practice, leading to initial registration/licensure as an LPN.
Province/Country of Graduation Province/territory/country in which initial education in practical nursing was completed.
Graduation Year Year of graduation from initial education in practical nursing was completed.
Employment Status Current employment in a field(s) directly related to practical nursing practice: direct care, administration, education or research. Status is self-reported and based on hiring practices of employer and/or union contract. Based on “official status” with the primary employer. Reflects employment status as of time registrant is completing form or at time registration/ licensure comes into effect.
Place of Work Primary place of employment.
Area of Responsibility Within agency/facility of primary employment, the major focus of activities.
Position Current assigned role at primary place of employment as per title/job description.
Multiple Employment Status Currently employed as an LPN by more than one employer.

Workforce Trends of Licensed Practical Nurses in Canada, 2006 CIHI 2007
48 Licensed Practical Nurses Database
Data Processing Methods File Processing Once provincial/territorial data files are received by CIHI, all records undergo two stages of processing before inclusion in the national database.
The first stage of processing ensures that data are in the proper format, and that all responses pass specific validity and logic tests. Should submitted codes not match the standardized CIHI codes, an exception report is produced that identifies the error. In addition, the data also undergo tests to check for a logical relationship between specific fields. For example, an error is identified in the exception report if Graduation Year is less than Birth Year. Errors are reviewed jointly by CIHI and the respective regulatory authority representative, and corrected where possible. If a correction cannot be made, the code is changed to the appropriate default value.v
Once the file has passed all validity and logic tests, the second stage of processing begins. As licensed practical nurses are able to register simultaneously in more than one jurisdiction, a methodology was developed to identify (or “flag”) LPNs living outside of Canada or LPNs registered in more than one province/territory.
For more information on file processing contact [email protected].
Identification of Secondary Registrations To accurately count the number of LPNs registered and working in Canada, it is necessary to identify records that do not reflect the primary jurisdiction of employment.
For instance, there are administrative incentives for LPNs to maintain their Canadian LPN license while living and/or working outside of the country. Therefore, an LPN living abroad may continue to register with a Canadian LPN regulatory authority each year, even though she/he may have no intention of returning to Canada in the next 12 months. CIHI must identify these LPNs living abroad and remove their data from analysis, as CIHI only reports on the LPN workforce in Canada.
For those living and working in Canada, CIHI must also identify registrations that do not reflect the primary jurisdiction of practice. For example, similar to the international situation identified above, there are administrative incentives for LPNs to maintain their provincial/ territorial LPN license while living and/or working in another Canadian jurisdiction. Therefore, an LPN may continue to register in one province while living and/or working in another. To include both of these registrations in analyses would be double-counting. Therefore, CIHI evaluates each registration to ensure that it reflects the primary jurisdiction of practice. These secondary registrations are also termed “interprovincial duplicates.”
v. For more information on this methodology, contact [email protected].

CIHI 2007 Workforce Trends of Licensed Practical Nurses in Canada, 2006
Licensed Practical Nurses Database 49
All data received from the provinces/territories are kept in the LPNDB; however, secondary registrations are excluded from the annual publication, media release, and ad hoc queries. Primary registrations are defined as records meeting the following conditions:
Province/Country of Residence is either in Canada, or “Not Stated.”
• For LPNs employed in practical nursing, the Province of Employment equals Province of Registration; if Province of Employment is “Not Stated,” then Province of Residence equals Province of Registration; or
• For LPNs not employed in practical nursing (or for LPNs with Employment Status of “Not Stated”), Province of Residence equals Province of Registration; if Province of Residence is “Not Stated,” then the Province of Registration is accepted.
A flow chart that visually illustrates the duplicate identification process is presented in Appendix A, or is available upon request to the Program Lead, Nursing Databases.
Such a method for eliminating LPNs living abroad and secondary registrations does introduce certain errors. For example:
1. An LPN living in the United States but working in Canada will be erroneously removed as “Living Abroad.”
2. An LPN registered and living in one province/territory at the beginning of the year moves to and registers in another province/territory one to six months later. This duplicate registration will not be detected, and the LPN will be counted twice.
3. An LPN not working in practical nursing registers in a province/territory other than her/his province of residence. This registration will be identified erroneously as a secondary registration.
Theoretically, an LPN who registers and works in more than one province/territory simultaneously would be double-counted in the LPNDB, as the Province of Employment would match the Province of Registration in each jurisdiction.
The methodology for the removal of inter-provincial duplicates was developed by Statistics Canada in the early 1980s. This methodology was evaluated in 2000 for the Registered Nurses Database and has proven to be of great value. The methodology was then reviewed and applied to the new Licensed Practical Nurses Database in 2002.
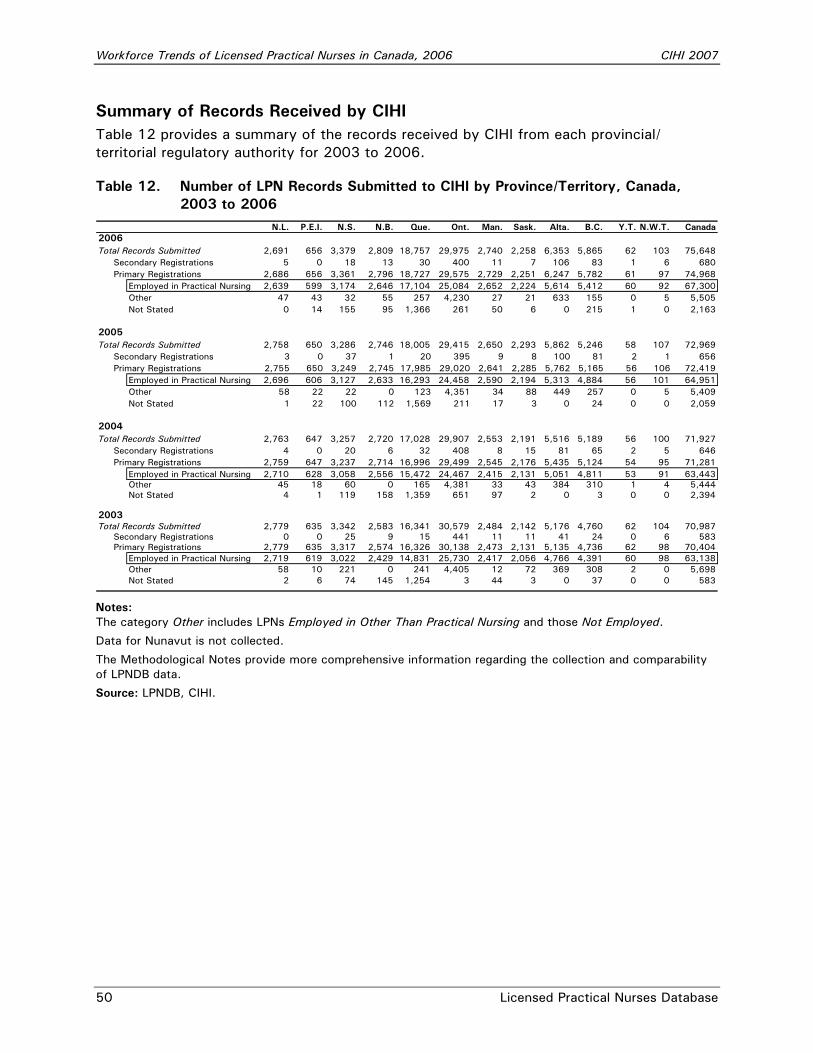
Workforce Trends of Licensed Practical Nurses in Canada, 2006 CIHI 2007
50 Licensed Practical Nurses Database
Summary of Records Received by CIHI Table 12 provides a summary of the records received by CIHI from each provincial/ territorial regulatory authority for 2003 to 2006.
Table 12. Number of LPN Records Submitted to CIHI by Province/Territory, Canada, 2003 to 2006
N.L. P.E.I. N.S. N.B. Que. Ont. Man. Sask. Alta. B.C. Y.T. N.W.T. Canada
Total Records Submitted 2,691 656 3,379 2,809 18,757 29,975 2,740 2,258 6,353 5,865 62 103 75,648Secondary Registrations 5 0 18 13 30 400 11 7 106 83 1 6 680Primary Registrations 2,686 656 3,361 2,796 18,727 29,575 2,729 2,251 6,247 5,782 61 97 74,968
Employed in Practical Nursing 2,639 599 3,174 2,646 17,104 25,084 2,652 2,224 5,614 5,412 60 92 67,300Other 47 43 32 55 257 4,230 27 21 633 155 0 5 5,505Not Stated 0 14 155 95 1,366 261 50 6 0 215 1 0 2,163
Total Records Submitted 2,758 650 3,286 2,746 18,005 29,415 2,650 2,293 5,862 5,246 58 107 72,969Secondary Registrations 3 0 37 1 20 395 9 8 100 81 2 1 656Primary Registrations 2,755 650 3,249 2,745 17,985 29,020 2,641 2,285 5,762 5,165 56 106 72,419
Employed in Practical Nursing 2,696 606 3,127 2,633 16,293 24,458 2,590 2,194 5,313 4,884 56 101 64,951Other 58 22 22 0 123 4,351 34 88 449 257 0 5 5,409Not Stated 1 22 100 112 1,569 211 17 3 0 24 0 0 2,059
Total Records Submitted 2,763 647 3,257 2,720 17,028 29,907 2,553 2,191 5,516 5,189 56 100 71,927Secondary Registrations 4 0 20 6 32 408 8 15 81 65 2 5 646Primary Registrations 2,759 647 3,237 2,714 16,996 29,499 2,545 2,176 5,435 5,124 54 95 71,281
Employed in Practical Nursing 2,710 628 3,058 2,556 15,472 24,467 2,415 2,131 5,051 4,811 53 91 63,443Other 45 18 60 0 165 4,381 33 43 384 310 1 4 5,444Not Stated 4 1 119 158 1,359 651 97 2 0 3 0 0 2,394
Total Records Submitted 2,779 635 3,342 2,583 16,341 30,579 2,484 2,142 5,176 4,760 62 104 70,987Secondary Registrations 0 0 25 9 15 441 11 11 41 24 0 6 583Primary Registrations 2,779 635 3,317 2,574 16,326 30,138 2,473 2,131 5,135 4,736 62 98 70,404
Employed in Practical Nursing 2,719 619 3,022 2,429 14,831 25,730 2,417 2,056 4,766 4,391 60 98 63,138Other 58 10 221 0 241 4,405 12 72 369 308 2 0 5,698Not Stated 2 6 74 145 1,254 3 44 3 0 37 0 0 583
2006
2005
2004
2003
Notes: The category Other includes LPNs Employed in Other Than Practical Nursing and those Not Employed.
Data for Nunavut is not collected.
The Methodological Notes provide more comprehensive information regarding the collection and comparability of LPNDB data.
Source: LPNDB, CIHI.
CIHI 2007 Workforce Trends of Licensed Practical Nurses in Canada, 2006
Licensed Practical Nurses Database 51
Analytical Methods Nunavut Data Nunavut Territory did not participate for the 2002 to 2006 data years. CIHI is working towards having Nunavut data available for future publications.
Urban/Rural Statistics For analytical purposes, urban areas are defined (in part) as communities with populations greater than 10,000 persons and are labelled by Statistics Canada as either a Census Metropolitan Area (CMA) or a Census Agglomeration (CA); Rural/Remote is equated with those communities outside the CMA/CA boundaries and is referred to as Rural and Small Town (RST) by Statistics Canada.
Rural and Small Town (RST) communities are further subdivided by identifying the degree to which they are influenced (in terms of social and economic integration) by larger urban centers (i.e. the CMAs and CAs). Metropolitan Influenced Zone (MIZ) categories disaggregate the RST population into four subgroups: Strong MIZ, Moderate MIZ, Weak MIZ, No MIZ. These urban/rural/remote categories are applied to communities (cities, town, villages, etc.) that can be equated with the Statistics Canada designation Census Subdivision (CSD). With the exception of 1.0% LPNs in 2004, we can identify the CSD of residence for the LPN workforce.
The CMA/CA and Metropolitan Influenced Zone (MIZ) categories were collapsed. These categories may be interpreted in the following simple manner: CMA/CA = large urban center (urban); Strong/Moderate MIZ = small towns and rural areas located relatively close to larger urban centers (rural); Weak/No MIZ = small towns, rural and remote communities distant from large urban centers (remote).
Details of the RST and MIZ classification schemes can be found in McNiven et al. (2000),4 du Plessis et al. (2001)5 and CIHI (2002).6
Computations All counts, unless otherwise noted, are based on licensed practical nurses employed in practical nursing. These figures exclude LPNs that are not employed in practical nursing, LPNs that are employed in other than practical nursing, and LPNs that do not state their employment status. Reporting on the LPNs employed in practical nursing most accurately reflects the actual workforce of licensed practical nurses in Canada.
Workforce Trends of Licensed Practical Nurses in Canada, 2006 CIHI 2007
52 Licensed Practical Nurses Database
Data Suppression To safeguard the privacy and confidentiality of data received by CIHI, guidelines have been developed to govern the publication and release of health information.
To ensure the anonymity of individual licensed practical nurses, data tables with cell counts from 1 to 4 are suppressed in the data tables presented in this publication. While this may seem unnecessary for more populous provinces, as it would be difficult to identify a single LPN employed somewhere in Ontario or British Columbia, CIHI is committed to protecting the confidential information from each licensed practical nurse.
Cell suppression does not apply, however, to “Not Stated” values in the data tables. The intent of cell suppression is to ensure anonymity: as it is impossible to “link” Not Stated data between tables, there is minimal risk of residual disclosure. Therefore, the suppression of “Not Stated” and “Unknown” values is not necessary.
In the tables presented in both the Descriptive Analysis section of this publication, and in the Data Tables presented on the CIHI website, cells with a value from 1 to 4 have been replaced by a single asterisk (*). However, presenting accurate row and column totals necessitates the suppression of a second value as well, to prevent the reader from determining the suppressed value through subtraction. Therefore, in each row and column with a suppressed value, a second value is suppressed as well. Generally, the next smallest value is chosen for additional suppression. However, if the second value suppressed is greater than 4, it must be replaced by a different symbol. For this, the LPN publication uses a double asterisk (**).
These policies also govern CIHI’s release of data through ad hoc queries and special analytical studies.
Symbols Standard symbols and numerical presentations are used wherever possible in this report. The standard symbols include:
* Value suppressed in accordance with CIHI privacy policy; cell value is from 1 to 4.
** Value suppressed to ensure confidentiality; cell value is 5 or greater.
– Data are not applicable or do not exist.
.. Data not currently collected by CIHI.
n/s Data not submitted to CIHI.
<0.1 value is less than 0.05%; value is replaced to prevent displaying cells of 0.0 that are not true zero values.
Other symbols, when necessary, are footnoted at the bottom of the respective table or figure.
CIHI 2007 Workforce Trends of Licensed Practical Nurses in Canada, 2006
Licensed Practical Nurses Database 53
Data Quality Assessment To ensure a high level of accuracy and usefulness in data dissemination, the Data Quality department at CIHI has developed a framework for assessing and reporting the quality of data contained in CIHI’s databases and registries. The framework focuses upon the five dimensions of data quality: Timeliness, Accuracy, Usability, Comparability and Relevance. Timeliness, Usability and Relevance are described briefly in the following paragraph. Accuracy and Comparability are then described in further detail as they relate more closely to the data processing routine.
Timeliness is achieved by collecting data at the six-month mark; on average, more than 95% of total records are achieved by the six-month mark, and this policy allows CIHI to analyze and release the data in a timely manner. Usability comprises the availability and documentation of the data, and the ease of interpretation. The Methodological Notes section contributes to Usability, as the limitations of data interpretation are clearly outlined. The Relevance of the dataset includes the adaptability and value of the data: for the LPNDB, continued strong interest from decision-makers, researchers and the media affirm the value of LPN workforce data. In addition, CIHI’s decision to collaborate with registered nurse and registered psychiatric nurse regulatory authorities to produce a more comprehensive snapshot of the entire regulated nursing workforce contributes to the adaptability and value of the data.
Accuracy Accuracy is an assessment of how well the data reflect reality. For the LPNDB, this is an assessment of how closely the data presented in this publication reflect the population of reference of all LPNs registered for active-practising membership in Canada in the first six months of the registration year.
Provincial/territorial regulating authorities collect these data for administrative purposes. It is through an agreement that these data are submitted to CIHI for research and analysis. Consequently, it is important to note that the level of accuracy and completeness necessary to meet the financial and administrative requirements of a registry can be considerably less stringent than that for research. Nevertheless, improvements in data collection systems and a jurisdictional-wide acknowledgement of the importance of good quality data have led to data collection and capture improvements for the LPNDB. This section outlines where caution must be applied when analyzing data presented in Workforce Trends of Licensed Practical Nurses in Canada, 2006.
Workforce Trends of Licensed Practical Nurses in Canada, 2006 CIHI 2007
54 Licensed Practical Nurses Database
Under-Coverage Under-coverage results when data that should be collected for the database are not included.
Data for the LPNDB is collected at the six-month mark of each jurisdiction’s 12-month registration period.vi But because the target population of the database is all LPNs submitting active-practising registration within the first six months of the registration year, this is not a case of under-coverage.
There are three known sources of under-coverage in the LPNDB data: first-time registrants the cut-off date for Ontario data and the Newfoundland and Labrador data.
First-Time Registrants
The jurisdictions of Prince Edward Island and Ontario do not submit data to CIHI from first-time registrants. This includes both new graduates and those new to the jurisdiction. The Yukon and the Northwest Territories do submit information on some first-time registrants. The Yukon does submit data on new graduates and for first-time registrants coming from other Canadian jurisdictions but they do not submit data for registrants coming from other countries. The Northwest Territories submits data on new graduates but does not submit data for first-time registrants coming from other Canadian jurisdictions or from other countries. As many first-time registrants are also active-practising licensed practical nurses, this is a source of under-coverage for the LPNDB.
Cut-Off Date for Ontario Data
Ontario data includes only LPNs registered before April 15, 2006, the formal suspension date in 2006 for non-payment of renewal fees. This represents the first 4.5 months of the registration year, instead of the 6 months collected from other LPN regulatory authorities.
This cut-off date is also used by the College of Nurses of Ontario, CIHI’s data provider, in preparation of year-end statistics.
Under-Coverage in 2006 Newfoundland and Labrador Data
After the data analysis was complete, it was discovered that there was an under-coverage of 8 LPNs in the 2006 Newfoundland and Labrador data, 7 of whom are employed in practical nursing and not included in the published numbers. These 8 records will be added to the LPNDB and included in future versions this publication.
vi. Please refer to Figure 16 for an illustration of the 2006 registration period for each province and territory.
CIHI 2007 Workforce Trends of Licensed Practical Nurses in Canada, 2006
Licensed Practical Nurses Database 55
Over-Coverage Over-coverage is the inclusion of data beyond the target population.
There are two known instances of over-coverage in the 2003–2006 LPN data.
Non-Practising Registrations
The target population of the LPNDB includes only LPNs submitting active-practising registrations; those submitting non-practising registrations are excluded. At present, the province of Ontario is the only jurisdiction that does not offer the option of active-practising or non-practising registration status to members: there is only one type of registration.
For this reason, this jurisdiction submits data to CIHI from LPNs who are not currently practising. While this is not a source of over-coverage—because all registrations are considered active-practising—the result is that some data fields will have a higher proportion of “Not Stated” values. This information should be considered when analyzing provincial and territorial LPNDB data.
LPNs on Leave
The target population excludes any LPNs who are not currently practising. Those LPNs on temporary leave (such as maternity/paternity leave, education leave or short-term illness or injury) are in a grey area. While these LPNs may be on leave at the time of annual registration, they may plan to return to practice during the 12-month registration year.
Therefore, an LPN on temporary leave may submit an active-practising registration (where the option exists), but may not actually be practising at the time of registration.
CIHI is currently investigating how data providers code the Employment Status of those on temporary leave. At present, it is assumed that LPNs on temporary leave submit active-practising registrations with full employment information (when possible), with the intent of returning to that position when the temporary leave ends.
While this is not a source of over-coverage, the fact that some LPNs only practice part of the year needs to be considered when analyzing LPNDB data.
Non-Response In the LPNDB, item non-response is defined as the percentage of “Not Stated” responses for each data element, as presented in Table 13.
For LPNs not currently employed in practical nursing, all employment fields in the LPNDB are defaulted to “Not Stated.” To calculate the amount of non-response, it is more accurate to include only those LPNs employed in practical nursing.
The degree of non-response varies among elements, with the largest percentages occurring in “Education in Other Than Practical Nursing” (38.1%) and “Other Education in Nursing—Non LPN” (56.4%).
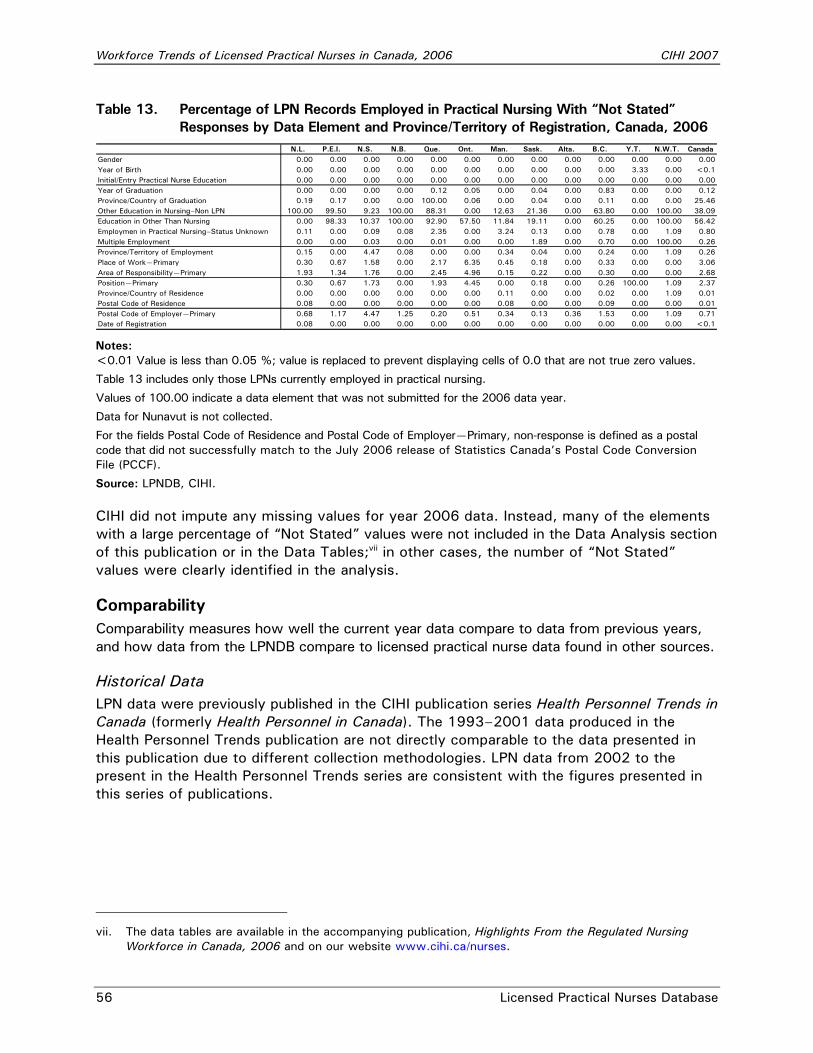
Workforce Trends of Licensed Practical Nurses in Canada, 2006 CIHI 2007
56 Licensed Practical Nurses Database
Table 13. Percentage of LPN Records Employed in Practical Nursing With “Not Stated” Responses by Data Element and Province/Territory of Registration, Canada, 2006
N.L. P.E.I. N.S. N.B. Que. Ont. Man. Sask. Alta. B.C. Y.T. N.W.T. CanadaGender 0.00 0.00 0.00 0.00 0.00 0.00 0.00 0.00 0.00 0.00 0.00 0.00 0.00Year of Birth 0.00 0.00 0.00 0.00 0.00 0.00 0.00 0.00 0.00 0.00 3.33 0.00 <0.1Initial/Entry Practical Nurse Education 0.00 0.00 0.00 0.00 0.00 0.00 0.00 0.00 0.00 0.00 0.00 0.00 0.00Year of Graduation 0.00 0.00 0.00 0.00 0.12 0.05 0.00 0.04 0.00 0.83 0.00 0.00 0.12Province/Country of Graduation 0.19 0.17 0.00 0.00 100.00 0.06 0.00 0.04 0.00 0.11 0.00 0.00 25.46Other Education in Nursing–Non LPN 100.00 99.50 9.23 100.00 88.31 0.00 12.63 21.36 0.00 63.80 0.00 100.00 38.09Education in Other Than Nursing 0.00 98.33 10.37 100.00 92.90 57.50 11.84 19.11 0.00 60.25 0.00 100.00 56.42Employmen in Practical Nursing–Status Unknown 0.11 0.00 0.09 0.08 2.35 0.00 3.24 0.13 0.00 0.78 0.00 1.09 0.80Multiple Employment 0.00 0.00 0.03 0.00 0.01 0.00 0.00 1.89 0.00 0.70 0.00 100.00 0.26Province/Territory of Employment 0.15 0.00 4.47 0.08 0.00 0.00 0.34 0.04 0.00 0.24 0.00 1.09 0.26Place of Work—Primary 0.30 0.67 1.58 0.00 2.17 6.35 0.45 0.18 0.00 0.33 0.00 0.00 3.06Area of Responsibility—Primary 1.93 1.34 1.76 0.00 2.45 4.96 0.15 0.22 0.00 0.30 0.00 0.00 2.68Position—Primary 0.30 0.67 1.73 0.00 1.93 4.45 0.00 0.18 0.00 0.26 100.00 1.09 2.37Province/Country of Residence 0.00 0.00 0.00 0.00 0.00 0.00 0.11 0.00 0.00 0.02 0.00 1.09 0.01Postal Code of Residence 0.08 0.00 0.00 0.00 0.00 0.00 0.08 0.00 0.00 0.09 0.00 0.00 0.01Postal Code of Employer—Primary 0.68 1.17 4.47 1.25 0.20 0.51 0.34 0.13 0.36 1.53 0.00 1.09 0.71Date of Registration 0.08 0.00 0.00 0.00 0.00 0.00 0.00 0.00 0.00 0.00 0.00 0.00 <0.1 Notes: <0.01 Value is less than 0.05 %; value is replaced to prevent displaying cells of 0.0 that are not true zero values.
Table 13 includes only those LPNs currently employed in practical nursing.
Values of 100.00 indicate a data element that was not submitted for the 2006 data year.
Data for Nunavut is not collected.
For the fields Postal Code of Residence and Postal Code of Employer—Primary, non-response is defined as a postal code that did not successfully match to the July 2006 release of Statistics Canada’s Postal Code Conversion File (PCCF).
Source: LPNDB, CIHI.
CIHI did not impute any missing values for year 2006 data. Instead, many of the elements with a large percentage of “Not Stated” values were not included in the Data Analysis section of this publication or in the Data Tables;vii in other cases, the number of “Not Stated” values were clearly identified in the analysis.
Comparability Comparability measures how well the current year data compare to data from previous years, and how data from the LPNDB compare to licensed practical nurse data found in other sources.
Historical Data LPN data were previously published in the CIHI publication series Health Personnel Trends in Canada (formerly Health Personnel in Canada). The 1993–2001 data produced in the Health Personnel Trends publication are not directly comparable to the data presented in this publication due to different collection methodologies. LPN data from 2002 to the present in the Health Personnel Trends series are consistent with the figures presented in this series of publications.
vii. The data tables are available in the accompanying publication, Highlights From the Regulated Nursing
Workforce in Canada, 2006 and on our website www.cihi.ca/nurses.
CIHI 2007 Workforce Trends of Licensed Practical Nurses in Canada, 2006
Licensed Practical Nurses Database 57
This publication highlights LPN data from 2003 to 2006. LPN data for 2002 are not included in the analysis section of this publication as a result of limitations surrounding the historical comparability of the data. Detailed information on the comparability limitations of the LPN data are noted under the heading “Number of LPNs Employed in Practical Nursing” found below.
Newfoundland and Labrador
In 2006, data for the field Location of Graduation was reviewed by CIHI and College of Licensed Practical Nurses of Newfoundland and Labrador (CLPNNL) for the 2002 to 2005 data years. After review, CLPNNL found inconsistencies in the data and submitted corrections to CIHI. These corrections have been implemented in the LPNDB and for this publication.
Prince Edward Island
In 2005, CIHI reported an under-coverage of six LPNs in the PEI data; all six LPNs were employed in practical nursing and should have been included in published numbers. These six records have been added to the LPNDB and are included in this publication.
Quebec
In 2006, l’Ordre des infirmières et infirmiers auxiliaires du Québec (OIIAQ) and CIHI reviewed data for the fields Education in Other Nursing Discipline and Education in Other Than Nursing for the 2002 to 2005 data years. After review, the OIIAQ found errors in the data submission where records should have been listed as a ‘Diploma’ and not a ‘Doctorate’. Corrections have been received and implemented by CIHI in the LPNDB and for this publication.
Please note this historical revision when comparing the LPNDB data over time.
Year 2006 Data Please note the following comparability limitations in year 2006 data when reviewing the data presented in the Data Analysis section of this publication and when reviewing the Data Tables presented in the accompanying publication Highlights From the Regulated Nursing Workforce in Canada, 2006 and on our website.
Number of LPNs Employed in Practical Nursing—A methodology to report Employment Status was developed for the preparation and submission of 2003 Ontario data to the Licensed Practical Nurses Database (LPNDB).
Historically, LPNs who failed to state their employment status (i.e. full-time, part-time or casual) on their registration form had their employment status submitted to CIHI as “Not Stated.” In CIHI’s processing and reporting methodology, LPNs failing to state their employment status are excluded from the final statistics because CIHI figures include only those employed on a full-time, part-time or casual basis. The result was that some LPNs employed in practical nursing were erroneously excluded from analysis.

Workforce Trends of Licensed Practical Nurses in Canada, 2006 CIHI 2007
58 Licensed Practical Nurses Database
Starting with the 2004 data year, LPNs with an employer in practical nursing but who fail to state their full-time, part-time or casual status with that employer were re-coded from Not Stated to Employed in Practical Nursing—Status Unknown. Because these LPNs are now considered to be employed, their data can be included in CIHI’s final statistics.
This enhanced methodology results in more accurate statistics that are more closely aligned with those published by the provincial/territorial regulatory bodies, and may also include those LPNs that are on temporary leave such as short-term disability or maternity/paternity leave. Unfortunately, this will impair trending analyses. Please contact the Program Lead, Nursing Databases for more information regarding the collection, processing and reporting of LPNDB data.
For a complete listing of data elements submitted by the regulatory authorities, refer to the CIHI website.viii
Data Limitations General Comparability • Manitoba—Starting with the 2003 data year, CIHI data includes only those LPNs
registered between December 1 and May 31.
• Northwest Territories—For the 2003 data year, the renewal form was changed to capture more specific, relevant information. This resulted in a more accurate reflection of the LPN totals than in the previous years. Given that the total number of registrants for LPNs in the N.W.T is very small, there are substantial differences in percentages between 2002 and 2006; thus comparisons between 2002 and 2006 data must be made with caution.
Location of Residence
• Yukon—For the 2002 to 2006 data years, this field was derived from the Postal Code of Residence.
Education
• British Columbia—In an effort to improve data quality, the College of Licensed Practical Nurses of British Columbia (CLPNBC) provided educational material to registrants on how to complete the Education sections of the annual renewal form. As a result, the number of registrants selecting None has decreased for the fields Education in Other Nursing Discipline and Education in Other Than Nursing.
viii. The listing of data elements submitted by the regulatory authorities to CIHI is available on the CIHI
Nursing website www.cihi.ca/nurses.
CIHI 2007 Workforce Trends of Licensed Practical Nurses in Canada, 2006
Licensed Practical Nurses Database 59
Initial Education in Practical Nursing
• Nova Scotia—For this field, the College of Licensed Practical Nurses of Nova Scotia (CLPNNS) included the options Certificate and Diploma as collected on the annual renewal registration form in the CIHI category Diploma.
• Saskatchewan—For this field, the Saskatchewan Association of Licensed Practical Nurses (SALPN) included the options Certificate or Diploma of education completed in the last 12 months on the registration form. For the 2003 data year, a low percent of initial registrants indicated Diploma status and a high percent (32.6%) indicated Not Stated on the registration form. The SALPN suspects that this field on the registration form was not clear and some members may have left the field blank instead of checking Diploma. As such, the Diploma category in this field is under-represented.
Location of Graduation
• Quebec—The OIIQ does not submit data for this field, all records are default to Not Stated.
Other Education in Nursing—Non-Practical Nursing
• This data element was not collected by the following provinces/territories for the 2002 to 2006 data years:
− Newfoundland and Labrador
− New Brunswick
− Northwest Territories
Education in Other Than Nursing
• This data element was not collected by the following provinces/territories for the 2002 to 2006 data years:
− New Brunswick
− Northwest Territories
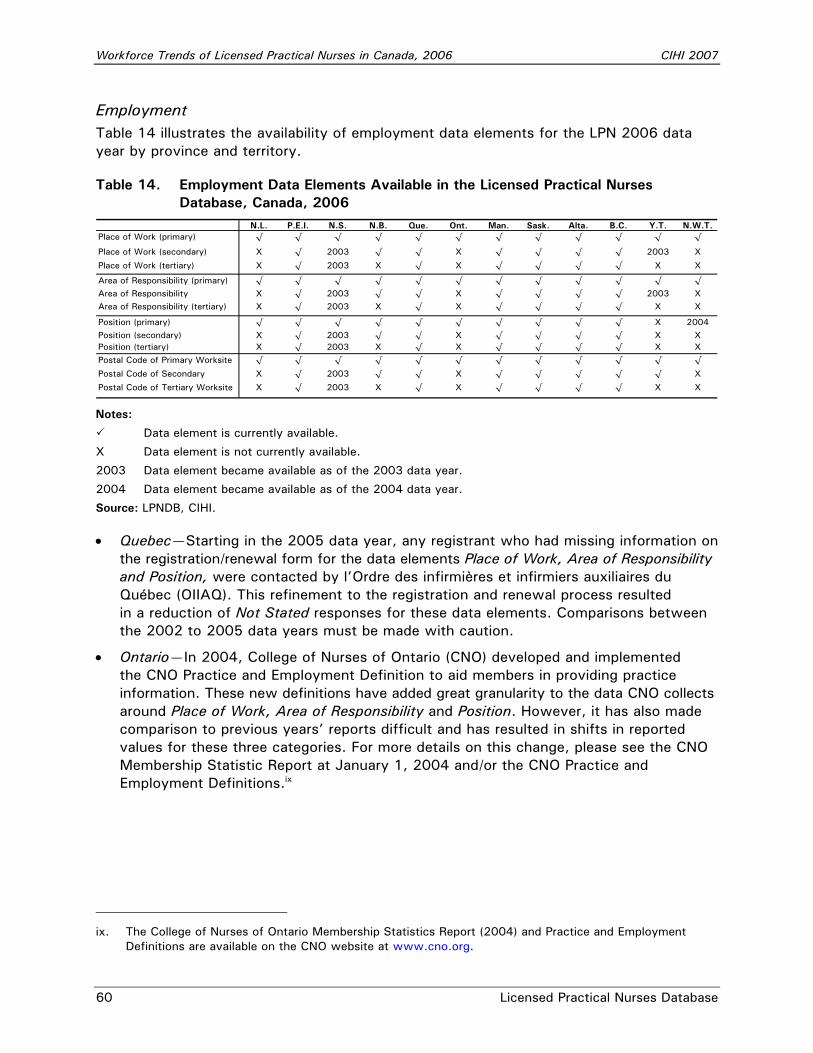
Workforce Trends of Licensed Practical Nurses in Canada, 2006 CIHI 2007
60 Licensed Practical Nurses Database
Employment Table 14 illustrates the availability of employment data elements for the LPN 2006 data year by province and territory.
Table 14. Employment Data Elements Available in the Licensed Practical Nurses Database, Canada, 2006
N.L. P.E.I. N.S. N.B. Que. Ont. Man. Sask. Alta. B.C. Y.T. N.W.T.Place of Work (primary) √ √ √ √ √ √ √ √ √ √ √ √
Place of Work (secondary) X √ 2003 √ √ X √ √ √ √ 2003 X
Place of Work (tertiary) X √ 2003 X √ X √ √ √ √ X X
Area of Responsibility (primary) √ √ √ √ √ √ √ √ √ √ √ √Area of Responsibility X √ 2003 √ √ X √ √ √ √ 2003 XArea of Responsibility (tertiary) X √ 2003 X √ X √ √ √ √ X X
Position (primary) √ √ √ √ √ √ √ √ √ √ X 2004Position (secondary) X √ 2003 √ √ X √ √ √ √ X XPosition (tertiary) X √ 2003 X √ X √ √ √ √ X XPostal Code of Primary Worksite √ √ √ √ √ √ √ √ √ √ √ √
Postal Code of Secondary X √ 2003 √ √ X √ √ √ √ √ X
Postal Code of Tertiary Worksite X √ 2003 X √ X √ √ √ √ X X
Notes:
Data element is currently available.
X Data element is not currently available.
2003 Data element became available as of the 2003 data year.
2004 Data element became available as of the 2004 data year.
Source: LPNDB, CIHI.
• Quebec—Starting in the 2005 data year, any registrant who had missing information on the registration/renewal form for the data elements Place of Work, Area of Responsibility and Position, were contacted by l’Ordre des infirmières et infirmiers auxiliaires du Québec (OIIAQ). This refinement to the registration and renewal process resulted in a reduction of Not Stated responses for these data elements. Comparisons between the 2002 to 2005 data years must be made with caution.
• Ontario—In 2004, College of Nurses of Ontario (CNO) developed and implemented the CNO Practice and Employment Definition to aid members in providing practice information. These new definitions have added great granularity to the data CNO collects around Place of Work, Area of Responsibility and Position. However, it has also made comparison to previous years’ reports difficult and has resulted in shifts in reported values for these three categories. For more details on this change, please see the CNO Membership Statistic Report at January 1, 2004 and/or the CNO Practice and Employment Definitions.ix
ix. The College of Nurses of Ontario Membership Statistics Report (2004) and Practice and Employment
Definitions are available on the CNO website at www.cno.org.

CIHI 2007 Workforce Trends of Licensed Practical Nurses in Canada, 2006
Licensed Practical Nurses Database 61
Employment Status
• Ontario—According to the CNO, the changes in the variable Employed in Practical Nursing—Status Unknown are a result of refinements in the renewal process. This has enabled the CNO to reduce the number of Not Stated responses to this category.
• Saskatchewan—For the 2004 data year, to better reflect the number of LPNs employed in Saskatchewan, CIHI included those LPNs who were employed in practical nursing but did not indicate their status of nursing employment (e.g. full-time, part-time or casual). These LPNs are identified in the CIHI statistics as Employed in Practical Nursing—Status Unknown.
Data for the 2005 data year is currently under review by CIHI and the Saskatchewan Association of Licensed Practical Nurses; data may be revised in future publications.
• British Columbia—Data for Full-time/Part-time Status became available in the 2003 data year. This has resulted in a more accurate depiction of the British Columbia LPN workforce.
• Yukon—Data for Full-time/Part-time Status became available in the 2003 data year. This has resulted in a more accurate depiction of the Yukon LPN workforce.
Multiple Employment Status
• Newfoundland and Labrador—Prior to 2005, all LPNs employed in practical nursing were considered to have only a single employer. In 2006, the College of Licensed Practical Nurses of Newfoundland and Labrador (CLPNNL) changed the methodology. Therefore, data from 2002 to 2005 was revised and corrections were made in the CIHI Licensed Practical Nurses Database (LPNDB). However, data for the 2004 and 2005 data years is currently under review by CIHI and the College of Licensed Practical Nurses of Newfoundland and Labrador (CLPNNL); data may be revised in future publications.
• Alberta—As of the 2003 data year, records with non-response were defaulted to No; in 2002, non-response was recorded as Not Stated.
• Yukon—This data element was not available in the 2002 and 2004 data years only.
• Northwest Territories—This data element was not collected for the 2002 to 2006 data years.
Location of Employment
• Yukon—For the 2002 to 2006 data years, this field was derived from the fields Postal Code of Residence and Place of Employment.

Workforce Trends of Licensed Practical Nurses in Canada, 2006 CIHI 2007
62 Licensed Practical Nurses Database
Place of Work
• Quebec—Data for the sub-element Mental Health Centre was not collected for the 2002 to 2006 data years because this type of institution, as defined by the CIHI Licensed Practical Nurses System Data Dictionary, does not exist in the province of Quebec.
In 2002, the sub-element Home Care Agency was reported incorrectly due to a mapping error. The sub-element Private Nursing Agency/Private Duty is being used in its place as of 2004.
Over the last 2 years, the Quebec Health and Social Services Department (Ministère de la santé et des services sociaux du Quebec) has merged most of the province’s public sector hospitals, long term care facilities, and community health centers into 95 “centre de santé et de services sociaux” (CSSS). Since the merger, the Ordre des infirmières et infirmiers auxiliaires du Québec (OIIAQ) has reclassified their definitions for the field Place of Work. As a result comparisons to earlier CIHI reports should be made with caution. For more information on this change please contact the OIIAQ <www.oiiaq.org>.
• Ontario—According to the College of Nurses of Ontario (CNO), refinements in the renewal process have enabled the CNO to reduce the number of Not Stated responses to this category.
• Manitoba—In 2003, the element Community Health was split into Community Health Centre and Home Care Agency. Comparisons using 2002 data for this field should be made with caution.
• Alberta—In the 2003 data year, the number of registrants who selected the sub-element Hospital (including general, maternal, paediatric and psychiatric) decreased, while the number of registrants who selected the sub-element Nursing Home/Long-Term Care increased. According to the College of Licensed Practical Nurses of Alberta (CLPNA), this shift in the data may be due to health restructuring by the regional health authorities, which resulted in the addition of long-term disability and nursing home units to many hospital facilities.
Area of Responsibility
• Newfoundland and Labrador—Before 2004, LPNs who worked in several clinical areas were mapped to Other Direct Care as there was no category called Several Clinical Areas on the College of Licensed Practical Nurses of Newfoundland and Labrador (CLPNNL) registration and renewal form. Starting in 2004, LPNs selecting “Float” are mapped to “Several Clinical Areas” to better reflect CLPNNL’s workforce. This may explain the increase in the number of LPNs who reported “Several Clinical Areas” and a decrease in “Other Direct Care.”
• Ontario—According to the CNO, refinements in the renewal process have enabled the CNO to reduce the number of Not Stated responses to this category.
• Yukon—For the 2002 to 2006 data years, any records indicating more than one area of responsibility were coded under the sub-element “Several Clinical Areas.”
CIHI 2007 Workforce Trends of Licensed Practical Nurses in Canada, 2006
Licensed Practical Nurses Database 63
• Northwest Territories—For the 2006 data year, any records indicating more than one area of responsibility were coded under the sub-element “Several Clinical Areas.”
Position
• New Brunswick—In an effort to improve data quality, the Association of New Brunswick Licensed Practical Nurses educated members on how to complete the Position section of the annual renewal registration form. As a result, the number of registrants selecting the category Other has decreased.

Workforce Trends of Licensed Practical Nurses in Canada, 2006 CIHI 2007
64 Licensed Practical Nurses Database
LPN Workforce Products and Services LPN Workforce Publications The CIHI publications:
• Workforce Trends of Licensed Practical Nurses in Canada, 2005;
• Workforce Trends of Licensed Practical Nurses in Canada, 2004;
• Workforce Trends of Licensed Practical Nurses in Canada, 2003; and
• Workforce Trends of Licensed Practical Nurses in Canada, 2002.
may be downloaded in electronic (PDF) format free of charge at www.cihi.ca, or may be purchased in paper form by contacting the CIHI Order Desk at 613-241-7860.
The document Licensed Practical Nurses System Data Dictionary and Processing Manual is available upon request to the Program Lead, Nursing Databases, or on the Nursing website at www.cihi.ca/nurses. This document outlines the data elements (and definitions) collected for the LPNDB, as well as the file specifications sent to the provincial/territorial regulatory authorities for data submission.
Many of the tables and figures presented in the Data Analysis section of this publication are available for viewing, and can be downloaded, from the CIHI website at www.cihi.ca/nurses.
Request Services CIHI completes ad hoc requests and special analytical projects on a cost-recovery basis using data from the LPNDB. Ad hoc requests are short queries that generally can be handled through standard reports, and do not require major programming resources. Special analytical projects require project planning and the commitment of extra resources.
For an estimate of the costs associated with these products and services, please contact:
Program Lead, Nursing Databases Canadian Institute for Health Information 495 Richmond Road, Suite 600 Ottawa, Ontario K2A 4H6 Phone: 613-241-7860 Fax: 613-241-8120 Email: [email protected] Website: www.cihi.ca/nurses

Provincial/Territorial Profiles

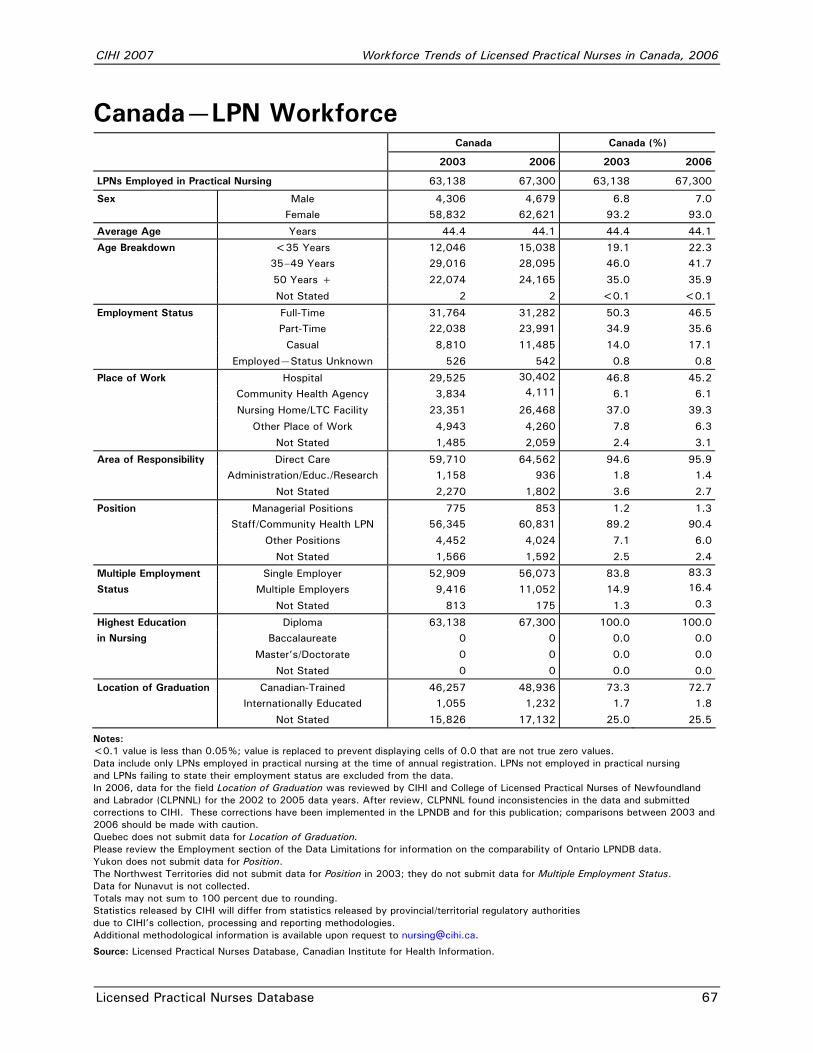
CIHI 2007 Workforce Trends of Licensed Practical Nurses in Canada, 2006
Licensed Practical Nurses Database 67
Canada—LPN Workforce Canada Canada (%)
2003 2006 2003 2006
LPNs Employed in Practical Nursing 63,138 67,300 63,138 67,300
Sex Male 4,306 4,679 6.8 7.0 Female 58,832 62,621 93.2 93.0
Average Age Years 44.4 44.1 44.4 44.1
Age Breakdown <35 Years 12,046 15,038 19.1 22.3 35–49 Years 29,016 28,095 46.0 41.7
50 Years + 22,074 24,165 35.0 35.9
Not Stated 2 2 <0.1 <0.1
Employment Status Full-Time 31,764 31,282 50.3 46.5 Part-Time 22,038 23,991 34.9 35.6
Casual 8,810 11,485 14.0 17.1
Employed—Status Unknown 526 542 0.8 0.8
Place of Work Hospital 29,525 30,402 46.8 45.2 Community Health Agency 3,834 4,111
4 260 6.1 6.1
Nursing Home/LTC Facility 23,351 26,468 37.0 39.3
Other Place of Work 4,943 4,260 7.8 6.3
Not Stated 1,485 2,059 2.4 3.1
Area of Responsibility Direct Care 59,710 64,562 94.6 95.9 Administration/Educ./Research 1,158 936 1.8 1.4
Not Stated 2,270 1,802 3.6 2.7
Position Managerial Positions 775 853 1.2 1.3 Staff/Community Health LPN 56,345 60,831 89.2 90.4
Other Positions 4,452 4,024 7.1 6.0
Not Stated 1,566 1,592 2.5 2.4
Multiple Employment Single Employer 52,909 56,073 83.8 83.3
Status Multiple Employers 9,416 11,052 14.9 16.4
Not Stated 813 175 1.3 0.3
Highest Education Diploma 63,138 67,300 100.0 100.0 in Nursing Baccalaureate 0 0 0.0 0.0
Master’s/Doctorate 0 0 0.0 0.0
Not Stated 0 0 0.0 0.0
Location of Graduation Canadian-Trained 46,257 48,936 73.3 72.7 Internationally Educated 1,055 1,232 1.7 1.8
Not Stated 15,826 17,132 25.0 25.5
Notes: <0.1 value is less than 0.05%; value is replaced to prevent displaying cells of 0.0 that are not true zero values. Data include only LPNs employed in practical nursing at the time of annual registration. LPNs not employed in practical nursing and LPNs failing to state their employment status are excluded from the data. In 2006, data for the field Location of Graduation was reviewed by CIHI and College of Licensed Practical Nurses of Newfoundland and Labrador (CLPNNL) for the 2002 to 2005 data years. After review, CLPNNL found inconsistencies in the data and submitted corrections to CIHI. These corrections have been implemented in the LPNDB and for this publication; comparisons between 2003 and 2006 should be made with caution. Quebec does not submit data for Location of Graduation. Please review the Employment section of the Data Limitations for information on the comparability of Ontario LPNDB data. Yukon does not submit data for Position. The Northwest Territories did not submit data for Position in 2003; they do not submit data for Multiple Employment Status. Data for Nunavut is not collected. Totals may not sum to 100 percent due to rounding. Statistics released by CIHI will differ from statistics released by provincial/territorial regulatory authorities due to CIHI’s collection, processing and reporting methodologies. Additional methodological information is available upon request to [email protected].
Source: Licensed Practical Nurses Database, Canadian Institute for Health Information.
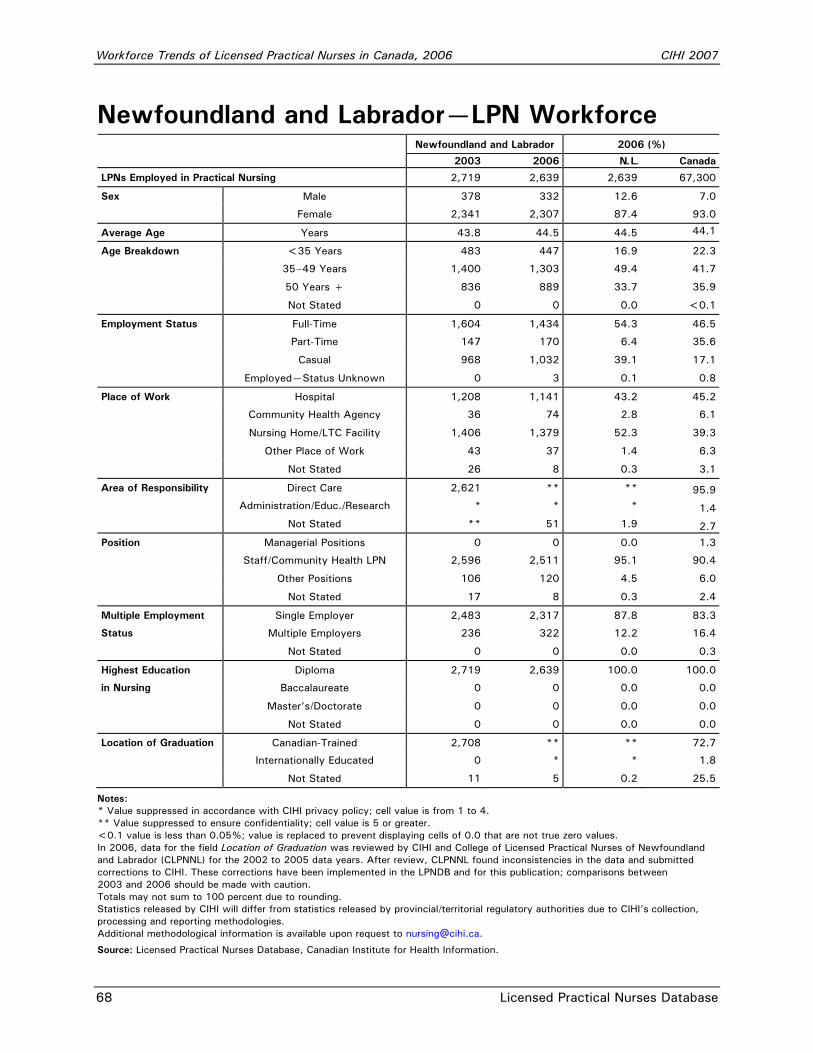
Workforce Trends of Licensed Practical Nurses in Canada, 2006 CIHI 2007
68 Licensed Practical Nurses Database
Newfoundland and Labrador—LPN Workforce Newfoundland and Labrador 2006 (%)
2003 2006 N. L. Canada
LPNs Employed in Practical Nursing 2,719 2,639 2,639 67,300
Sex Male 378 332 12.6 7.0
Female 2,341 2,307 87.4 93.0
Average Age Years 43.8 44.5 44.5 44.1
Age Breakdown <35 Years 483 447 16.9 22.3
35–49 Years 1,400 1,303 49.4 41.7
50 Years + 836 889 33.7 35.9
Not Stated 0 0 0.0 <0.1
Employment Status Full-Time 1,604 1,434 54.3 46.5
Part-Time 147 170 6.4 35.6
Casual 968 1,032 39.1 17.1
Employed—Status Unknown 0 3 0.1 0.8
Place of Work Hospital 1,208 1,141 43.2 45.2
Community Health Agency 36 74 2.8 6.1
Nursing Home/LTC Facility 1,406 1,379 52.3 39.3
Other Place of Work 43 37 1.4 6.3
Not Stated 26 8 0.3 3.1
Area of Responsibility Direct Care 2,621 ** ** 95.9 Administration/Educ./Research * * * 1.4 Not Stated ** 51 1.9 2.7
Position Managerial Positions 0 0 0.0 1.3
Staff/Community Health LPN 2,596 2,511 95.1 90.4
Other Positions 106 120 4.5 6.0
Not Stated 17 8 0.3 2.4
Multiple Employment Single Employer 2,483 2,317 87.8 83.3
Status Multiple Employers 236 322 12.2 16.4
Not Stated 0 0 0.0 0.3
Highest Education Diploma 2,719 2,639 100.0 100.0
in Nursing Baccalaureate 0 0 0.0 0.0
Master’s/Doctorate 0 0 0.0 0.0
Not Stated 0 0 0.0 0.0
Location of Graduation Canadian-Trained 2,708 ** ** 72.7
Internationally Educated 0 * * 1.8
Not Stated 11 5 0.2 25.5
Notes: * Value suppressed in accordance with CIHI privacy policy; cell value is from 1 to 4. ** Value suppressed to ensure confidentiality; cell value is 5 or greater. <0.1 value is less than 0.05%; value is replaced to prevent displaying cells of 0.0 that are not true zero values. In 2006, data for the field Location of Graduation was reviewed by CIHI and College of Licensed Practical Nurses of Newfoundland and Labrador (CLPNNL) for the 2002 to 2005 data years. After review, CLPNNL found inconsistencies in the data and submitted corrections to CIHI. These corrections have been implemented in the LPNDB and for this publication; comparisons between 2003 and 2006 should be made with caution. Totals may not sum to 100 percent due to rounding. Statistics released by CIHI will differ from statistics released by provincial/territorial regulatory authorities due to CIHI’s collection, processing and reporting methodologies. Additional methodological information is available upon request to [email protected].
Source: Licensed Practical Nurses Database, Canadian Institute for Health Information.
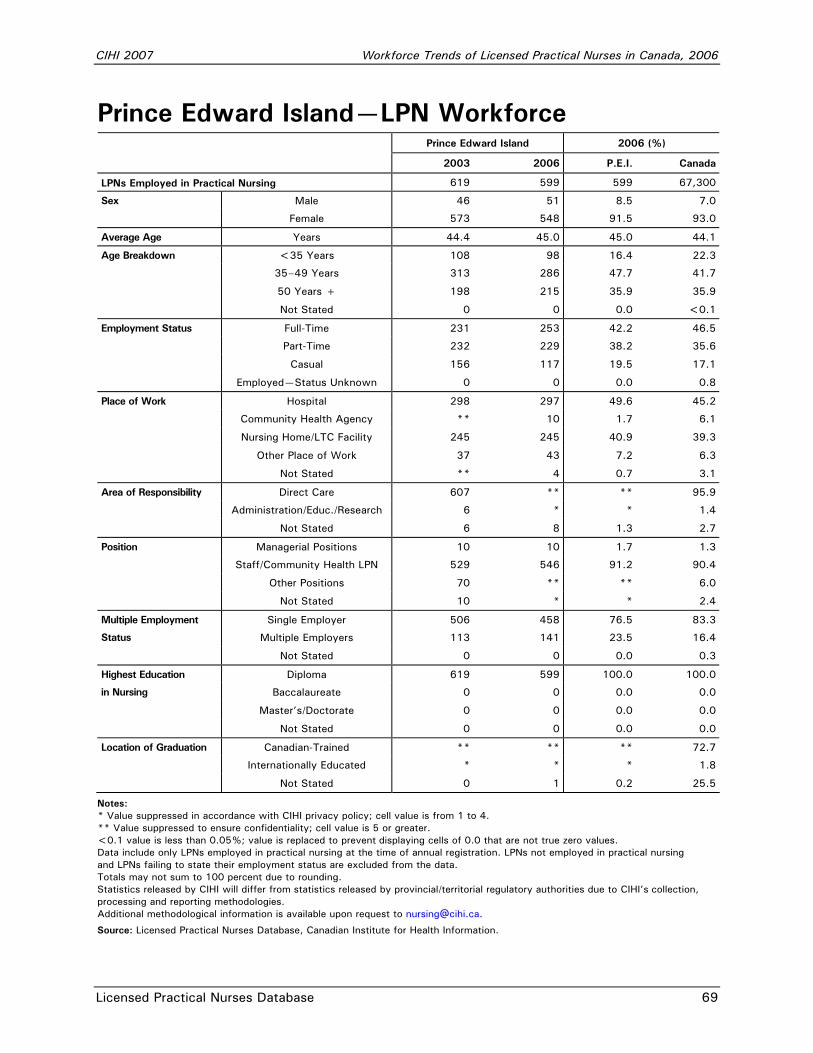
CIHI 2007 Workforce Trends of Licensed Practical Nurses in Canada, 2006
Licensed Practical Nurses Database 69
Prince Edward Island—LPN Workforce Prince Edward Island 2006 (%)
2003 2006 P.E.I. Canada
LPNs Employed in Practical Nursing 619 599 599 67,300
Sex Male 46 51 8.5 7.0
Female 573 548 91.5 93.0
Average Age Years 44.4 45.0 45.0 44.1
Age Breakdown <35 Years 108 98 16.4 22.3
35–49 Years 313 286 47.7 41.7
50 Years + 198 215 35.9 35.9
Not Stated 0 0 0.0 <0.1
Employment Status Full-Time 231 253 42.2 46.5
Part-Time 232 229 38.2 35.6
Casual 156 117 19.5 17.1
Employed—Status Unknown 0 0 0.0 0.8
Place of Work Hospital 298 297 49.6 45.2
Community Health Agency ** 10 1.7 6.1
Nursing Home/LTC Facility 245 245 40.9 39.3
Other Place of Work 37 43 7.2 6.3
Not Stated ** 4 0.7 3.1
Area of Responsibility Direct Care 607 ** ** 95.9
Administration/Educ./Research 6 * * 1.4
Not Stated 6 8 1.3 2.7
Position Managerial Positions 10 10 1.7 1.3
Staff/Community Health LPN 529 546 91.2 90.4
Other Positions 70 ** ** 6.0
Not Stated 10 * * 2.4
Multiple Employment Single Employer 506 458 76.5 83.3
Status Multiple Employers 113 141 23.5 16.4
Not Stated 0 0 0.0 0.3
Highest Education Diploma 619 599 100.0 100.0
in Nursing Baccalaureate 0 0 0.0 0.0
Master’s/Doctorate 0 0 0.0 0.0
Not Stated 0 0 0.0 0.0
Location of Graduation Canadian-Trained ** ** ** 72.7
Internationally Educated * * * 1.8
Not Stated 0 1 0.2 25.5
Notes: * Value suppressed in accordance with CIHI privacy policy; cell value is from 1 to 4. ** Value suppressed to ensure confidentiality; cell value is 5 or greater. <0.1 value is less than 0.05%; value is replaced to prevent displaying cells of 0.0 that are not true zero values. Data include only LPNs employed in practical nursing at the time of annual registration. LPNs not employed in practical nursing and LPNs failing to state their employment status are excluded from the data. Totals may not sum to 100 percent due to rounding. Statistics released by CIHI will differ from statistics released by provincial/territorial regulatory authorities due to CIHI’s collection, processing and reporting methodologies. Additional methodological information is available upon request to [email protected].
Source: Licensed Practical Nurses Database, Canadian Institute for Health Information.
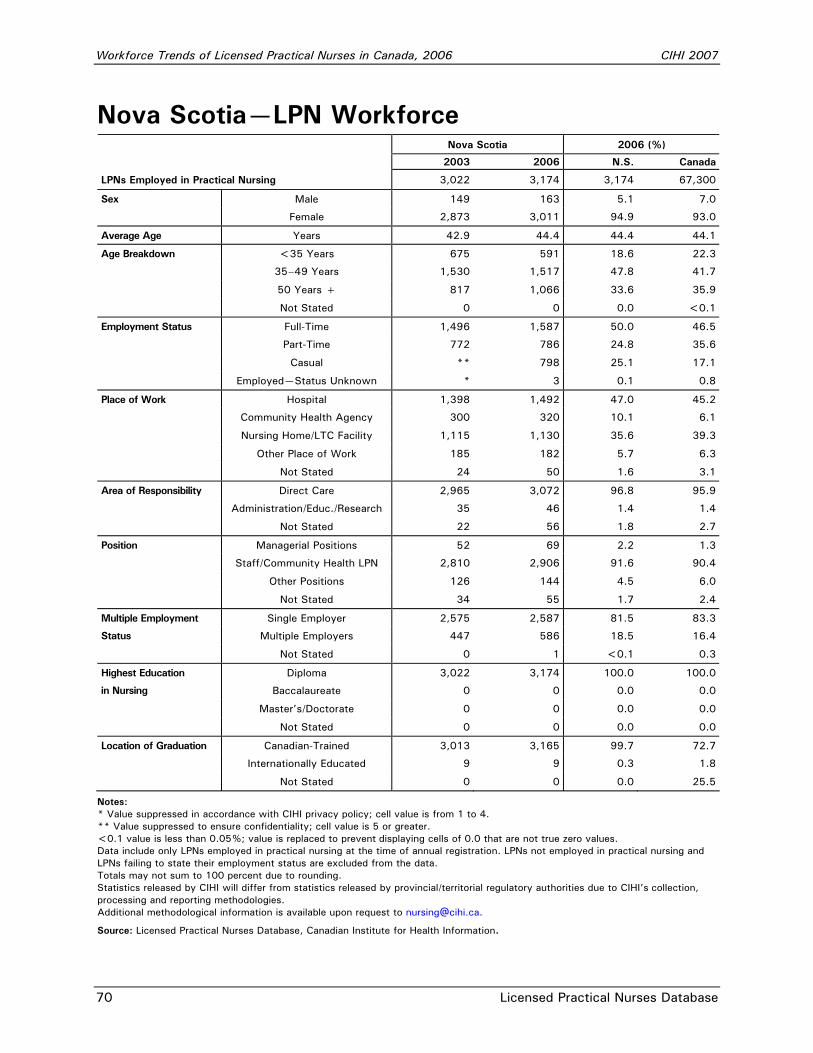
Workforce Trends of Licensed Practical Nurses in Canada, 2006 CIHI 2007
70 Licensed Practical Nurses Database
Nova Scotia—LPN Workforce Nova Scotia 2006 (%)
2003 2006 N.S. Canada
LPNs Employed in Practical Nursing 3,022 3,174 3,174 67,300
Sex Male 149 163 5.1 7.0
Female 2,873 3,011 94.9 93.0
Average Age Years 42.9 44.4 44.4 44.1
Age Breakdown <35 Years 675 591 18.6 22.3
35–49 Years 1,530 1,517 47.8 41.7
50 Years + 817 1,066 33.6 35.9
Not Stated 0 0 0.0 <0.1
Employment Status Full-Time 1,496 1,587 50.0 46.5
Part-Time 772 786 24.8 35.6
Casual ** 798 25.1 17.1
Employed—Status Unknown * 3 0.1 0.8
Place of Work Hospital 1,398 1,492 47.0 45.2
Community Health Agency 300 320 10.1 6.1
Nursing Home/LTC Facility 1,115 1,130 35.6 39.3
Other Place of Work 185 182 5.7 6.3
Not Stated 24 50 1.6 3.1
Area of Responsibility Direct Care 2,965 3,072 96.8 95.9
Administration/Educ./Research 35 46 1.4 1.4
Not Stated 22 56 1.8 2.7
Position Managerial Positions 52 69 2.2 1.3
Staff/Community Health LPN 2,810 2,906 91.6 90.4
Other Positions 126 144 4.5 6.0
Not Stated 34 55 1.7 2.4
Multiple Employment Single Employer 2,575 2,587 81.5 83.3
Status Multiple Employers 447 586 18.5 16.4
Not Stated 0 1 <0.1 0.3
Highest Education Diploma 3,022 3,174 100.0 100.0
in Nursing Baccalaureate 0 0 0.0 0.0
Master’s/Doctorate 0 0 0.0 0.0
Not Stated 0 0 0.0 0.0
Location of Graduation Canadian-Trained 3,013 3,165 99.7 72.7
Internationally Educated 9 9 0.3 1.8
Not Stated 0 0 0.0 25.5
Notes: * Value suppressed in accordance with CIHI privacy policy; cell value is from 1 to 4. ** Value suppressed to ensure confidentiality; cell value is 5 or greater. <0.1 value is less than 0.05%; value is replaced to prevent displaying cells of 0.0 that are not true zero values. Data include only LPNs employed in practical nursing at the time of annual registration. LPNs not employed in practical nursing and LPNs failing to state their employment status are excluded from the data. Totals may not sum to 100 percent due to rounding. Statistics released by CIHI will differ from statistics released by provincial/territorial regulatory authorities due to CIHI’s collection, processing and reporting methodologies. Additional methodological information is available upon request to [email protected].
Source: Licensed Practical Nurses Database, Canadian Institute for Health Information.
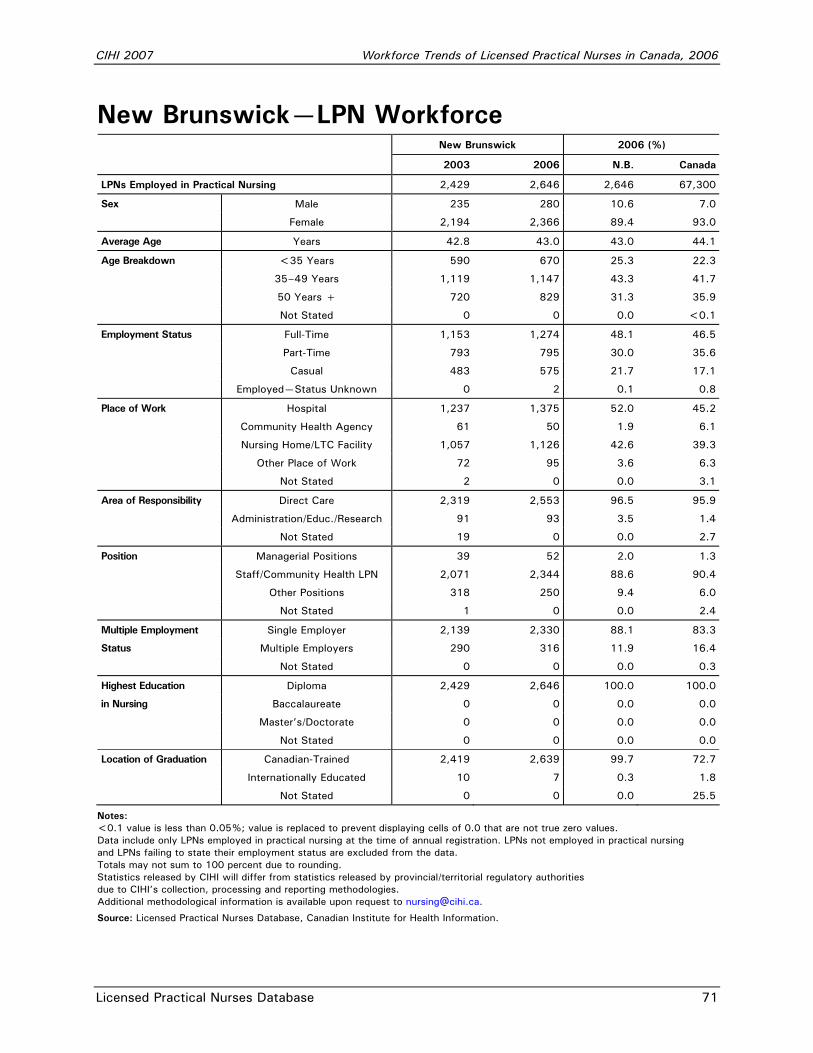
CIHI 2007 Workforce Trends of Licensed Practical Nurses in Canada, 2006
Licensed Practical Nurses Database 71
New Brunswick—LPN Workforce New Brunswick 2006 (%)
2003 2006 N.B. Canada
LPNs Employed in Practical Nursing 2,429 2,646 2,646 67,300
Sex Male 235 280 10.6 7.0
Female 2,194 2,366 89.4 93.0
Average Age Years 42.8 43.0 43.0 44.1
Age Breakdown <35 Years 590 670 25.3 22.3
35–49 Years 1,119 1,147 43.3 41.7
50 Years + 720 829 31.3 35.9
Not Stated 0 0 0.0 <0.1
Employment Status Full-Time 1,153 1,274 48.1 46.5
Part-Time 793 795 30.0 35.6
Casual 483 575 21.7 17.1
Employed—Status Unknown 0 2 0.1 0.8
Place of Work Hospital 1,237 1,375 52.0 45.2
Community Health Agency 61 50 1.9 6.1
Nursing Home/LTC Facility 1,057 1,126 42.6 39.3
Other Place of Work 72 95 3.6 6.3
Not Stated 2 0 0.0 3.1
Area of Responsibility Direct Care 2,319 2,553 96.5 95.9
Administration/Educ./Research 91 93 3.5 1.4
Not Stated 19 0 0.0 2.7
Position Managerial Positions 39 52 2.0 1.3
Staff/Community Health LPN 2,071 2,344 88.6 90.4
Other Positions 318 250 9.4 6.0
Not Stated 1 0 0.0 2.4
Multiple Employment Single Employer 2,139 2,330 88.1 83.3
Status Multiple Employers 290 316 11.9 16.4
Not Stated 0 0 0.0 0.3
Highest Education Diploma 2,429 2,646 100.0 100.0
in Nursing Baccalaureate 0 0 0.0 0.0
Master’s/Doctorate 0 0 0.0 0.0
Not Stated 0 0 0.0 0.0
Location of Graduation Canadian-Trained 2,419 2,639 99.7 72.7
Internationally Educated 10 7 0.3 1.8
Not Stated 0 0 0.0 25.5
Notes: <0.1 value is less than 0.05%; value is replaced to prevent displaying cells of 0.0 that are not true zero values. Data include only LPNs employed in practical nursing at the time of annual registration. LPNs not employed in practical nursing and LPNs failing to state their employment status are excluded from the data. Totals may not sum to 100 percent due to rounding. Statistics released by CIHI will differ from statistics released by provincial/territorial regulatory authorities due to CIHI’s collection, processing and reporting methodologies. Additional methodological information is available upon request to [email protected].
Source: Licensed Practical Nurses Database, Canadian Institute for Health Information.

Workforce Trends of Licensed Practical Nurses in Canada, 2006 CIHI 2007
72 Licensed Practical Nurses Database
Quebec—LPN Workforce Quebec 2006 (%)
2003 2006 Que. Canada
LPNs Employed in Practical Nursing 14,831 17,104 17,104 67,300
Sex Male 1,189 1,392 8.1 7.0
Female 13,642 15,712 91.9 93.0
Average Age Years 44.4 43.0 43.0 44.1
Age Breakdown <35 Years 2,675 4,313 25.2 22.3
35-49 Years 6,882 7,274 42.5 41.7
50 Years + 5,274 5,517 32.3 35.9
Not Stated 0 0 0.0 <0.1
Employment Status Full-Time 5,875 6,187 36.2 46.5
Part-Time 6,857 ** ** 35.6
Casual 2,099 3,045 17.8 17.1
Employed—Status Unknown 0 ** ** 0.8
Place of Work Hospital 5,608 6,166 36.1 45.2
Community Health Agency 148 193 1.1 6.1
Nursing Home/LTC Facility 8,133 9,019 52.7 39.3
Other Place of Work 833 1,355 7.9 6.3
Not Stated 109 371 2.2 3.1
Area of Responsibility Direct Care 14,512 16,581 96.9 95.9
Administration/Educ./Research 48 104 0.6 1.4
Not Stated 271 419 2.4 2.7
Position Managerial Positions 39 0 0.0 1.3
Staff/Community Health LPN 13,937 16,125 94.3 90.4
Other Positions 703 649 3.8 6.0
Not Stated 152 330 1.9 2.4
Multiple Employment Single Employer 12,724 14,492 84.7 83.3
Status Multiple Employers 2,107 2,610 15.3 16.4
Not Stated 0 2 <0.1 0.3
Highest Education Diploma 14,831 17,104 100.0 100.0
in Nursing Baccalaureate 0 0 0.0 0.0
Master’s/Doctorate 0 0 0.0 0.0
Not Stated 0 0 0.0 0.0
Location of Graduation Canadian-Trained n/s n/s n/s 72.7
Internationally Educated n/s n/s n/s 1.8
Not Stated 14,831 17,104 100.0 25.5
Notes: * Value suppressed in accordance with CIHI privacy policy; cell value is from 1 to 4. ** Value suppressed to ensure confidentiality; cell value is 5 or greater. n/s Data not submitted to CIHI. <0.1 value is less than 0.05%; value is replaced to prevent displaying cells of 0.0 that are not true zero values. Data include only LPNs employed in practical nursing at the time of annual registration. LPNs not employed in practical nursing and LPNs failing to state their employment status are excluded from the data. Totals may not sum to 100 percent due to rounding. Statistics released by CIHI will differ from statistics released by provincial/territorial regulatory authorities due to CIHI’s collection, processing and reporting methodologies. Additional methodological information is available upon request to [email protected].
Source: Licensed Practical Nurses Database, Canadian Institute for Health Information.
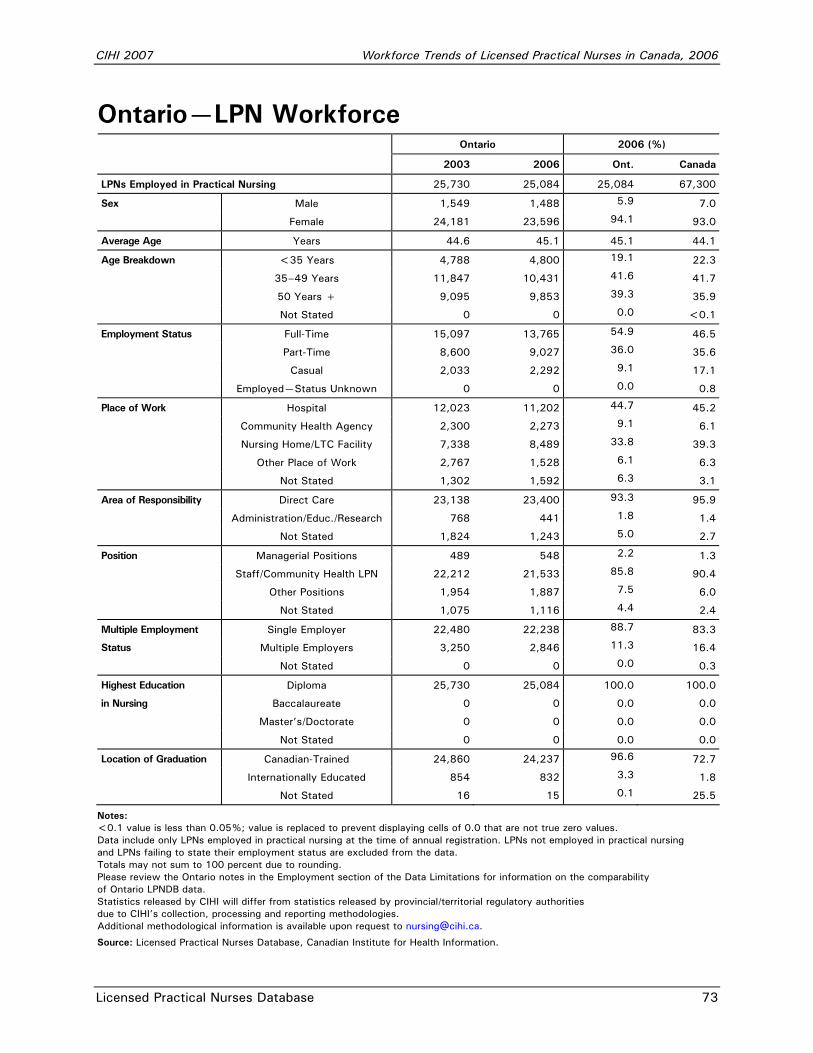
CIHI 2007 Workforce Trends of Licensed Practical Nurses in Canada, 2006
Licensed Practical Nurses Database 73
Ontario—LPN Workforce Ontario 2006 (%)
2003 2006 Ont. Canada
LPNs Employed in Practical Nursing 25,730 25,084 25,084 67,300
Sex Male 1,549 1,488 5.9 7.0
Female 24,181 23,596 94.1 93.0
Average Age Years 44.6 45.1 45.1 44.1
Age Breakdown <35 Years 4,788 4,800 19.1 22.3
35–49 Years 11,847 10,431 41.6 41.7
50 Years + 9,095 9,853 39.3 35.9
Not Stated 0 0 0.0 <0.1
Employment Status Full-Time 15,097 13,765 54.9 46.5
Part-Time 8,600 9,027 36.0 35.6
Casual 2,033 2,292 9.1 17.1
Employed—Status Unknown 0 0 0.0 0.8
Place of Work Hospital 12,023 11,202 44.7 45.2
Community Health Agency 2,300 2,273 9.1 6.1
Nursing Home/LTC Facility 7,338 8,489 33.8 39.3
Other Place of Work 2,767 1,528 6.1 6.3
Not Stated 1,302 1,592 6.3 3.1
Area of Responsibility Direct Care 23,138 23,400 93.3 95.9
Administration/Educ./Research 768 441 1.8 1.4
Not Stated 1,824 1,243 5.0 2.7
Position Managerial Positions 489 548 2.2 1.3
Staff/Community Health LPN 22,212 21,533 85.8 90.4
Other Positions 1,954 1,887 7.5 6.0
Not Stated 1,075 1,116 4.4 2.4
Multiple Employment Single Employer 22,480 22,238 88.7 83.3
Status Multiple Employers 3,250 2,846 11.3 16.4
Not Stated 0 0 0.0 0.3
Highest Education Diploma 25,730 25,084 100.0 100.0
in Nursing Baccalaureate 0 0 0.0 0.0
Master’s/Doctorate 0 0 0.0 0.0
Not Stated 0 0 0.0 0.0
Location of Graduation Canadian-Trained 24,860 24,237 96.6 72.7
Internationally Educated 854 832 3.3 1.8
Not Stated 16 15 0.1 25.5
Notes: <0.1 value is less than 0.05%; value is replaced to prevent displaying cells of 0.0 that are not true zero values. Data include only LPNs employed in practical nursing at the time of annual registration. LPNs not employed in practical nursing and LPNs failing to state their employment status are excluded from the data. Totals may not sum to 100 percent due to rounding. Please review the Ontario notes in the Employment section of the Data Limitations for information on the comparability of Ontario LPNDB data. Statistics released by CIHI will differ from statistics released by provincial/territorial regulatory authorities due to CIHI’s collection, processing and reporting methodologies. Additional methodological information is available upon request to [email protected].
Source: Licensed Practical Nurses Database, Canadian Institute for Health Information.
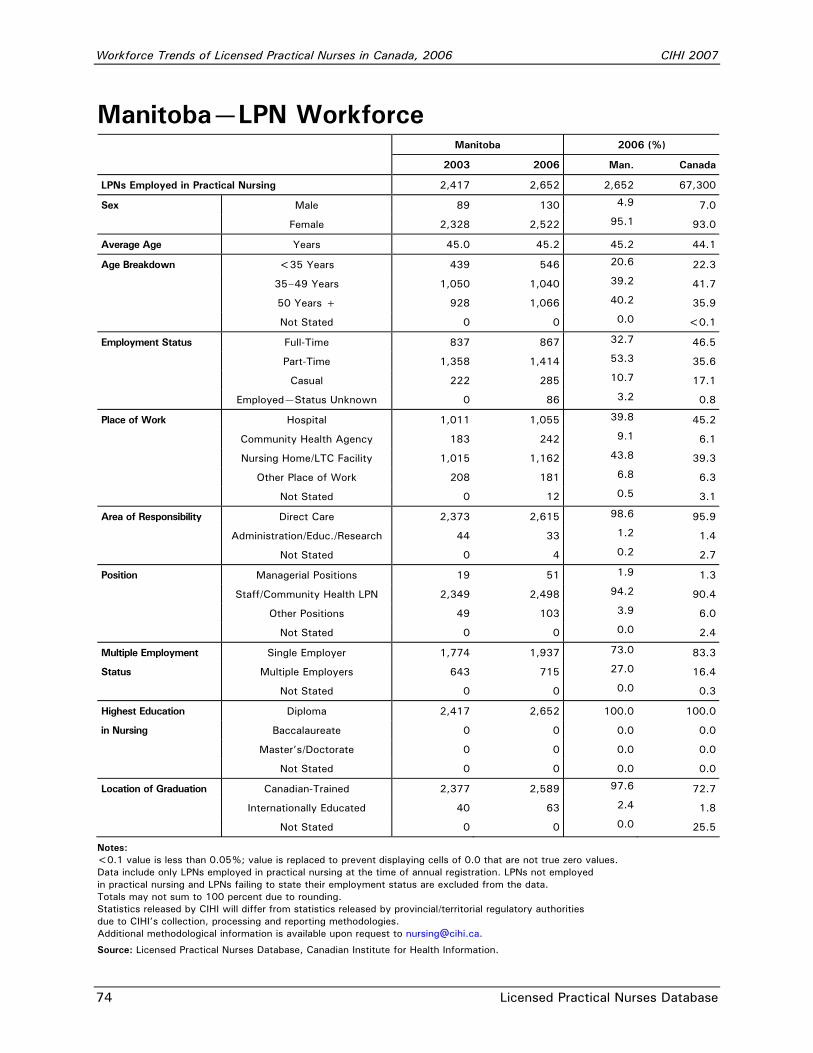
Workforce Trends of Licensed Practical Nurses in Canada, 2006 CIHI 2007
74 Licensed Practical Nurses Database
Manitoba—LPN Workforce Manitoba 2006 (%)
2003 2006 Man. Canada
LPNs Employed in Practical Nursing 2,417 2,652 2,652 67,300
Sex Male 89 130 4.9 7.0
Female 2,328 2,522 95.1 93.0
Average Age Years 45.0 45.2 45.2 44.1
Age Breakdown <35 Years 439 546 20.6 22.3
35–49 Years 1,050 1,040 39.2 41.7
50 Years + 928 1,066 40.2 35.9
Not Stated 0 0 0.0 <0.1
Employment Status Full-Time 837 867 32.7 46.5
Part-Time 1,358 1,414 53.3 35.6
Casual 222 285 10.7 17.1
Employed—Status Unknown 0 86 3.2 0.8
Place of Work Hospital 1,011 1,055 39.8 45.2
Community Health Agency 183 242 9.1 6.1
Nursing Home/LTC Facility 1,015 1,162 43.8 39.3
Other Place of Work 208 181 6.8 6.3
Not Stated 0 12 0.5 3.1
Area of Responsibility Direct Care 2,373 2,615 98.6 95.9
Administration/Educ./Research 44 33 1.2 1.4
Not Stated 0 4 0.2 2.7
Position Managerial Positions 19 51 1.9 1.3
Staff/Community Health LPN 2,349 2,498 94.2 90.4
Other Positions 49 103 3.9 6.0
Not Stated 0 0 0.0 2.4
Multiple Employment Single Employer 1,774 1,937 73.0 83.3
Status Multiple Employers 643 715 27.0 16.4
Not Stated 0 0 0.0 0.3
Highest Education Diploma 2,417 2,652 100.0 100.0
in Nursing Baccalaureate 0 0 0.0 0.0
Master’s/Doctorate 0 0 0.0 0.0
Not Stated 0 0 0.0 0.0
Location of Graduation Canadian-Trained 2,377 2,589 97.6 72.7
Internationally Educated 40 63 2.4 1.8
Not Stated 0 0 0.0 25.5
Notes: <0.1 value is less than 0.05%; value is replaced to prevent displaying cells of 0.0 that are not true zero values. Data include only LPNs employed in practical nursing at the time of annual registration. LPNs not employed in practical nursing and LPNs failing to state their employment status are excluded from the data. Totals may not sum to 100 percent due to rounding. Statistics released by CIHI will differ from statistics released by provincial/territorial regulatory authorities due to CIHI’s collection, processing and reporting methodologies. Additional methodological information is available upon request to [email protected].
Source: Licensed Practical Nurses Database, Canadian Institute for Health Information.
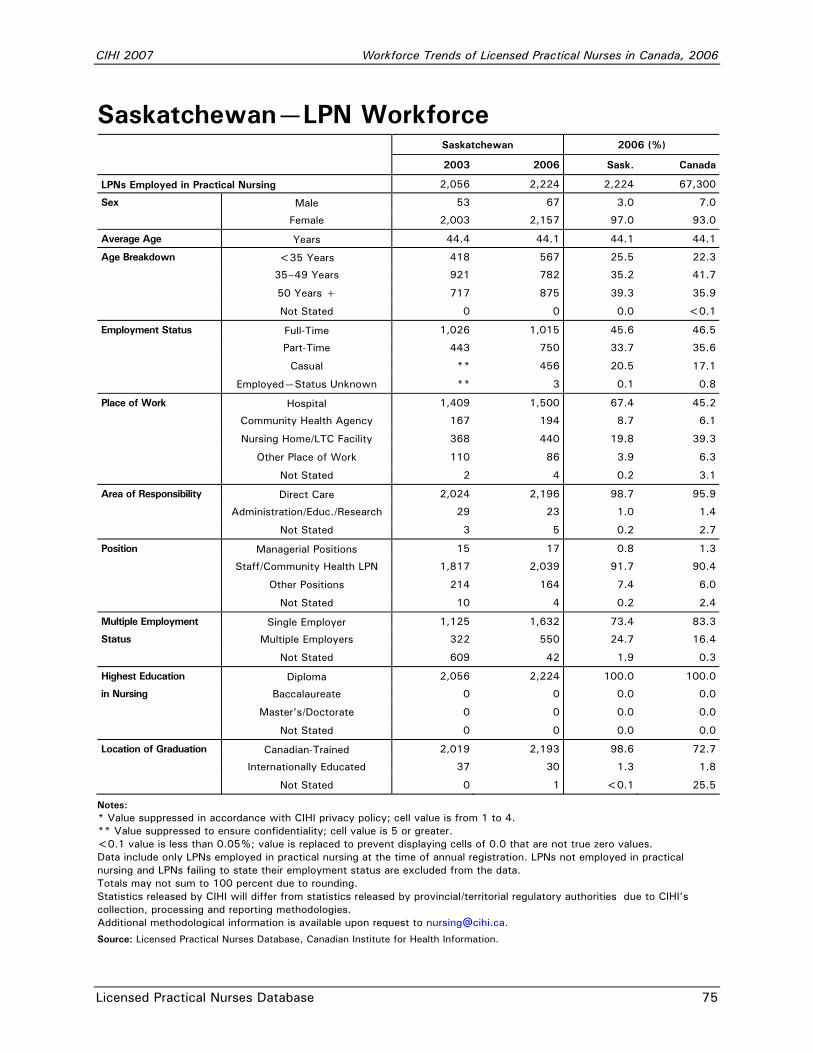
CIHI 2007 Workforce Trends of Licensed Practical Nurses in Canada, 2006
Licensed Practical Nurses Database 75
Saskatchewan—LPN Workforce Saskatchewan 2006 (%)
2003 2006 Sask. Canada
LPNs Employed in Practical Nursing 2,056 2,224 2,224 67,300
Sex Male 53 67 3.0 7.0
Female 2,003 2,157 97.0 93.0
Average Age Years 44.4 44.1 44.1 44.1
Age Breakdown <35 Years 418 567 25.5 22.3
35–49 Years 921 782 35.2 41.7
50 Years + 717 875 39.3 35.9
Not Stated 0 0 0.0 <0.1
Employment Status Full-Time 1,026 1,015 45.6 46.5
Part-Time 443 750 33.7 35.6
Casual ** 456 20.5 17.1
Employed—Status Unknown ** 3 0.1 0.8
Place of Work Hospital 1,409 1,500 67.4 45.2
Community Health Agency 167 194 8.7 6.1
Nursing Home/LTC Facility 368 440 19.8 39.3
Other Place of Work 110 86 3.9 6.3
Not Stated 2 4 0.2 3.1
Area of Responsibility Direct Care 2,024 2,196 98.7 95.9
Administration/Educ./Research 29 23 1.0 1.4
Not Stated 3 5 0.2 2.7
Position Managerial Positions 15 17 0.8 1.3
Staff/Community Health LPN 1,817 2,039 91.7 90.4
Other Positions 214 164 7.4 6.0
Not Stated 10 4 0.2 2.4
Multiple Employment Single Employer 1,125 1,632 73.4 83.3
Status Multiple Employers 322 550 24.7 16.4
Not Stated 609 42 1.9 0.3
Highest Education Diploma 2,056 2,224 100.0 100.0
in Nursing Baccalaureate 0 0 0.0 0.0
Master’s/Doctorate 0 0 0.0 0.0
Not Stated 0 0 0.0 0.0
Location of Graduation Canadian-Trained 2,019 2,193 98.6 72.7
Internationally Educated 37 30 1.3 1.8
Not Stated 0 1 <0.1 25.5
Notes: * Value suppressed in accordance with CIHI privacy policy; cell value is from 1 to 4. ** Value suppressed to ensure confidentiality; cell value is 5 or greater. <0.1 value is less than 0.05%; value is replaced to prevent displaying cells of 0.0 that are not true zero values. Data include only LPNs employed in practical nursing at the time of annual registration. LPNs not employed in practical nursing and LPNs failing to state their employment status are excluded from the data. Totals may not sum to 100 percent due to rounding. Statistics released by CIHI will differ from statistics released by provincial/territorial regulatory authorities due to CIHI’s collection, processing and reporting methodologies. Additional methodological information is available upon request to [email protected].
Source: Licensed Practical Nurses Database, Canadian Institute for Health Information.
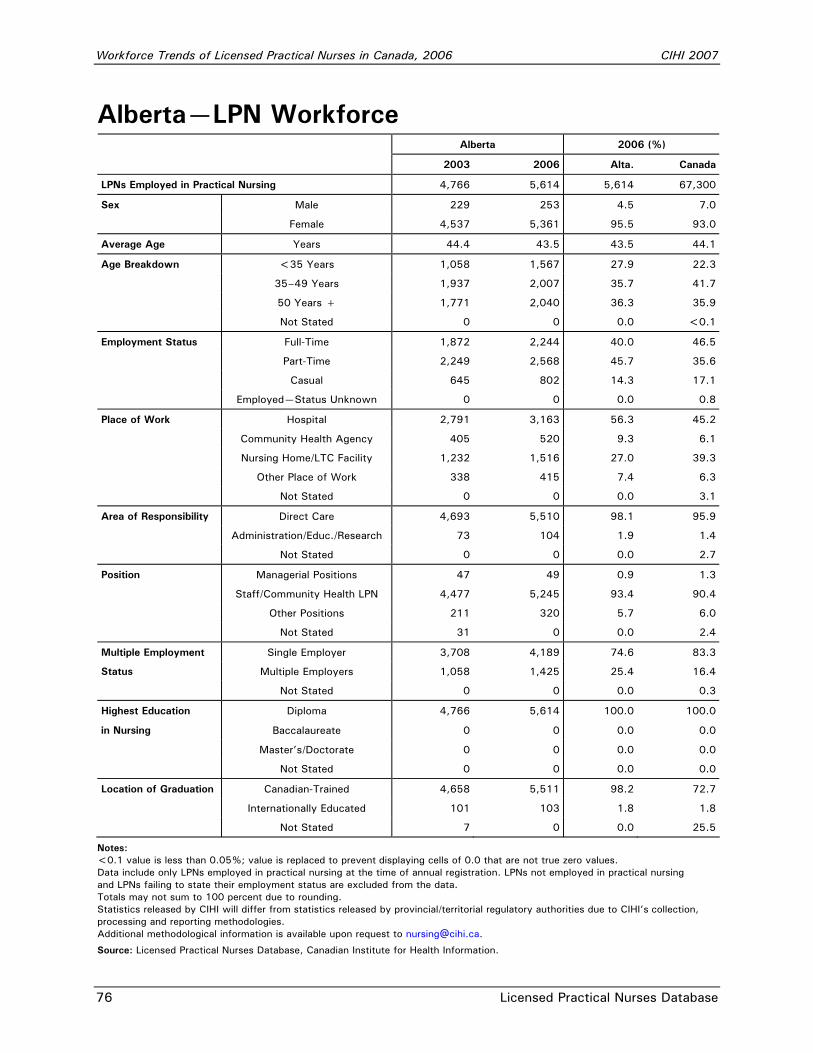
Workforce Trends of Licensed Practical Nurses in Canada, 2006 CIHI 2007
76 Licensed Practical Nurses Database
Alberta—LPN Workforce Alberta 2006 (%)
2003 2006 Alta. Canada
LPNs Employed in Practical Nursing 4,766 5,614 5,614 67,300
Sex Male 229 253 4.5 7.0
Female 4,537 5,361 95.5 93.0
Average Age Years 44.4 43.5 43.5 44.1
Age Breakdown <35 Years 1,058 1,567 27.9 22.3
35–49 Years 1,937 2,007 35.7 41.7
50 Years + 1,771 2,040 36.3 35.9
Not Stated 0 0 0.0 <0.1
Employment Status Full-Time 1,872 2,244 40.0 46.5
Part-Time 2,249 2,568 45.7 35.6
Casual 645 802 14.3 17.1
Employed—Status Unknown 0 0 0.0 0.8
Place of Work Hospital 2,791 3,163 56.3 45.2
Community Health Agency 405 520 9.3 6.1
Nursing Home/LTC Facility 1,232 1,516 27.0 39.3
Other Place of Work 338 415 7.4 6.3
Not Stated 0 0 0.0 3.1
Area of Responsibility Direct Care 4,693 5,510 98.1 95.9
Administration/Educ./Research 73 104 1.9 1.4
Not Stated 0 0 0.0 2.7
Position Managerial Positions 47 49 0.9 1.3
Staff/Community Health LPN 4,477 5,245 93.4 90.4
Other Positions 211 320 5.7 6.0
Not Stated 31 0 0.0 2.4
Multiple Employment Single Employer 3,708 4,189 74.6 83.3
Status Multiple Employers 1,058 1,425 25.4 16.4
Not Stated 0 0 0.0 0.3
Highest Education Diploma 4,766 5,614 100.0 100.0
in Nursing Baccalaureate 0 0 0.0 0.0
Master’s/Doctorate 0 0 0.0 0.0
Not Stated 0 0 0.0 0.0
Location of Graduation Canadian-Trained 4,658 5,511 98.2 72.7
Internationally Educated 101 103 1.8 1.8
Not Stated 7 0 0.0 25.5
Notes: <0.1 value is less than 0.05%; value is replaced to prevent displaying cells of 0.0 that are not true zero values. Data include only LPNs employed in practical nursing at the time of annual registration. LPNs not employed in practical nursing and LPNs failing to state their employment status are excluded from the data. Totals may not sum to 100 percent due to rounding. Statistics released by CIHI will differ from statistics released by provincial/territorial regulatory authorities due to CIHI’s collection, processing and reporting methodologies. Additional methodological information is available upon request to [email protected].
Source: Licensed Practical Nurses Database, Canadian Institute for Health Information.
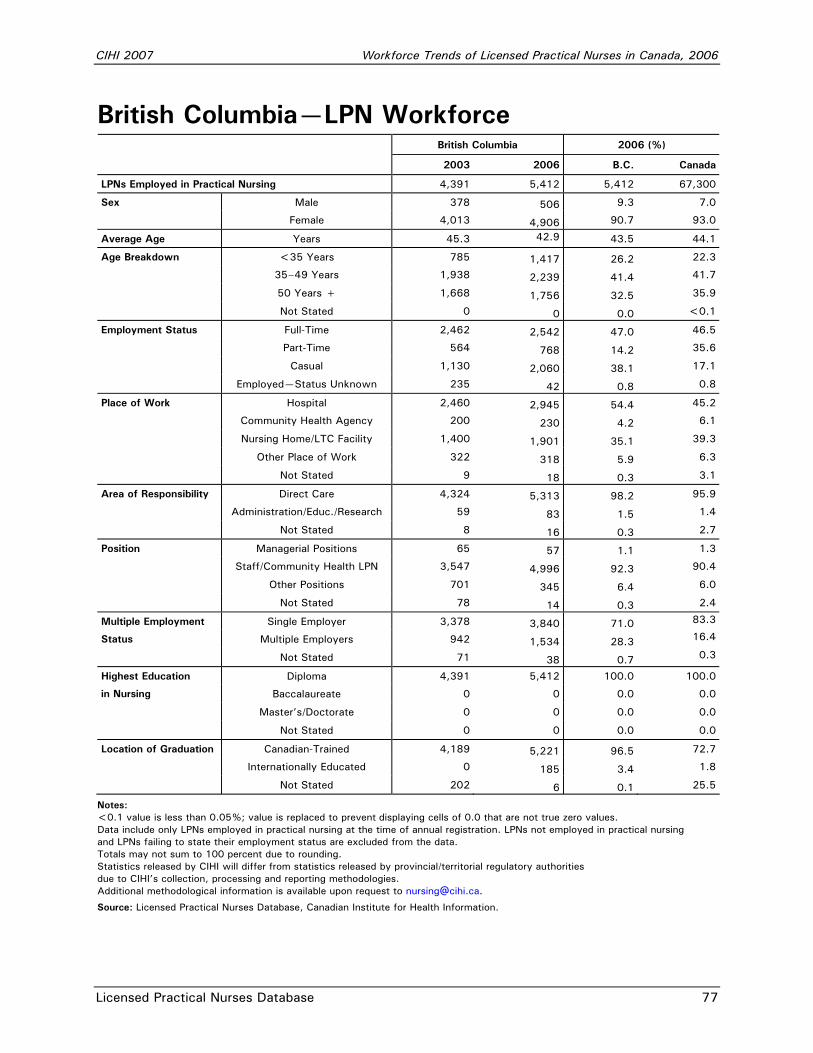
CIHI 2007 Workforce Trends of Licensed Practical Nurses in Canada, 2006
Licensed Practical Nurses Database 77
British Columbia—LPN Workforce British Columbia 2006 (%)
2003 2006 B.C. Canada
LPNs Employed in Practical Nursing 4,391 5,412 5,412 67,300
Sex Male 378 506 9.3 7.0
Female 4,013 4,906 90.7 93.0
Average Age Years 45.3 42.9
43.5 44.1
Age Breakdown <35 Years 785 1,417 26.2 22.3
35–49 Years 1,938 2,239 41.4 41.7
50 Years + 1,668 1,756 32.5 35.9
Not Stated 0 0 0.0 <0.1
Employment Status Full-Time 2,462 2,542 47.0 46.5
Part-Time 564 768 14.2 35.6
Casual 1,130 2,060 38.1 17.1
Employed—Status Unknown 235 42 0.8 0.8
Place of Work Hospital 2,460 2,945 54.4 45.2
Community Health Agency 200 230 4.2 6.1
Nursing Home/LTC Facility 1,400 1,901 35.1 39.3
Other Place of Work 322 318 5.9 6.3
Not Stated 9 18 0.3 3.1
Area of Responsibility Direct Care 4,324 5,313 98.2 95.9
Administration/Educ./Research 59 83 1.5 1.4
Not Stated 8 16 0.3 2.7
Position Managerial Positions 65 57 1.1 1.3
Staff/Community Health LPN 3,547 4,996 92.3 90.4
Other Positions 701 345 6.4 6.0
Not Stated 78 14 0.3 2.4
Multiple Employment Single Employer 3,378 3,840 71.0 83.3
Status Multiple Employers 942 1,534 28.3 16.4
Not Stated 71 38 0.7 0.3
Highest Education Diploma 4,391 5,412 100.0 100.0
in Nursing Baccalaureate 0 0 0.0 0.0
Master’s/Doctorate 0 0 0.0 0.0
Not Stated 0 0 0.0 0.0
Location of Graduation Canadian-Trained 4,189 5,221 96.5 72.7
Internationally Educated 0 185 3.4 1.8
Not Stated 202 6 0.1 25.5
Notes: <0.1 value is less than 0.05%; value is replaced to prevent displaying cells of 0.0 that are not true zero values. Data include only LPNs employed in practical nursing at the time of annual registration. LPNs not employed in practical nursing and LPNs failing to state their employment status are excluded from the data. Totals may not sum to 100 percent due to rounding. Statistics released by CIHI will differ from statistics released by provincial/territorial regulatory authorities due to CIHI’s collection, processing and reporting methodologies. Additional methodological information is available upon request to [email protected].
Source: Licensed Practical Nurses Database, Canadian Institute for Health Information.
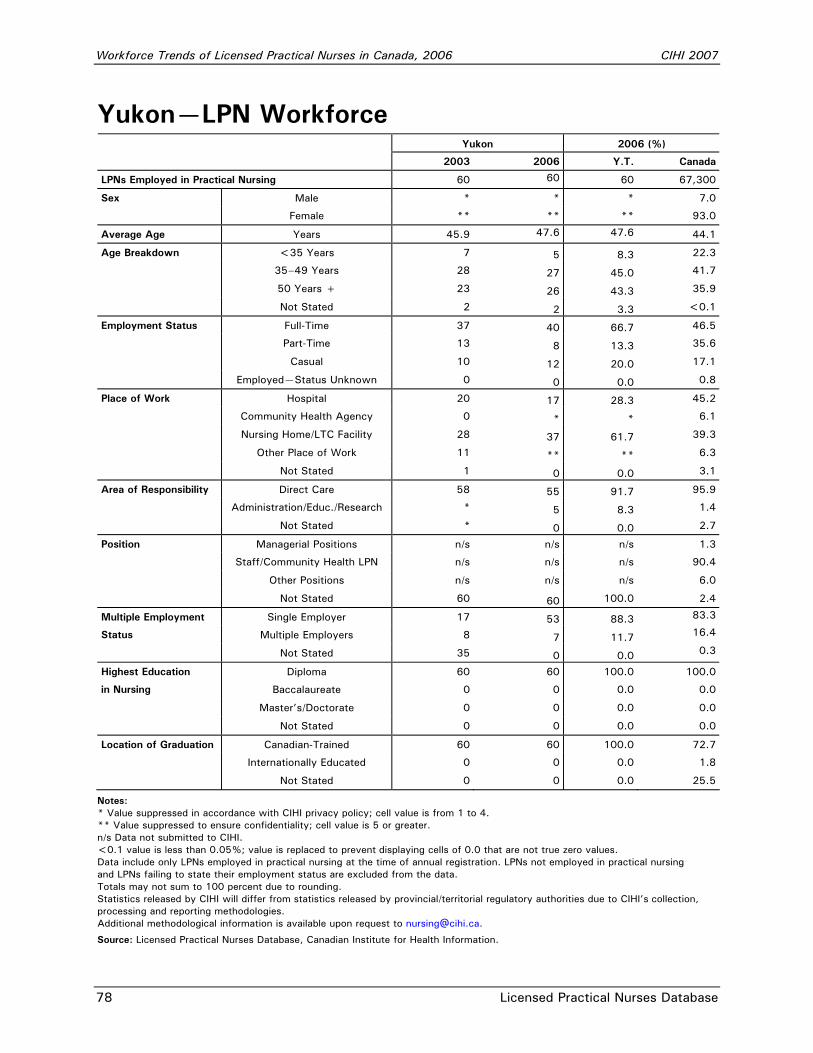
Workforce Trends of Licensed Practical Nurses in Canada, 2006 CIHI 2007
78 Licensed Practical Nurses Database
Yukon—LPN Workforce Yukon 2006 (%)
2003 2006 Y.T. Canada
LPNs Employed in Practical Nursing 60 60
60 67,300
Sex Male * * * 7.0
Female ** ** ** 93.0
Average Age Years 45.9 47.6
47.6
44.1
Age Breakdown <35 Years 7 5 8.3 22.3
35–49 Years 28 27 45.0 41.7
50 Years + 23 26 43.3 35.9
Not Stated 2 2 3.3 <0.1
Employment Status Full-Time 37 40 66.7 46.5
Part-Time 13 8 13.3 35.6
Casual 10 12 20.0 17.1
Employed—Status Unknown 0 0 0.0 0.8
Place of Work Hospital 20 17 28.3 45.2
Community Health Agency 0 * * 6.1
Nursing Home/LTC Facility 28 37 61.7 39.3
Other Place of Work 11 ** ** 6.3
Not Stated 1 0 0.0 3.1
Area of Responsibility Direct Care 58 55 91.7 95.9
Administration/Educ./Research * 5 8.3 1.4
Not Stated * 0 0.0 2.7
Position Managerial Positions n/s n/s n/s 1.3
Staff/Community Health LPN n/s n/s n/s 90.4
Other Positions n/s n/s n/s 6.0
Not Stated 60 60 100.0 2.4
Multiple Employment Single Employer 17 53 88.3 83.3
Status Multiple Employers 8 7 11.7 16.4
Not Stated 35 0 0.0 0.3
Highest Education Diploma 60 60 100.0 100.0
in Nursing Baccalaureate 0 0 0.0 0.0
Master’s/Doctorate 0 0 0.0 0.0
Not Stated 0 0 0.0 0.0
Location of Graduation Canadian-Trained 60 60 100.0 72.7
Internationally Educated 0 0 0.0 1.8
Not Stated 0 0 0.0 25.5
Notes: * Value suppressed in accordance with CIHI privacy policy; cell value is from 1 to 4. ** Value suppressed to ensure confidentiality; cell value is 5 or greater. n/s Data not submitted to CIHI. <0.1 value is less than 0.05%; value is replaced to prevent displaying cells of 0.0 that are not true zero values. Data include only LPNs employed in practical nursing at the time of annual registration. LPNs not employed in practical nursing and LPNs failing to state their employment status are excluded from the data. Totals may not sum to 100 percent due to rounding. Statistics released by CIHI will differ from statistics released by provincial/territorial regulatory authorities due to CIHI’s collection, processing and reporting methodologies. Additional methodological information is available upon request to [email protected].
Source: Licensed Practical Nurses Database, Canadian Institute for Health Information.
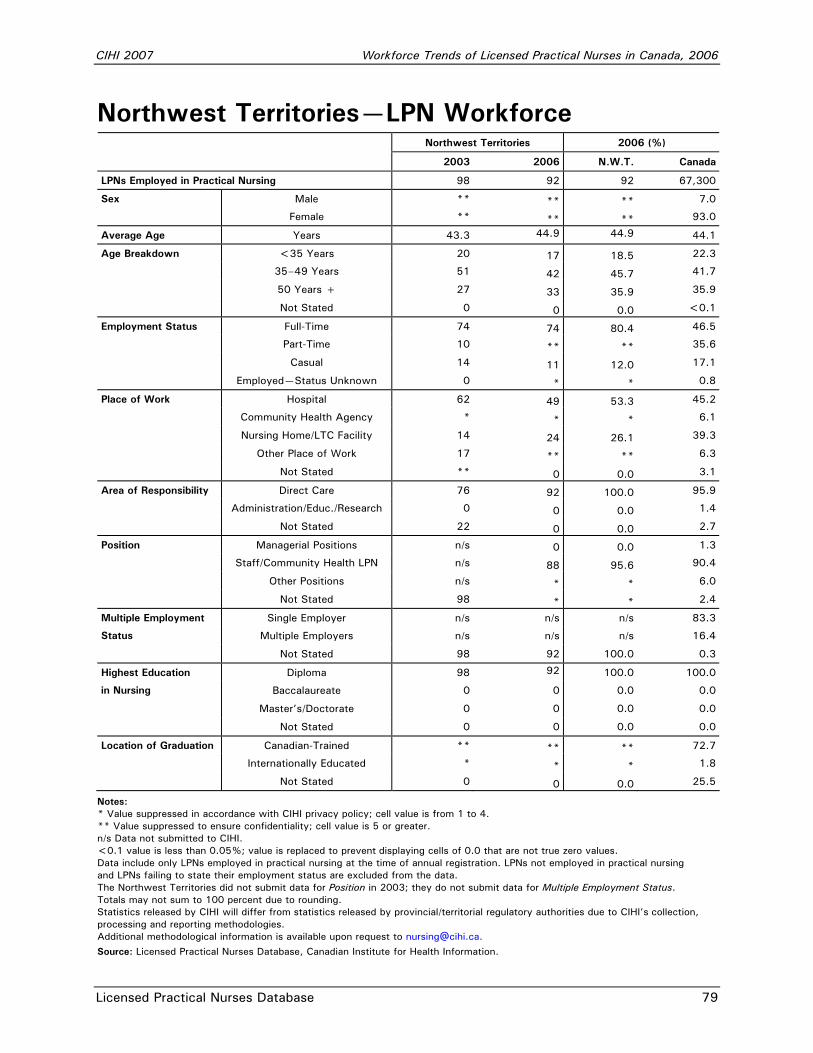
CIHI 2007 Workforce Trends of Licensed Practical Nurses in Canada, 2006
Licensed Practical Nurses Database 79
Northwest Territories—LPN Workforce Northwest Territories 2006 (%)
2003 2006 N.W.T. Canada
LPNs Employed in Practical Nursing 98 92 92 67,300
Sex Male ** ** ** 7.0
Female ** ** ** 93.0
Average Age Years 43.3 44.9
44.9
44.1
Age Breakdown <35 Years 20 17 18.5 22.3
35–49 Years 51 42 45.7 41.7
50 Years + 27 33 35.9 35.9
Not Stated 0 0 0.0 <0.1
Employment Status Full-Time 74 74 80.4 46.5
Part-Time 10 ** ** 35.6
Casual 14 11 12.0 17.1
Employed—Status Unknown 0 * * 0.8
Place of Work Hospital 62 49 53.3 45.2
Community Health Agency * * * 6.1
Nursing Home/LTC Facility 14 24 26.1 39.3
Other Place of Work 17 ** ** 6.3
Not Stated ** 0 0.0 3.1
Area of Responsibility Direct Care 76 92 100.0 95.9
Administration/Educ./Research 0 0 0.0 1.4
Not Stated 22 0 0.0 2.7
Position Managerial Positions n/s 0 0.0 1.3
Staff/Community Health LPN n/s 88 95.6 90.4
Other Positions n/s * * 6.0
Not Stated 98 * * 2.4
Multiple Employment Single Employer n/s n/s n/s 83.3
Status Multiple Employers n/s n/s n/s 16.4
Not Stated 98 92 100.0 0.3
Highest Education Diploma 98 92
100.0 100.0
in Nursing Baccalaureate 0 0 0.0 0.0
Master’s/Doctorate 0 0 0.0 0.0
Not Stated 0 0 0.0 0.0
Location of Graduation Canadian-Trained ** ** ** 72.7
Internationally Educated * * * 1.8
Not Stated 0 0 0.0 25.5
Notes: * Value suppressed in accordance with CIHI privacy policy; cell value is from 1 to 4. ** Value suppressed to ensure confidentiality; cell value is 5 or greater. n/s Data not submitted to CIHI. <0.1 value is less than 0.05%; value is replaced to prevent displaying cells of 0.0 that are not true zero values. Data include only LPNs employed in practical nursing at the time of annual registration. LPNs not employed in practical nursing and LPNs failing to state their employment status are excluded from the data. The Northwest Territories did not submit data for Position in 2003; they do not submit data for Multiple Employment Status. Totals may not sum to 100 percent due to rounding. Statistics released by CIHI will differ from statistics released by provincial/territorial regulatory authorities due to CIHI’s collection, processing and reporting methodologies. Additional methodological information is available upon request to [email protected].
Source: Licensed Practical Nurses Database, Canadian Institute for Health Information.


Appendix A Identification of Secondary Registrations

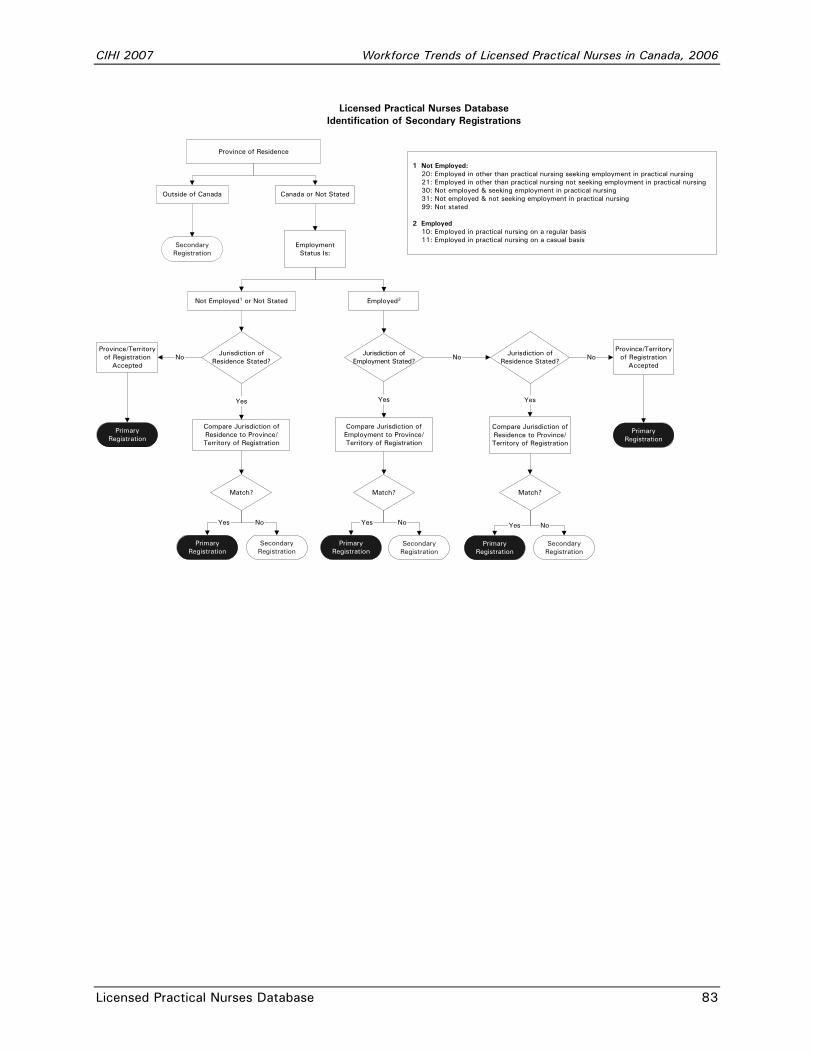
CIHI 2007 Workforce Trends of Licensed Practical Nurses in Canada, 2006
Licensed Practical Nurses Database 83
Province of Residence
Outside of Canada Canada or Not Stated
Employed2
Compare Jurisdiction ofResidence to Province/Territory of Registration
Province/Territoryof Registration
Accepted
Compare Jurisdiction ofEmployment to Province/Territory of Registration
Not Employed1 or Not Stated
SecondaryRegistration
EmploymentStatus Is:
Jurisdiction ofResidence Stated?
PrimaryRegistration
Yes
No
SecondaryRegistration
PrimaryRegistration
Jurisdiction ofEmployment Stated?
No
Yes
Jurisdiction ofResidence Stated?
Compare Jurisdiction ofResidence to Province/Territory of Registration
Yes
NoProvince/Territory
of RegistrationAccepted
Match?
NoYes
Match?
NoYes
Match?
NoYes
1 Not Employed: 20: Employed in other than practical nursing seeking employment in practical nursing 21: Employed in other than practical nursing not seeking employment in practical nursing 30: Not employed & seeking employment in practical nursing 31: Not employed & not seeking employment in practical nursing 99: Not stated
2 Employed 10: Employed in practical nursing on a regular basis 11: Employed in practical nursing on a casual basis
Licensed Practical Nurses DatabaseIdentification of Secondary Registrations
SecondaryRegistration
SecondaryRegistration
PrimaryRegistration
PrimaryRegistration
PrimaryRegistration

Appendix B Comparison of CIHI Statistics
to Regulatory Statistics


CIHI 2007 Workforce Trends of Licensed Practical Nurses in Canada, 2006
Licensed Practical Nurses Database 87
Unknown
3
Casual
1,032
Part-Time
170
Full-Time
1,434
Employment Status:Employed in Nursing
2,639
Employment Status:Not Employed
47
Employment Status:Not Stated
0
PrimaryRegistrations
2,686
SecondaryRegistrations
5
Submitted to CIHI atSix Months
2,691
Not Submitted to CIHI
71
Active-PractisingRegistrations
2,762
Non-PractisingRegistrations
0
Year-EndRegistrations
2,762
Tracing Regulatory Data to CIHI Data
Council for LicensedPractical Nurses of
Newfoundlandand Labrador
Sources: LPNDB, CIHI and provincial LPN regulatory authority.

Workforce Trends of Licensed Practical Nurses in Canada, 2006 CIHI 2007
88 Licensed Practical Nurses Database
Unknown
0
Casual
117
Part-Time
229
Full-Time
253
Employment Status:Employed in Nursing
599
Employment Status:Not Employed
43
Employment Status:Not Stated
14
PrimaryRegistrations
656
SecondaryRegistrations
0
Submitted to CIHI atSix Months
656
Not Submitted to CIHI
0
Active-PractisingRegistrations*
649
Other Registrations†
43
Year-EndRegistrations
692
Tracing Regulatory Data to CIHI Data
Prince Edward IslandLicensed Practical Nurses
Registration Board
Notes: * At year-end, the number of active-practicing LPNs decreased to 649.
† Year-end and other registrations include nurses who are on disability leave, maternity/paternity leave, seeking nursing employment, employed in other than nursing, and who are retired.
Sources: LPNDB, CIHI and provincial LPN regulatory authority.
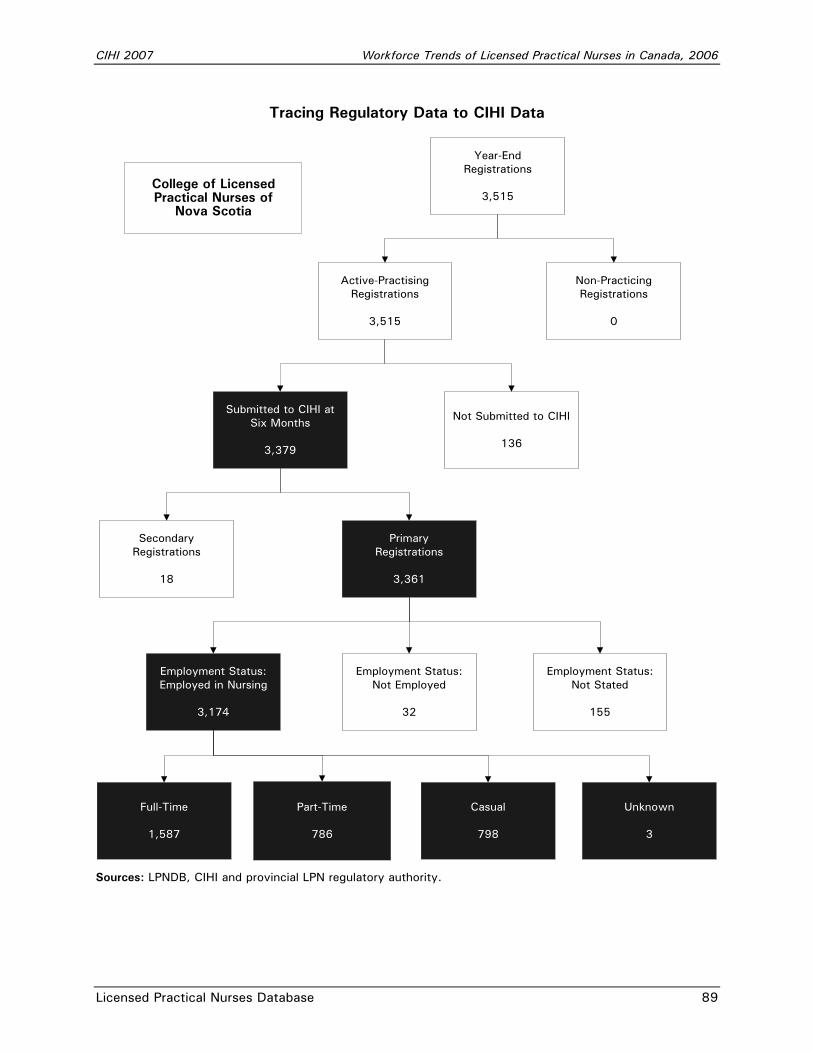
CIHI 2007 Workforce Trends of Licensed Practical Nurses in Canada, 2006
Licensed Practical Nurses Database 89
Unknown
3
Casual
798
Part-Time
786
Full-Time
1,587
Employment Status:Employed in Nursing
3,174
Employment Status:Not Employed
32
Employment Status:Not Stated
155
PrimaryRegistrations
3,361
SecondaryRegistrations
18
Submitted to CIHI atSix Months
3,379
Not Submitted to CIHI
136
Active-PractisingRegistrations
3,515
Non-PracticingRegistrations
0
Year-EndRegistrations
3,515
Tracing Regulatory Data to CIHI Data
College of LicensedPractical Nurses of
Nova Scotia
Sources: LPNDB, CIHI and provincial LPN regulatory authority.
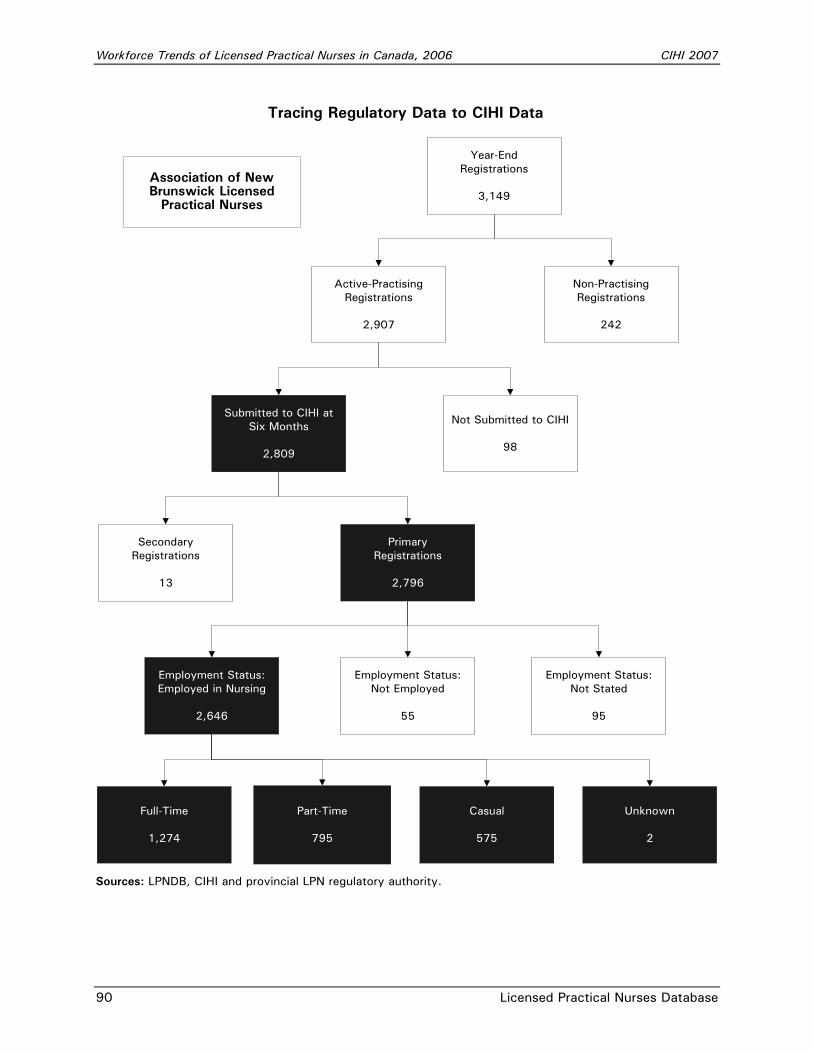
Workforce Trends of Licensed Practical Nurses in Canada, 2006 CIHI 2007
90 Licensed Practical Nurses Database
Unknown
2
Casual
575
Part-Time
795
Full-Time
1,274
Employment Status:Employed in Nursing
2,646
Employment Status:Not Employed
55
Employment Status:Not Stated
95
PrimaryRegistrations
2,796
SecondaryRegistrations
13
Submitted to CIHI atSix Months
2,809
Not Submitted to CIHI
98
Active-PractisingRegistrations
2,907
Non-PractisingRegistrations
242
Year-EndRegistrations
3,149
Tracing Regulatory Data to CIHI Data
Association of NewBrunswick Licensed
Practical Nurses
Sources: LPNDB, CIHI and provincial LPN regulatory authority.
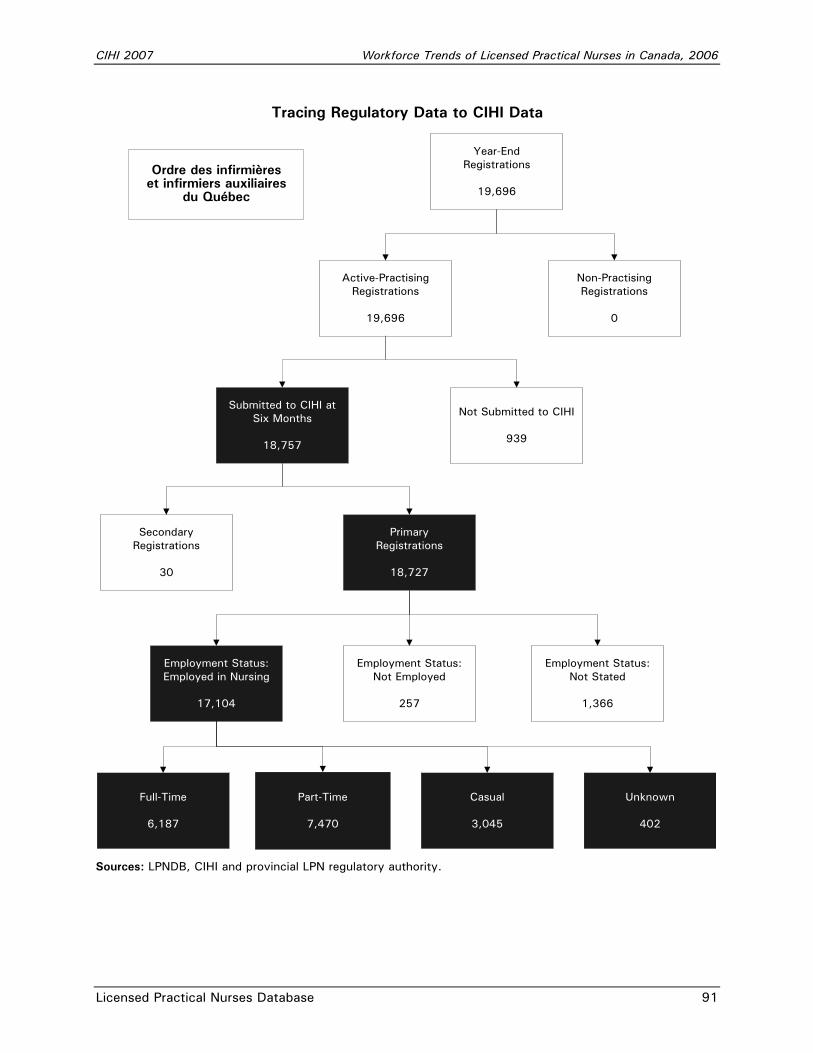
CIHI 2007 Workforce Trends of Licensed Practical Nurses in Canada, 2006
Licensed Practical Nurses Database 91
Unknown
402
Casual
3,045
Part-Time
7,470
Full-Time
6,187
Employment Status:Employed in Nursing
17,104
Employment Status:Not Employed
257
Employment Status:Not Stated
1,366
PrimaryRegistrations
18,727
SecondaryRegistrations
30
Submitted to CIHI atSix Months
18,757
Not Submitted to CIHI
939
Active-PractisingRegistrations
19,696
Non-PractisingRegistrations
0
Year-EndRegistrations
19,696
Tracing Regulatory Data to CIHI Data
Ordre des infirmièreset infirmiers auxiliaires
du Québec
Sources: LPNDB, CIHI and provincial LPN regulatory authority.

Workforce Trends of Licensed Practical Nurses in Canada, 2006 CIHI 2007
92 Licensed Practical Nurses Database
Unknown
0
Casual
2,292
Part-Time
9,027
Full-Time
13,765
Employment Status:Employed in Nursing
25,084
Employment Status:Not Employed
4,230
Employment Status:Not Stated
261
PrimaryRegistrations
29,575
SecondaryRegistrations
400
Submitted to CIHI atSix Months
29,975
Not Submitted to CIHI
0
Active-PractisingRegistrations
29,975
Non-PractisingRegistrations
0
Year-EndRegistrations
29,975
Tracing Regulatory Data to CIHI Data
College of Nursesof Ontario
Sources: LPNDB, CIHI and provincial LPN regulatory authority.
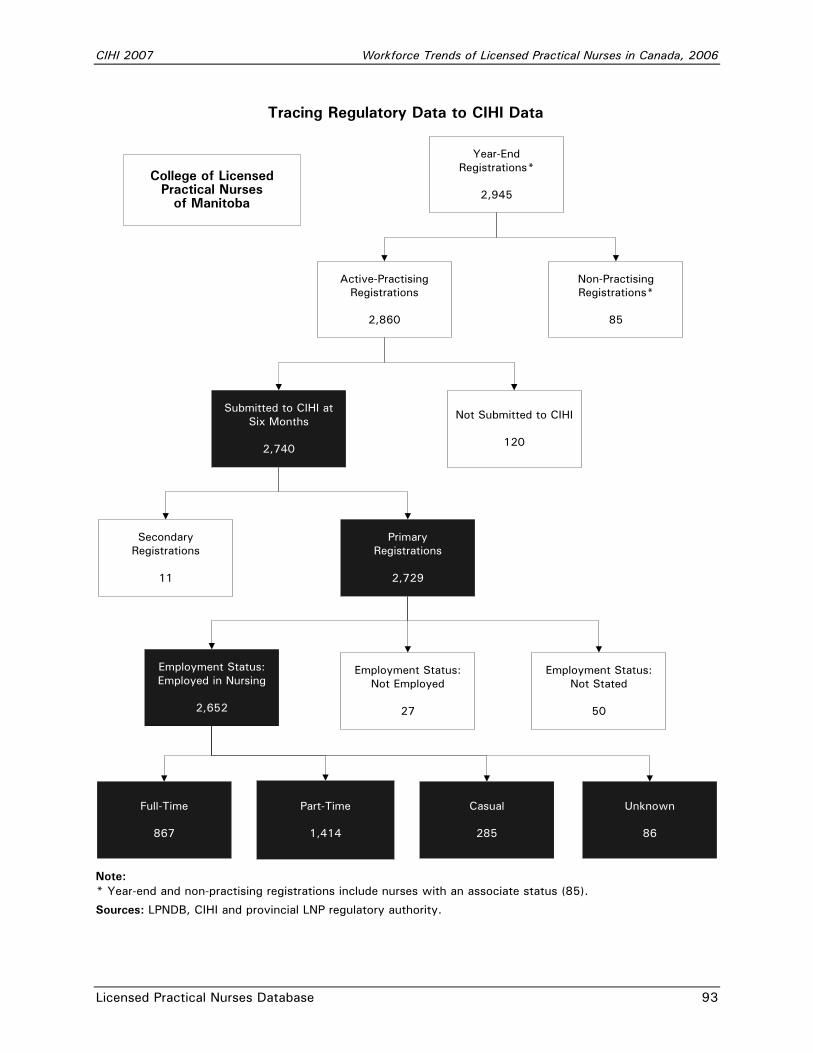
CIHI 2007 Workforce Trends of Licensed Practical Nurses in Canada, 2006
Licensed Practical Nurses Database 93
Unknown
86
Casual
285
Part-Time
1,414
Full-Time
867
Employment Status:Employed in Nursing
2,652
Employment Status:Not Employed
27
Employment Status:Not Stated
50
PrimaryRegistrations
2,729
SecondaryRegistrations
11
Submitted to CIHI atSix Months
2,740
Not Submitted to CIHI
120
Active-PractisingRegistrations
2,860
Non-PractisingRegistrations*
85
Year-EndRegistrations*
2,945
Tracing Regulatory Data to CIHI Data
College of LicensedPractical Nurses
of Manitoba
Note: * Year-end and non-practising registrations include nurses with an associate status (85).
Sources: LPNDB, CIHI and provincial LNP regulatory authority.
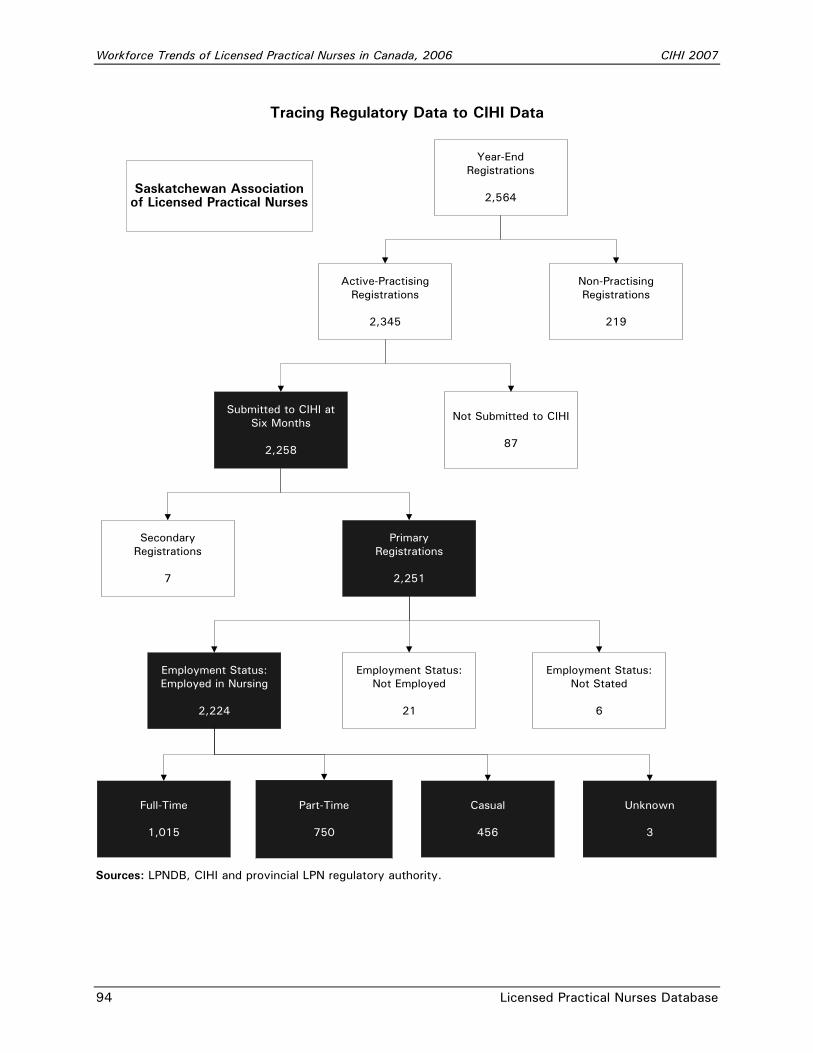
Workforce Trends of Licensed Practical Nurses in Canada, 2006 CIHI 2007
94 Licensed Practical Nurses Database
Unknown
3
Casual
456
Part-Time
750
Full-Time
1,015
Employment Status:Employed in Nursing
2,224
Employment Status:Not Employed
21
Employment Status:Not Stated
6
PrimaryRegistrations
2,251
SecondaryRegistrations
7
Submitted to CIHI atSix Months
2,258
Not Submitted to CIHI
87
Active-PractisingRegistrations
2,345
Non-PractisingRegistrations
219
Year-EndRegistrations
2,564
Tracing Regulatory Data to CIHI Data
Saskatchewan Associationof Licensed Practical Nurses
Sources: LPNDB, CIHI and provincial LPN regulatory authority.
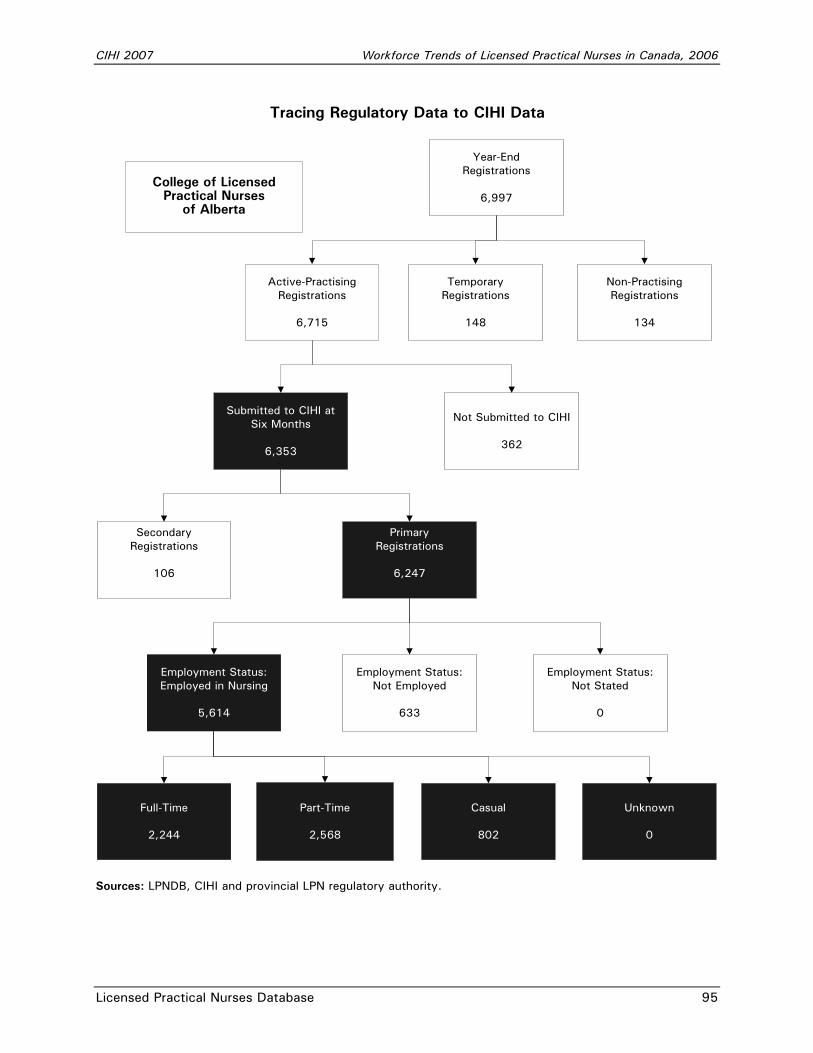
CIHI 2007 Workforce Trends of Licensed Practical Nurses in Canada, 2006
Licensed Practical Nurses Database 95
Unknown
0
Casual
802
Part-Time
2,568
Full-Time
2,244
Employment Status:Employed in Nursing
5,614
Employment Status:Not Employed
633
Employment Status:Not Stated
0
PrimaryRegistrations
6,247
SecondaryRegistrations
106
Submitted to CIHI atSix Months
6,353
Not Submitted to CIHI
362
Active-PractisingRegistrations
6,715
TemporaryRegistrations
148
Non-PractisingRegistrations
134
Year-EndRegistrations
6,997
Tracing Regulatory Data to CIHI Data
College of LicensedPractical Nurses
of Alberta
Sources: LPNDB, CIHI and provincial LPN regulatory authority.
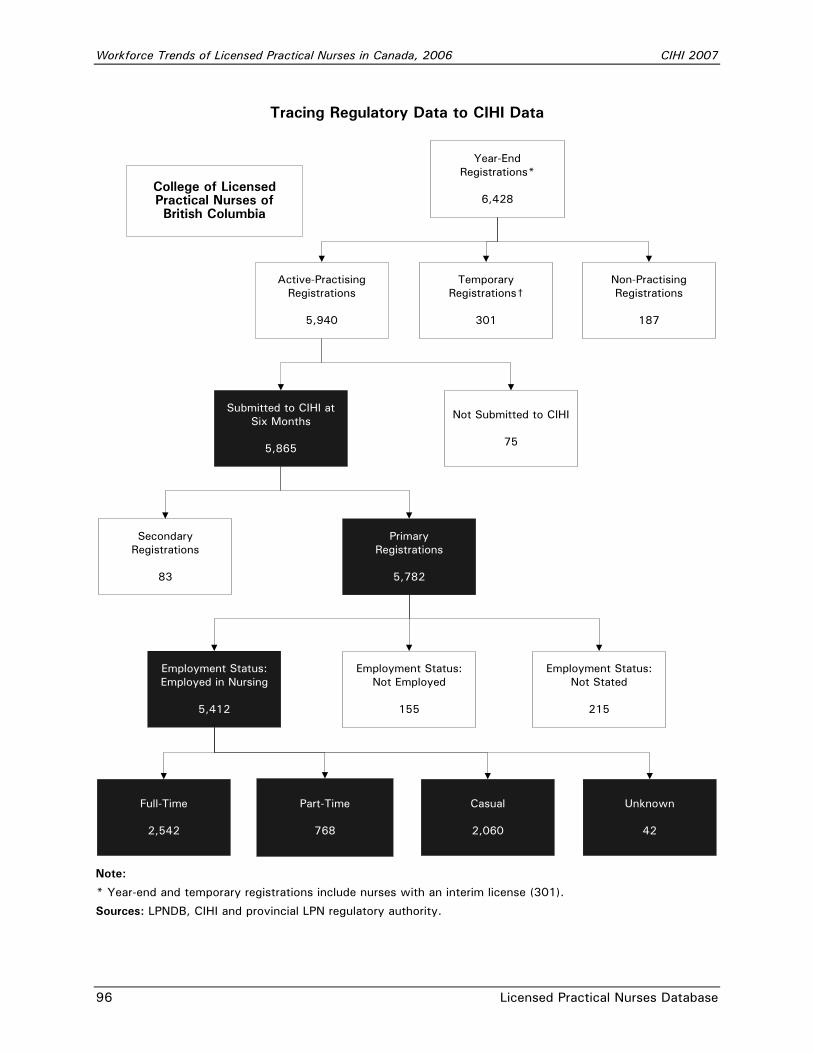
Workforce Trends of Licensed Practical Nurses in Canada, 2006 CIHI 2007
96 Licensed Practical Nurses Database
Unknown
42
Casual
2,060
Part-Time
768
Full-Time
2,542
Employment Status:Employed in Nursing
5,412
Employment Status:Not Employed
155
Employment Status:Not Stated
215
PrimaryRegistrations
5,782
SecondaryRegistrations
83
Submitted to CIHI atSix Months
5,865
Not Submitted to CIHI
75
Active-PractisingRegistrations
5,940
TemporaryRegistrations†
301
Non-PractisingRegistrations
187
Year-EndRegistrations*
6,428
Tracing Regulatory Data to CIHI Data
College of LicensedPractical Nurses ofBritish Columbia
Note:
* Year-end and temporary registrations include nurses with an interim license (301).
Sources: LPNDB, CIHI and provincial LPN regulatory authority.

CIHI 2007 Workforce Trends of Licensed Practical Nurses in Canada, 2006
Licensed Practical Nurses Database 97
Unknown
0
Casual
12
Part-Time
8
Full-Time
40
Employment Status:Employed in Nursing
60
Employment Status:Not Employed
0
Employment Status:Not Stated
1
PrimaryRegistrations
61
SecondaryRegistrations
1
Submitted to CIHI atSix Months
62
Not Submitted to CIHI
0
Active-PractisingRegistrations
62
Non-PractisingRegistrations
0
Year-EndRegistrations
62
Tracing Regulatory Data to CIHI Data
Yukon LicensedPractical Nurses,
Yukon Government
Sources: LPNDB, CIHI and territorial LPN regulatory authority.
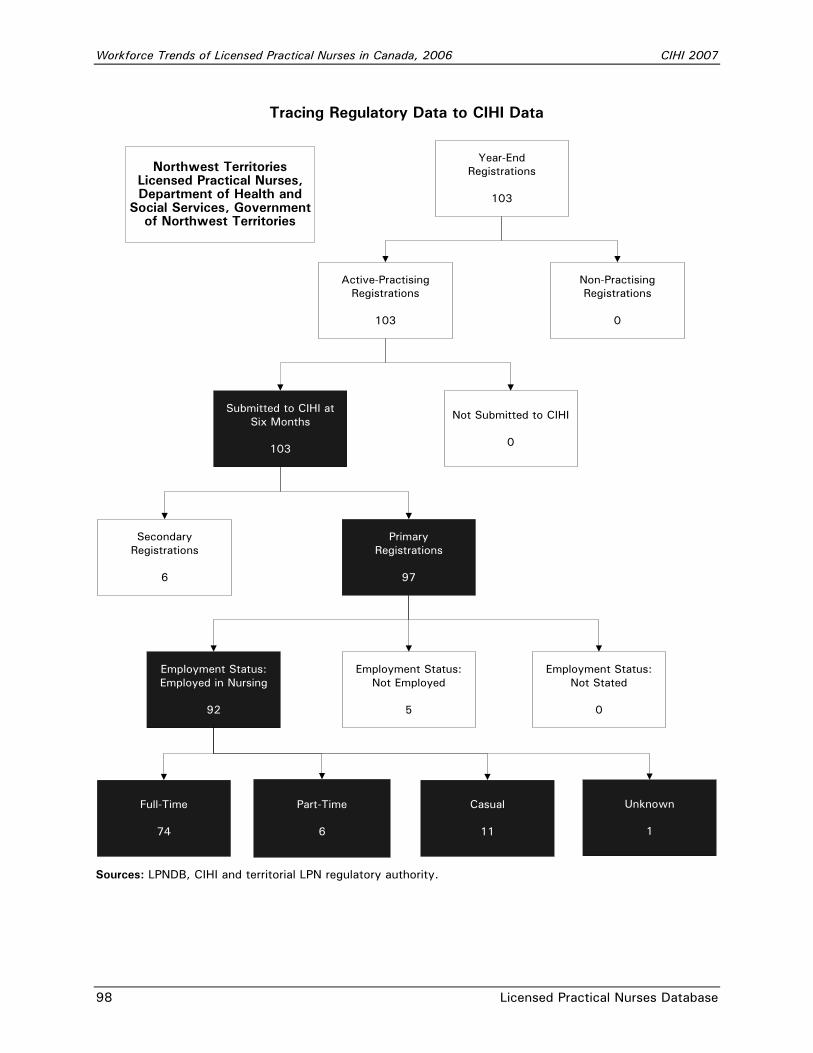
Workforce Trends of Licensed Practical Nurses in Canada, 2006 CIHI 2007
98 Licensed Practical Nurses Database
Unknown
1
Casual
11
Part-Time
6
Full-Time
74
Employment Status:Employed in Nursing
92
Employment Status:Not Employed
5
Employment Status:Not Stated
0
PrimaryRegistrations
97
SecondaryRegistrations
6
Submitted to CIHI atSix Months
103
Not Submitted to CIHI
0
Active-PractisingRegistrations
103
Non-PractisingRegistrations
0
Year-EndRegistrations
103
Tracing Regulatory Data to CIHI Data
Northwest TerritoriesLicensed Practical Nurses,Department of Health and
Social Services, Governmentof Northwest Territories
Sources: LPNDB, CIHI and territorial LPN regulatory authority.

Appendix C Licensed Practical Nursing Contact Information


CIHI 2007 Workforce Trends of Licensed Practical Nurses in Canada, 2006
Licensed Practical Nurses Database 101
Licensed Practical Nursing Contact Information Provincial/Territorial Regulatory Authorities Newfoundland and Labrador Council for Licensed Practical Nurses of Newfoundland and Labrador 9 Paton Street St. John’s, Newfoundland A1B 4S8 www.clpnnl.ca
Prince Edward Island Prince Edward Island Licensed Practical Nurses Registration Board 161 St Peters Road P.O. Box 3235 Charlottetown, Prince Edward Island C1A 7N9
Nova Scotia College of Licensed Practical Nurses of Nova Scotia Suite 1212, Cogswell Tower 2000 Barrington Street Halifax, Nova Scotia B3J 3K1 Website: www.clpnns.ca
New Brunswick Association of New Brunswick Licensed Practical Nurses / Association des infirmiers(ères) auxiliaires autorisé(e)s du Nouveau Brunswick 384 Smythe Street Fredericton, New Brunswick E3B 3E4 Website: www.anblpn.ca
Québec Ordre des infirmières et infirmiers auxiliaires du Québec 531, rue Sherbrooke Est Montréal (Quebec) H2L 1K2 Website: www.oiiaq.org
Ontario College of Nurses of Ontario 101 Davenport Road Toronto, Ontario M5R 3P1 Website: www.cno.org
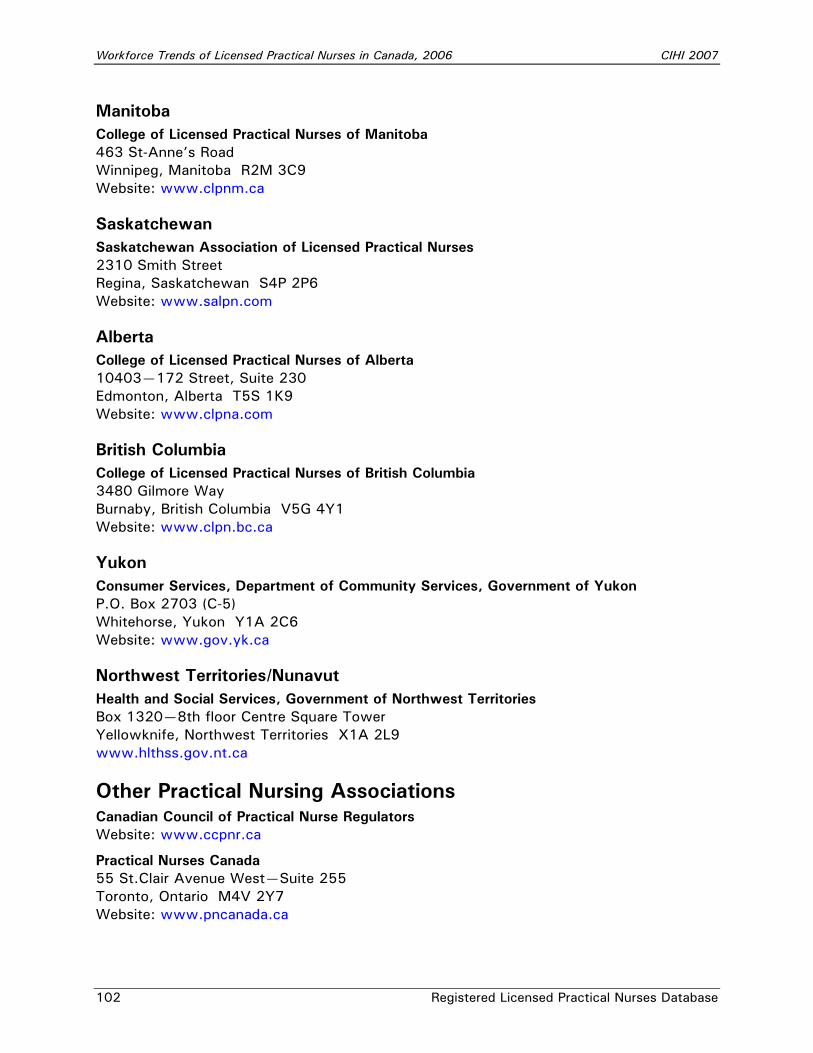
Workforce Trends of Licensed Practical Nurses in Canada, 2006 CIHI 2007
102 Registered Licensed Practical Nurses Database
Manitoba College of Licensed Practical Nurses of Manitoba 463 St-Anne’s Road Winnipeg, Manitoba R2M 3C9 Website: www.clpnm.ca
Saskatchewan Saskatchewan Association of Licensed Practical Nurses 2310 Smith Street Regina, Saskatchewan S4P 2P6 Website: www.salpn.com
Alberta College of Licensed Practical Nurses of Alberta 10403—172 Street, Suite 230 Edmonton, Alberta T5S 1K9 Website: www.clpna.com
British Columbia College of Licensed Practical Nurses of British Columbia 3480 Gilmore Way Burnaby, British Columbia V5G 4Y1 Website: www.clpn.bc.ca
Yukon Consumer Services, Department of Community Services, Government of Yukon P.O. Box 2703 (C-5) Whitehorse, Yukon Y1A 2C6 Website: www.gov.yk.ca
Northwest Territories/Nunavut Health and Social Services, Government of Northwest Territories Box 1320—8th floor Centre Square Tower Yellowknife, Northwest Territories X1A 2L9 www.hlthss.gov.nt.ca
Other Practical Nursing Associations Canadian Council of Practical Nurse Regulators Website: www.ccpnr.ca
Practical Nurses Canada 55 St.Clair Avenue West—Suite 255 Toronto, Ontario M4V 2Y7 Website: www.pncanada.ca

Appendix D List of Data Tables Available on the CIHI Website

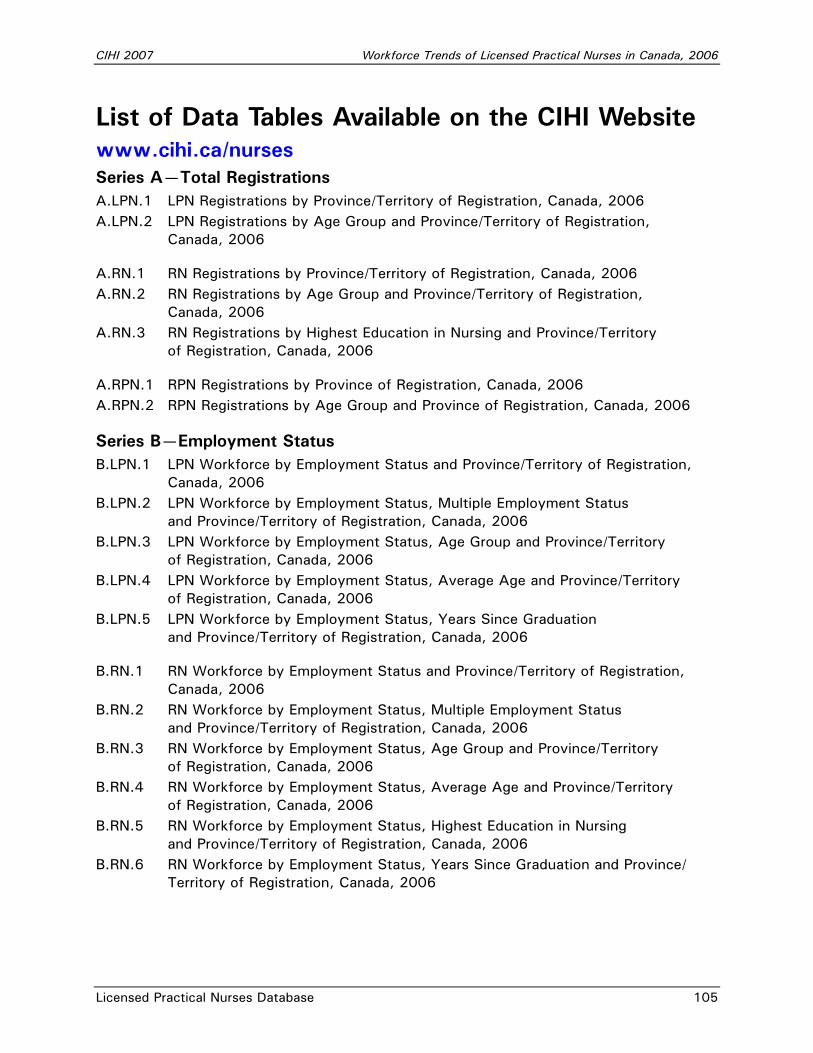
CIHI 2007 Workforce Trends of Licensed Practical Nurses in Canada, 2006
Licensed Practical Nurses Database 105
List of Data Tables Available on the CIHI Website www.cihi.ca/nurses Series A—Total Registrations A.LPN.1 LPN Registrations by Province/Territory of Registration, Canada, 2006 A.LPN.2 LPN Registrations by Age Group and Province/Territory of Registration,
Canada, 2006
A.RN.1 RN Registrations by Province/Territory of Registration, Canada, 2006 A.RN.2 RN Registrations by Age Group and Province/Territory of Registration,
Canada, 2006 A.RN.3 RN Registrations by Highest Education in Nursing and Province/Territory
of Registration, Canada, 2006
A.RPN.1 RPN Registrations by Province of Registration, Canada, 2006 A.RPN.2 RPN Registrations by Age Group and Province of Registration, Canada, 2006
Series B—Employment Status B.LPN.1 LPN Workforce by Employment Status and Province/Territory of Registration,
Canada, 2006 B.LPN.2 LPN Workforce by Employment Status, Multiple Employment Status
and Province/Territory of Registration, Canada, 2006 B.LPN.3 LPN Workforce by Employment Status, Age Group and Province/Territory
of Registration, Canada, 2006 B.LPN.4 LPN Workforce by Employment Status, Average Age and Province/Territory
of Registration, Canada, 2006 B.LPN.5 LPN Workforce by Employment Status, Years Since Graduation
and Province/Territory of Registration, Canada, 2006
B.RN.1 RN Workforce by Employment Status and Province/Territory of Registration, Canada, 2006
B.RN.2 RN Workforce by Employment Status, Multiple Employment Status and Province/Territory of Registration, Canada, 2006
B.RN.3 RN Workforce by Employment Status, Age Group and Province/Territory of Registration, Canada, 2006
B.RN.4 RN Workforce by Employment Status, Average Age and Province/Territory of Registration, Canada, 2006
B.RN.5 RN Workforce by Employment Status, Highest Education in Nursing and Province/Territory of Registration, Canada, 2006
B.RN.6 RN Workforce by Employment Status, Years Since Graduation and Province/ Territory of Registration, Canada, 2006
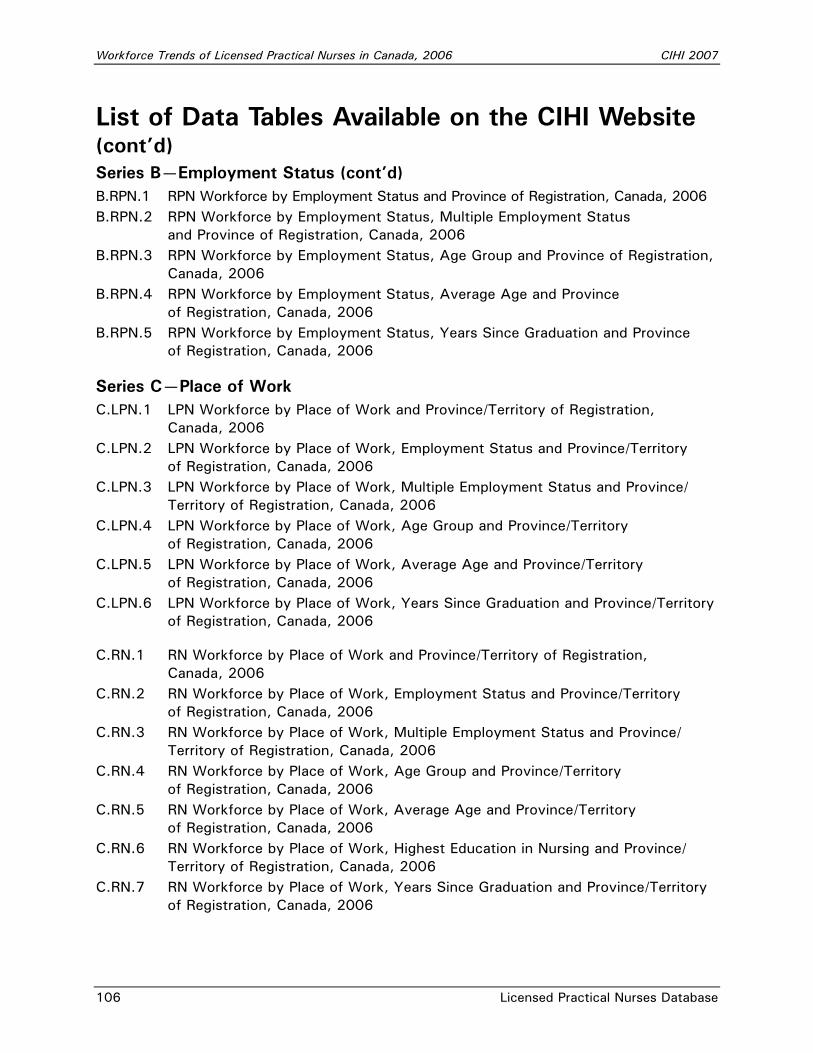
Workforce Trends of Licensed Practical Nurses in Canada, 2006 CIHI 2007
106 Licensed Practical Nurses Database
List of Data Tables Available on the CIHI Website (cont’d) Series B—Employment Status (cont’d) B.RPN.1 RPN Workforce by Employment Status and Province of Registration, Canada, 2006 B.RPN.2 RPN Workforce by Employment Status, Multiple Employment Status
and Province of Registration, Canada, 2006 B.RPN.3 RPN Workforce by Employment Status, Age Group and Province of Registration,
Canada, 2006 B.RPN.4 RPN Workforce by Employment Status, Average Age and Province
of Registration, Canada, 2006 B.RPN.5 RPN Workforce by Employment Status, Years Since Graduation and Province
of Registration, Canada, 2006
Series C—Place of Work C.LPN.1 LPN Workforce by Place of Work and Province/Territory of Registration,
Canada, 2006 C.LPN.2 LPN Workforce by Place of Work, Employment Status and Province/Territory
of Registration, Canada, 2006 C.LPN.3 LPN Workforce by Place of Work, Multiple Employment Status and Province/
Territory of Registration, Canada, 2006 C.LPN.4 LPN Workforce by Place of Work, Age Group and Province/Territory
of Registration, Canada, 2006 C.LPN.5 LPN Workforce by Place of Work, Average Age and Province/Territory
of Registration, Canada, 2006 C.LPN.6 LPN Workforce by Place of Work, Years Since Graduation and Province/Territory
of Registration, Canada, 2006
C.RN.1 RN Workforce by Place of Work and Province/Territory of Registration, Canada, 2006
C.RN.2 RN Workforce by Place of Work, Employment Status and Province/Territory of Registration, Canada, 2006
C.RN.3 RN Workforce by Place of Work, Multiple Employment Status and Province/ Territory of Registration, Canada, 2006
C.RN.4 RN Workforce by Place of Work, Age Group and Province/Territory of Registration, Canada, 2006
C.RN.5 RN Workforce by Place of Work, Average Age and Province/Territory of Registration, Canada, 2006
C.RN.6 RN Workforce by Place of Work, Highest Education in Nursing and Province/ Territory of Registration, Canada, 2006
C.RN.7 RN Workforce by Place of Work, Years Since Graduation and Province/Territory of Registration, Canada, 2006
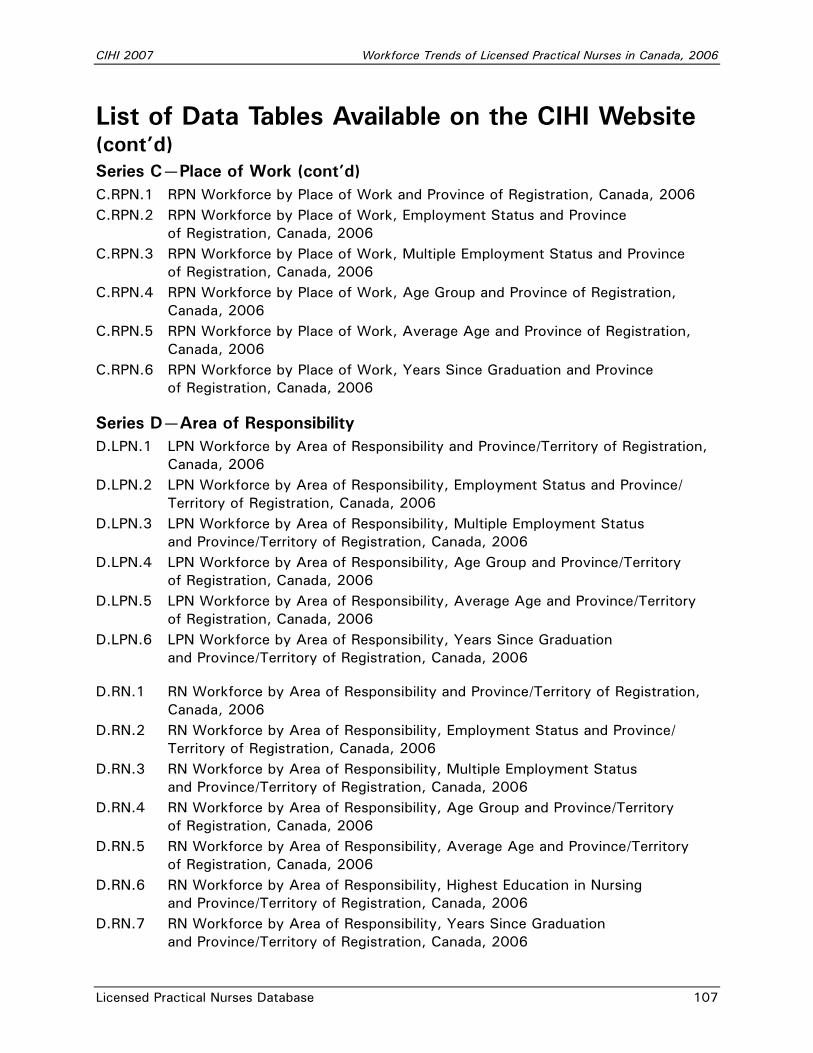
CIHI 2007 Workforce Trends of Licensed Practical Nurses in Canada, 2006
Licensed Practical Nurses Database 107
List of Data Tables Available on the CIHI Website (cont’d) Series C—Place of Work (cont’d) C.RPN.1 RPN Workforce by Place of Work and Province of Registration, Canada, 2006 C.RPN.2 RPN Workforce by Place of Work, Employment Status and Province
of Registration, Canada, 2006 C.RPN.3 RPN Workforce by Place of Work, Multiple Employment Status and Province
of Registration, Canada, 2006 C.RPN.4 RPN Workforce by Place of Work, Age Group and Province of Registration,
Canada, 2006 C.RPN.5 RPN Workforce by Place of Work, Average Age and Province of Registration,
Canada, 2006 C.RPN.6 RPN Workforce by Place of Work, Years Since Graduation and Province
of Registration, Canada, 2006
Series D—Area of Responsibility D.LPN.1 LPN Workforce by Area of Responsibility and Province/Territory of Registration,
Canada, 2006 D.LPN.2 LPN Workforce by Area of Responsibility, Employment Status and Province/
Territory of Registration, Canada, 2006 D.LPN.3 LPN Workforce by Area of Responsibility, Multiple Employment Status
and Province/Territory of Registration, Canada, 2006 D.LPN.4 LPN Workforce by Area of Responsibility, Age Group and Province/Territory
of Registration, Canada, 2006 D.LPN.5 LPN Workforce by Area of Responsibility, Average Age and Province/Territory
of Registration, Canada, 2006 D.LPN.6 LPN Workforce by Area of Responsibility, Years Since Graduation
and Province/Territory of Registration, Canada, 2006
D.RN.1 RN Workforce by Area of Responsibility and Province/Territory of Registration, Canada, 2006
D.RN.2 RN Workforce by Area of Responsibility, Employment Status and Province/ Territory of Registration, Canada, 2006
D.RN.3 RN Workforce by Area of Responsibility, Multiple Employment Status and Province/Territory of Registration, Canada, 2006
D.RN.4 RN Workforce by Area of Responsibility, Age Group and Province/Territory of Registration, Canada, 2006
D.RN.5 RN Workforce by Area of Responsibility, Average Age and Province/Territory of Registration, Canada, 2006
D.RN.6 RN Workforce by Area of Responsibility, Highest Education in Nursing and Province/Territory of Registration, Canada, 2006
D.RN.7 RN Workforce by Area of Responsibility, Years Since Graduation and Province/Territory of Registration, Canada, 2006
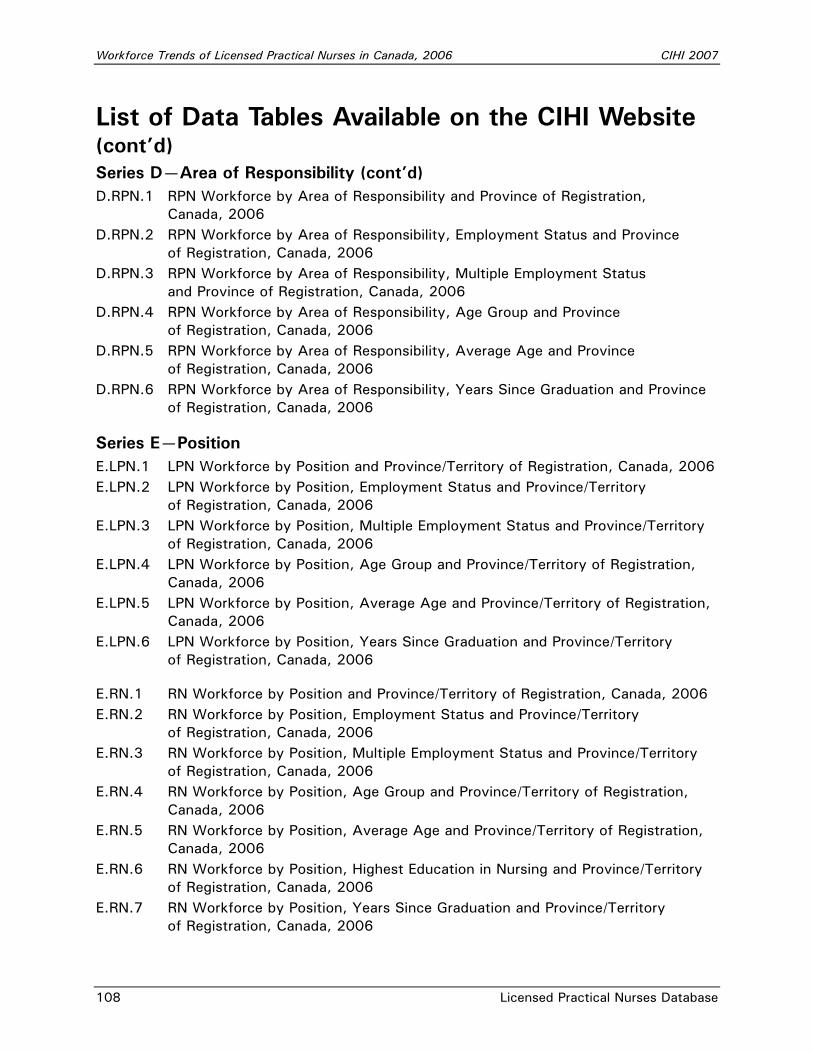
Workforce Trends of Licensed Practical Nurses in Canada, 2006 CIHI 2007
108 Licensed Practical Nurses Database
List of Data Tables Available on the CIHI Website (cont’d) Series D—Area of Responsibility (cont’d) D.RPN.1 RPN Workforce by Area of Responsibility and Province of Registration,
Canada, 2006 D.RPN.2 RPN Workforce by Area of Responsibility, Employment Status and Province
of Registration, Canada, 2006 D.RPN.3 RPN Workforce by Area of Responsibility, Multiple Employment Status
and Province of Registration, Canada, 2006 D.RPN.4 RPN Workforce by Area of Responsibility, Age Group and Province
of Registration, Canada, 2006 D.RPN.5 RPN Workforce by Area of Responsibility, Average Age and Province
of Registration, Canada, 2006 D.RPN.6 RPN Workforce by Area of Responsibility, Years Since Graduation and Province
of Registration, Canada, 2006
Series E—Position E.LPN.1 LPN Workforce by Position and Province/Territory of Registration, Canada, 2006 E.LPN.2 LPN Workforce by Position, Employment Status and Province/Territory
of Registration, Canada, 2006 E.LPN.3 LPN Workforce by Position, Multiple Employment Status and Province/Territory
of Registration, Canada, 2006 E.LPN.4 LPN Workforce by Position, Age Group and Province/Territory of Registration,
Canada, 2006 E.LPN.5 LPN Workforce by Position, Average Age and Province/Territory of Registration,
Canada, 2006 E.LPN.6 LPN Workforce by Position, Years Since Graduation and Province/Territory
of Registration, Canada, 2006
E.RN.1 RN Workforce by Position and Province/Territory of Registration, Canada, 2006 E.RN.2 RN Workforce by Position, Employment Status and Province/Territory
of Registration, Canada, 2006 E.RN.3 RN Workforce by Position, Multiple Employment Status and Province/Territory
of Registration, Canada, 2006 E.RN.4 RN Workforce by Position, Age Group and Province/Territory of Registration,
Canada, 2006 E.RN.5 RN Workforce by Position, Average Age and Province/Territory of Registration,
Canada, 2006 E.RN.6 RN Workforce by Position, Highest Education in Nursing and Province/Territory
of Registration, Canada, 2006 E.RN.7 RN Workforce by Position, Years Since Graduation and Province/Territory
of Registration, Canada, 2006
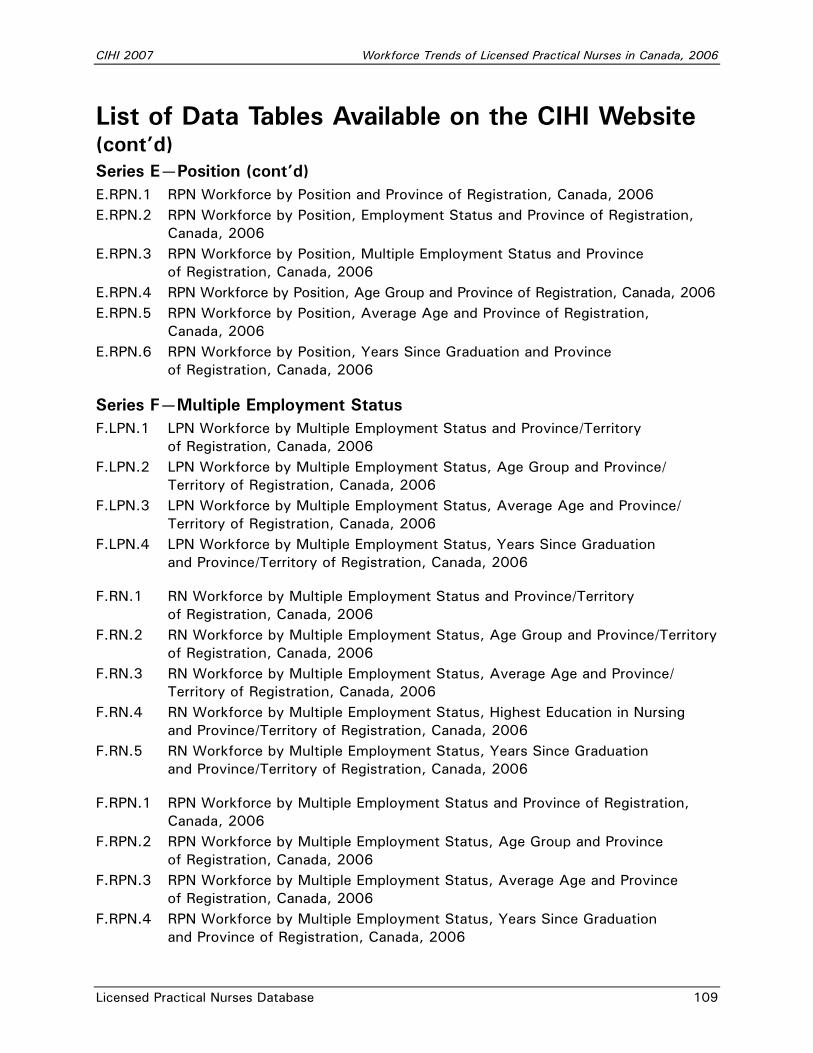
CIHI 2007 Workforce Trends of Licensed Practical Nurses in Canada, 2006
Licensed Practical Nurses Database 109
List of Data Tables Available on the CIHI Website (cont’d) Series E—Position (cont’d) E.RPN.1 RPN Workforce by Position and Province of Registration, Canada, 2006 E.RPN.2 RPN Workforce by Position, Employment Status and Province of Registration,
Canada, 2006 E.RPN.3 RPN Workforce by Position, Multiple Employment Status and Province
of Registration, Canada, 2006 E.RPN.4 RPN Workforce by Position, Age Group and Province of Registration, Canada, 2006 E.RPN.5 RPN Workforce by Position, Average Age and Province of Registration,
Canada, 2006 E.RPN.6 RPN Workforce by Position, Years Since Graduation and Province
of Registration, Canada, 2006
Series F—Multiple Employment Status F.LPN.1 LPN Workforce by Multiple Employment Status and Province/Territory
of Registration, Canada, 2006 F.LPN.2 LPN Workforce by Multiple Employment Status, Age Group and Province/
Territory of Registration, Canada, 2006 F.LPN.3 LPN Workforce by Multiple Employment Status, Average Age and Province/
Territory of Registration, Canada, 2006 F.LPN.4 LPN Workforce by Multiple Employment Status, Years Since Graduation
and Province/Territory of Registration, Canada, 2006
F.RN.1 RN Workforce by Multiple Employment Status and Province/Territory of Registration, Canada, 2006
F.RN.2 RN Workforce by Multiple Employment Status, Age Group and Province/Territory of Registration, Canada, 2006
F.RN.3 RN Workforce by Multiple Employment Status, Average Age and Province/ Territory of Registration, Canada, 2006
F.RN.4 RN Workforce by Multiple Employment Status, Highest Education in Nursing and Province/Territory of Registration, Canada, 2006
F.RN.5 RN Workforce by Multiple Employment Status, Years Since Graduation and Province/Territory of Registration, Canada, 2006
F.RPN.1 RPN Workforce by Multiple Employment Status and Province of Registration, Canada, 2006
F.RPN.2 RPN Workforce by Multiple Employment Status, Age Group and Province of Registration, Canada, 2006
F.RPN.3 RPN Workforce by Multiple Employment Status, Average Age and Province of Registration, Canada, 2006
F.RPN.4 RPN Workforce by Multiple Employment Status, Years Since Graduation and Province of Registration, Canada, 2006
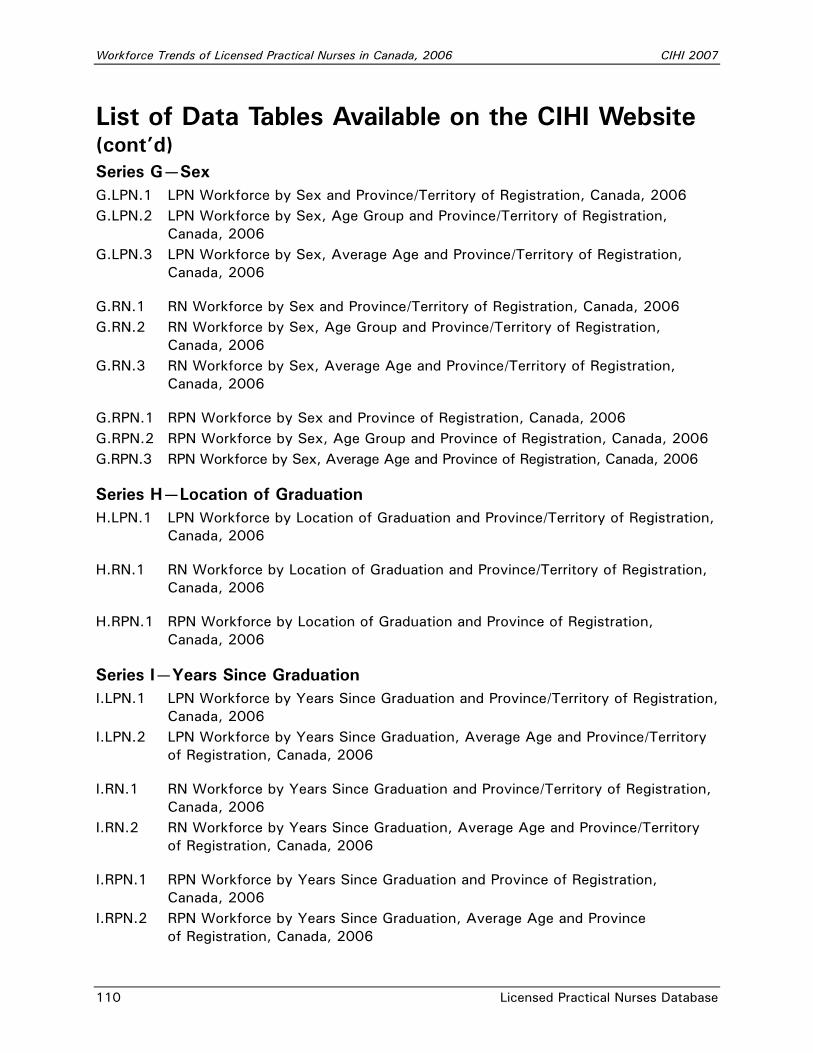
Workforce Trends of Licensed Practical Nurses in Canada, 2006 CIHI 2007
110 Licensed Practical Nurses Database
List of Data Tables Available on the CIHI Website (cont’d) Series G—Sex G.LPN.1 LPN Workforce by Sex and Province/Territory of Registration, Canada, 2006 G.LPN.2 LPN Workforce by Sex, Age Group and Province/Territory of Registration,
Canada, 2006 G.LPN.3 LPN Workforce by Sex, Average Age and Province/Territory of Registration,
Canada, 2006
G.RN.1 RN Workforce by Sex and Province/Territory of Registration, Canada, 2006 G.RN.2 RN Workforce by Sex, Age Group and Province/Territory of Registration,
Canada, 2006 G.RN.3 RN Workforce by Sex, Average Age and Province/Territory of Registration,
Canada, 2006
G.RPN.1 RPN Workforce by Sex and Province of Registration, Canada, 2006 G.RPN.2 RPN Workforce by Sex, Age Group and Province of Registration, Canada, 2006 G.RPN.3 RPN Workforce by Sex, Average Age and Province of Registration, Canada, 2006
Series H—Location of Graduation H.LPN.1 LPN Workforce by Location of Graduation and Province/Territory of Registration,
Canada, 2006
H.RN.1 RN Workforce by Location of Graduation and Province/Territory of Registration, Canada, 2006
H.RPN.1 RPN Workforce by Location of Graduation and Province of Registration, Canada, 2006
Series I—Years Since Graduation I.LPN.1 LPN Workforce by Years Since Graduation and Province/Territory of Registration,
Canada, 2006 I.LPN.2 LPN Workforce by Years Since Graduation, Average Age and Province/Territory
of Registration, Canada, 2006
I.RN.1 RN Workforce by Years Since Graduation and Province/Territory of Registration, Canada, 2006
I.RN.2 RN Workforce by Years Since Graduation, Average Age and Province/Territory of Registration, Canada, 2006
I.RPN.1 RPN Workforce by Years Since Graduation and Province of Registration, Canada, 2006
I.RPN.2 RPN Workforce by Years Since Graduation, Average Age and Province of Registration, Canada, 2006
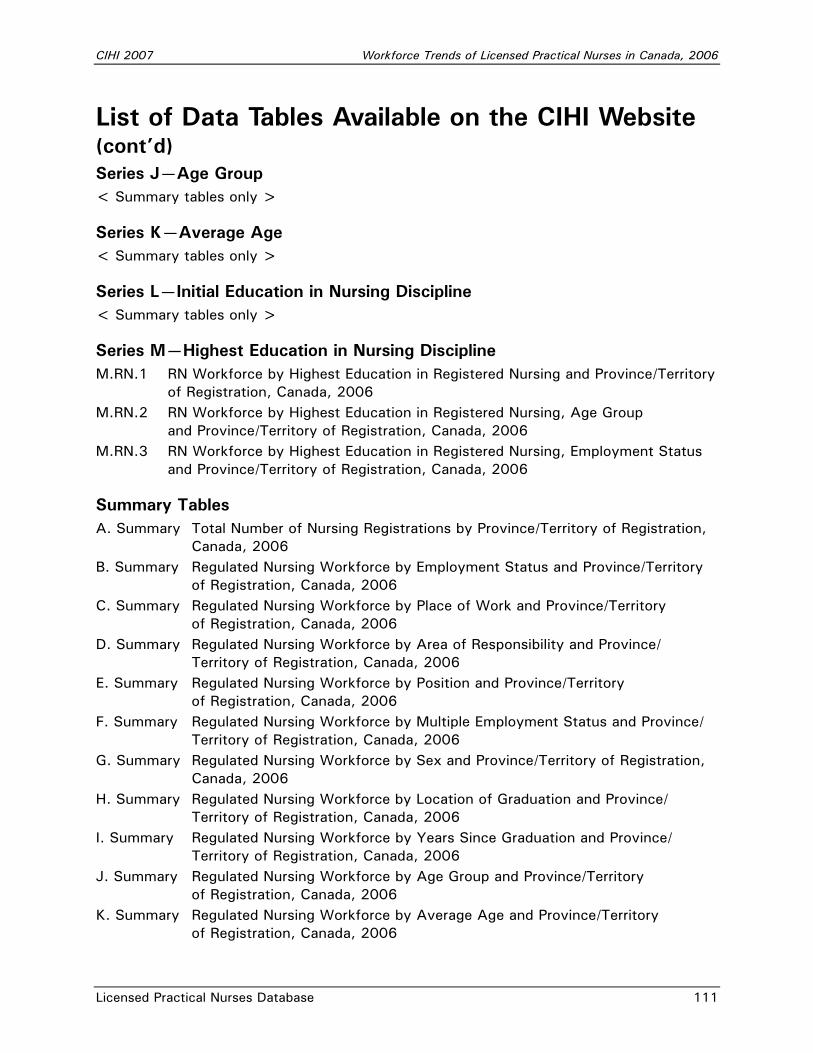
CIHI 2007 Workforce Trends of Licensed Practical Nurses in Canada, 2006
Licensed Practical Nurses Database 111
List of Data Tables Available on the CIHI Website (cont’d) Series J—Age Group < Summary tables only >
Series K—Average Age < Summary tables only >
Series L—Initial Education in Nursing Discipline < Summary tables only >
Series M—Highest Education in Nursing Discipline M.RN.1 RN Workforce by Highest Education in Registered Nursing and Province/Territory
of Registration, Canada, 2006 M.RN.2 RN Workforce by Highest Education in Registered Nursing, Age Group
and Province/Territory of Registration, Canada, 2006 M.RN.3 RN Workforce by Highest Education in Registered Nursing, Employment Status
and Province/Territory of Registration, Canada, 2006
Summary Tables A. Summary Total Number of Nursing Registrations by Province/Territory of Registration,
Canada, 2006 B. Summary Regulated Nursing Workforce by Employment Status and Province/Territory
of Registration, Canada, 2006 C. Summary Regulated Nursing Workforce by Place of Work and Province/Territory
of Registration, Canada, 2006 D. Summary Regulated Nursing Workforce by Area of Responsibility and Province/
Territory of Registration, Canada, 2006 E. Summary Regulated Nursing Workforce by Position and Province/Territory
of Registration, Canada, 2006 F. Summary Regulated Nursing Workforce by Multiple Employment Status and Province/
Territory of Registration, Canada, 2006 G. Summary Regulated Nursing Workforce by Sex and Province/Territory of Registration,
Canada, 2006 H. Summary Regulated Nursing Workforce by Location of Graduation and Province/
Territory of Registration, Canada, 2006 I. Summary Regulated Nursing Workforce by Years Since Graduation and Province/
Territory of Registration, Canada, 2006 J. Summary Regulated Nursing Workforce by Age Group and Province/Territory
of Registration, Canada, 2006 K. Summary Regulated Nursing Workforce by Average Age and Province/Territory
of Registration, Canada, 2006
Workforce Trends of Licensed Practical Nurses in Canada, 2006 CIHI 2007
112 Licensed Practical Nurses Database
Summary Tables (cont’d) L. Summary Regulated Nursing Workforce by Initial Education in Nursing Discipline
and Province/Territory of Registration, Canada, 2006 M. Summary Regulated Nursing Workforce by Highest Education in Nursing Discipline
and Province/Territory of Registration, Canada, 2006

CIHI 2007 Workforce Trends of Licensed Practical Nurses in Canada, 2006
Licensed Practical Nurses Database 113
References 1. Statistics Canada, 2005 National Survey of the Work and Health of Nurses, Canadian Institute for Health
Information share file (share rate 98.2%).
2. Canadian Institute for Health Information, Distribution and Internal Migration of Canada’s Licensed Practical Nurse Workforce (Ottawa: CIHI, 2007).
3. Canadian Institute for Health Information, Health Personnel Trends in Canada, 1995–2004 (Ottawa: CIHI, 2006).
4. C. McNiven, H. Puderer and D. Janes, Census Metropolitan Area and Census Agglomeration Influenced Zones (MIZ): A Description of the Methodology (Geography Working Paper Series No. 2000-2) (Ottawa: Statistics Canada, 2000), catalogue no. 92F0138MIE.
5. V. Du Plessis, R. Beshiri and R. D. Bollman, “Definitions of Rural,” Rural and Small Town Canada Analysis Bulletin 3, 3 (November 2001).
6. Canadian Institute for Health Information, Supply and Distribution of Registered Nurses in Rural and Small Town Canada, 2000 (Ottawa: CIHI, 2002).


Taking health information further
À l�avant-garde de l�information sur la santéwww.cihi.ca
www.icis.ca
Taking health information further
À l�avant-garde de l�information sur la santéwww.cihi.ca
www.icis.ca