licos discussion paper series - ku leuven
TRANSCRIPT

LICOS Discussion Paper Series
Discussion Paper 366/2015
A Value Chain Approach to Measuring Distortions to Incentives and Food Policy Effects
(with application to Pakistan’s grain policy)
Elena Briones Alonso and Johan Swinnen
Faculty of Economics And Business LICOS Centre for Institutions and Economic Performance Waaistraat 6 – mailbox 3511 3000 Leuven BELGIUM
TEL:+32-(0)16 32 65 98 FAX:+32-(0)16 32 65 99 http://www.econ.kuleuven.be/licos

1
A Value Chain Approach to Measuring Distortions to
Incentives and Food Policy Effects
(with application to Pakistan’s grain policy)
Elena Briones Alonso1 and Johan Swinnen1,2
1 LICOS Centre for Institutions and Economic Performance
KU Leuven
2 Centre for Food Security and the Environment
Stanford University
This Version: April 1, 2015
Abstract
We develop an extended Nominal Rate of Assistance (NRA) methodology to disentangle the
welfare impacts of policies for various interest groups along the value chain (to disaggregate
effects within the “producer” and “consumer” umbrellas). We apply our value chain NRA
methodology to the case of Pakistan’s price and trade policy. We analyse the welfare implications
for various agents in the wheat-flour value chain from 2000 to 2013, a period characterized by
major global price volatility and by regular adjustments of domestic policies. We find that the
wheat price policy has generally benefitted flour consumers and wheat traders at the expense of
wheat farmers and to a lesser extent flour millers. Our findings illustrate that the welfare
implications of policies can be quite different within the “producer” and “consumer” umbrellas,
which has potentially important implications for economic and political economy analyses and for
the design of policies that aim to target the poorest groups along value chains.
We thank Paul Dorosh for the provision of data and for many invaluable comments. Bekzod
Shamsiev and Garry Christensen also contributed many helpful comments. The research received
financial support from the KU Leuven (Methusalem), the World Bank and the European
Commission (FoodSecure Project). The authors are solely responsible for the views expressed in
this paper.
Corresponding author: Elena Briones Alonso at [email protected].

2
1. Introduction
Both economic policy and political economy models often consider “producers”, “consumers”,
and “taxpayers” as the main agents in the economy to study the welfare impacts of policies, their
incentive effects, and rent (re-)distribution. It is well known that the “real economy” is much more
complicated and that many more agents are affected – and also play a role in lobbying governments
to introduce or remove certain policies. In agricultural and food policies “other agents” include
input suppliers (such as land owners, seed and agro-chemical companies, and rural banks) on the
upstream side of the value chain and traders, food processors and retail companies on the
downstream side of the value chain. These agents may be differently affected by policies,
depending on the nature of the policy (e.g. whether the policy is targeted to the (raw) agricultural
commodity (such as price support for grain) or to a processed commodity (such as import tariffs
on bread or cheese).1 As a consequence, these different agents have sometimes joined forces
(“political coalitions”) with farmers or with final consumers to influence policy makers in setting
public policies.
One of the reasons for simple producer-consumer models is of course its didactic use in
theory, i.e. to avoid unnecessary complications in economic models to derive policy effects and
identify equilibria. Another reason is empirical: the absence of detailed empirical information on
policy impacts on various agents. A major contribution to empirical agricultural and food policy
analysis in recent years is the World Bank project on “Distortions to Agricultural Incentives”,
1 The distribution of rents or taxes among various agents within the producer and consumer groups depends on various
factors such as concentration at various stages of the chain, supply and demand elasticities, etc. For instance, it is well
known that land owners often capture part of the subsidies to farmers and that this capture depends on the nature of
the subsidies, the supply elasticity of land and market imperfections (e.g.Ciaian and Swinnen 2006; 2009; Goodwin
et al. 2011; Latruffe and Le Mouël 2009).

3
coordinated by Kym Anderson. The project resulted in a major new dataset on measures of the
effects of agricultural and food policies, and a growing number of studies using and explaining
food policy distortions (e.g. Anderson et al. 2008a; 2008b; 2013; Anderson 2009; Anderson and
Nelgen 2013; Olper and Swinnen 2013; Olper et al. 2014). The project has made a major
contribution to empirical analysis by vastly extending the coverage of policy indicators over time
and across different countries (regions).
However, as most other projects before, the indicators produced by the project are
indicators which measure how much “producers” and “consumers” are taxed or subsidized through
various policies. The most important indicators are the nominal rate of assistance to agriculture
(NRA), the real rate of assistance to agriculture (RRA) and the consumer tax equivalent (CTE).
In these indicators “producers” and “consumers” are a combination of different agents (interest
groups). Therefore one needs to interpret the numbers carefully (both from an economic and
political economy perspective) to reach the correct interpretation of the impacts.
To illustrate this, consider the NRA for a product such as sugar. The NRA is measured as
the ratio between the domestic price of sugar and the world market price, plus any additional taxes
and/or subsidies. The NRA for sugar is thus interpreted as how much subsidies “producers” get.
Inversely, it is interpreted as how much “consumers” get taxed or subsidized (the CTE is the
negative NRA plus any additional direct consumer taxes or subsidies). But who are these
“consumers” and “producers”? Since the NRA is measured at the level of sugar, i.e. the processed
product, the “producers” include both sugar processing companies and the farmers producing sugar
cane or sugar beet. Other agents, such as land owners and agribusinesses supplying inputs to the
farmers, may also be affected by the government policies and the impacts on them are also captured

4
in the NRA. This means that it is not clear from the NRA indicator how policies affect specific
groups, such as farmers.
The same issue also applies to the “consumer” side. Some sugar is “consumed” directly by
households, but most is sold to the food industry, which uses the sugar in various products sold to
retailers and only then households consume the sugar.2 Hence, the impact on all these groups are
part of the NRA/CTE effects, but the NRA/CTE indicator does not provide specific information
about each group’s welfare captures impacts.
In this paper we will try to disentangle some of these distortions/rents among interest
groups within the “consumer” and “producer” groups. We explicitly consider the impact on several
groups along the value chain. To do so, we first develop a disaggregated NRA indicator to measure
these different distortions/rents along the value chain. We then apply this approach to the wheat-
flour chain in Pakistan.3 The wheat-flour value chain in Pakistan is an interesting case since (a)
wheat is a very important staple food in Pakistan4; (b) Pakistan is a country with significant poverty
and food insecurity; (c) the government intervenes heavily at various stages of the wheat-flour
chain, and (d) these interventions have been criticized for being distortionary and ineffective
(Dorosh and Salam 2007; 2008; 2009; Prikhodko and Zrilyi, 2013; World Bank, 2010). We
2 For example, in early 2015 the EU’s beverage and confection industries and sweetener companies lined up to
lobby the EU decision-makers against the extension of the EU sugar quota. These mostly large food companies are
included under the “consumer” heading in the indicators. On the other side of the lobbying campaign are farmers
and sugar companies – both captured by the “producer” indicator.
3 Our approach is related to the analysis of Ivanova et al. (1995) and Swinnen (1998) of rents in the wheat-flour
chain in Bulgaria.
4 Wheat is the most important agricultural crop and staple food in Pakistan, grown by 80 % of farmers (USDA, 2014).
Wheat flour consumption per capita in Pakistan is one of the highest in the world, accounting for about 37 % of daily
caloric consumption (Prikhodko and Zrilyi, 2013). Hence, both farmer income and food security are to a large extent
associated with wheat production and consumption, in particular among the many poor. An estimated 17 to 38 % of
the population is classified as poor and 56 % is considered vulnerable, i.e. being poor or likely to become poor after a
shock (World Bank 2010).

5
calculate the welfare implications for various agents in the chain for the years 2000 – 2013, a
period characterized by major price volatility in global wheat and flour markets and by regular
adjustments of domestic policies.
2. A Value Chain Approach to Measuring Distortions and Policy Rents
The NRA measures the extent of distortions to producer and consumer price incentives generated
by direct and indirect government intervention at the border and in domestic markets. We extend
the methodology of Anderson (2009) and Anderson et al. (2008a, 2008b) to measure the welfare
effects for different agents along the value chain. Government policies can affect the welfare of
agent i in the value chain by changing input prices and/or output prices and/or by providing direct
subsidies or taxes. The NRA to agent i in a vertical chain is calculated as follows:5
𝑁𝑅𝐴𝑖 =(𝑝𝑜
𝑖 − 𝑝𝑜𝑖∗) ∗ 𝑄𝑜
𝑖 + ∑ (𝑝𝑗𝑖∗− 𝑝𝑗
𝑖)𝑗 ∗ 𝑄𝑗𝑖
𝑝𝑜𝑖∗ ∗ 𝑄𝑜
𝑖 (1)
where 𝑝𝑜𝑖 is the actual domestic price of output o, 𝑝𝑜
𝑖∗ is the ‘undistorted’ domestic output price,
i.e. the price without government intervention, 𝑄𝑜𝑖 is the quantity of output sold, 𝑝𝑗
𝑖 is the actual
domestic price of input j, 𝑝𝑗𝑖∗ is the ‘undistorted’ domestic price of input j and 𝑄𝑗
𝑖 is the quantity of
input j used to produce output o.
5 This formula does not include direct subsidies/taxes since these are not relevant for our empirical case. Including
these, the general formula would be 𝑁𝑅𝐴𝑖 =(𝑝𝑜
𝑖 − 𝑝𝑜𝑖∗) ∗ 𝑄𝑜
𝑖 + ∑ (𝑝𝑗𝑖∗− 𝑝𝑗
𝑖)𝑗 ∗ 𝑄𝑗𝑖 + 𝑧𝑖
𝑝𝑜𝑖∗ ∗ 𝑄𝑜
𝑖 where 𝑧𝑖 represents net direct
subsidies to agent i.

6
The NRA to agent i can therefore be rewritten as:
𝑁𝑅𝐴𝑖 =𝑝𝑜
𝑖 – 𝑝𝑜𝑖∗
𝑝𝑜𝑖∗ +
∑ (𝑝𝑗𝑖∗− 𝑝𝑗
𝑖) ∗ 𝑄𝑗𝑖 𝑄𝑜
𝑖⁄𝑗
𝑝𝑜𝑖∗ (2)
= 𝑁𝑅𝐴𝑂𝑖 + 𝑁𝑅𝐴𝐼
𝑖
where 𝑄𝐼𝑗𝑖 /𝑄𝑜
𝑖 represents the conversion rate from input j to output o. The NRA to output, 𝑁𝑅𝐴𝑜𝑖 ,
measures the extent of distortions to output prices expressed as a percentage of the undistorted
domestic output price. The NRA to input, 𝑁𝑅𝐴𝐼𝑖 , measures the total extent of distortions to input
prices for all inputs j used to produce output o, expressed as a percentage of the undistorted output
price. The total 𝑁𝑅𝐴𝑖 to agent i is the sum of both.
We now apply this approach to the wheat-flour value chain in Pakistan. Before doing the
calculations we give a brief review of the policies causing distortions and rent distribution in
Pakistan’s wheat-flour chain.6
3. Government Policies and the Wheat (Flour) Value Chain in Pakistan
Figure 1 shows international and Pakistan wheat prices for the period 1994-2013. The correlation
coefficient is 77 %, but Pakistan’s wheat prices were less volatile than international wheat prices.
This reduced volatility was the result of government interventions.
The Wheat Price Stabilization Scheme
Since the 1960s, the wheat and flour markets have been heavily regulated by the
government through the Wheat Price Stabilization Scheme, which entails both domestic market
6 For more details see Dorosh and Salam (2007; 2008); International Finance Corporation (2011); Lohano, Smith, and
Stockbridge (1998); Prikhodko and Zrilyi (2013), Ahmad, Qayyum, and Iqbal (2005), USAID (2009) and Zahid et al.
(2007).

7
interventions and trade policies.7 The government procures wheat from farmers at the support or
procurement price and sells procured wheat to flour millers at the release or issue price.
Government wheat procurement at the support price is intended to increase wheat production and
support farmer incomes in post-harvest price depressions. Increasing domestic wheat production
has also been seen as a means of improving overall national food security by limiting the reliance
on wheat (flour) imports. The distribution of wheat to flour mills at the subsidized release price,
in combination with the formulation of ceiling prices for ex-mill wheat flour, are intended to ensure
the availability of wheat flour at affordable prices to urban areas and to maintain price stability.
In the past, Pakistan was a wheat-deficit country with domestic production typically
accounting for about 90 % of availability. The government controlled wheat trade through the
Trading Corporation of Pakistan and did not allow private sector wheat imports until 2000
(Prikhodko and Zrilyi, 2013). Imports of wheat were used to supplement domestic production with
the aim of stabilizing domestic supply and prices.8
The main buyers of wheat are the government and private sector wheat traders. Provincial
Food Departments purchase wheat from farmers at the support price to support farmer incomes. 9
To ensure that Food Departments meet their targets, a ban may be placed on inter-provincial wheat
7 Wheat in Pakistan is mainly produced in the Punjab and Sindh province: in the period FY1992 – FY2012 (fiscal
years) Punjab accounted for 76 % and Sindh for 14 % of national wheat production. The remaining 10 % is produced
in Khyber Pakhtunkhwa and Balochistan. Wheat is grown primarily by small (0.5 to 5 ha) and medium-sized (5 to 10
ha) farmers. On average, about 40 % of production is retained at the farm for seed, in-kind labour payments and
household food consumption. As a result, about 60 % of wheat production enters the market (Dorosh and Salam, 2008;
International Finance Corporation 2011; Prikhodko and Zrilyi, 2013).
8 PASSCO is a federal institute responsible for nation-wide procurement and distribution of wheat and is specifically
in charge of supplying wheat to deficit zones (i.e. Balochistan and Khyber Pakhtunkhwa) and to the military forces.
Since the 2000s, the government has been procuring on average about 40 % of the marketable surplus, or 23 % of
national production (see Figure A1, Appendix 4).
9 The wheat crop marketing year runs from May to April the following year. Most wheat in Pakistan is harvested in
March and April and sowing takes place in September-December.

8
trade and the private sector is not allowed to engage in large-scale wheat purchases and storage
until government procurement has ended.10
Procured wheat supplemented with public wheat imports is sold to flour mills at below-
market rates, i.e. the release price. Large (urban) mills tend to supplement government wheat by
wheat purchases on the open market. The price of flour processed from subsidized wheat is also
regulated by the government through ceiling prices to lower consumer prices. However, Dorosh
and Salam (2008:76) argue that: “[a]lthough there may be a stipulated sales price of flour, there is
no effective enforcement mechanism. Since wheat flour produced from government wheat is not
distinguishable from wheat flour produced from market wheat, their prices are the same.”.11 Flour
mills that receive subsidized wheat from the government can therefore enjoy large rents from sales
of subsidized wheat flour at market prices. Lohano, Smith, and Stockbridge (1998) and Ahmad,
Qayyum, and Iqbal (2005) argue that this policy offers considerable opportunities for rent-seeking
and has resulted in a considerable excess capacity in the flour milling industry.12
10 Exceptions are made for flour mills – the major processors of wheat – and local traders, known as Aarthis and
Beoparis. Beoparis are village traders that are in direct contact with farmers and are responsible for wheat purchases
at the farmgate. Aarthis are commission agents that deal in large quantities of wheat and contract Beoparis to
assemble these quantities. Wheat purchased at the farm by Beoparis is packed and delivered to the Aarthis, who sell
the assembled quantities on the wholesale market to flour millers or stockists. Most small and medium-sized farmers
sell their produce to wheat traders; self-marketing is only a marginal phenomenon.
11 See also IFC (2011) and Prikhodko and Zrilyi (2013).
12 In a reaction to the food crisis the government also sells wheat flour at subsidized prices 10 to 20 % lower than
market prices to consumers through the Utility Stores Corporation system (USC) but in reality the impact of this
program seems marginal (World Bank 2010 and Khan and Akhtar Ali Shah 2011). The geographical coverage is
limited, there is no targeting and the amount allowed per family is only 5 kg/month compared to an average per capita
wheat consumption of around 10.5 kg per person per month .12 FAO et al. (2008) also indicate that Utility Stores face
problems of queues, long waiting hours and unreliable supply.

9
Policies and Trade in the 2000s
Trade policies shifted back and forth in the 2000s. After a bumper harvest in 2000 (see Figure A1,
Appendix 4) the government started to subsidize public and private exports of wheat.13 As a result,
Pakistan became a net wheat exporter in the early 2000s.14 However, in 2003 the government
imposed an export ban on wheat and wheat flour (although informal wheat (flour) exports
continued) (Persaud, 2013). In October 2005 the government liberalized private sector imports and
removed the tariff on wheat imports (Dorosh and Salam, 2008). In April 2007 the government
lifted the export ban on wheat (flour) that had been in place since 2003, but was not well enforced,
and permitted 500 thousand tonnes of private sector wheat exports (Dorosh, 2008; Persaud, 2010).
However, as international wheat prices surged, the government reinstated the export ban
for wheat and wheat flour a month later (in May 2007) and started importing large quantities of
wheat.15 Despite this intervention and a 2007 record harvest, domestic wheat prices rose about 71
%. Yet, Figure 1 shows that the domestic price rise was not nearly as great as the surge in
international prices in 2007/08. The gap between state controlled prices in Pakistan and
international wheat prices created incentives for the private sector to informally export wheat
(flour) to Afghanistan. It is estimated that about 1.5 to 2 million tonnes of wheat flour were illegally
13 Afghanistan is the main destination of wheat flour exports from Pakistan. In the period 2003-2013 over 90 % of
Pakistan wheat flour exports flowed to Afghanistan (UN Comtrade database 2014).13 Pakistan is also the dominant
supplier of wheat to Afghanistan, covering on average 65 % of Afghanistan’s import requirements (USDA, 2012a).
14 When referring to net imports and exports, we take into account both wheat and wheat flour trade. Wheat flour
imports and exports are converted to wheat equivalents using an extraction factor of 0.77. This rate is calculated by
taking a simple average of the extraction rate of Atta (82 %) and Maida (72 %) flour (Tayyab, 2013; USDA, 2012b).
Wheat flour imports mostly involve humanitarian aid and food aid (Prikhodko, 2013).
15 The reintroduction of the export ban in May 2007 did not apply to exports to Afghanistan. In early 2008, however,
the government extended the export ban to Afghanistan (Persaud, 2010).
10
exported to Afghanistan during the food price shock in spite of the official export ban, pushing up
domestic prices (USDA, 2014b; World Bank, 2010).
Another possible explanation for rising domestic prices is widespread hoarding behaviour
of grain, as the private sector expected the government to increase the wheat support price (Tayyab,
2013; World Bank, 2010). In fact, the support price did increase by 62 % between July 2007 and
July 2009.16
Pakistan was hit by severe floods in 2010 and 2011, but in both years the floods had little
impact on wheat production as the wheat crop was already harvested (USDA, 2011). In fact, the
2010 harvest was only 3 % lower than the record harvest of 2009 and the 2011 harvest reached a
record level of 25 million tons.
Despite international wheat prices rising again in mid-2010, the wheat (flour) export ban
was lifted in December 2010 and exports reached a record level in 2010/11 at 1.7 million tonnes
of wheat and 1.2 million tonnes of wheat flour. In the next two years, wheat and particularly flour
exports remained large. As a result, Pakistan again became a net wheat (flour) exporter in these
years.
Summary
Extensive government interventions in wheat markets and trade caused domestic markets and
prices to diverge from international markets and prices, but the extent (and even the nature) of the
price difference varied significantly over the two decades.17 In fact, in recent years Pakistani prices
16 In 2008/09, the government imported even larger quantities of wheat (3.1 million tons) to offset a disappointing
2008 harvest and high support prices resulted in a bountiful 2009 wheat harvest. Nevertheless, domestic prices further
increased as net domestic wheat availability declined due to massive government procurement and modest releases.
17 Table A1 in Appendix 4 provides a summary of wheat policies and markets in Pakistan in the past decades.
11
and international wheat prices were relatively close, and the volatility of domestic prices through
the past decade was much lower than world market prices. Pieters and Swinnen (2014) conclude
that Pakistan’s wheat policies have performed “relatively well” compared to other countries if one
takes into account price stability as an explicit government objective. Of course, such policy
interventions may still have important redistribution effects. In the next section we use the value
chain NRA disaggregation to measure who benefitted from these interventions.
4. NRAs along the Value Chain
Using the general formula (2), we calculate the NRA at the level of (a) wheat farmers, (b) wheat
traders, (c) wheat flour millers, and (d) wheat flour consumers.
The NRA to the wheat sector captures the cumulative rate of assistance to farmers (𝑁𝑅𝐴𝑓)
and wheat traders (𝑁𝑅𝐴𝑡), or the nominal rate of assistance to wheat 𝑁𝑅𝐴𝑤.
𝑁𝑅𝐴𝑤 = 𝑁𝑅𝐴𝑓 + 𝑁𝑅𝐴𝑡 (3)
where
𝑁𝑅𝐴𝑓 = 𝑁𝑅𝐴𝑂𝑓
+ 𝑁𝑅𝐴𝐼𝑓 (4)
𝑁𝑅𝐴𝑡 = 𝑁𝑅𝐴𝑂𝑡 + 𝑁𝑅𝐴𝐼
𝑡 (5)
𝑁𝑅𝐴𝑂𝑓
=𝑝𝑜
𝑓 − 𝑝𝑜
𝑓∗
𝑝𝑜𝑓∗ (6)
𝑁𝑅𝐴𝐼𝑓
=∑ (𝑝𝑗
𝑓∗− 𝑝𝑗
𝑓) ∗ 𝑄𝑗
𝑓/𝑄𝑜
𝑓𝑗
𝑝𝑜𝑓∗ (7)
𝑁𝑅𝐴𝑂𝑡 =
𝑝𝑜𝑡 − 𝑝𝑜
𝑡∗
𝑝𝑜𝑡∗ (8)
12
𝑁𝑅𝐴𝐼𝑡 =
∑ (𝑝𝑗𝑡∗− 𝑝𝑗
𝑡) ∗ 𝑄𝑗𝑡/𝑄𝑜
𝑡𝑗
𝑝𝑜𝑡∗ (9)
This implies that
𝑁𝑅𝐴𝑤 =𝑝𝑜
𝑓 − 𝑝𝑜
𝑓∗
𝑝𝑜𝑓∗ +
∑ (𝑝𝑗𝑓∗
− 𝑝𝑗𝑓
) ∗ 𝑄𝑗𝑓
/𝑄𝑜𝑓
𝑗
𝑝𝑜𝑓∗ +
𝑝𝑜𝑡 − 𝑝𝑜
𝑡∗
𝑝𝑜𝑡∗ +
∑ (𝑝𝑗𝑡∗− 𝑝𝑗
𝑡) ∗ 𝑄𝑗𝑡/𝑄𝑜
𝑡𝑗
𝑝𝑜𝑡∗ (10)
For wheat traders, both input and output are wheat and hence 𝑄𝑜𝑡= 𝑄𝑗
𝑡. The formula to calculate
wheat trader input 𝑁𝑅𝐴𝐼𝑡 then becomes:
𝑁𝑅𝐴𝐼𝑡 =
(𝑝𝐼𝑡∗− 𝑝𝐼
𝑡)
𝑝𝑜𝑡∗ (11)
Given that the output price received by farmers equals the input price paid by wheat traders, or
𝑝𝑜𝑓
= 𝑝𝐼𝑡 and 𝑝𝑜
𝑓∗= 𝑝𝐼
𝑡∗, equation (12) can be written as:
𝑁𝑅𝐴𝑤 =𝑝𝑜
𝑓 − 𝑝𝑜
𝑓∗
𝑝𝑜𝑓∗ +
∑ (𝑝𝑗𝑓∗
− 𝑝𝑗𝑓
) ∗ 𝑄𝑗𝑓
/𝑄𝑜𝑓
𝑗
𝑝𝑜𝑓∗ +
𝑝𝑜𝑡 − 𝑝𝑜
𝑡∗
𝑝𝑜𝑡∗ +
𝑝𝑜𝑓∗
− 𝑝𝑜𝑓
𝑝𝑜𝑡∗ (12)
NRA to wheat farmer input (𝑁𝑅𝐴𝐼𝑓)
The second term in equation (12) captures the NRA to farm input 𝑁𝑅𝐴𝐼𝑓. Earlier World Bank
estimates (Anderson and Nelgen, 2013) assumed that the NRA to farm input for wheat was zero
from 2006 to 2010 (see Table A2, Appendix 4). However, the implicit subsidy to urea and DAP
was likely non-trivial after 2005, in particular during the international food price shock.18 We
18 According to a recent IFPRI policy report (Salam, 2012: 9-10): “… the cost of domestically produced urea has
been less than the imported price due to the subsidized gas supply to the fertilizer industry. Since both imported and
local fertilizers are sold at the same rate, the government has to subsidize the imported urea, the import of which has
recently been confined in the public sector to the Trading Corporation of Pakistan. […] Accordingly, there has been
an implicit element of subsidy in the sales price and use of these fertilizers [urea and DAP] throughout the reference
period.” Moreover, a report by the World Bank (2010:129) similarly states that in the 2007/08 fiscal year “
[f]ertilizer subsidies (mainly on di-ammonium phosphate or DAP) also became an increasingly large fiscal burden
because of increased world market prices”. The use of urea and DAP accounted for about 93 % of total fertilizer cost

13
account for this implicit subsidy by calculating the NRA to urea and DAP fertilizer for 2000-2013
and adding it to the NRA to farmer output.19 Our calculated NRA to fertilizer approaches the
World Bank estimates of the NRA to farm input reasonably well for the years in which the World
Bank estimates are non-zero.20
NRA to wheat trader output (𝑁𝑅𝐴𝑂𝑡 )
The third term in equation (12) captures the NRA to wheat trader output 𝑁𝑅𝐴𝑂𝑡 . The government
procures on average about 40 % of marketed wheat nation-wide and may supplement procured
wheat with public wheat imports. The government sells wheat to flour millers at the release price,
which is on average lower than the wholesale price of wheat (see Figure A3, Appendix 4). We use
the price of wheat at the Lahore wholesale market as an indicator for 𝑝𝑜𝑡 .
For the undistorted wholesale price of wheat 𝑝𝑜𝑡∗ one should use the border price measured
at the Lahore wholesale market. Dorosh and Salam (2007) argue that in many years domestic
wheat prices in Pakistan would likely lie between import and export parity prices in the absence
of government interventions. Hence, the conventional approach of using import (export) parity
prices as border prices for wheat will understate (overstate) the nominal rate of assistance in certain
years. They use estimated autarky (no trade) prices as the border price when the autarky price is
below import parity. We follow the methodology of Dorosh and Salam (2007), except that import
and 22 % of total farmer production costs per acre in the last two wheat crop years (author’s calculations based on
API data).
19 Although the NRA to fertilizer does not take into account government assistance to other important inputs such as
water, Dorosh and Salam (2007) argue that it captures the major distortion to non-factor agricultural input prices in
Pakistan. Details on the calculation of the NRA to farmer input are provided in Appendix 1.
20 For 2000-2005, the average difference is equal to 0.2 percentage points, or about 7.5 % of the World Bank
average NRA to farm input for 2000-2005.
14
and export parity prices were calculated using Lahore as the reference market rather than
Karachi.21 We also follow their methodology in calculating autarky prices based on the Dorosh-
Salam dataset (extended with more recently collected data).22
NRA to wheat farmer output (𝑁𝑅𝐴𝑂𝑓
) and wheat trader input (𝑁𝑅𝐴𝐼𝑡)
We use the border price for wheat measured at the farmgate in Lahore as an indicator of the
undistorted farmgate price for wheat 𝑝𝑜𝑓∗
. Import parity, export parity and autarky prices measured
at the farmgate are equal to the import parity, export parity and autarky price measured at the
Lahore wholesale market minus marketing costs from the farmgate to the Lahore wholesale
market. Wheat trader input distortions, 𝑁𝑅𝐴𝐼𝑡 , are the counterpart of wheat farmer output
distortions.
The price that traders pay to farmers – the farmgate price – is the measure for 𝑝𝑜𝑓 ( = 𝑝𝐼
𝑡 ).
However, data on farmgate prices are not available for Pakistan. We have therefore calculated an
indicator for farmgate prices under two assumptions. In the first approach, we assume that wheat
traders pay farmers the support price set by the government. Kurosaki (1996, cited in Ahmad et
al., 2005) for example concludes, after examining the spatial and intertemporal price relations of
grains in the Punjab province, that in the case of wheat the farmgate price is explained mostly by
the support price. Another interpretation of this assumption is that the support price is the price
received by farmers when selling wheat to the government during the procurement season. Note
21 The import parity price for wheat measured at the wholesale market in Lahore equals the C&F Karachi price plus
import costs and marketing costs from Karachi to the wholesale market in Lahore. The export parity price for wheat
at the wholesale market in Lahore equals the FOB Karachi price minus export costs and marketing costs from
Lahore to Karachi. The calculation of border prices for wheat is described in more detail in Appendix 2.
22 Table A3 in Appendix 4 shows the border price (import parity, export parity or autarky price) used for each year
(for all agents in the value chain).

15
that in this case fluctuations of the wholesale price of wheat are passed on entirely to wheat traders
and do not affect farmers.
In the second approach we assume that wheat traders pay farmers the wholesale price of
wheat at Lahore minus marketing costs from the farmgate to the wholesale market in Lahore. In
this case, the trader marketing margin is assumed to be fixed and fluctuations of the wholesale
wheat price are passed on entirely to farmers.23
Figure 2 shows that the real wholesale price (minus marketing costs) fluctuates according
to the wheat season: wholesale prices generally fall in the months following the wheat harvest and
increase towards the winter. In most of the 1990s, 2004-2006 and 2008, the wholesale price minus
marketing costs exceeded the support price throughout the year, including in the months following
the harvest. Hence, in these years farmers would be better off receiving the wholesale price minus
marketing costs throughout the year, as they would be capturing the rents of higher wholesale
prices. In other years, the wholesale price minus marketing costs falls below the support price
during post-harvest months. Hence, in these years farmers would be better off receiving the support
price in post-harvest months.
NRA to flour mills
When calculating the NRA to flour mills (𝑁𝑅𝐴𝑚), we assume that wheat grain is their only input24:
𝑁𝑅𝐴𝑚 =𝑝𝑜
𝑚−𝑝𝑜𝑚∗
𝑝𝑜𝑚∗ +
(𝑝𝐼𝑚∗−𝑝𝐼
𝑚)∗𝑄𝐼𝑚/𝑄𝑜
𝑚
𝑝𝑜𝑚∗ (13)
23 Data used for the calculation of the NRA to wheat farmers and wheat traders are presented in Tables A3 and A4 in
Appendix 4.
24 Wheat purchases account for approximately 90 % of production costs of flour milling (Prikhodko and Rybchynsky
(2009) and author’s calculations based on data from International Finance Corporation (2011)). We therefore abstract
from possible government assistance to other inputs such as electricity, fuel or water.

16
= 𝑁𝑅𝐴𝑂𝑚 + 𝑁𝑅𝐴𝐼
𝑚
where 𝑝𝑜𝑚 is the price of wheat flour received by flour millers, 𝑝𝑜
𝑚∗ is the undistorted price of
wheat flour received by flour millers, 𝑝𝐼𝑚 is the price of wheat paid to traders (or the government)
and 𝑝𝐼𝑚∗ is the undistorted price of wheat paid to traders. 𝑄𝑜
𝑚 is the quantity of wheat flour sold
and 𝑄𝐼𝑚 the quantity of wheat purchased by flour millers. Hence, 𝑄𝐼
𝑚/𝑄𝑜𝑚 is the conversion rate of
wheat to wheat flour.
NRA to miller input (𝑁𝑅𝐴𝐼𝑚)
We use the border price for wheat at the wholesale market in Lahore as an indicator for the
undistorted wholesale wheat price 𝑝𝐼𝑚∗ and a weighted average of the release price and the price
of wheat on the wholesale market in Lahore as an indicator for 𝑝𝐼𝑚. The weights are equal to the
annual share of government releases and marketed wheat in the total domestic wheat supply
(marketed wheat produce plus net government injections). We set the extraction rate of wheat flour
milling (𝑄𝐼𝑚/𝑄𝑜
𝑚) to 82 %.25
The indicator for the undistorted price of wheat flour 𝑝𝑜𝑚∗ is the border price for wheat
flour. Appendix 3 describes the methodology used to calculate import and export parity prices and
autarky prices for wheat flour, using Lahore as the reference market. For the import parity price,
two sets of prices are calculated. The first assumes that Pakistan would import wheat flour from
Kazakhstan, while the second assumes that Pakistan would import wheat flour from the EU or
Black Sea region.
25 This is the extraction rate for Atta flour (82 %). Throughout the analysis we use domestic prices for Atta flour,
which is the main type of flour consumed in Pakistan (USDA 2012b).
17
Kazakhstan is one of the largest exporters of wheat flour globally and the main supplier of
wheat flour in Central and South Asia. For instance, Kazakhstan is the major competitor of
Pakistan in the Afghan wheat flour market, generally supplying 20 % of Afghan wheat flour
imports mostly to the north of Afghanistan. If Kazakh wheat flour exports reach Afghanistan, we
assume that they could reach Pakistan as well if Pakistan would start importing wheat flour
commercially. As Kazakhstan is also one of the most competitive wheat flour producers, the first
set of border prices assumes that Pakistan would import wheat flour from Kazakhstan.
However, wheat flour exports from Kazakhstan to Pakistan would be transported over land
across a far distance, substantially increasing the calculated cost of wheat flour imports from
Kazakhstan. In the past, humanitarian and food aid in the form of wheat flour imports into Pakistan
came mostly from the European Union and Black Sea region. A calculation of the price of wheat
flour imports from this area showed that Pakistan could in fact import wheat flour at a lower cost
from the EU and Black Sea region compared to Kazakhstan, due to the large differences in ocean
freight costs and land freight costs.26 For this reason, we have calculated an alternative set of
border prices which assumes that Pakistan would import wheat flour from the European Union
and Black Sea region, rather than from Kazakhstan.
Here we only report results for the NRA to flour millers and flour consumers using
EU/Black Sea import parity prices, as we have deemed this scenario the most plausible. In any
case, the choice of import parity prices is only relevant in years where the border price is the import
26 The cost of wheat flour imports was calculated as the international wheat flour reference price (see Appendix 3)
plus average transportation costs from the Kazakh border to Lahore for the first set of prices, and plus average
transportation costs from the European Union-Black Sea region to Lahore for the second set of border prices.

18
parity price; for export parity and autarky prices only one set of prices is used in the calculations
(see Appendix 3 for more details and alternative assumptions).
NRA to miller output (𝑁𝑅𝐴𝑂𝑚)
The government of Pakistan directly intervenes in the wholesale market for wheat flour by setting
ceiling prices for sales of flour milled from government wheat. However, as was discussed in
section 3.1, flour milled from government wheat cannot be distinguished from flour milled from
open market wheat. As a result these ceiling prices are not enforced (Dorosh and Salam, 2008).
We therefore assume that all wheat flour is sold at the market price and use the wholesale price of
wheat flour in Lahore as an indicator for 𝑝𝑜𝑚.27
NRA to flour consumers (𝑁𝑅𝐴𝑐)
The NRA to wheat flour consumers is calculated as follows28:
𝑁𝑅𝐴𝑐 =(𝑝𝐼
𝑐∗−𝑝𝐼𝑐)
𝑝𝐼𝑐∗ (14)
27Monthly data for the wholesale price of wheat flour was only available from FY2009 onwards. We have therefore
used annual wholesale prices of wheat flour for the period FY2001-FY2008.
28 The consumer tax equivalent (CTE) of Anderson et al. (2008a) captures the effect of distortions on price incentives
of final consumers expressed as a percentage of the undistorted consumer price. The CTE can be calculated as follows:
𝐶𝑇𝐸 =(𝑝𝐼 − 𝑝𝐼
∗) ∗ 𝑄𝐼
𝑝𝐼∗ ∗ 𝑄𝐼
where input I represents the commodity purchased for consumption, 𝑝𝐼 is the actual domestic consumer price, 𝑝𝐼∗ is
the undistorted domestic consumer price and 𝑄𝐼 equals the quantity consumed. The NRA for the final consumer relates
as follows to the consumer tax equivalent (CTE) of Anderson et al. (2008a):
𝐶𝑇𝐸 = − 𝑁𝑅𝐴𝑐 = − 𝑁𝑅𝐴𝐼𝑐
for i = c for the final consumer for whom 𝑄𝑜𝑐 = 0 and thus 𝑁𝑅𝐴𝑂 = 0.

19
where 𝑝𝐼 is the domestic price of wheat flour paid by consumers and 𝑝𝐼∗ is the undistorted wheat
flour price paid by consumers. We use the border price of wheat flour at the retail market in Lahore
as an indicator for 𝑝𝐼∗. This border price should be calculated by adding marketing costs of retailers
to the border price of flour measured at the wholesale market. As information on retailer marketing
costs was lacking, we have estimated an upper and lower boundary of the actual border price at
the retail market. The upper boundary border price is calculated under the assumption that retailer
marketing costs are equal to the price margin between the wholesale price and retail price of wheat
flour, i.e. that retailer marketing margins are zero. The lower boundary border price is calculated
under the assumption that retailer marketing costs are zero, i.e. that retailer marketing margins are
equal to the price margin. The actual border price measured at the retail market will lie in between
these boundaries, and the actual NRA to flour consumers will probably be in between the resulting
upper boundary and lower boundary NRA.29
The government directly intervenes in the retail market for wheat flour through the Utility
Stores Corporation, which sells wheat flour at subsidized prices to consumers. However, the
effectiveness of the Utility Stores system is not clear. Moreover, data series on subsidized prices
or the share of wheat flour sold through Utility Stores were not available. We therefore use the
price of wheat flour at the retail market in Lahore as an indicator for the domestic price 𝑝𝐼 .
However, our disregarding of the consumer subsidy provided by the Utility Stores will lead us to
overestimate consumer taxation or underestimate consumer subsidization. A quick, back-of-the-
29 Data used for the calculation of the NRA to flour millers and flour consumers are presented in Tables A5 and A6
in Appendix 4.

20
envelope calculation suggests that the additional NRA to consumers from the Utility Store sales
in recent years may be around 3 to 8 %.
5. Results
The results are summarized in Figures 3 to 7 and Table 1. Table 1 presents the average NRA for
different agents along the value chain across 2000 – 2013 and for 3 sub-periods: 2000-2004, 2005-
2008 and 2009-2013.
5.1.“Producers”: Wheat farmers and wheat traders
Figure 3 and Table 1 present the NRA to “producers”, i.e. the NRA to the wheat sector, which
equals the sum of the NRAs to wheat farmers and wheat traders. The NRA to wheat farmers and
wheat traders are given for both farmgate price indicators (support price and wholesale price minus
trader marketing costs). Figure 4 presents the NRA to wheat farmers and wheat traders for
alternative farmgate price indicators. Figure 5 shows the NRA to wheat traders disaggregated into
the total NRA and the NRA to trader input and output.
The average NRA to the wheat sector for 2000-2013 equals - 9 %, indicating that the wheat
sector as a whole is on average taxed. In fact, throughout the period the NRA to wheat is positive
only in 2005/06 and in 2010/11 at 18 % and 11 %. Wheat sector taxation was - 20 % in the sub-
period 2000-2004. The NRA reaches a minimum in 2007/08 at - 25 % during the international
food price shock, when the wheat sector as a whole is taxed most heavily. In more recent years,
taxation has fallen significantly: in the sub-period 2009-2013 it is at its lowest level at - 2 %. In
2011/12 and 2012/13 the NRA is close to zero.

21
Wheat traders
The distribution of the NRA between wheat traders and farmers depends strongly on the
assumption on the best indicator of the farmgate price, i.e. to what extent the trader’s margin
changes with changing wholesale prices.
In the extreme case that the traders’ margin is fixed, i.e. traders pay farmers the wholesale
price minus marketing costs, there is very little policy impact on the traders. In other words,
fluctuations in wheat prices do not affect the NRA to traders. The difference between the domestic
input and output price for wheat traders is assumed equal to marketing costs from the farmgate to
Lahore, which is equal to the difference between the border price at the farmgate and at the
wholesale market. Hence, the NRAs to wheat trader input and output cancel each other out,
producing an NRA equal to zero.
However, if traders pay farmers the support price, they capture the rents created by
fluctuations of their sales price, i.e. the wheat price on the wholesale market. The NRA to traders
is then positive or zero throughout the period and slightly below zero in 2011/12 and 2012/13. In
this case, the net subsidy to wheat traders for the period 2000-2013 is 6 %, with subsidization being
highest in the sub-period 2005-2008 at 10 % and lowest in 2009-2013 at 4 %. The overall net
subsidization of wheat traders is a result of two opposing policy effects. Traders are generally
taxed on output by policies reducing their sales price, but benefit from policies lowering the price
they pay to farmers and the second effect is strongest.
Traders are taxed on their output side as the price they receive for wheat sales would be
higher in case the government would not intervene to adjust domestic supply. At the same time,
traders are subsidized on the input side as the support price they pay to farmers is lower than the

22
price they would pay in the absence of government interventions.30 Our calculations indicate that
the subsidy to inputs exceeds the tax on output, and the result is a net subsidization of wheat traders
for most of the 2000s.
Interestingly, if traders had to pay farmers the support price, this net subsidy effect would
have been the highest at the point when overall taxation of the wheat sector was strongest. In
2007/08, at the height of the international food price shock, the government responded to rising
prices by imposing an export ban and supplementing domestic production with large-scale imports
at below-market rates. The government thereby prevented domestic prices from rising to the same
extent as international prices. The result was a large gap between the export parity price and
domestic prices and a considerable taxation of wheat trader output. Even though domestic
wholesale prices did not follow international prices, they did increase, and the rents would have
been captured entirely by wheat traders as a subsidy on their inputs (when paying the support price
to farmers). This subsidy exceeded the tax on their output and resulted in a net subsidization of 13
% in 2007/08 and a period maximum of 17 % in 2008/09.
From 2009/10 onwards, the NRA to wheat traders moves close to zero as the gap between
domestic prices and border prices decreases. That is, traders are paying and receiving a price that
is very close to the hypothetical price in a no-distortions scenario. In 2009/10, domestic prices had
risen to high levels and were close to import parity. In late 2010, the export ban on wheat (flour)
was lifted and as domestic prices were below export parity, large wheat (flour) exports ensued. In
30 In 2005/06 and 2010/11 the general situation is reversed: traders are taxed on input and subsidized on output. For
2005/06, this is explained by the fact that the border price (autarky price) was lower than domestic wheat prices and
in fact close to export parity due to a bountiful harvest in 2005 (see Figure A4 in Appendix 4). For 2010/11, the
explanation is the switch from import parity in 2009/10 to export parity in 2010/11 and the fact that export parity was
below domestic prices until 2011.

23
the following years, liberalized wheat trade likely contributed to keeping domestic prices near
export parity. In 2011/12 and 2012/13, the NRA to wheat traders is slightly negative because the
subsidy to inputs falls close to zero.
Wheat farmers
Obviously, since wheat traders and wheat farmers effectively share the effects on the wheat sector
as a whole, the assumption on the farmgate price has the opposite implications for wheat farmers.
With fixed trader margins, the NRA to wheat farmers is equal to the NRA to “producers” (i.e. the
wheat sector as a whole), as the NRA to traders is zero. If trader margins fluctuate in response to
changing prices (i.e. farmers receive the support price) the impacts on the farmers will be more
negative than for the wheat sector, as the benefits of higher wholesale prices are captured by traders
instead of the farmers.
Our calculations indicate that wheat farmers were generally taxed by government policies
in 2000-2013, regardless of the indicator used for the farmgate price.31 When farmers receive the
wholesale price minus marketing costs and thus fully capture wholesale wheat price fluctuations,
the tax is on average 9 % for the whole period. When farmers effectively receive the support price
instead, the average tax increases to 15 % for 2000-2013.
The NRA to farmers fluctuates considerably across years. The extent of taxation is largest
in 2007/08, during the spike in international wheat prices, with the NRA between - 24 %
31 In 2005/06 and 2010/11 farmers were exceptionally subsidized. The explanation is analogous to the explanation
provided for trader NRAs in these years (cf. supra). For instance, the large positive NRA in 2010/11 is explained by
a switch of the border price from import to export parity in May 2010, and the fact that the export parity price was far
below domestic wheat prices until late 2010-early 2011 (see Figure A2 in Appendix 4).

24
(wholesale price indicator) and - 37 % (support price indicator).32 The large increase in the tax on
farmers during the food price shock was driven by the strong increase of the border price above
domestic wheat prices. As the government prevented domestic prices from rising by imposing a
ban on wheat (flour) exports and releasing large quantities of subsidized wheat on the market,
farmers were receiving a substantially lower price than what they would have received in a no-
distortions scenario.
In spite of the peak in farmer taxation during the food price spike, average farmer taxation
is highest in the sub-period before the food price crisis: the average NRA was - 20 % to - 25 % in
2000-2004, compared to - 7 to - 18 % in 2005-2008. Average farmer taxation was lowest in recent
years: in the sub-period 2009-2013 it was between - 2 % to - 6 %.
The shift from large farmer taxation in the 2000s to NRAs close to zero in 2012-2013 can
be explained by the same factors as the shift in the NRA to traders. As domestic support and
wholesale prices fluctuated around the export parity price, the NRA increased to close to zero. The
convergence of domestic and export parity prices of wheat can be explained by the fact that (1)
the export parity price had increased to a higher average level following the international price
rises in mid-2010 and mid-2012, approaching high domestic wheat flour prices; (2) the
government allowed private sector wheat (flour) exports in late 2010 and (3) Pakistan became a
net wheat exporter from 2010/11 onwards. The resulting market forces likely pushed domestic
prices towards export parity in 2011-2013.
32 In general, the tax on farmers is larger for the support price indicator, as the support price is on average lower than
the wholesale price minus marketing costs. However, in 2011/2012 and 2012/13 the NRAs are nearly equal in size for
both indicators. The support price was increased to such an extent since 2007/08 that the average gap between the two
farmgate price indicators has become small in recent years, reducing the difference between the corresponding NRAs
(see Figure A2 in Appendix 4).
25
Seasonality of wheat prices
So far we have ignored the seasonality of wheat prices. Although the support price is lower than
the wholesale price indicator on average, it is frequently higher in the months immediately
following the harvest (see Figure 2). Hence, in various years farmers are better off selling to the
government in the months following the harvest. According to Dorosh and Salam (2008), a large
part of total marketed wheat is sold by farmers within four months of the wheat harvest. To see
the impact of this on the results, one can look at the monthly NRA’s for the post-harvest months.
Even if one assumes that all wheat is sold in the post-harvest months (April-August), the average
tax on farmers over the period 2000-2013 is 10 % compared to 9% to 15% if one takes the annual
average.33 Hence the impact of the seasonality on the farm taxation is limited.
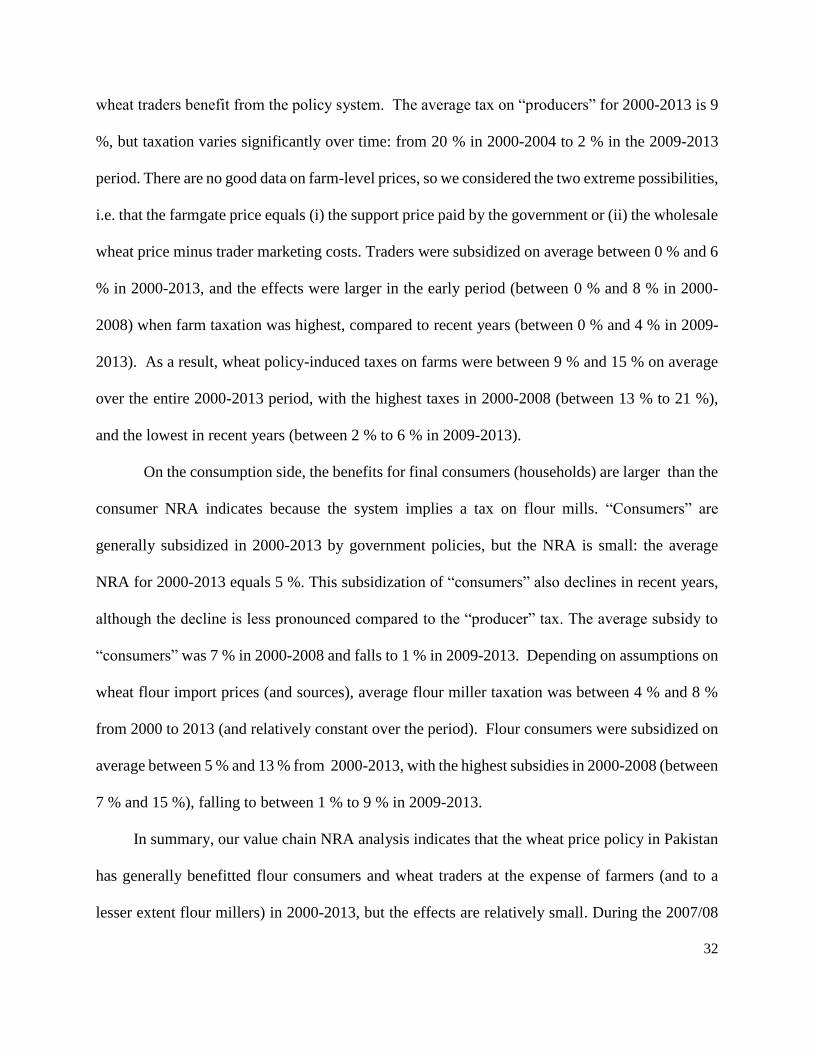
5.2. “Consumers”: Flour mills and flour consumers
Figure 3 and Table 1 show the NRA to “consumers” as a whole. The average NRA to “consumers”
is calculated as the sum of the NRA to flour mills and the average NRA to flour consumers (the
average of the NRAs for lower and upper bound border prices). Figure 6 and Table 1 present the
NRA to flour mills and flour consumers. The NRA to flour consumers is reported for both the
upper and lower bound border prices. Figure 7 shows the NRA to miller input (wheat) and output
(flour).
33 Only in 2010/11 are farmers subsidized when looking at post-harvest months. The average tax on farmers is the
same (NRA = -10%) for 2000-2013 regardless of the support price or wholesale price indicator used. This is because
the average support price indicator for post-harvest months in 2000-2013 is equal to the average post-harvest
wholesale price indicator (about 14 Rs/kg). In the sub-period 2000-2004, the average post-harvest support price is
slightly higher and consequently farmer taxation slightly lower compared to the wholesale price indicator, while in
the sub-period 2005-2008 the reverse holds: the average post-harvest support price is lower than the average post-
harvest wholesale price indicator (9.94 versus 10.42 Rs/kg). On average, these differences cancel each other out.
Detailed results are available on request.

26
The average NRA to “consumers” is 5 % for 2000-2013, indicating that consumers as a
whole are on average subsidized across the entire period. Average subsidization is highest in the
subperiods 2000-2004 and 2005-2008 at 7 %. However, in recent years subsidization of consumers
as a whole declines, with average subsidization lowest in 2009-2013 at 1 %.
The NRA to “consumers” can be broken down into the NRA to flour mills and the NRA to
companies and households that purchase wheat flour, i.e. flour consumers.
Flour mills
Regardless of the type of import parity price used (Kazakhstan or EU/Black Sea import parities),
flour mills are generally taxed by existing government policies in 2000-2013. However, the size
of taxation is limited: the average NRA over the period 2000-2013 is - 4 %. Taxation was highest
in the sub-period 2000-2004 at 9 %. In the sub-period 2005-2008 the average NRA becomes
slightly positive at 1 %. In recent years flour millers are again taxed: the average NRA falls back
to – 4 % in the sub-period 2009-2013. This overall taxation is driven by the fact that the tax on
flour output on average exceeds the subsidy on wheat input.
Flour mills are taxed on flour output throughout the period.34 This taxation is explained by
the fact that domestic wholesale flour prices are substantially lower than flour border prices (see
Figure A3, Appendix 4). On the input side, the NRA to flour millers is positive throughout the
period (except for 2005/06 and 2010/11). This subsidy to wheat input is driven by two prices: the
price of wheat on the wholesale market and the government release price.35 The wheat border price
34 Except in 2005/06, due to the fact that the autarky price dropped after a bountiful 2006 harvest and was lower than
the domestic wheat flour price (see Figure A5 in Appendix 4).
35 This subsidy is the counterpart of the taxation of wheat trader output.

27
is higher than both prices, and the millers get extra rents from the fact that the release price is lower
than the wheat price on the wholesale market.36
In some years, this ‘double’ subsidy to wheat input is sufficiently large so as to compensate
the tax on flour output, resulting in a net subsidization of flour millers. However, in most years the
gap between domestic flour prices and flour border prices (output) is larger than the gap between
domestic wheat prices and wheat border prices (input), resulting in a (limited) net taxation of flour
millers.
At the height of the food price crisis in 2007/08, the subsidy to wheat input peaked at 23
%, as the gap between export parity and domestic wheat prices increased sharply. Nevertheless,
flour millers were taxed in this year, as the increase of the flour export parity price over domestic
flour prices was even greater.
In recent years, the subsidy to wheat input has declined due to the convergence of domestic
wheat prices and the wheat export parity price. As flour millers continued to be taxed on flour
output, the net result was taxation. The extent of taxation was, however, lower compared to the
early 2000s, as the gap between domestic flour prices and flour border prices narrowed.
Flour consumers
Flour consumers (i.e. companies and households purchasing wheat flour) are generally
subsidized by existing policies. The average NRA to flour consumers over 2000-2013 is in the
order of 5 % to 13 %, depending on the assumptions about border prices. Subsidization is highest
36 The average spread between the release price and the wheat price on the wholesale market over the period 2000-
2013 is 1.13 Rupees per kilogram. At an average of 5.2 million tons of wheat released each year, flour mill savings
on wheat input in 2000-2013 amounted to an average of 6.3 billion Rupees per year. These cost savings in wheat
input are presumably captured by flour mills in the form of increased profits, since wheat is generally sold at the price
of flour on the wholesale market rather than the government stipulated sales price (cf. section 3).

28
in the sub-period 2000-2004 regardless of the border price, with an average NRA of 12 % to 21
%. In the following sub-periods, average subsidization is substantially lower with an average NRA
in the order of 1 to 9 %.
The subsidization of flour consumers is explained by the fact that retail flour prices are
generally below flour border prices. Domestic retail flour prices are kept below border prices
through government wheat releases and trade restrictions. At the height of the international food
price spike in 2007/08, the government reinforced these policies with large-scale public wheat
imports and an (incompletely enforced) export ban on wheat and flour to all markets. Domestic
retail flour prices were kept in check, resulting in a particularly large gap between domestic and
border prices and a substantial jump in the subsidy to flour consumers, which more than doubled
to 22 % - 27 % in 2007/08.
In recent years, the subsidy to flour consumers has declined: the NRA remains near or
below 10 % for both border prices. This decline is again explained by the convergence of domestic
retail flour prices and the flour export parity price.
As mentioned before, the subsidy to flour consumers through the Utility Stores is not
captured by the NRAs, but it is unlikely that this subsidy will change the main conclusions here.
5.3. Summary of welfare effects along the value chain
Wheat farmers
Regardless of the indicator for farmgate prices, we find that farmers are taxed by government
policies in nearly all years. The magnitude of taxation depends on assumptions about the farmgate
price. Assuming that the farmgate price equals the support price of wheat set by the government,
average farmer taxation in 2000-2013 is 15 %. Assuming that the farmgate price equals the
wholesale price of wheat minus trader marketing costs, farmer taxation is on average 9 %. During
29
the food price spike in 2007/08, the tax on wheat farmers increases strongly to the order of 24 %
to 37 %. Farmers were not able to profit from rising international wheat prices because domestic
wheat prices were kept low by a wheat (flour) export ban and large-scale government wheat
releases to the domestic market. However, in later years the gap between domestic prices and
international prices declined, with domestic wheat prices fluctuating around export parity after
2010. As a result, in recent years farmer taxation is substantially lower, with the NRA close to zero
in the last two years.
Wheat traders
Not surprisingly, the impact depends on the farmgate price indicator. If the farmgate price equals
the wholesale price of wheat minus trader marketing costs, the NRA to wheat traders is zero in all
periods, as the positive NRA to trader input cancels out the negative NRA to trader output.
If the farmgate price equals the support price, wheat traders are generally subsidized by
existing government policies: the average subsidy for 2000-2013 is 6 %. During the international
food price spike, subsidization increases as traders were able to capture much of the gains of higher
domestic prices. As a result, average trader subsidization is highest in the sub-period 2005-2008
at 10 %. This result indicates that the combination of wheat price spikes and the support price
policy are benefitting wheat traders, and not farmers, when traders pay farmers the support price.
In recent years, average subsidization of wheat traders declines. This result corresponds to the
decrease of wheat farmer taxation and is caused by the fact that domestic wheat prices fluctuated
around export parity since late 2010.

30
Flour millers
Flour millers are generally taxed by existing wheat policies, but the effect is relatively small.
Average taxation for the entire 2000-2013 period is 4 %, but the NRA varies across sub-periods,
with modest net subsidization occurring in several years. At the height of the food price spike in
2007/08, the tax on flour increased sharply as the export parity exceeded domestic wholesale flour
prices by far. Even though flour millers were substantially subsidized on wheat inputs (with
domestic wheat prices below export parity) the subsidy was not sufficient to compensate the large
tax on output. As a result, the tax on flour millers was 6 % during the 2007/08 price spike. In recent
years, the tax on flour continues to exceed the subsidy on wheat input, resulting in modest net
taxation of flour millers.
Flour consumers
The NRA to flour consumers is calculated using two alternative sets of border prices, based on
two extreme scenario’s. The first scenario assumes that marketing costs of wheat flour retailers are
equal to the price margin between wholesale and retail flour prices (i.e. their marketing margin is
zero). The resulting border prices are the upper bound on actual border prices measured at the retail
market. The second scenario assumes that retailer marketing costs are zero (i.e. the retailer
marketing margin is equal to the price margin) and the resulting border prices are the lower bound
on actual border prices measured at the retail market. The actual NRA to flour consumers will
probably be in between the NRAs calculated using the upper bound and lower bound border
prices.37
37 Our estimates do not include the subsidy to flour consumers through the sales of wheat flour at below-market rates
in Utility Stores, which implies that we are underestimating flour consumer subsidization, possibly by 3 % to 8 % in
recent years (according to a quick, back-of-the-envelope calculation).
31
We find that flour consumers are on average subsidized by government policies in 2000-
2013 in the order of 5 % to 13 % depending on the assumptions about border prices. However, the
NRA to flour consumers fluctuates considerably across the period due to large fluctuations of the
export parity price of wheat flour. Consumer subsidization peaks at the height of the food price
spike in 2007/08 at 22 % to 27 %, as domestic consumer prices were kept low by the export ban
on wheat (flour) and large-scale public wheat imports and releases. Consumer subsidization was
particularly high in the early 2000s, as domestic retail flour prices were substantially lower than
border prices; in 2000-2004, the average subsidy was between 12 % and 21 %. In recent years, the
NRA to flour consumers somewhat stabilizes. On average consumers continue to be subsidized in
2009-2013, but the subsidy remains below 10 %.
6. Conclusions
The concept of “producers” and “consumers” in economic analysis is a combination of different
agents (interest groups) along the value chain. In this paper, we have disaggregated
distortions/rents to the “consumer” and “producer” groups into rents to various actors within these
groups. We have first presented a modified NRA indicator, which allows to measure the impact of
policies on several groups along the value chain.
We have applied this value chain approach to measuring distortions and rent distribution
in the specific case of the wheat-flour chain in Pakistan. We disaggregated the “producer” group
into wheat farmers and wheat traders and the “consumer” group into flour milling companies and
households and companies purchasing wheat flour (flour consumers).
Our analysis shows that interpreting the aggregate NRAs to “producers” and “consumers”
as policy impacts on farmers and on final consumers (households) leads to biased conclusions, but
the bias is relatively limited. The tax on farmers is higher than the producer NRA indicates because
32
wheat traders benefit from the policy system. The average tax on “producers” for 2000-2013 is 9
%, but taxation varies significantly over time: from 20 % in 2000-2004 to 2 % in the 2009-2013
period. There are no good data on farm-level prices, so we considered the two extreme possibilities,
i.e. that the farmgate price equals (i) the support price paid by the government or (ii) the wholesale
wheat price minus trader marketing costs. Traders were subsidized on average between 0 % and 6
% in 2000-2013, and the effects were larger in the early period (between 0 % and 8 % in 2000-
2008) when farm taxation was highest, compared to recent years (between 0 % and 4 % in 2009-
2013). As a result, wheat policy-induced taxes on farms were between 9 % and 15 % on average
over the entire 2000-2013 period, with the highest taxes in 2000-2008 (between 13 % to 21 %),
and the lowest in recent years (between 2 % to 6 % in 2009-2013).
On the consumption side, the benefits for final consumers (households) are larger than the
consumer NRA indicates because the system implies a tax on flour mills. “Consumers” are
generally subsidized in 2000-2013 by government policies, but the NRA is small: the average
NRA for 2000-2013 equals 5 %. This subsidization of “consumers” also declines in recent years,
although the decline is less pronounced compared to the “producer” tax. The average subsidy to
“consumers” was 7 % in 2000-2008 and falls to 1 % in 2009-2013. Depending on assumptions on
wheat flour import prices (and sources), average flour miller taxation was between 4 % and 8 %
from 2000 to 2013 (and relatively constant over the period). Flour consumers were subsidized on
average between 5 % and 13 % from 2000-2013, with the highest subsidies in 2000-2008 (between
7 % and 15 %), falling to between 1 % to 9 % in 2009-2013.
In summary, our value chain NRA analysis indicates that the wheat price policy in Pakistan
has generally benefitted flour consumers and wheat traders at the expense of farmers (and to a
lesser extent flour millers) in 2000-2013, but the effects are relatively small. During the 2007/08

33
food price shock, government interventions such as the export ban prevented farmers from
profiting from the spike in international wheat prices and led to a large increase in farmer taxation.
Domestic prices were prevented from following the international price surge, resulting in an
increase in flour consumer subsidization. In recent years, government interventions were scaled
down again, which is reflected in reduced rent effects for all agents along the value chain. From
late 2010 onwards, the convergence of domestic wheat (flour) prices and export parity prices
reduced consumer and trader subsidization and farmer taxation to close to zero.
The results of our disaggregated NRA calculations for different agents along the value
chain paint a more nuanced picture of the welfare effects of government wheat policies, and
illustrate how the distribution of aggregate distortions/rents within “producer” and “consumer”
groups is affected by the interaction between government policies and domestic and international
prices. Not surprisingly, the empirical difficulties encountered by measuring the standard
(producer and consumer) NRAs are more important when trying to disentangle them along
different agents in the value chain. However, despite these difficulties it is an important exercise
if one wants to design policies that target the poorest groups along the value chains, realizing that
the “producer” and “consumer” umbrellas typically include both richer and poorer groups of
society.

34
References
Ahmad, Munir, Abdul Qayyum, and Muhammad Iqbal. 2005. Impact of Domestic Policies towards
Agricultural Trade Liberalisation and Market Reform on Food Security in Pakistan. Processed.
Anderson, Kym. 2009. Distortions to Agricultural Incentives: A Global Perspective, 1955-2007. World
Bank Publications.
Anderson, Kym, Marianne Kurzweil, Will Martin, Damiano Sandri, and Ernesto Valenzuela. 2008a.
Methodology for Measuring Distortions to Agricultural Incentives. Agricultural Distortions
Working Paper 02. Washington DC: World Bank.
———. 2008b. “Measuring Distortions to Agricultural Incentives, Revisited.” World Trade Review 7
(04): 675. doi:10.1017/S1474745608004011.
Anderson, Kym, and Signe Nelgen. 2013. “Updated National and Global Estimates of Distortions to
Agricultural Incentives, 1955 to 2011.” World Ban. www.worldbank.org/agdistortions.
Anderson, Kym, Gordon Rausser, and Johan Swinnen. 2013. “Political Economy of Public Policies:
Insights from Distortions to Agricultural and Food Markets.” Journal of Economic Literature 51
(2): 423–77. doi:10.1257/jel.51.2.423.
Chabot, Philippe, and Paul A. Dorosh. 2007. “Wheat Markets, Food Aid and Food Security in
Afghanistan.” Food Policy 32 (3): 334–53. doi:10.1016/j.foodpol.2006.07.002.
Ciaian, Pavel, and Johan F. M. Swinnen. 2006. “Land Market Imperfections and Agricultural Policy
Impacts in the New EU Member States: A Partial Equilibrium Analysis.” American Journal of
Agricultural Economics 88 (4): 799–815. doi:10.1111/j.1467-8276.2006.00899.x.
———. 2009. “Credit Market Imperfections and the Distribution of Policy Rents.” American Journal of
Agricultural Economics 91 (4): 1124–39. doi:10.1111/j.1467-8276.2009.01311.x.
Dorosh, Paul. mimeo. “Promoting Efficiency and Food Security: Options for Pakistan Wheat Policy
Reform.”
Dorosh, Paul. 2008. “Regional Trade and Food Price Stabilisation in South Asia: Policy Responses to the
2007-08 World Price Shocks.” The Pakistan Development Review, 803–13.
Dorosh, Paul, and Abdul Salam. 2007a. Distortions to Agricultural Incentives in Pakistan. Agricultural
Distortions Working Paper 33. Washington, D.C.: World Bank.
———. 2007b. Distortions to Agricultural Incentives in Pakistan. Agricultural Distortions Working
Paper 33. Washington DC: World Bank.
———. 2008. “Wheat Markets and Price Stabilisation in Pakistan: An Analysis of Policy Options.” The
Pakistan Development Review, 71–87.
———. 2009. “Pakistan.” In Distortions to Agricultural Incentives in Asia, edited by Kym Anderson and
Will Martin, 379–408. Washington, D.C.: World Bank.

35
Dorosh, Paul, and Alberto Valdés. 1990. Effects of Exchange Rate and Trade Policies on Agriculture in
Pakistan. Research Report 84. International Food Policy Research Institute.
FAO, UNDP, UNESCO, UNICEF, WFP, and WHO. 2008. High Food Prices in Pakistan: Impact
Assessment and the Way Forward. UN Inter Agency Assessment Mission.
Food Security Response Analysis Support Team Afghanistan (RASTA). 2014. Wheat Markets and Food
Security in Afghanistan.
Goodwin, Barry K., Ashok K. Mishra, and François Ortalo-Magné. 2011. The Buck Stops Where? The
Distribution of Agricultural Subsidies. Working Paper 16693. National Bureau of Economic
Research. http://www.nber.org/papers/w16693.
International Finance Corporation. 2011. Punjab Grain Storage Project. Due Diligence Technical Report.
World Bank Group.
Ivanova, Nedka, John Lingard, Allan Buckwell, and Alison Burrell. 1995. “Impact of Changes in
Agricultural Policy on the Agro-Food Chain in Bulgaria.” European Review of Agricultural
Economics 22 (3): 354–71. doi:10.1093/erae/22.3.354.
Khan, Mohammad Aslam, and S. Akhtar Ali Shah. 2011. “Food Insecurity in Pakistan: Causes and Policy
Response.” Journal of Agricultural and Environmental Ethics 24 (5): 493–509.
doi:10.1007/s10806-010-9274-2.
Kurosaki, Takashi. 1996. “Government Interventions, Market Integration, and Price Risk in Pakistan’s
Punjab.” The Pakistan Development Review, 129–44.
Latruffe, Laure, and Chantal Le Mouël. 2009. “Capitalization of Government Support in Agricultural
Land Prices: What Do We Know?” Journal of Economic Surveys 23 (4): 659–91.
doi:10.1111/j.1467-6419.2009.00575.x.
Lohano, Hari Ram, Laurence ED Smith, and Mike Stockbridge. 1998. “Comparing the Seed Cotton and
Wheat Marketing Chains in Sindh.” The Pakistan Development Review, 53–75.
Olper, Alessandro, Jan Fałkowski, and Johan Swinnen. 2014. “Political Reforms and Public Policy:
Evidence from Agricultural and Food Policies.” The World Bank Economic Review 28 (1): 21–
47. doi:10.1093/wber/lht003.
Olper, Alessandro, and Johan Swinnen. 2013. “Mass Media and Public Policy: Global Evidence from
Agricultural Policies.” The World Bank Economic Review, March, lht008.
doi:10.1093/wber/lht008.
Persaud, Suresh. 2010. Price Volatility in Afghanistan’s Wheat Market. Economic Research Service
Report. US Department of Agriculture.
———. 2013. Afghanistan’s Wheat Flour Market: Policies and Prospects. Economic Research Service
Report. USDA. http://www.ers.usda.gov/ersDownloadHandler.ashx?file=/media/1208210/whs-
13i-01.pdf.

36
Pieters, Hannah, and Johan Swinnen. 2014. Trading-off Volatility and Distortions? Economics and
Politics of Food Policy During Price Spikes.
Prikhodko, Dmitry, and Rodion Rybchynsky. 2009. Agribusiness Handbook: Wheat Flour. Agribusiness
Handbooks. Rome, Italy: FAO.
Prikhodko, Dmitry, and Oleksandr Zrilyi. 2013. Pakistan: Review of the Wheat Sector and Grain Storage
Issues. Country Highlights. Rome, Italy: FAO.
Salam, Abdul. 2012. “Review of Input and Output Policies for Cereals Production in Pakistan.” Available
at SSRN 2185412. http://www.ifpri.org/sites/default/files/publications/ifpridp01223.pdf.
Swinnen, Johan F. M. 1998. “Economic Transition and the Distribution of Policy Rents: The Case of the
Wheat-Flour-Bread Chain in Bulgaria.” European Review of Agricultural Economics 25 (2): 243–
58. doi:10.1093/erae/25.2.243.
Tayyab, Ayesha. 2013. “Mitigating the Impact of Price Instability on Poverty.”
UN. 2014. “UN COMTRADE Database.” http://comtrade.un.org/.
USAID. 2009. Pakistan’s Food and Agriculture Systems.
USDA. 2012a. Afghanistan 2012 Grain and Feed Annual. GAIN report. USDA Foreign Agricultural
Service.
———. 2012b. Pakistan Grain and Feed Annual. GAIN report. USDA Foreign Agricultural Service.
———. 2014a. Pakistan Grain and Feed Annual 2014. GAIN report. USDA Foreign Agricultural
Service.
———. 2014b. Production, Supply and Distribution Statistics.
http://apps.fas.usda.gov/psdonline/psdhome.aspx.
World Bank. 2010. Food Price Increases in South Asia: National Responses and Regional Dimesnions.
Washington DC: World Bank.
Zahid, Muhammad Sarwar, Abdul Qayyum, Wasim Shahid Malik, and Krishna Prasad Pant. 2007.
“Dynamics of Wheat Market Integration in Northern Punjab, Pakistan [with Comments].” The
Pakistan Development Review, 817–30.

37
Figures and Tables
Figure 1: International and Pakistan wheat prices for 1994-2013.
Source: International wheat price (FOB US Gulf HRW1) from World Bank. Wholesale price of wheat at Lahore from Dorosh-Salam dataset and Punjab Institute for
Agricultural Marketing.
0
50
100
150
200
250
300
350
400
450
500
Jul/
94
Dec
/94
May
/95
Oct
/95
Mar
/96
Au
g/9
6
Jan
/97
Jun
/97
No
v/9
7
Ap
r/98
Sep
/98
Feb
/99
Jul/
99
Dec
/99
May
/00
Oct
/00
Mar
/01
Au
g/0
1
Jan
/02
Jun
/02
No
v/0
2
Ap
r/03
Sep
/03
Feb
/04
Jul/
04
Dec
/04
May
/05
Oct
/05
Mar
/06
Au
g/0
6
Jan
/07
Jun
/07
No
v/0
7
Ap
r/08
Sep
/08
Feb
/09
Jul/
09
Dec
/09
May
/10
Oct
/10
Mar
/11
Au
g/1
1
Jan
/12
Jun
/12
No
v/1
2
Ap
r/13
Pri
ce (
US
D/k
g)
FOB US Gulf HRW1 Wholesale price wheat (Lahore)

38
Figure 2: Real support price and wholesale price minus trader marketing costs for 1991-2013.
Source: Support price and Lahore wholesale wheat price from Dorosh-Salam dataset and Punjab Institute for Agricultural Marketing. Trader marketing costs calculated using
data from International Finance Corporation (2011) and API and extended using the monthly Pakistan CPI.
Notes: Real prices are calculated by deflating nominal prices using the monthly Pakistan CPI (base year 2005).
0
2
4
6
8
10
12
14
16
Jan
/91
Jul/
91
Jan
/92
Jul/
92
Jan
/93
Jul/
93
Jan
/94
Jul/
94
Jan
/95
Jul/
95
Jan
/96
Jul/
96
Jan
/97
Jul/
97
Jan
/98
Jul/
98
Jan
/99
Jul/
99
Jan
/00
Jul/
00
Jan
/01
Jul/
01
Jan
/02
Jul/
02
Jan
/03
Jul/
03
Jan
/04
Jul/
04
Jan
/05
Jul/
05
Jan
/06
Jul/
06
Jan
/07
Jul/
07
Jan
/08
Jul/
08
Jan
/09
Jul/
09
Jan
/10
Jul/
10
Jan
/11
Jul/
11
Jan
/12
Jul/
12
Jan
/13
Pri
ce (
20
05
Rs/
kg
)
Support Wholesale - costs

39
Figure 3: NRA (%) to “producers” and “consumers” for 2000-2013.
Source: Author’s calculations.
Notes: The NRA to “producers” (wheat sector) is equal to the sum of the NRAs to wheat farmers and wheat traders. The NRA to “consumers” is equal to the sum of the NRA
to flour millers and the average NRA to flour consumers (across NRAs for upper and lower bound border prices). The NRAs for flour millers and flour consumers are
calculated using EU/Black Sea import parity prices.
-50%
-40%
-30%
-20%
-10%
0%
10%
20%
30%
40%
50%2
00
0-0
1
200
1-0
2
200
2-0
3
200
3-0
4
200
4-0
5
200
5-0
6
200
6-0
7
200
7-0
8
200
8-0
9
200
9-1
0
201
0-1
1
201
1-1
2
201
2-1
3
"Producers" "Consumers"

40
Figure 4: NRA to wheat farmers and wheat traders for alternative farmgate price indicators for 2000-2013.
Source: Author’s calculations.
Notes: ‘Support’ indicates that farmgate prices are assumed equal to the support price; ‘wholesale’ indicates that farmgate prices are assumed equal to the wholesale wheat
price minus marketing costs from the farmgate to the wholesale market in Lahore.
-50%
-40%
-30%
-20%
-10%
0%
10%
20%
30%
40%
50%2
00
0-0
1
200
1-0
2
200
2-0
3
200
3-0
4
200
4-0
5
200
5-0
6
200
6-0
7
200
7-0
8
200
8-0
9
200
9-1
0
201
0-1
1
201
1-1
2
201
2-1
3
Farmer - support Farmer - wholesale Trader - support Trader - wholesale

41
Figure 5: Disaggregated NRA to wheat traders (input, output, total) using the support price indicator for 2000-2013.
Source: Author’s calculations.
-50%
-40%
-30%
-20%
-10%
0%
10%
20%
30%
40%
50%
200
0-0
1
200
1-0
2
200
2-0
3
200
3-0
4
200
4-0
5
200
5-0
6
200
6-0
7
200
7-0
8
200
8-0
9
200
9-1
0
201
0-1
1
201
1-1
2
201
2-1
3
Input Output Total
42
Figure 6: NRA (%) to flour millers and flour consumers (for upper and lower bound border prices) for 2000-2013.
Source: Author’s calculations.
Notes: ‘Lower’ and ‘upper’ indicate that lower bound, respectively upper bound border prices were used to calculate the NRA to flour consumers. The NRAs for flour millers
and flour consumers are calculated using EU/Black Sea import parity prices.
-50%
-40%
-30%
-20%
-10%
0%
10%
20%
30%
40%
50%2
00
0-0
1
200
1-0
2
200
2-0
3
200
3-0
4
200
4-0
5
200
5-0
6
200
6-0
7
200
7-0
8
200
8-0
9
200
9-1
0
201
0-1
1
201
1-1
2
201
2-1
3
Flour millers Flour consumers - upper Flour consumers - lower

43
Figure 7: Disaggregated NRA to flour millers (input, output, total) for 2000-2013.
Source: Author’s calculations. Notes: The NRAs for flour millers are calculated using EU/Black Sea import parity prices.
-50%
-40%
-30%
-20%
-10%
0%
10%
20%
30%
40%
50%
200
0-0
1
200
1-0
2
200
2-0
3
200
3-0
4
200
4-0
5
200
5-0
6
200
6-0
7
200
7-0
8
200
8-0
9
200
9-1
0
201
0-1
1
201
1-1
2
201
2-1
3
Input Output Total

44
Table 1: Average NRA (%) for different agents along the value chain
Agent 2000-2013 2000-2004 2005-2008 2009-2013
NRA to “producers” (wheat sector) - 9.2% - 20.0% - 7.5% - 1.9%
Wheat farmers Sales at support price a - 15.2% - 24.8% - 17.8% - 5.6%
Sales at wholesale price – costs b - 8.9% - 19.7% - 7.1% - 1.7%
Wheat traders Sales at support price a 6.0% 4.8% 10.2% 3.7%
Sales at wholesale price – costs b 0.0% 0.0% 0.0% 0.0%
NRA to "consumers" 4.7% 7.0% 6.9% 1.0%
Flour millers
- 4.2% - 9.4% 1.2% - 4.3%
Flour consumers Upper bound border price c 12.8% 21.2% 8.8% 9.3%
Lower bound border price d 4.8% 11.6% 2.5% 1.2%
Source: Author's calculations. Notes: NRAs are calculated across wheat crop marketing years. Hence, the year 2000 starts on May 1st, 2000, and the year 2013 ends
on April 30th, 2013. The NRAs for flour millers and flour consumers are calculated using EU/Black Sea import parity prices. The NRA to “consumers” is
calculated as the sum of the NRA to flour millers and the average NRA to flour consumers.
a: We assume that traders pay farmers the support price, and fluctuations in the wholesale price of wheat are captured entirely by traders (see section 4.2.1).
b: We assume that traders pay farmers the wholesale price of wheat minus trader marketing costs, and fluctuations in the wholesale price are passed on entirely to
farmers (see section 4.2.1).
c: We assume that marketing costs of retailers are equal to the price margin between the wholesale price of wheat flour and the retail price of wheat flour. This
assumption produces an upper bound for wheat flour border prices at the retail market and for the resulting NRAs to flour consumers (see section 4.4.1).
d: We assume that marketing costs of retailers are zero (see section 4.4.1). This assumption produces a lower bound for wheat flour border prices at the retail
market and for the resulting NRAs to flour consumers (see section 4.4.1).

45
Appendix 1: Methodology for calculating NRA to farmer input
Annual NRAs to input are calculated using annual averages of border prices and domestic
prices. Monthly NRAs are calculated using monthly import parity prices and annual
domestic prices due to the unavailability of monthly domestic fertilizer prices.
The international reference prices for DAP (diammonium phosphate) and urea were
taken from the World Bank. For DAP the price is the FOB US Gulf price; for urea the price
is the FOB Black Sea price (primarily Yuzhnyy). World market prices were calculated by
adding international ocean freight rates from the US Gulf to Karachi to the international
DAP price and freight rates from the Black Sea to Karachi (estimated at 85 % of US Gulf
freight rates) to the international urea price. The import parity price at Lahore is then equal
to the world market price times the nominal exchange rate (Pak Rs/USD) plus import
marketing costs from Karachi to Lahore. We abstract from any quality adjustments.
The conversion rates of DAP and urea (𝑄𝑗𝑓
/𝑄𝑜𝑓
) are equal to the number of kilograms
of fertilizer used to produce one kilogram of wheat. These rates were calculated using the
use of fertilizer per hectare for wheat production for 2011/12 and 2012/13 from the
Agriculture Policy Institute and annual yield data for wheat taken from the Pakistan
Economic Survey 2012-13. We assume that the use of fertilizer per hectare was constant
over the period 2000-2013. Annual fertilizer prices are averages for Pakistan and were taken
from the Pakistan Economic Survey 2012-13.
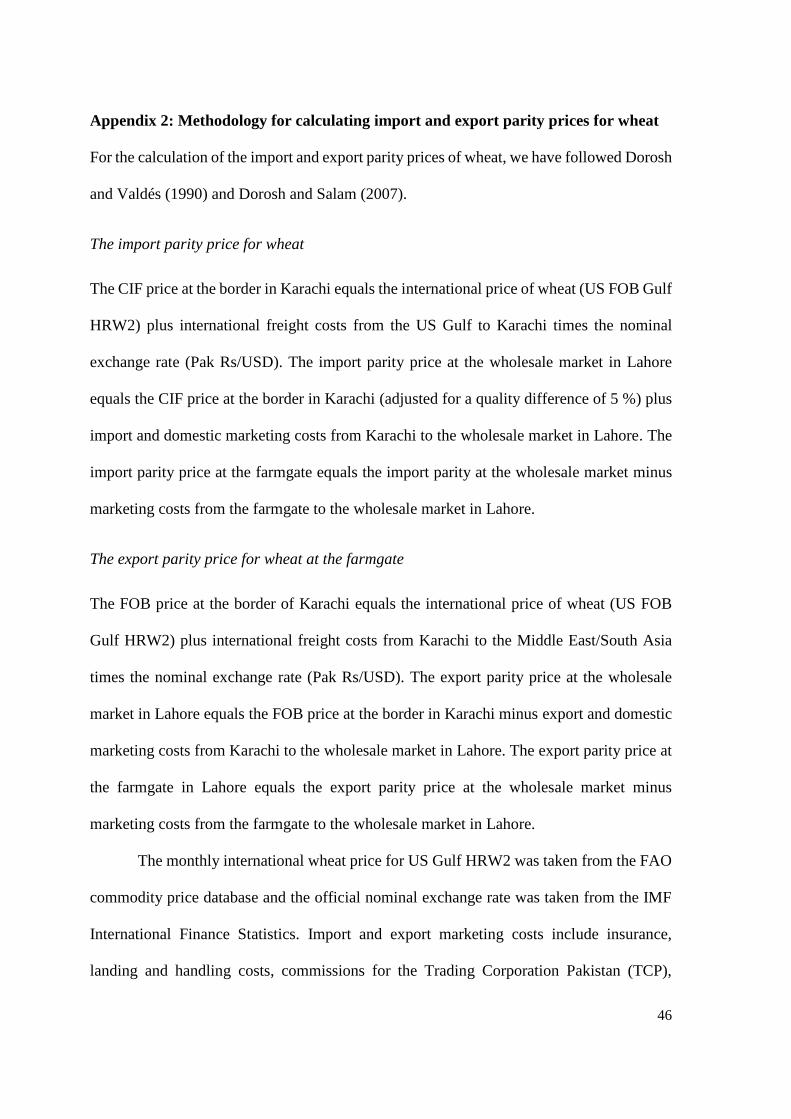
46
Appendix 2: Methodology for calculating import and export parity prices for wheat
For the calculation of the import and export parity prices of wheat, we have followed Dorosh
and Valdés (1990) and Dorosh and Salam (2007).
The import parity price for wheat
The CIF price at the border in Karachi equals the international price of wheat (US FOB Gulf
HRW2) plus international freight costs from the US Gulf to Karachi times the nominal
exchange rate (Pak Rs/USD). The import parity price at the wholesale market in Lahore
equals the CIF price at the border in Karachi (adjusted for a quality difference of 5 %) plus
import and domestic marketing costs from Karachi to the wholesale market in Lahore. The
import parity price at the farmgate equals the import parity at the wholesale market minus
marketing costs from the farmgate to the wholesale market in Lahore.
The export parity price for wheat at the farmgate
The FOB price at the border of Karachi equals the international price of wheat (US FOB
Gulf HRW2) plus international freight costs from Karachi to the Middle East/South Asia
times the nominal exchange rate (Pak Rs/USD). The export parity price at the wholesale
market in Lahore equals the FOB price at the border in Karachi minus export and domestic
marketing costs from Karachi to the wholesale market in Lahore. The export parity price at
the farmgate in Lahore equals the export parity price at the wholesale market minus
marketing costs from the farmgate to the wholesale market in Lahore.
The monthly international wheat price for US Gulf HRW2 was taken from the FAO
commodity price database and the official nominal exchange rate was taken from the IMF
International Finance Statistics. Import and export marketing costs include insurance,
landing and handling costs, commissions for the Trading Corporation Pakistan (TCP),

47
interest costs and other miscellaneous expenses. Marketing costs before 2005/06 were taken
from the Dorosh and Salam (2007) dataset; marketing costs for the years after were taken
from the Agricultural Policy Institute (API). International freight rates from the US Gulf to
Karachi were taken from the Dorosh-Salam dataset for 2000-2006 and from IGC for 2007-
2013. International freight rates from Karachi to the Middle East/South Asia were estimated
to be 75 % of freight rates from the US Gulf to Karachi.

48
Appendix 3: Methodology for calculating border prices for wheat flour
Autarky prices
Autarky prices are calculated by adding marketing and processing costs of flour milling in Pakistan
to the autarky wholesale wheat price in Lahore. Marketing and processing costs for 2010/11 were
taken from (International Finance Corporation 2011) and extended using the monthly CPI.
Marketing costs include transportation, handling and service fees to traders.
Import and export parity prices
The calculation of import and export parity prices for wheat flour is not straightforward. Contrary
to wheat grain, wheat flour is not a widely-traded commodity with a clearly identified international
reference price. We have therefore calculated an import parity price for two scenario’s. In the first
scenario, we assume that Pakistan would import wheat flour from Kazakhstan under free trade.
Kazakhstan has recently become one of the global leaders in wheat flour exports and the main
supplier of wheat flour to the Central and South Asia region. As Kazakhstan has historically been
the main supplier of wheat flour to the north of Afghanistan (Persaud 2013), wheat flour from
Kazakhstan should be able to reach Pakistan as well. In this scenario, the import parity price of
wheat flour at Lahore is equal to the Kazakhstan wheat flour FOB price (times the Pakistan
Rs./USD nominal exchange rate) plus marketing costs from Kazakhstan to Lahore, adjusted for a
quality difference of 5 %.
The second scenario assumes that Pakistan would import wheat flour from the EU or Black
Sea region under free trade. Wheat flour imported from the EU/Black Sea region would likely be
less costly for Pakistan than importing wheat flour from Kazakhstan due to significant land freight
costs for the latter. In addition, since 2003 a large share of wheat flour imports (although mainly

49
in the form of humanitarian aid or food aid) has come from the EU-27, Turkey or Ukraine. For the
EU/Black Sea region, we use the FOB export price of Turkey, the second global leader in wheat
flour exports, as the international reference price. The import parity price at Lahore is then equal
to the Turkey wheat flour FOB price plus international ocean freight costs from the EU/Black Sea
region to South Asia (times the nominal exchange rate) plus marketing costs from Karachi to
Lahore, adjusted for a quality difference of 5 %.
According to UN Comtrade statistics, in 2003-2013 over 90 % of wheat flour exports from
Pakistan have flowed to Afghanistan (with the exception of 2011 where the share is 75 %, see
Section 2). We therefore assume that under free trade Pakistan would continue to export wheat
flour mostly to Afghanistan and that the export parity price is mainly determined by demand in
Afghanistan (see also World Bank, 2010: 124, footnote 88). As Kazakhstan is the leading wheat
flour exporter in the region and the main competitor of Pakistan flour exports in Afghanistan, we
take the FOB wheat flour price of Kazakhstan as the international reference price. The export
parity price of wheat flour at Lahore is then equal to the Kazakhstan FOB wheat flour price plus
freight rates from Kazakhstan to the Pakistan-Afghanistan border minus transport and marketing
costs from Lahore to the border (Peshawar).
The unit value FOB wheat flour price for Turkey and Kazakhstan is calculated using annual
UN Comtrade wheat flour trade statistics for the years 2000-2003 and monthly GTIS wheat flour
trade data for the years 2004-2013. International ocean freight rates from the EU/Black Sea region
to South Asia is estimated to be 85 % of US Gulf – Karachi freight rates, which are taken from the
Dorosh-Salam dataset for 2000-2006 and from IGC Grain Market Reports for 2007 onwards.
Annual marketing costs from the Kazakhstan border to Kabul were taken from official statistics
for 2011 and extended using the annual Kazakhstan CPI (base year 2005). Marketing costs from

50
Kabul to the Afghanistan-Pakistan border (Peshawar) were calculated from estimates for 2002 in
Chabot and Dorosh (2007) and for 2012 in Food Security Response Analysis Support Team
Afghanistan (RASTA), (2014). Both series were extended using the monthly Pakistan CPI.
Marketing costs from Lahore to the Afghanistan-Pakistan border (Peshawar) were calculated from
estimates for 2012 in (RASTA, 2014) and extended using the monthly Pakistan CPI.

51
Appendix 4: Additional tables and Figures
Table A1: Overview of wheat policies and the wheat market in Pakistan since the 1990s.
Period Description Production Procurement Distribution Net Imports
Net
availability
per capita
Real
wholesale
price wheat
('000 MT) ('000 MT) ('000 MT) ('000 MT) (kg/capita) (2005 Rs/kg)
1988/89 -
1999/00
Liberalized retail sales;
Large-scale public imports
lower market prices
15 845 3 681 5 671 2 369 132 9.05
2000/01 -
2006/07
Reduced public imports
and net availability;
domestic prices rise;
exports to Afghanistan
19 986 4 572 4 391 -376 114 10.63
2007/08 -
2008/09
Very high world prices;
domestic prices rise;
exports banned; large
public imports
22 127 4 170 6 052 315 118 12.96
2009/10
International prices fall;
domestic prices at import
parity, but little trade
24 033 9 231 5 985 147 106 15.31
2010/11 -
2012/13
Moderate rise in world
prices; domestic prices at
export parity; net exports
23 999 6 219 6 348 -1 463 116 12.96
Source: Author’s calculations. Production, procurement and distribution data from Pakistan Economic Survey. Trade data from Pakistan Bureau of Statistics,
FAO and the UN Comtrade database (for 2011/12 and 2012/13). Lahore wholesale wheat prices from Dorosh-Salam dataset and Punjab Institute for
Agricultural Marketing.
Notes: Production, procurement and distribution data are supplied for fiscal years. Production in the previous year is used to calculate net availability in the
current year.

52
Table A2: World Bank estimates of NRA, NRA to output and NRA to input for wheat in
Pakistan, 2000-2010.
Year NRA NRA to output NRA to input
2000 0.093 0.073 0.020
2001 -0.146 -0.178 0.032
2002 -0.266 -0.287 0.021
2003 -0.290 -0.302 0.012
2004 -0.132 -0.150 0.018
2005 -0.095 -0.124 0.029
2006 -0.315 -0.315 0.000
2007 -0.484 -0.484 0.000
2008 -0.634 -0.634 0.000
2009 -0.017 -0.017 0.000
2010 -0.028 -0.028 0.000
Source: World Bank Updated Distortions to Agricultural Incentives database (Anderson and Nelgen, 2013).

53
Table A3: Calculation of NRA to wheat farmers (prices in Rs/kg)
Marketing
Year
Border
price
Support
price
Wholesale
wheat -
trader costs
Import
parity
farmgate
Export
parity
farmgate
Autarky
price
farmgate
NRA
support
NRA
wholesale
NRA
input
2000/01 Import 7.50 7.62 10.45 5.87 4.76 -0.26 -0.25 0.02
2001/02 Import 7.50 7.49 11.50 6.74 6.74 -0.33 -0.34 0.01
2002/03 Autarky 7.50 7.92 12.85 8.03 9.38 -0.19 -0.14 0.01
2003/04 Autarky 7.50 8.93 12.48 7.52 9.76 -0.21 -0.06 0.02
2004/05 Autarky 8.75 10.55 12.64 7.55 12.42 -0.26 -0.12 0.03
2005/06 Autarky 10.00 10.84 13.33 8.18 9.63 0.09 0.18 0.05
2006/07 Autarky 10.38 11.22 17.53 11.83 13.64 -0.17 -0.11 0.07
2007/08 Export 10.63 13.33 28.61 20.31 16.75 -0.37 -0.24 0.10
2008/09 Autarky 15.63 20.12 28.62 20.21 25.77 -0.28 -0.11 0.11
2009/10 Import 23.75 24.10 25.51 17.03 15.64 -0.04 -0.02 0.03
2010/11 Export 23.75 24.46 31.57 22.74 23.52 0.08 0.11 0.03
2011/12 Export 25.21 24.74 34.39 25.20 23.80 0.01 -0.01 0.01
2012/13 Export 27.81 27.57 39.39 29.39 31.21 -0.05 -0.06 0.01
Source: Author's calculations. Wholesale price wheat at Lahore from Dorosh-Salam dataset and Punjab Institute for Agricultural Marketing. Notes:
Appendix 2 provides details on the calculation of import and export parity prices for wheat. Autarky prices supplied by P. Dorosh.

54
Table A4: Calculation of NRA to wheat traders (prices in Rs/kg)
Marketing
year
NRA input
support
NRA input
wholesale
Wholesale
wheat
Lahore
Import
parity
wheat
Lahore
Export
parity
wheat
Lahore
Autarky
price wheat
Lahore
NRA
output
NRA
support
NRA
wholesale
2000/01 0.27 0.26 8.08 10.90 6.33 5.22 -0.26 0.01 0.00
2001/02 0.33 0.34 7.95 11.97 7.21 7.21 -0.34 0.00 0.00
2002/03 0.19 0.15 8.40 13.33 8.51 9.86 -0.15 0.04 0.00
2003/04 0.22 0.08 9.43 12.98 8.02 10.26 -0.08 0.14 0.00
2004/05 0.28 0.14 11.10 13.18 8.09 12.96 -0.14 0.14 0.00
2005/06 -0.04 -0.12 11.42 13.91 8.76 10.21 0.12 0.08 0.00
2006/07 0.23 0.17 11.75 18.06 12.36 14.17 -0.17 0.06 0.00
2007/08 0.46 0.33 14.13 29.41 21.10 17.54 -0.33 0.13 0.00
2008/09 0.38 0.21 21.21 29.71 21.30 26.86 -0.21 0.17 0.00
2009/10 0.05 0.05 25.32 26.73 18.25 16.87 -0.05 0.01 0.00
2010/11 -0.04 -0.07 25.77 32.89 24.06 24.83 0.07 0.03 0.00
2011/12 0.00 0.02 26.07 35.73 26.53 25.13 -0.02 -0.02 0.00
2012/13 0.05 0.06 28.93 40.75 30.76 32.58 -0.06 -0.01 0.00
Source: Author's calculations. Wholesale price wheat at Lahore from Dorosh-Salam dataset and Punjab Institute for Agricultural Marketing. Notes:
Appendix 2 provides details on the calculation of import and export parity prices for wheat. Autarky prices supplied by P. Dorosh.

55
Table A5: Calculation of NRA to flour millers for EU import parity prices (prices in Rs/kg)
Marketing
Year
Release
price
Wholesale
price flour
Lahore
Import parity
flour Lahore
(EU)
Export parity
flour Lahore
Autarky
price flour
Lahore
NRA
input
(EU)
NRA
output
(EU)
NRA
(EU)
2000/01 7.75 8.64 13.62 10.76 6.86 0.18 -0.37 -0.18
2001/02 8.00 8.57 14.59 11.52 8.89 0.22 -0.41 -0.19
2002/03 8.00 9.69 17.02 12.44 11.60 0.12 -0.16 -0.05
2003/04 8.36 11.62 16.58 17.16 12.06 0.08 -0.04 0.04
2004/05 9.64 13.44 17.55 13.47 14.93 0.13 -0.10 0.03
2005/06 10.78 14.20 16.49 12.86 12.34 -0.07 0.15 0.08
2006/07 10.96 14.24 20.67 14.37 16.46 0.14 -0.13 0.00
2007/08 13.18 18.28 32.41 25.91 20.06 0.23 -0.29 -0.06
2008/09 17.82 25.61 41.01 38.77 29.93 0.19 -0.14 0.05
2009/10 23.68 31.44 32.86 26.36 20.30 0.06 -0.04 0.01
2010/11 24.69 28.80 40.04 32.58 28.57 -0.03 -0.12 -0.15
2011/12 24.95 31.41 44.45 34.20 29.05 0.02 -0.08 -0.06
2012/13 27.08 34.58 51.01 39.44 36.82 0.06 -0.12 -0.07
Source: Author's calculations. Release price from Dorosh-Salam dataset. Wholesale price wheat flour at Lahore from Pakistan Bureau of
Statistics.
Notes: Appendix 3 provides details on the calculation of wheat flour border prices. The wholesale wheat flour price is for wheat flour of
superior quality.

56
Table A6: Calculation of NRA to flour consumers for EU import parity prices (prices in Rs/kg)
Marketing
Year
Retail
price
wheat
flour
Upper
import
parity flour
(EU)
Upper
export parity
flour
Upper
autarky
price flour
Lower
import
parity
flour (EU)
Lower
export
parity flour
Lower
Autarky
price flour
NRA
Upper
NRA
Lower
2000/01 10.83 15.81 12.95 9.05 13.62 10.76 6.86 0.31 0.20
2001/02 11.00 17.02 13.95 11.33 14.59 11.52 8.89 0.35 0.25
2002/03 11.14 18.47 13.88 13.05 17.02 12.44 11.60 0.15 0.04
2003/04 12.36 17.32 17.90 12.80 16.58 17.16 12.06 0.03 -0.03
2004/05 14.46 18.57 14.49 15.95 17.55 13.47 14.93 0.09 0.03
2005/06 15.00 17.30 13.67 13.14 16.49 12.86 12.34 -0.14 -0.22
2006/07 15.42 21.84 15.55 17.63 20.67 14.37 16.46 0.13 0.06
2007/08 20.21 34.35 27.85 22.00 32.41 25.91 20.06 0.27 0.22
2008/09 29.26 44.66 42.41 33.57 41.01 38.77 29.93 0.13 0.02
2009/10 34.67 36.09 29.58 23.53 32.86 26.36 20.30 0.04 -0.05
2010/11 31.68 42.92 35.46 31.45 40.04 32.58 28.57 0.11 0.03
2011/12 34.04 47.08 36.84 31.69 44.45 34.20 29.05 0.08 0.00
2012/13 36.98 53.40 41.83 39.22 51.01 39.44 36.82 0.12 0.06
Source: Author's calculations. Retail wheat flour price at Lahore from Pakistan Bureau of Statistics.
Notes: The wheat flour retail price is the price for wheat flour of superior quality.

57
Figure A1: Production, government procurement and government releases of wheat in Pakistan for 1990-2013.
Source: Pakistan Economic Survey.
Notes: The Pakistan Economic Survey supplies production, procurement and release data by fiscal year. Hence, the figure shows data for FY1991-FY2013.
-
5,000
10,000
15,000
20,000
25,000
30,000
Production Procurement Releases

58
Figure A2: Real wheat border prices, domestic wheat prices and wheat (flour) trade for Pakistan for 1991-2013.
Source: Import and export parity prices for wheat from author’s calculations (see Appendix 2 for details). Trade data from Pakistan Bureau of Statistics, FAO and the UN
Comtrade database (for 2011/12 and 2012/13). Support price and Lahore wholesale wheat prices from Dorosh-Salam dataset and Punjab Institute for Agricultural Marketing.
Notes: Import and export parity prices shown here are measured at the wholesale market in Lahore and are calculated using the FOB price for US Gulf HRW1 wheat. The
import and export parity prices used for the calculation of the NRAs are based on the FOB price for US Gulf HRW2 wheat, which is most comparable to Pakistan wheat. The
reason for showing HRW1 border prices in this Figure is the unavailability of US Gulf HRW2 wheat prices before January 1998. Wheat flour trade quantities are converted
to wheat equivalents using a conversion factor of 0.77. Real prices are calculated by deflating nominal prices using the monthly Pakistan CPI (base year 2005).
0
100
200
300
400
500
600
700
800
0
5
10
15
20
25
30Ja
n/9
1
Au
g/9
1
Mar
/92
Oct
/92
May
/93
Dec
/93
Jul/
94
Feb
/95
Sep
/95
Ap
r/96
No
v/9
6
Jun
/97
Jan
/98
Au
g/9
8
Mar
/99
Oct
/99
May
/00
Dec
/00
Jul/
01
Feb
/02
Sep
/02
Ap
r/03
No
v/0
3
Jun
/04
Jan
/05
Au
g/0
5
Mar
/06
Oct
/06
May
/07
Dec
/07
Jul/
08
Feb
/09
Sep
/09
Ap
r/10
No
v/1
0
Jun
/11
Jan
/12
Au
g/1
2
Mar
/13
Qu
an
tity
(0
00
to
ns)
Pri
ces
(20
05
Rs/
kg
)
Wheat + flour imports Wheat + flour exports Import parity Lahore
Export parity Lahore Wholesale price Lahore Support price

59
Figure A3: Real wheat flour border prices, domestic wheat (flour) prices and wheat flour trade for 2000-2013.
Source: Import and export parity prices for wheat flour from author’s calculations (see Appendix 3 for details). Trade data from annual FAO data until 2011 and monthly data
from Pakistan Bureau of Statistics for 2011-2013. Domestic prices from Dorosh-Salam dataset, Pakistan Bureau of Statistics and Punjab Institute for Agricultural Marketing.
Notes: Wheat flour prices are prices for Atta flour of superior quality. The wholesale price of wheat flour shows annual data before July 2008 (deflated by the annual CPI)
and monthly data afterwards (deflated by the monthly CPI). Import parity prices are calculated assuming wheat flour imports from the EU. Import and export parity prices are
measured at the wholesale market in Lahore and are used for the calculation of the NRA to flour millers. These border prices are equivalent to the lower bound parity prices
used for the calculation of the NRA to flour consumers. Real prices are calculated by deflating nominal prices using the monthly Pakistan CPI (base year 2005).
0
50
100
150
200
250
300
350
400
450
500
0
5
10
15
20
25
30
35
40Ja
n/0
0
May
/00
Sep
/00
Jan
/01
May
/01
Sep
/01
Jan
/02
May
/02
Sep
/02
Jan
/03
May
/03
Sep
/03
Jan
/04
May
/04
Sep
/04
Jan
/05
May
/05
Sep
/05
Jan
/06
May
/06
Sep
/06
Jan
/07
May
/07
Sep
/07
Jan
/08
May
/08
Sep
/08
Jan
/09
May
/09
Sep
/09
Jan
/10
May
/10
Sep
/10
Jan
/11
May
/11
Sep
/11
Jan
/12
May
/12
Sep
/12
Jan
/13
May
/13
Qu
an
tity
(000 t
on
s)
Pri
ces
(2005 R
s/k
g)
Wheat flour imports Wheat flour exports Import parity flour Lahore (EU) Export parity flour Lahore (Kaz)
Release price Wholesale price wheat Lahore Wholesale price flour Lahore Retail price flour Lahore

60
Figure A4: Import parity, export parity and autarky prices for wheat for 2000-2013.
Source Author’s calculations. Appendix 2 provides details on the calculation of import and export parity prices. Autarky prices were supplied by P. Dorosh.
0
5
10
15
20
25
30
35
40
45
50
Jan
/00
May
/00
Sep
/00
Jan
/01
May
/01
Sep
/01
Jan
/02
May
/02
Sep
/02
Jan
/03
May
/03
Sep
/03
Jan
/04
May
/04
Sep
/04
Jan
/05
May
/05
Sep
/05
Jan
/06
May
/06
Sep
/06
Jan
/07
May
/07
Sep
/07
Jan
/08
May
/08
Sep
/08
Jan
/09
May
/09
Sep
/09
Jan
/10
May
/10
Sep
/10
Jan
/11
May
/11
Sep
/11
Jan
/12
May
/12
Sep
/12
Jan
/13
Pri
ces
(Rs/
kg)
Import parity Export parity Autarky price

61
Figure A5: Import parity, export parity and autarky prices for wheat flour for 2000-2013.
Source: Author’s calculations. Appendix 3 provides details calculation of wheat flour border prices.
Notes: Wheat flour border prices and autarky prices are measured at the wholesale market in Lahore. These border prices correspond to the lower bound border
prices at the retail market used for calculations of the NRA to flour consumers.
0
10
20
30
40
50
60
70
Jan
/00
May
/00
Sep
/00
Jan
/01
May
/01
Sep
/01
Jan
/02
May
/02
Sep
/02
Jan
/03
May
/03
Sep
/03
Jan
/04
May
/04
Sep
/04
Jan
/05
May
/05
Sep
/05
Jan
/06
May
/06
Sep
/06
Jan
/07
May
/07
Sep
/07
Jan
/08
May
/08
Sep
/08
Jan
/09
May
/09
Sep
/09
Jan
/10
May
/10
Sep
/10
Jan
/11
May
/11
Sep
/11
Jan
/12
May
/12
Sep
/12
Jan
/13
Pri
ces
(Rs/
kg)
Import parity EU Import parity Kazakhstan Autarky price Export parity