lidar applications to rock fall hazard … · lidar applications to rock fall hazard assesment in...
TRANSCRIPT

4th ICA Mountain Cartography Workshop Vall de Núria, Catalonia, Spain. 30th September – 2nd October 2004
1
LIDAR APPLICATIONS TO ROCK FALL HAZARD ASSESMENT IN
VALL DE NÚRIA.
Marc Janeras1, Maria Navarro1, Georgina Arnó1, Antonio Ruiz2, Wolfgang Kornus2, Julià
Talaya2, Marcel Barberà1, Ferran López1
1RSE, Aplicaciones Territoriales, S.A. 2Institut Cartogràfic de Catalunya
RESUME
Vall de Núria and the Ribes-Núria cog railway track are situated in a high mountain landscape that presents high sub vertical walls with unevenness of about 300 m and is subject to natural dynamics where geomorphologic destructive processes take place such as rock falls. In this sense Dent d’en Rossell is one of the most active areas of the whole valley. In order to improve the safety of the cog railway track new techniques of study have been incorporated into hazard assessment such as airborne and terrestrial LIDAR. The use of this method allows modelling the topographic surface in a very accurate way, obtaining a DEM. This technique of high precision has allowed us to develop a specific work methodology for Dent d’en Rossell to estimate the geologic risk over the cog railway related with rock fall instabilities, which would be impossible to carry out by using conventional topographic modeler. In this survey are shown two examples of the LIDAR possible applications related with potential instabilities areas detection and rock fall hazard assessment.
Key words: DEM, Laser scanning, LIDAR, mesh, rock fall modeling, potential instabilities areas, hazard, risk.
1. INTRODUCTION
1.1. The Ribes-Núria cog railway
The Sanctuary of the Virgin of Núria is in the head waters of Núria River valley, in the Ripollès region near the French frontier. This place has been visited at all the times of its history, first by devotee and after by trippers, skiers and tourists in search of nature and peacefulness. With the inauguration of the Ribes-Núria cog railway in 1931 and the development of new playful activities related to nature, snow and high mountain, the rush of people has not stopped to grow until now. It has to be taken into account that the cog railway is the only motorized way to reach de valley. Vall de Núria and the cog railway track are situated in a high mountain landscape subject to natural dynamics that implies relief evolution. Related with this, a lot of geomorphologic destructive and constructive processes take place Because of morphological and geological features of Vall de Núria, one of the main geodynamical active processes with an associate natural hazard degree are rock falls.
1.2. Previous works
In 1986 the Generalitat de Catalunya became to be in charge of Ribes-Núria cog railway exploitation. Since then, the interest to improve the safety of the track related with rock fall instabilities has been continuous. That’s why for years the public administration FGC (Ferrocarrils de la Generalitat de Catalunya), DGPT (Direcció General de Ports i Transports), GISA (Gestió d’Infrastructures, S.A.) has started several mitigation projects in which RSE Aplicaciones Territoriales, S.A. and ICC (Institut Cartogràfic de Catalunya) have taken part. They have allowed us to develop a work methodology that includes potential instabilities areas detection, classification according to the performance priority and a proposal of the most suitable corrective measure based on each case. RSE is also in charge of building projects design and their direction of works. Dent d’en Rossell is one of the most affected areas by this type of mass movement in the whole valley. It is an extremely steep slope placed on the West side of Vall de Núria around the Fénech railway tunnel (Figure 1). This rocky slope presents high sub vertical walls that attain unevenness of about 300 m.

4th ICA Mountain Cartography Workshop Vall de Núria, Catalonia, Spain. 30th September – 2nd October 2004
2
Figure 1: Situation map of Dent d’en Rossell. The studied area is colored in grey. The cog railway track is the purple line and the green dashed lines are the tunnels of Fénech (to the North) and the tunnel of Navarro (to the South). The topographic base corresponds to 1:5.000 sheet number 289-079 (la Farga) edited by ICC (2001). Lately, several rock falls have occurred in Dent d’en Rossell, which have affected in greater or smaller degree the cog railway track. The most significant events have taken place in October of 1993, March of 1994, may of 1996, August of 1999, March of 2003, April of 2003 and June of 2003. Details of the last three will be enlarged later. To improve studies of hazard and risk assessment has been essential to look for new techniques of study that allow getting better data about the slope and its real morphology. One of the new techniques of study that has been recently incorporated into rock fall areas identification and evaluation tasks at Dent d’en Rossell, is LIDAR (Light Detection and Ranging). The use of this method allows modelling the topographic surface in a very accurate way, obtaining a DEM (Digital Elevation Model) in 2.5D or even 3D (Ruiz et al., 2004). This technique of high precision, has allowed us to develop a specific work methodology for Dent d’en Rossell to estimate the geologic risk over the cog railway related with rock fall instabilities, which would
be impossible to carry out by using conventional topographic modeler.
2. OBJECTIVES
The aim of this work is to analyze the advantages and possible restrictions that could appear in the application of the DEM obtained by LIDAR, in front of other conventional methods used in rock-falling hazard assessment. The determination of geologic risk related with any type of phenomenon must be necessarily deduced from three stages:
1) Detection of potential instabilities areas. 2) Evaluation of hazard, taking into account
the frequency and magnitude of the phenomenon.
3) Reckoning of the vulnerability existing in the studied area.
In the case of rock fall the LIDAR technology can be especially useful in stages 1 and 2.

4th ICA Mountain Cartography Workshop Vall de Núria, Catalonia, Spain. 30th September – 2nd October 2004
3
This paper shows how LIDAR allow us to get better results in rock fall hazard assessment by confronting the results derived form three different DEM of Dent d’en Rossell. The first one has been obtained by photogrammetry from 1:30000 aerial photographies and it has a mesh size of 15 meters. The other two come from the DEM obtained by a combination of terrestrial and airborne LIDAR. They have a mesh size of 8x8 and 2x2 meters respectively (see table 1) This work does not try to deepen in the knowledge of rock fall dynamics in Vall de Núria and neither to evaluate the hazard and risk related with them.
DEM Origin Mesh size
2x2 Mesh LIDAR 2 m
8x8 Mesh LIDAR 8 m
15x15 Mesh 1/5000 topographic base 15 m
Table 1: Scale and origin of DEM used in this survey.
To analyze the results, they will be compared to some of the rock fall events occurred in Dent d’en Rossell on the past year 2003.
3. LIDAR: DATA AND METODOLOGY
3.1. Airborne lidar data
The airborne lidar survey was done on 28th July 2003 and consisted of seven parallel strips with 20% overlap that covered the Núria River valley. These strips had a half scan angle of 7º (setting A in table 2). The almost vertical pointing of view reduced the likelihood of occlusions due to the mountains at the bottom of the canyon. Two additional parallel strips were flown over each side of the river to get more points on the steep slopes of the mountains. These additional two strips had a half scan angle of 20º, the maximum allowed by the instrument (setting B). Setting A B Velocity (knots) 120 120 Half scan angle (degrees) 7 20 Scan frequency (Hz) 35 20 Pulse repetition (Hz) 25,000 25,000 Height above ground (m) 1300 1300 Strip overlap (%) 20 - Ray divergence (mrad) 0.2 0.2 Point distance along track (m) 0.88 1.54 Point distance across track (m) 0.89 1.51 Footprint (m) 0.260 0.260
Table 2: Flight parameter settings.
Last echo airborne lidar points were classified into ground and non-ground points with the help of TerraScan software (Terrasolid, 2004a). A triangulated irregular network (TIN) was computed with TerraModeler (Terrasolid, 2004b) taking into account only the ground points as a first approach to the terrain model.
As most of the computer programs usually used in terrain modeling TerraModeler builds 2.5D surface models. The name 2.5D is applied in computer graphics to those special kinds of surfaces were each point in the horizontal domain has only one corresponding elevation. Therefore, the elevation in these surfaces is a function of the planimetric coordinates (x,y). This surface model is not appropriate to represent overhang areas (figure 2) where a single (x,y) point can have three corresponding elevations.
Figure 2: Transversal section of Lidar points in an overhang.
Usually, after automatic classification some editing is required to remove residual vegetation that the automatic classification has wrongly classified and that has been included in the terrain model. The presence of vegetation in this very steep terrain confused the program very often and an intensive editing work was required. The editing process continued until the resulting 2.5D model was considered to be an acceptable representation of the bare earth surface (without vegetation), within the limitations of 2.5D surface models. This intermediate surface (Figure 3) was employed for two different purposes:
Figure 3: Slope map of the 2.5D surface model. The red arrows show the location of the railway track.

4th ICA Mountain Cartography Workshop Vall de Núria, Catalonia, Spain. 30th September – 2nd October 2004
4
The first one was to detect the areas where the density of aerial data was too low or where data gaps appeared due to occlusions (Figure 4). A terrestrial lidar survey campaign was carried out to cover these areas. The second use of the intermediate 2.5D surface was to improve the orientation of the terrestrial lidar data.
Figure 4: Gaps in aerial lidar data. (Colors according to strip number).
3.2. Terrestrial lidar data
Five sites were selected to station the terrestrial scanner in front of the areas showing important gaps in airborne data. The terrestrial lidar survey took two days, from September 8th to 9th, 2003. Target reflectors were installed and their coordinates were measured with GPS and total station. The known coordinates of the targets allowed for a first approximation to the point cloud orientation of each scan but, as they were closer than the area to measure, the angular accuracy of this orientation was poor. In order to improve this preliminary orientation, surface matching was employed. A grid surface was computed for each terrestrial scan scene and another was computed from the aerial points classified as ground in the 2.5D model. This last surface was considered as the reference surface. The orientation of each terrestrial scan scene was adjusted to match the reference surface obtained from the airborne lidar points. For each terrestrial lidar point cloud a translation and a rotation were computed to minimize the distance between the corresponding scan surface and the reference surface. This processing was done with Polyworks software from the company Innovmetric. Once the orientation of the terrestrial points was refined they had to be classified but the available software was not able to process data in almost vertical walls. The classification algorithm filter assumes that the terrain slope is not too high and those points that increase the surface slope over a certain threshold are supposed to belong to the vegetation. This assumption failed completely in this area. To circumvent this limitation a global rotation was applied to all the lidar points to reduce the average slope of the terrain. The point cloud was rotated 30º around an axis approximately parallel to the railway track. After that, it was possible to add
points to the previous set of ground points by a fast editing procedure using the standard tools available in TerraScan. The amount of available ground points in areas with data gaps increased and the model improved (Figure 5). After the editing, the inverse rotation was applied and a true 3D triangulated surface model was computed with all the points classified as ground.
Figure 5: Gaps covered with terrestrial lidar data.
4. GEOLOGIC AND GEODYNAMIC CONTEXT
4.1. Lithology and structure.
Vall de Núria is in the axial zone of the Pyrenees where the oldest materials of the mountain system outcrop. They are metamorphic rocks that correspond to gneiss of the Carançà unit. The regional geologic structure is strongly affected by both Hercinian orogen and alpine orogen. Orientation and spacing measures of several joints and its statistical treatment have permitted to identify the main discontinuity sets (Rendon, A. 2004). They are shown in Table 3:
Discontinuity set Type Mean
azimuth Mean
slope dip
Mean spacing
(m)
F1 Diaclase 080 65 0.3
F2 Diaclase 020 70 0.4
F3 Foliation 260 30 0.5
Table 3: Mean orientation and mean spacing of the three discontinuity sets detected in the Dent del Rossell (Rendón, A. 2004).
The intrinsic features of metamorphic rocks such as gneiss and the three discontinuity sets of the rocky mass condition the relief morphology of the valley, which is particularly steep in Dent d’en Rossell. The zone is also characterized by structural treads which form terraces and landings of metric order.

4th ICA Mountain Cartography Workshop Vall de Núria, Catalonia, Spain. 30th September – 2nd October 2004
5
4.2. Rock fall risk in Dent d’en Rossell.
Rock fall presents particular features in front of other processes. This type of phenomenon is the result of an evolution process in which a lot of factors take part (lithology, discontinuities, external geodynamic phenomena such as frost shattering and root growth). Every rock fall is unique and takes place suddenly, because it requires very particular conditions to occur. In Dent d’en Rossell, the orientation of some vertical slopes and certain discontinuity sets bring about the existence of potential instabilities areas that can unchain rock fall. The relationships between them generate individualized blocks of a large range of dimensions. The more recent evidences of activity related with rock fall instabilities in Dent d’en Rossell are the ones occurred in March, April and June of 2003.
- 3rd March 2003: The falling of a rock mass of between 5-8 m3 of volume caused several damages to the cover structure of the North entrance of Fénech tunnel and to the cog railway. From the observed evidences the starting point was determined to be one hundred meters above the cog railway. The path tracked by the mass mobilized followed a structural tread until it arrived on top of the cover, where the most of the mobilized mass was deposited (rocks, soil and vegetation). The path continued downhill crossing the Queralbs-Núria route until the Núria River. The maximum volume of the blocks stopped along the path was about 0.5 m3.
Figure 6: Rock fall occurred in 3rd March 2003. In yellow the path followed by the rock fall.
- 4th April 2003: At 5:55 am a rock mass fell of from a vertical slope placed one hundred and twenty meters above the KP 8+500 of the railway track, near Navarro tunnel. The massif in this area is strongly affected by F1 and F2 discontinuities sets. The estimated started volume was about 54 m3, which would be equivalent to 130 tones. The path, which was quite rectilinear, crossed the cog railway track, the Romeu route, and reached the Núria River. The great magnitude of this event used up the whole absorption capacity of the upper three dynamic barriers installed four years ago, which were 6 m tall.. The rock fall caused important damages to the railway track and the wall placed under it. A part of the total mobilized mass stopped on top of the upper terraces of the slope, and behind the dynamic barriers destroyed by it. Some other part stopped on the railway track and the most of it was scattered downhill creating a talus scree beneath the railway track. A little part of all the volume reached the Núria River.
Figure 7: Rock fall occurred in 4th April 2003. In blue the dynamic barriers. In red the upper path of the rock fall. - 15th June 2003: At 11:30 pm a rock fall took place in the talus adjacent to the cog railway track near the South entrance of Fénech tunnel (KP 9+050). The starting zone was placed 8 meters above the track. The rock fall path followed a rectilinear trajectory and crossed the Romeu route. It reached the Núria River. The starting volume was estimated about 17 m3, which would be equivalent to 40 tones. The mobilized mass directly affected the railway platform where about 8 m3 was deposited. The rest of the mobilized mass created a blocks and soil deposit scattered down between the railway track and river, opening a corridor among the forest. The Romeu route got blocked by trees, blocks and soil accumulation.

4th ICA Mountain Cartography Workshop Vall de Núria, Catalonia, Spain. 30th September – 2nd October 2004
6
Figure 8: Rock fall occurred in 15th June 2003. The dashed red lines indicate the sliding surface.
5. LIDAR APPLICATIONS ON HAZARD ASSESSMENT
5.1. Detection of potential instabilities areas
One of the firsts tasks to do in rock fall hazard assessment at Dent d’en Rossell is to identify potential instabilities areas, in which LIDAR technology can contribute to obtain substantially improvements. One of the primary uses of DEM is to analyze the interaction between topographic surface characteristics (relief morphology, slope, orientation, etc.) and structural characteristics of the rocky mass (existence of one or more discontinuity sets, orientation and slope dip of these, etc.). In order to cross this data research software developed by CREALP (Centre de Recherche sur l’Environnement Alpin) has been used. It was developed as a working tool in Matterock Methodology (Rouiller, J.D., Jaboyedoff, M., et al. 1998), which allows locating favorable instabilities areas using a DEM. The main principle this software takes into account is related with the necessary conditions for the orientation and the slope dip of a determinate plane of discontinuity that could trigger a rock fall, depending on the orientation and the slope of the topographic surface. The program considers that every 4 points of the DEM constitute a cell. Between this four points it interpolates
a plane with its own orientation and slope (Rouiller, J.D., 1997), so that the topographic surface is defined by a grid of points with X, Y coordinates and an elevation value equal to the height in meters above see level. In figure 9 there are two examples. In the first one, the relation between topographic surface and the discontinuity set D1 makes improbable the trigger of a rock fall (Figure 9A). The second example shows a quite different relation between both surfaces. In this case, the conditions are favorable to the triggering of a rock fall (Figure 9B).
Figure 9: Examples of non-potential (A) and potential (B) sliding zones in section. L is the spacing between two discontinuities. C: Lambert stereographic projection of possible sliding directions (in red) taking into account the topographic orientation (in green). Modified from Jaboyedoff, M. et al. (2003). By this way, once the data that define the orientation and the slope dip have been introduced, the program analyses the DEM the crossing, cell by cell and assigns to each cell a value of 1 or -1 when the intersection between planes is favorable or unfavorable to the instability. DEM with mesh size 15x15 obtained by conventional methods (Figure 10A) and the rest two obtained by LIDAR (Figures 10B and 10C) have been crossed with structural data. For the slope orientation in Dent d’en Rossell, we only have considered data corresponding to families F1 and F2 due to family F3 plays a despicable roll in the slope stability of this sector.

4th ICA Mountain Cartography Workshop Vall de Núria, Catalonia, Spain. 30th September – 2nd October 2004
7
Figure 10: DTM of Dent d’en Rossell. A: obtained with conventional methods. Grid mesh size 15x15 meters. B and C: lidar DTM with grid mesh size.of 8x8 and 2x2 meters respectively. In red the cog railway, in green Fénech and Navarro tunnels. The results of the crossing are shown in the three following maps, which show favorable zones to instability (Figures 11, 12 and 13). In all of them is represented the addition of the instability areas obtained by crossing DEMs with discontinuity sets F1 and F2, and the starting zone of the rock fall events from March, April and June of 2003.
Figure 11: Instability favorable zones (in orange) obtained by crossing the 15X15 meters mesh size DTM with F1 and F2 discontinuities sets orientation. 1, 2 and 3, represent starting points of rock falls occurred in March, April and June of 2003 respectively.
Figure 12: Instability favorable zones (in orange) obtained by crossing the 8X8 meters mesh size DTM with F1 and F2 discontinuities sets orientation. 1, 2 and 3, represent starting points of rock falls occurred in March, April and June of 2003 respectively.
4th ICA Mountain Cartography Workshop Vall de Núria, Catalonia, Spain. 30th September – 2nd October 2004
8
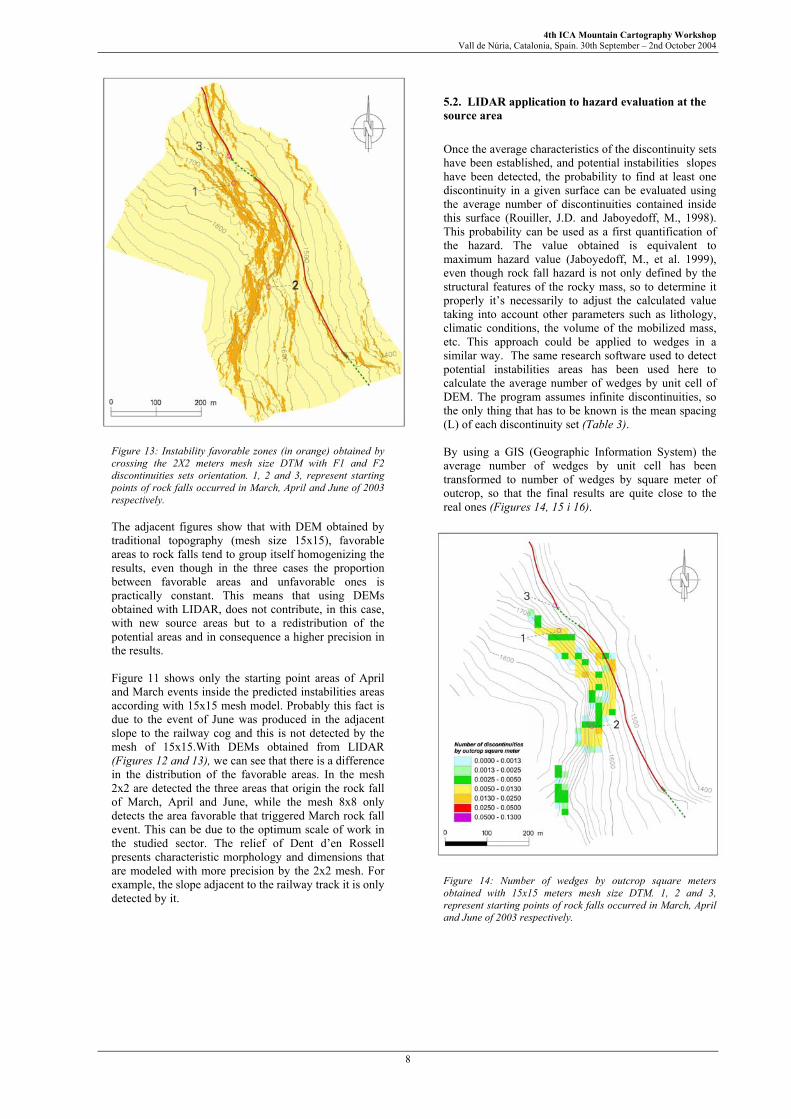
Figure 13: Instability favorable zones (in orange) obtained by crossing the 2X2 meters mesh size DTM with F1 and F2 discontinuities sets orientation. 1, 2 and 3, represent starting points of rock falls occurred in March, April and June of 2003 respectively. The adjacent figures show that with DEM obtained by traditional topography (mesh size 15x15), favorable areas to rock falls tend to group itself homogenizing the results, even though in the three cases the proportion between favorable areas and unfavorable ones is practically constant. This means that using DEMs obtained with LIDAR, does not contribute, in this case, with new source areas but to a redistribution of the potential areas and in consequence a higher precision in the results. Figure 11 shows only the starting point areas of April and March events inside the predicted instabilities areas according with 15x15 mesh model. Probably this fact is due to the event of June was produced in the adjacent slope to the railway cog and this is not detected by the mesh of 15x15.With DEMs obtained from LIDAR (Figures 12 and 13), we can see that there is a difference in the distribution of the favorable areas. In the mesh 2x2 are detected the three areas that origin the rock fall of March, April and June, while the mesh 8x8 only detects the area favorable that triggered March rock fall event. This can be due to the optimum scale of work in the studied sector. The relief of Dent d’en Rossell presents characteristic morphology and dimensions that are modeled with more precision by the 2x2 mesh. For example, the slope adjacent to the railway track it is only detected by it.
5.2. LIDAR application to hazard evaluation at the source area
Once the average characteristics of the discontinuity sets have been established, and potential instabilities slopes have been detected, the probability to find at least one discontinuity in a given surface can be evaluated using the average number of discontinuities contained inside this surface (Rouiller, J.D. and Jaboyedoff, M., 1998). This probability can be used as a first quantification of the hazard. The value obtained is equivalent to maximum hazard value (Jaboyedoff, M., et al. 1999), even though rock fall hazard is not only defined by the structural features of the rocky mass, so to determine it properly it’s necessarily to adjust the calculated value taking into account other parameters such as lithology, climatic conditions, the volume of the mobilized mass, etc. This approach could be applied to wedges in a similar way. The same research software used to detect potential instabilities areas has been used here to calculate the average number of wedges by unit cell of DEM. The program assumes infinite discontinuities, so the only thing that has to be known is the mean spacing (L) of each discontinuity set (Table 3). By using a GIS (Geographic Information System) the average number of wedges by unit cell has been transformed to number of wedges by square meter of outcrop, so that the final results are quite close to the real ones (Figures 14, 15 i 16).
Figure 14: Number of wedges by outcrop square meters obtained with 15x15 meters mesh size DTM. 1, 2 and 3, represent starting points of rock falls occurred in March, April and June of 2003 respectively.

4th ICA Mountain Cartography Workshop Vall de Núria, Catalonia, Spain. 30th September – 2nd October 2004
9
Figure 15: Number of wedges by outcrop square meters obtained with 8x8 meters mesh size DTM. 1, 2 and 3, represent starting points of rock falls occurred in March, April and June of 2003 respectively.
Figure 16: Number of wedges by outcrop square meters obtained with 2x2 meters mesh size DTM. 1, 2 and 3, represent starting points of rock falls occurred in March, April and June of 2003 respectively. In figures 14, 15 and 16 we can see that the number of wedges, which intercept the topographic surface by square meter of outcrop, is slightly higher as the mesh size decreases. This is due to the smoothing of the relief that occurs as the mesh size increases because with a certain orientation of the family sets, the density depends directly on the terrain slope (Figure 17). The mesh size 2x2 reproduces better real slope of sub vertical walls,
while mesh size 15x15 smoothes this relief, reproducing smaller slopes than the real ones.
Figure 17: Relation between topographic slope dip and number of discontinuities intersecting surface. Taking all these facts into account we can conclude that using 15x15 DEM we are underestimating the results in damage of security factor. A comparison between 8x8 and 2x2 DEM shows that the last one reproduces better the topographic surface, so we can expect better results.
5.3. LIDAR application on hazard assessment from rock fall models
5.3.1. Introduction
The objective of this point is to compare the results of rock fall model simulation with three different DEMs.
There are two types of models that can be distinguished by making the calculus in two or three dimension. Three-dimensional models calculate rock fall trajectories on a DEM and allow obtaining the distribution of kinetic energies, maximum bouncing height that the trajectories search and stop points. Bidimensional models work on established topographic profiles and allow obtaining statistical distribution of the same variables along a path.
In this case we have been working with two commercial models in 3D and 2D. These two numerical models have been calibrated and validated with data from rock fall events from 2003.
5.3.2. Rock fall models
Three-dimensional programs allow making numerical calculus from physic laws, which relate mechanical parameters of the slope with the block kinematics. These softwares allow to calculate the distribution of rock trajectories, kinetic energies by unit of mass, bounce height and stop points from a DEM. The programs allows to simulate a high number of rock falls and to identify the most suitable areas to build protection systems.
Types of terrain must be distinguished over the DEM and the parameters that define their mechanical behavior must be defined. These are the coefficient of restitution of normal energy (Rn), the coefficient of restitution of tangential energy (Rt) and the friction coefficient of the rolling boulders (k). It is also necessary to introduce three geometric parameters (limit angles), which determine the

4th ICA Mountain Cartography Workshop Vall de Núria, Catalonia, Spain. 30th September – 2nd October 2004
10
changes in the type of movement along the paths crossing by the rocks. Variation in the slope of the relief and the way the blocks fall upon implies a step between the flying and colliding phases.
Bidimensional model prefix a trajectory of a selected longitudinal profile of the slope, but on the other hand allows doing a completely statistical analysis of the movement variables along its path, as a function of the relief and the parameters with define the type of terrain, similarly to the 3D model. In consequence, the results of both two models are complementary .
Model calibration allows assigning the parameters a value that reproduces the specific behavior of the type of terrain in the studied sector. Once calibrated, the models will be able to predict future events that could happen in this context. In this case, calibration of the model have been possible from three testimonial events that happened on 2003, 3rd of March, 4th of April and 15th of June data (see point 4.1)
5.3.3. Comparative analysis of DEM
Known events from 2003 have been simulated with the three mesh defined previously: 15x15, 8x8, and 2x2, so we can find which topography compares the better with field observations.
In the following figures the results of the events of March and April obtained with three-dimensional models are shown.
Figure 18: Trajectories of April rock fall of 2003, obtained with 3D model with different size of meshes: A 15x15, B: 8x8, C: 2x2.
A
B
C

4th ICA Mountain Cartography Workshop Vall de Núria, Catalonia, Spain. 30th September – 2nd October 2004
11
Figure 19: Trajectories of march rock fall of 2003, obtained with 3D model with different size of meshes: A 15x15, B: 8x8, C: 2x2. In the first results we can appreciate that the trajectories simulated with LIDAR topography show a better adjustment to the channel followed by the rock fall, as can be seen in figure 18 by the sinuous trace of March event. The 15x15 mesh shows more rectilinear paths because it does not detect little variations on the relief that can
deviate the path of the rock falls, as happened with the oblique channel on the Fènech tunnel.
A remarkable result is the increase of the dispersion area as we decrease the mesh size, because of the increment in the terrain relief.
Evidently, as we increase the mesh size, smoother and more simplified is the topography, and in consequence, 15x15 mesh size cannot distinguish so many changes between rolling and flying phases along the rock fall path, in a similar way as Abellán, A. (2003) has observed.
As we can observe in figures 18 and 19, contour lines derived from LIDAR define better the different morphologies, representing boundings and terraces that trajectories find along its way and with a large impact on rock fall dynamics.
This facts are also shown in longitudinal profiles along trajectories from the April event obtained with 3D modelling. In figure 20 we can see how varies the behavior of the rocks in a typical trajectory inform one mesh size to the other.
Figure 20: longitudinal profiles of April 2003 rock fall, obtained by 3D model with different mesh size. A: 15x15, B: 8x8, C: 2x2.
A
B
C
Cog railway track
Cog railway track
Cog railway track

4th ICA Mountain Cartography Workshop Vall de Núria, Catalonia, Spain. 30th September – 2nd October 2004
12
In any case, the path is the same because the model reproduces trajectory dispersion with little variation on initial movement conditions.
The results of the stopping points of the April 2003 event (see figure 22) show few differences between meshes of 15x15 and 8x8, while major precision can be appreciated on the results of 2x2 mesh. The last one presents a concentration of stopping points in zones where blocks were observed in the field, as the railway cog, while the other two only show concentrations in the barriers (Figure 21).
When we work with LIDAR topography there is an improvement on the results precision, but it is also required to choose a convenient mesh size to represent the relief. In this case the wide of the platform of the railway cog is about 4 m and only the 2x2 mesh can represent the platform well enough. In this sense, we tried a simulation with a step of mesh of 1 m and this scale generates a topography with very steep surfaces, which forces the trajectories to bounce continuously with constant oscillations of the slope along the path and generates behavior far away from reality. Moreover, it is an incommodious scale to work with, because it increases the processing time too much.
Figure 21: Picture showing mass stopped by one of the upper barriers in April 2003 event.
Figure 22: Stopped points from April rock fall 2003, obtained with 3D model with different size of meshes. A: 15x15, B: 8x8, C: 2x2.
A
B
C

4th ICA Mountain Cartography Workshop Vall de Núria, Catalonia, Spain. 30th September – 2nd October 2004
13
Next, relevant aspects in the results obtained with bidimesional numerical models are commented.
The event of April 2003 has been simulated, and different bounce height distributions have been detected in a medium slope place from 2x2 and 15x15 meshes (see figure 23). Similarly to the results of 3D model, in the smooth topography of 15x15 dominates the rolling and colliding movement, in difference of the 2x2 mesh, which reproduces higher bounds. The 2x2 mesh adjusts much better the profile of movement variables (height and velocity) along the path, because it describes better the steps on the walls, as it is the closest to the railway cog.
This allows a better placement of defense works against rock fall in points of maximum efficacy. In particular, it is convenient to position barrier defenses (which have a certain capacity of energy absorption) in points of few bounce height and low velocity, so that they will be able to intercept the maximum number of blocks and to brake a larger rocky mass.
When we compare velocity profiles on figure 24 we can observe that in the 15x15 mesh there is an increment on velocity once the railway is passed in contrast with 2x2 mesh. In this last case, the model represented smaller bounding morphologies where the blocks impact on the terrain and looskinetic energy and reduce its velocity.
Figure 23: Results of 2D model: bouncing height at 1560 m of April 2003 event. A: 15x15 mesh profile, B: 2x2 mesh profile.
Figure 24: Results of 2D model: profiles of bouncing height and velocity along the path. A: 15x15 mesh profile, B: 2x2 mesh profile.
Three-dimensional models can be considered a useful tool to predict the distribution of possible trajectories, kinetic energy, bouncing heights and stopping points of rock fall, whenever we have enough historic events to calibrate the model properly. As it has been demonstrated, LIDAR technology allows working over high-resolution topographies. This improves three-dimensional models
utilities in front of the arguments exposed by Krauter & Spang (2001). At a research level, calculus algorithms have been developed to model accurately rock fall dynamics. Even wide spread commercial models present some limitations which difficult taking maximum profit from LIDAR topography. They represent the movement in a very simplified way and the results are often extreme and mean values. The resolution LIDAR topography attains, allows to think that new statistical treatment techniques in a cell by cell basis would be more useful in the near future.
6. CONCLUSIONS AND RECOMMENDATIONS
• Incorporation of LIDAR technology in the study of rock fall allows putting in practice an specific analysis methodology of susceptibility and hazard areas. This was not possible with conventional topographies.
• The DEM obtained with conventional methods, with a 15 m mesh size, in difference on DEM obtained with LIDAR, smoothes the relief too much an this yields to very different results that reduce the security factor in potential instabilities areas detection. The calculus on LIDAR topography reproduces better the rock fall events and detects more accurately potential instabilities areas.
• Starting from LIDAR topography, the working scale has a large impact in modelling results. In case of Dent d’en Rossell, results obtained with a DEM of 2x2 mesh, are the ones who fit better to the observed events in this sector. In a different area the ideal mesh size could be another.
• Commercial rock fall simulation models can reproduce quite well the rock fall events, whenever parameters can be correctly calibrated with enough data from known events.
• Three-dimensional models are a useful tool to predict the distribution of trajectories, velocities and heights of future rock falls. Even though, they have limitations that difficult taking the maximum profit from LIDAR topography.
0
10
20
30
40
50
0 31 63 95 126 158 190
Max
imum
Vel
ocity
(m/s
ec)
0
10
20
30
40
0 31 63 95 126 158 190 Max
imum
Bou
nce
Hei
ght (
m)
Horizontal Distance Along Slope (m)
Horizontal Distance Along Slope (m)
Max
imum
Vel
ocity
(m/s
ec)
0
10
20
30
40
50
0 31 62 93 124 155 187Horizontal Distance Along Slope (m)
Max
imum
Bou
nce
Hei
ght (
m)
0
5
10
15
20
25
0 31 62 93 124 155 187
Bounce Height (m)
Freq
uenc
y
0
50
100
150
200
0 2 4 6 8 10
B
Bounce Height (m)
Freq
uenc
y
0
100
200
300
400
0 2 4 6 8 10
A
Horizontal Distance Along Slope (m)
A
B

4th ICA Mountain Cartography Workshop Vall de Núria, Catalonia, Spain. 30th September – 2nd October 2004
14
REFERENCES
ABELLÁN, A., 2003. Utilización y validación de un modelo de simulación en 3D para el cálculo de la peligrosidad residual por caídas de rocas sobre el tren cremallera de Vall de Núria. Final first degree of Geologic Engineering. Universitat de Barcelona. AGLIARDI, F. and CROSTA, G.B., 2003. High resolution three-dimensional numerical modeling of rock falls. Int. J. Rock Mech. Min. Sci. 40/4, pp. 455-471. JABOYEDOFF, M., BAILLIFARD, F., KAUFMANN, J.F., LABIOSE, V. 2003. Identification des versants rocheux potentiellement instables. Quanterra short course 03-F, pp.27. JABOYEDOFF, M., BAILLIFARD, F., MARRO, C., PHILIPPOSSIAN, F. and ROUILLER, J.D., 1999. Detection of rock instabilities: Matterock methodology. Joint Japan-Swiss Scientific on Impact Load by Rock falls and design of protection structures. Kanazawa, Japan 4-7 October 1999, pp. 37-43. KRAUTER, E. and SPANG, R.M., 2001. Rock fall simulation – A State of the art tool for risk assessment and dimensioning of rock fall barriers. International Conference of Landslides; Causes, Impacts and Countermeasures, Davos, Switzerland (17-21 June 2001), pp. 607-615. RENDON, A. 2004 Evaluación de la peligrosidad geológica por desprendimiento de rocas en Vall de Núria, Pirineos Orientales. Earth Sciences PhD Thesis , Universitat de Barcelona. ROUILLER, J.D., JABOYEDOFF, M., et al. 1998. Pentes instables dans le Pennique valaisan. Matterock: une méthodologie d’auscultacion des falaises et de détection des éboulements majeurs potentiels. Vdf Hochschulverlag, Zurich, pp. 239. ROUILLER, J.D., MARRO, C., 1997. Application de la méthodologie “MATTEROCK” à l’évaluation du danger lié aux falaises. Eclogae Geologicae Helvetiae 90, pp. 393-399. RUIZ A., KORNUS, W., TALAYA, J., COLOMER, J.L., 2004. Terrain Modelling in an Extremely Sep Mountain: A Combination of Airborne and Terrestrial LIDAR. IASPRS 36(3), pp. 281-284.